Summary of Color Field Usage Scenarios: Grouped Line Chart
Overall overview of card color settings:
Card colors can be configured in two places: 1. theme colors; 2. the field area Color.
- As shown below, when there is no field in the Color area, the chart is colored according to the theme colors. Adjusting color settings under Theme/Color changes the chart colors accordingly.
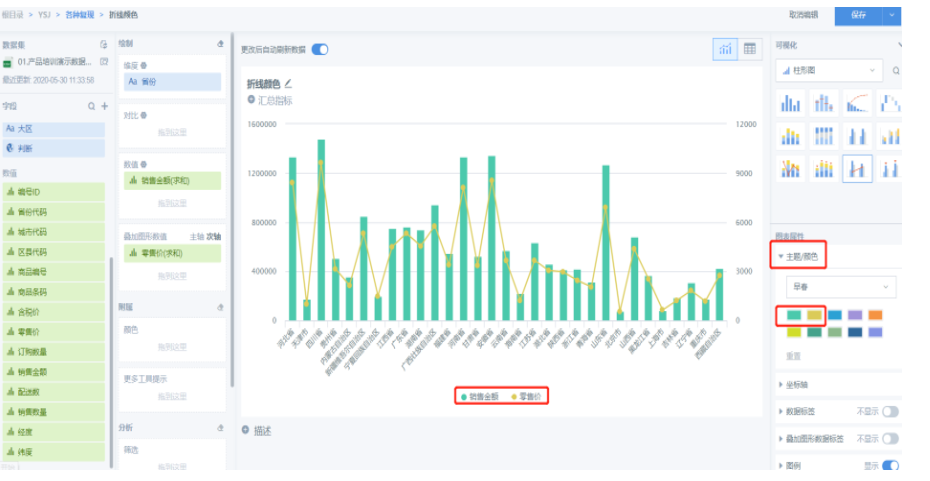
- When a field is dragged into the Color area, the theme color for the value field, such as Sales Amount here, becomes invalid:
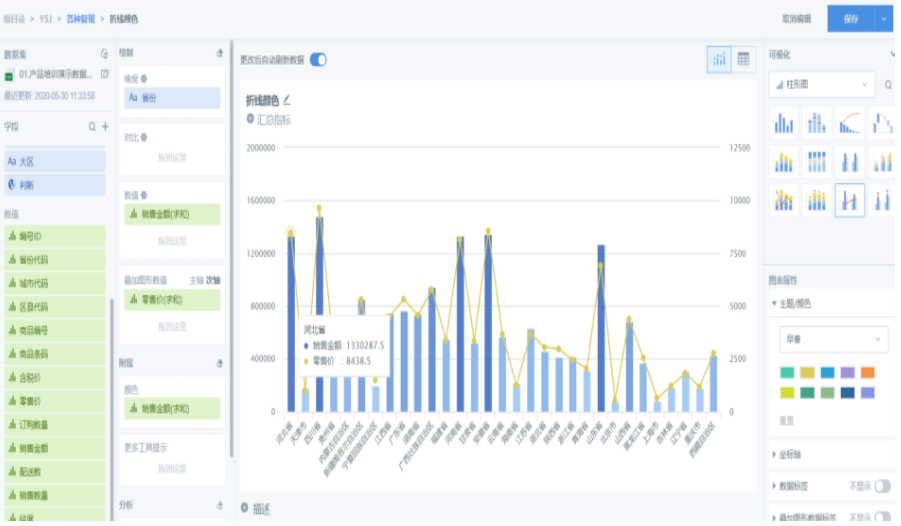
At this point, the settings in the Color area take effect for the color of the value field. You can configure the color of the column chart here:
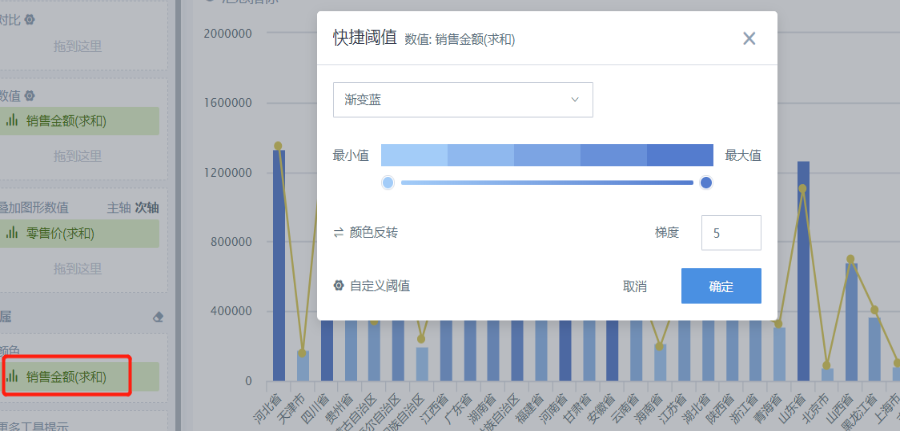
Specific usage scenarios:
Scenario 1:
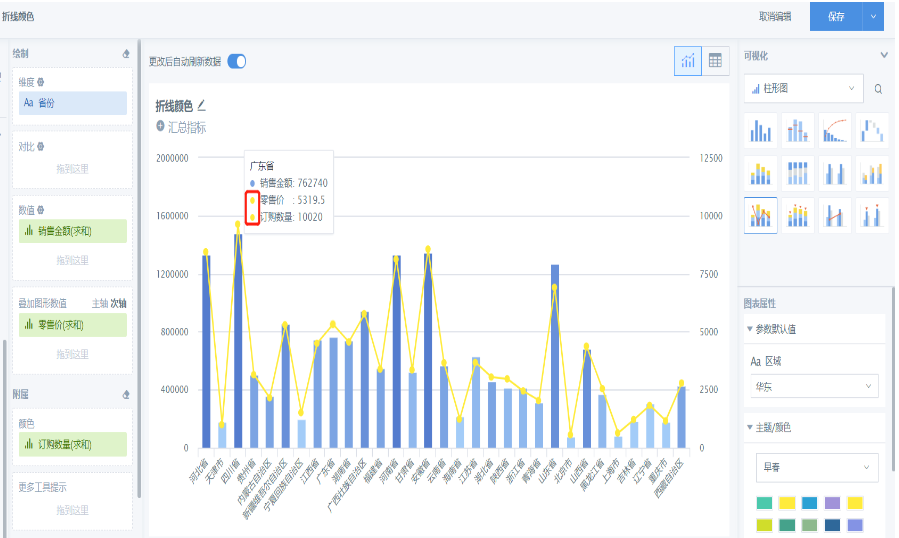
After dragging another value field that is not a value dimension into the Color area, the color of the overlay graphic, the line, is the same as the color of the Color field. How can the line color be configured separately?
Solution:
We do not recommend placing fields that are not value dimensions into the Color area unless required by a special scenario.
The correct usage is described above: drag fields from value fields into the Color area to configure colors.
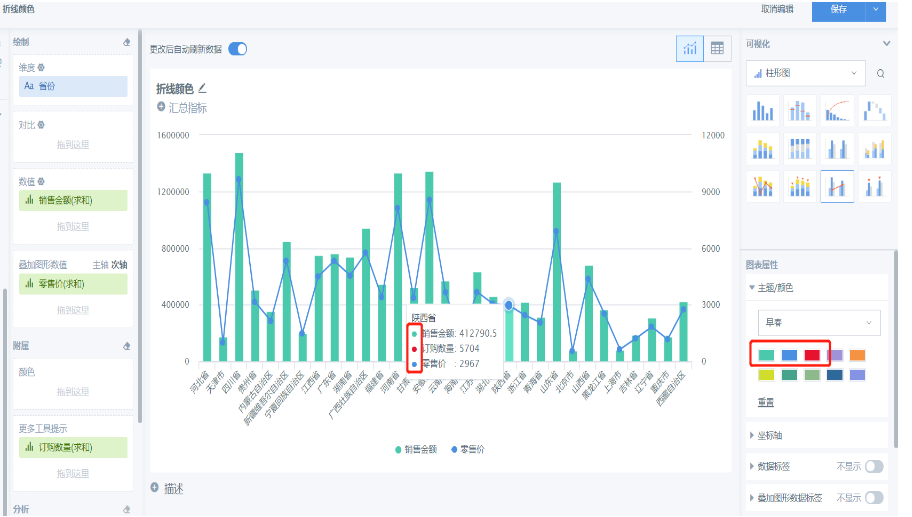
If you want to configure the line color separately and distinguish it from the color displayed by the attached field icon, place the field in More Tooltips. At this point, you can see that the three fields have different colors, corresponding to the first three theme colors:
Scenario 2:
Use a non-value dimension text field to set column chart colors, highlighting specific columns.
Solution:
Drag the text field, usually a dimension field or a field related to a dimension field, into the Color area and configure colors.
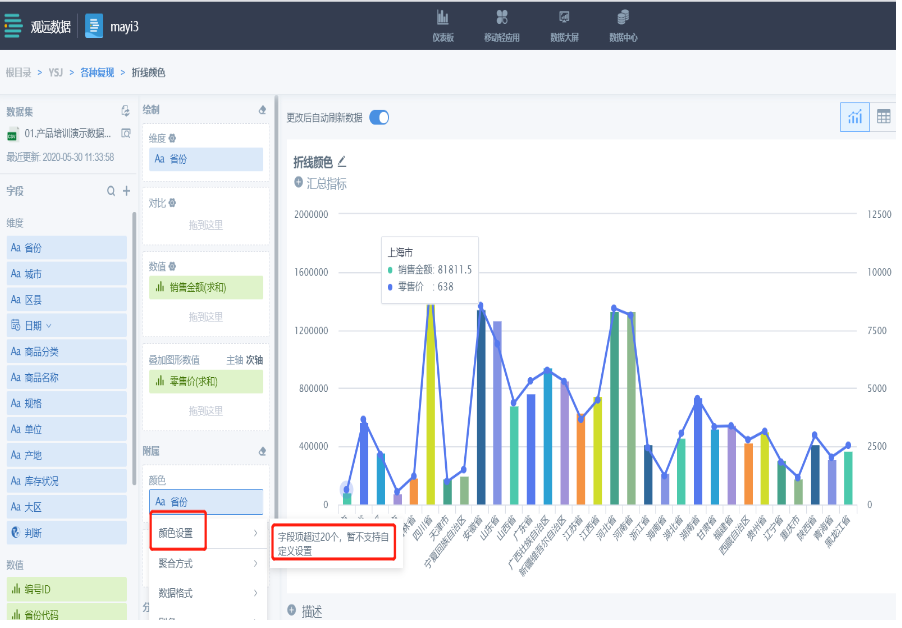
- Set colors for a dimension field by dragging the dimension field directly into the Color field. Note that color settings currently support only 20 field items. More than 20 items cannot be configured:
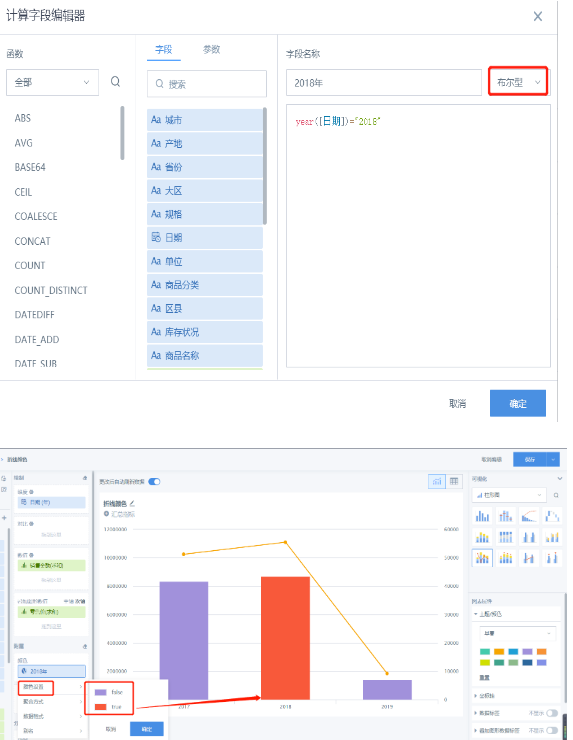
- Use a judgment field, Boolean type, to set colors for specific columns. You can use a regular formula, or use parameters to achieve a dynamic display effect:
① Regular formula implementation: