Grouped Stacked Chart Example
Effect
Introduction
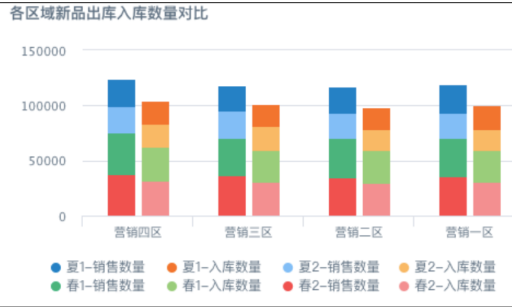
A grouped stacked chart combines grouped charts and stacked charts.
Data Structure
Fields: n categorical fields and n continuous fields. We recommend n <= 3.
Data: categorical fields have hierarchical relationships, such as major category and subcategory. Continuous fields can form a whole, for example, key users and ordinary users together form total users.
Use Cases
Compare the size of the same category across different groups, compare the size of different categories within the same group, and observe the composition size of categories within a group at the same time.
Drawing Area Recommendation
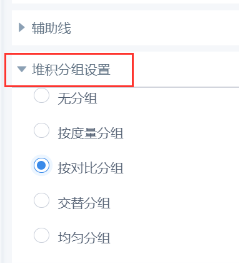
● After dragging fields into the drawing area, you can set the grouping method in chart properties in the lower-right corner.