Funnel Chart Usage and Scenarios
Background
Funnel charts are suitable for process analysis where business processes are relatively standardized, long-cycle, and multi-stage. By comparing business data across funnel stages, they help users intuitively identify and explain problems.
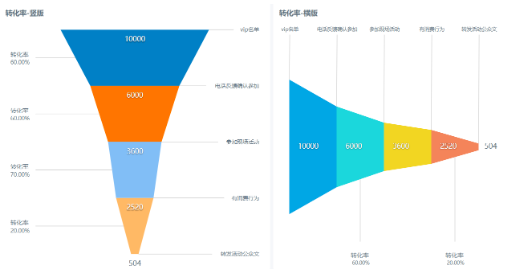
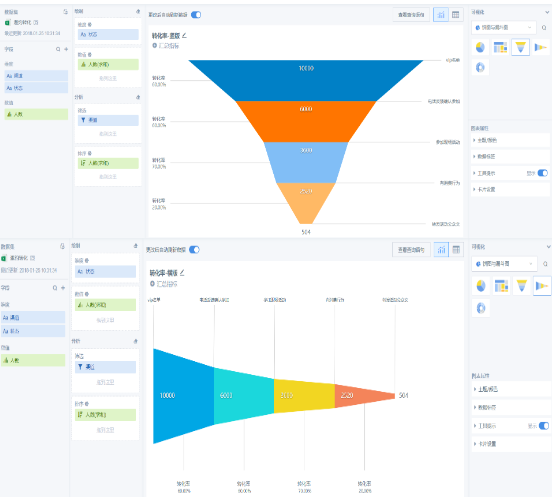
Vertical and horizontal funnel charts are currently supported. Except for funnel direction, all other settings are the same. Choose the appropriate type based on the actual scenario.
Usage
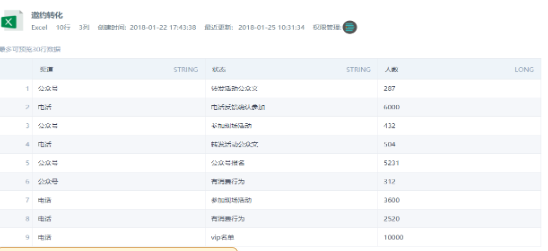
- Prepare the data source to be displayed. Refer to the following example:
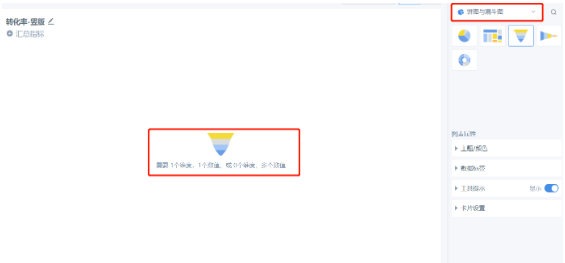
- Select the chart type Pie and Funnel Chart. It requires either one dimension and one value, or zero dimensions and multiple values.
Follow the suggested visualization drawing prompts and drag the corresponding dimensions and values into the drawing area.
Note that if you drag in one dimension and one value, and then drag in another value, the dimension field disappears automatically.
- Drag in dimension and value fields. Configure filters, sorting, and other settings based on the actual scenario.
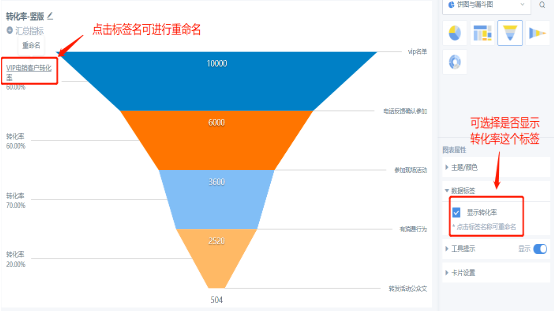
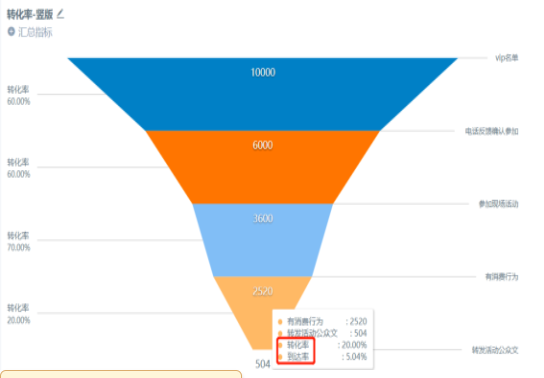
- Explanation of conversion rate and arrival rate:
Conversion rate = number of people in the current stage / number of people in the previous stage. For example, the conversion rate in the figure below is 20% = 504 / 2520.
Arrival rate = number of people in the current stage / number of people in the first stage. For example, the arrival rate in the figure below is 5.04% = 504 / 10000.
- Conversion rate names can be modified: