Detailed Guide to Using the R Property
Comparison of Three Parent Cell (Context) Types
| Parent Cell | Priority | Functional Characteristics | Advantages | Disadvantages |
| C property | High | Two parent cells can be set (one on the left and one above). When multiple dimensions are adjacent, they can be inherited. | The parent-child relationship is simple and clear. | Must be set one by one, which is cumbersome when there are many cells. |
| Default parent cell | Medium | The template cells immediately to the left and above automatically become parent cells. | Takes effect automatically, convenient and efficient. | Small coverage range and easy to overlook. |
| R property | Low | 1. Range supports nesting (complete containment). 2. Ranges of cells with the same expansion direction cannot intersect. 3. If a cell is located in multiple ranges, the ranges are divided into two groups by direction, and the smallest range in each group takes effect for it. | Applying it only to some header cells can achieve the effect of batch parent-cell settings, making it efficient. | Be careful with conflicts when ranges intersect in complex ways. Its priority is low, so it is not recommended to mix it with the C property. |
Scenarios Suitable for the R Property
Use the R property when many cells need parent-cell settings, or when child cells are to the left of or above the parent cell and cannot be implemented with the C property.
Case 1: Loop-Style Report
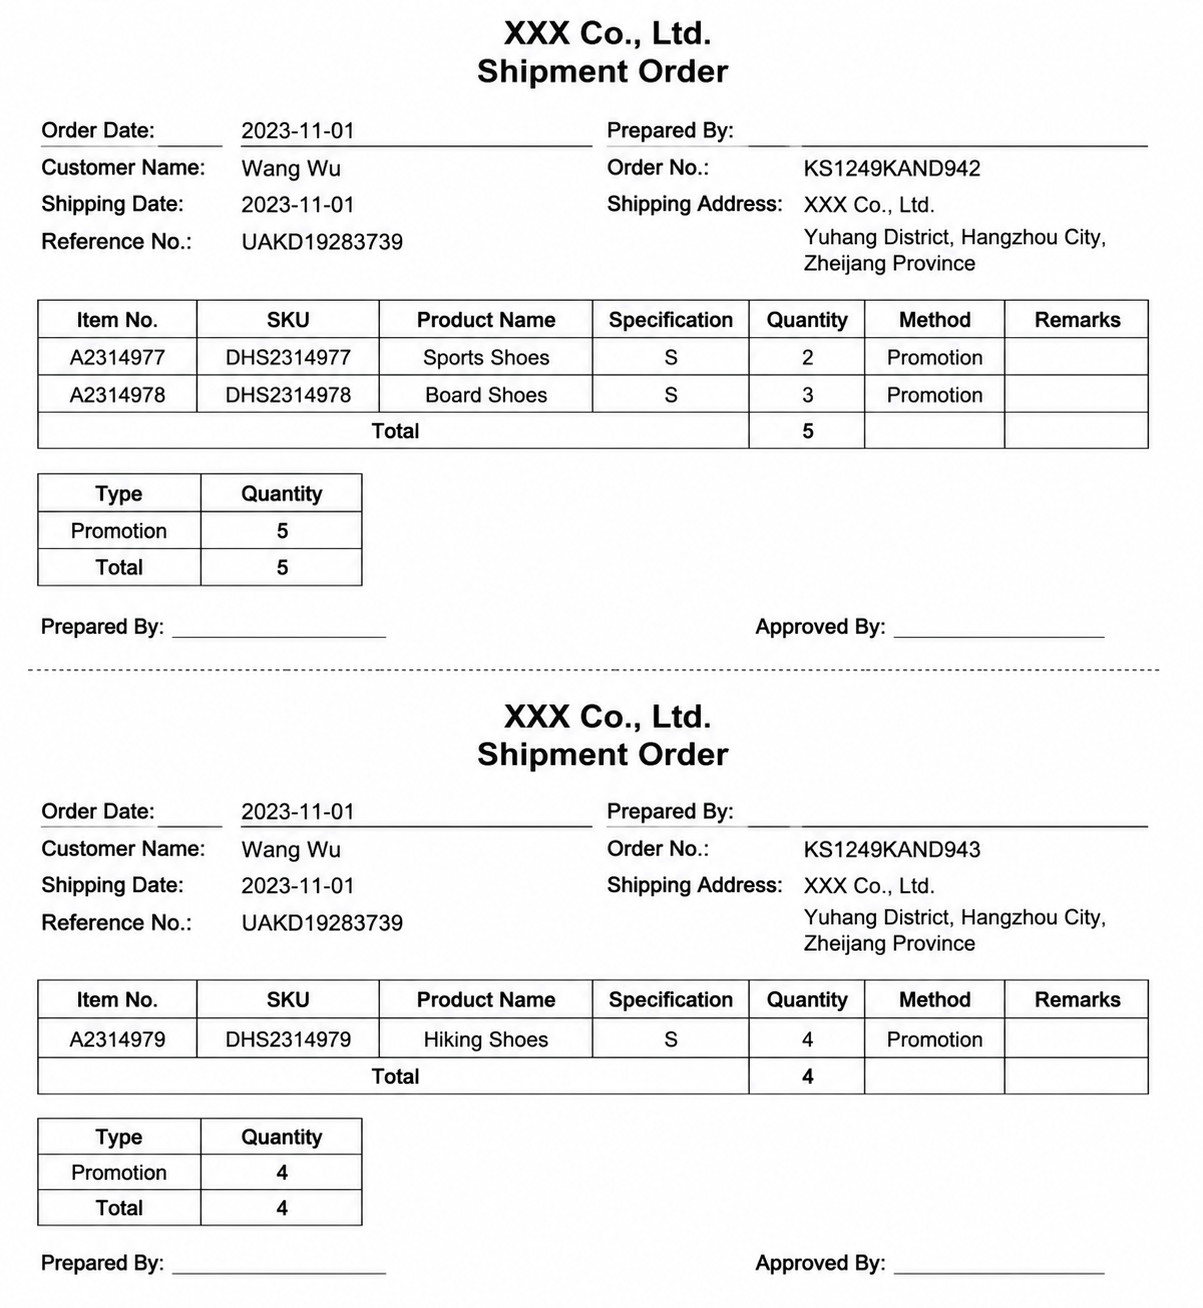
Scenario: The primary key is "Order No.", meaning that one delivery order is generated for each order number. Each order may contain multiple item numbers, with each item number displayed as one row of data.
Expected Effect:
C Property Approach
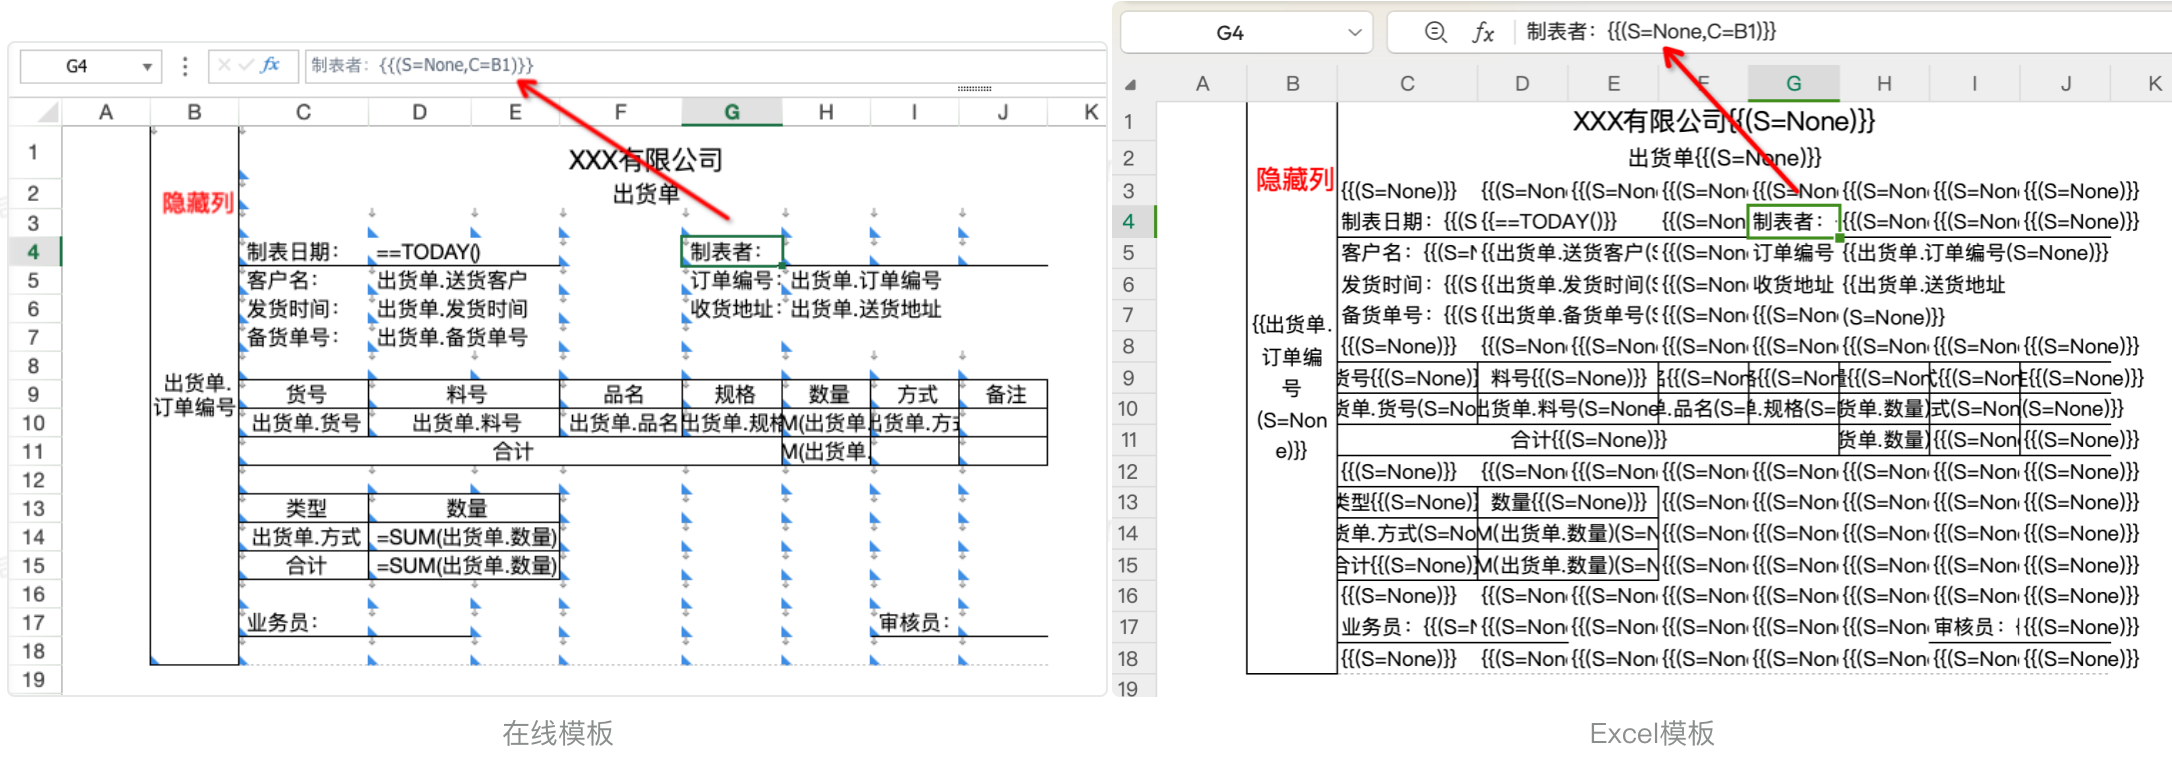
The primary key "Order No." is positioned toward the right. If the cells before and above it use the C property to set parent cells, preview reports an error and the report cannot be saved. The only way to implement this is to insert a hidden column at the front, drag "Order No." into this column as the parent cell, and then convert all cells in the subsequent form range (including blank cells) into template cells and set their parent cells. The implementation steps are cumbersome and settings are easy to miss.
R Property Approach
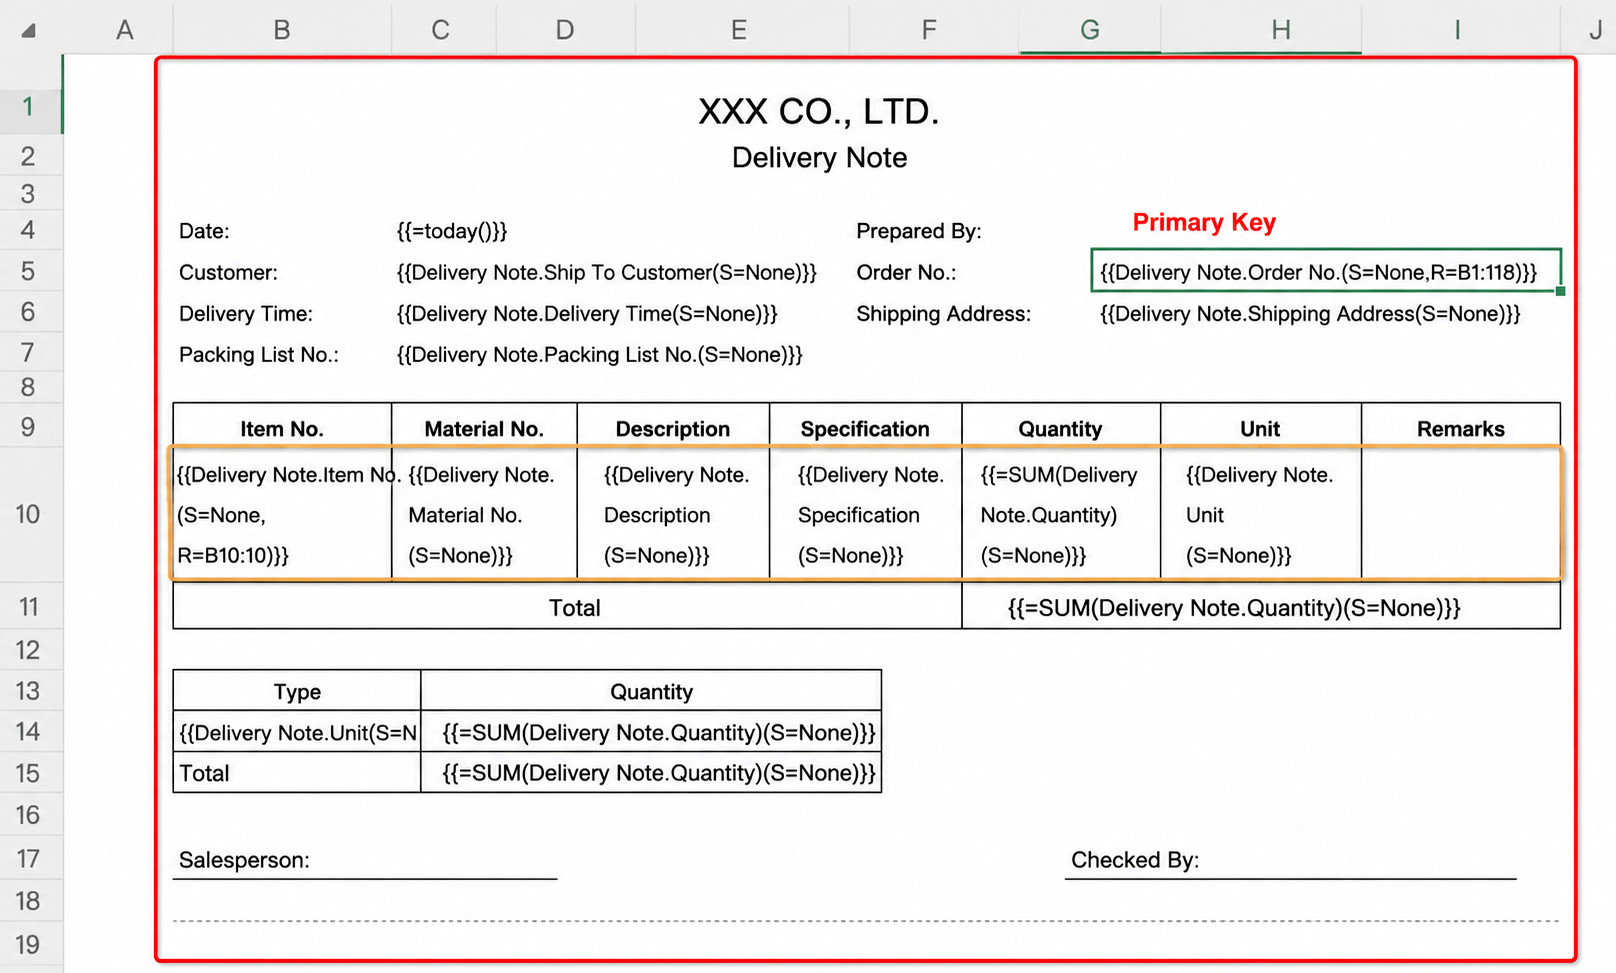
Static headers + dragged view fields + R properties set on 2 cells (2 nested ranges).
Case 2: Spliced Report
Scenario: Data with different dimensions or granularities, or different metrics, are spliced into one table, while both vertical and horizontal expansion are required.
Expected Effect:
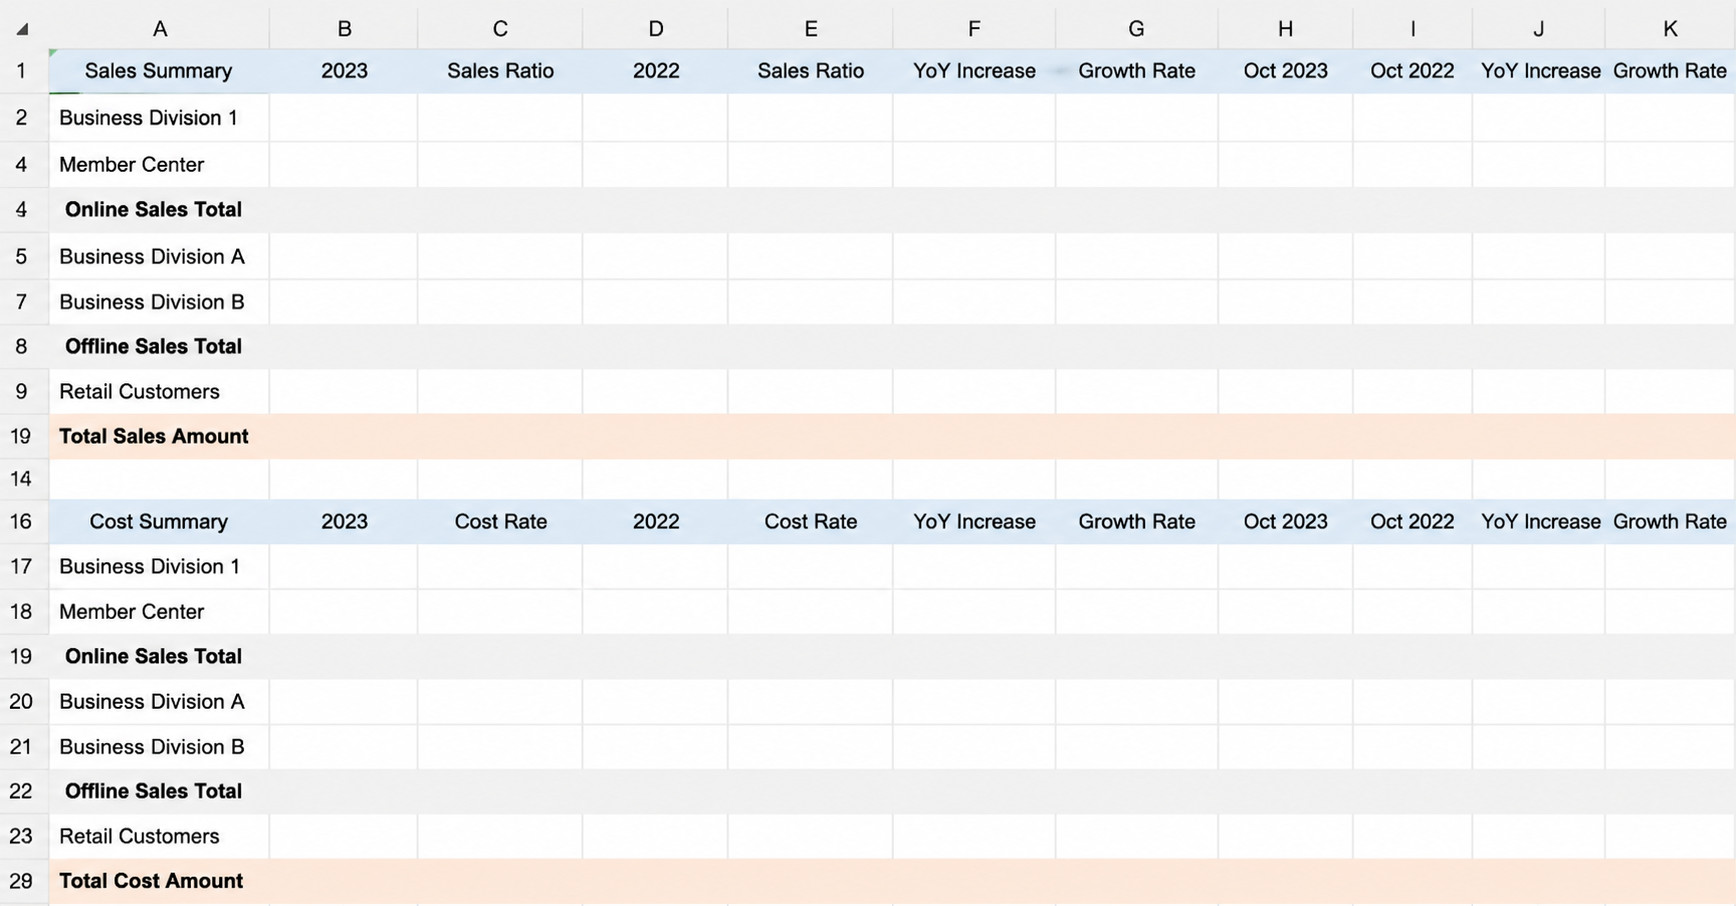
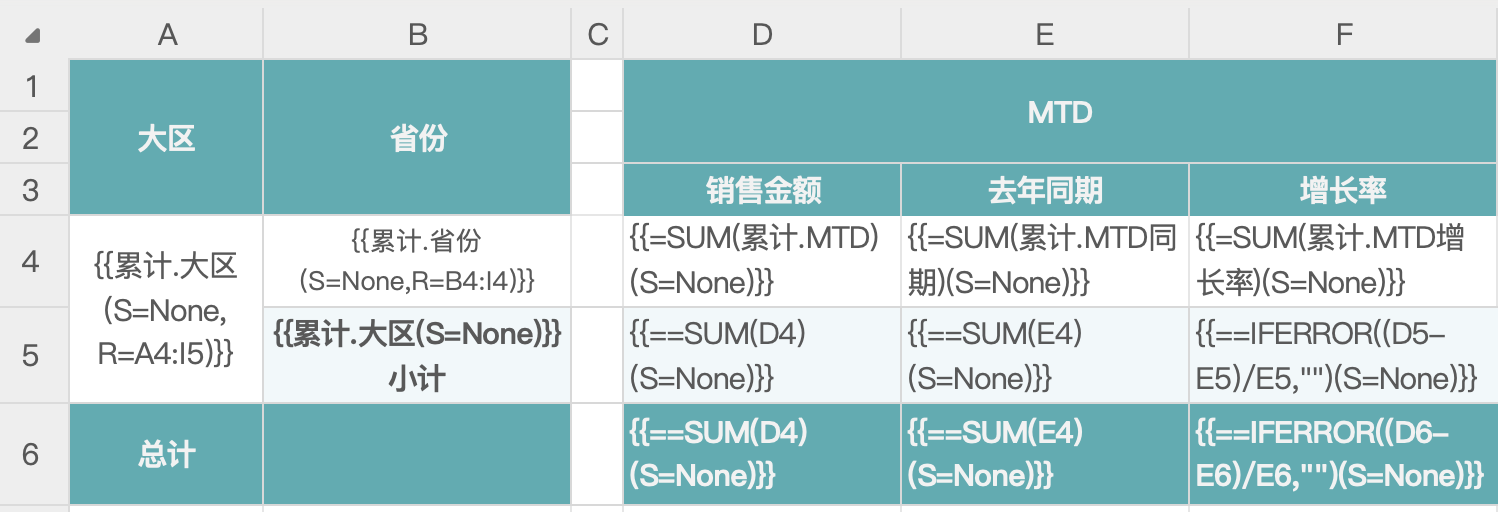
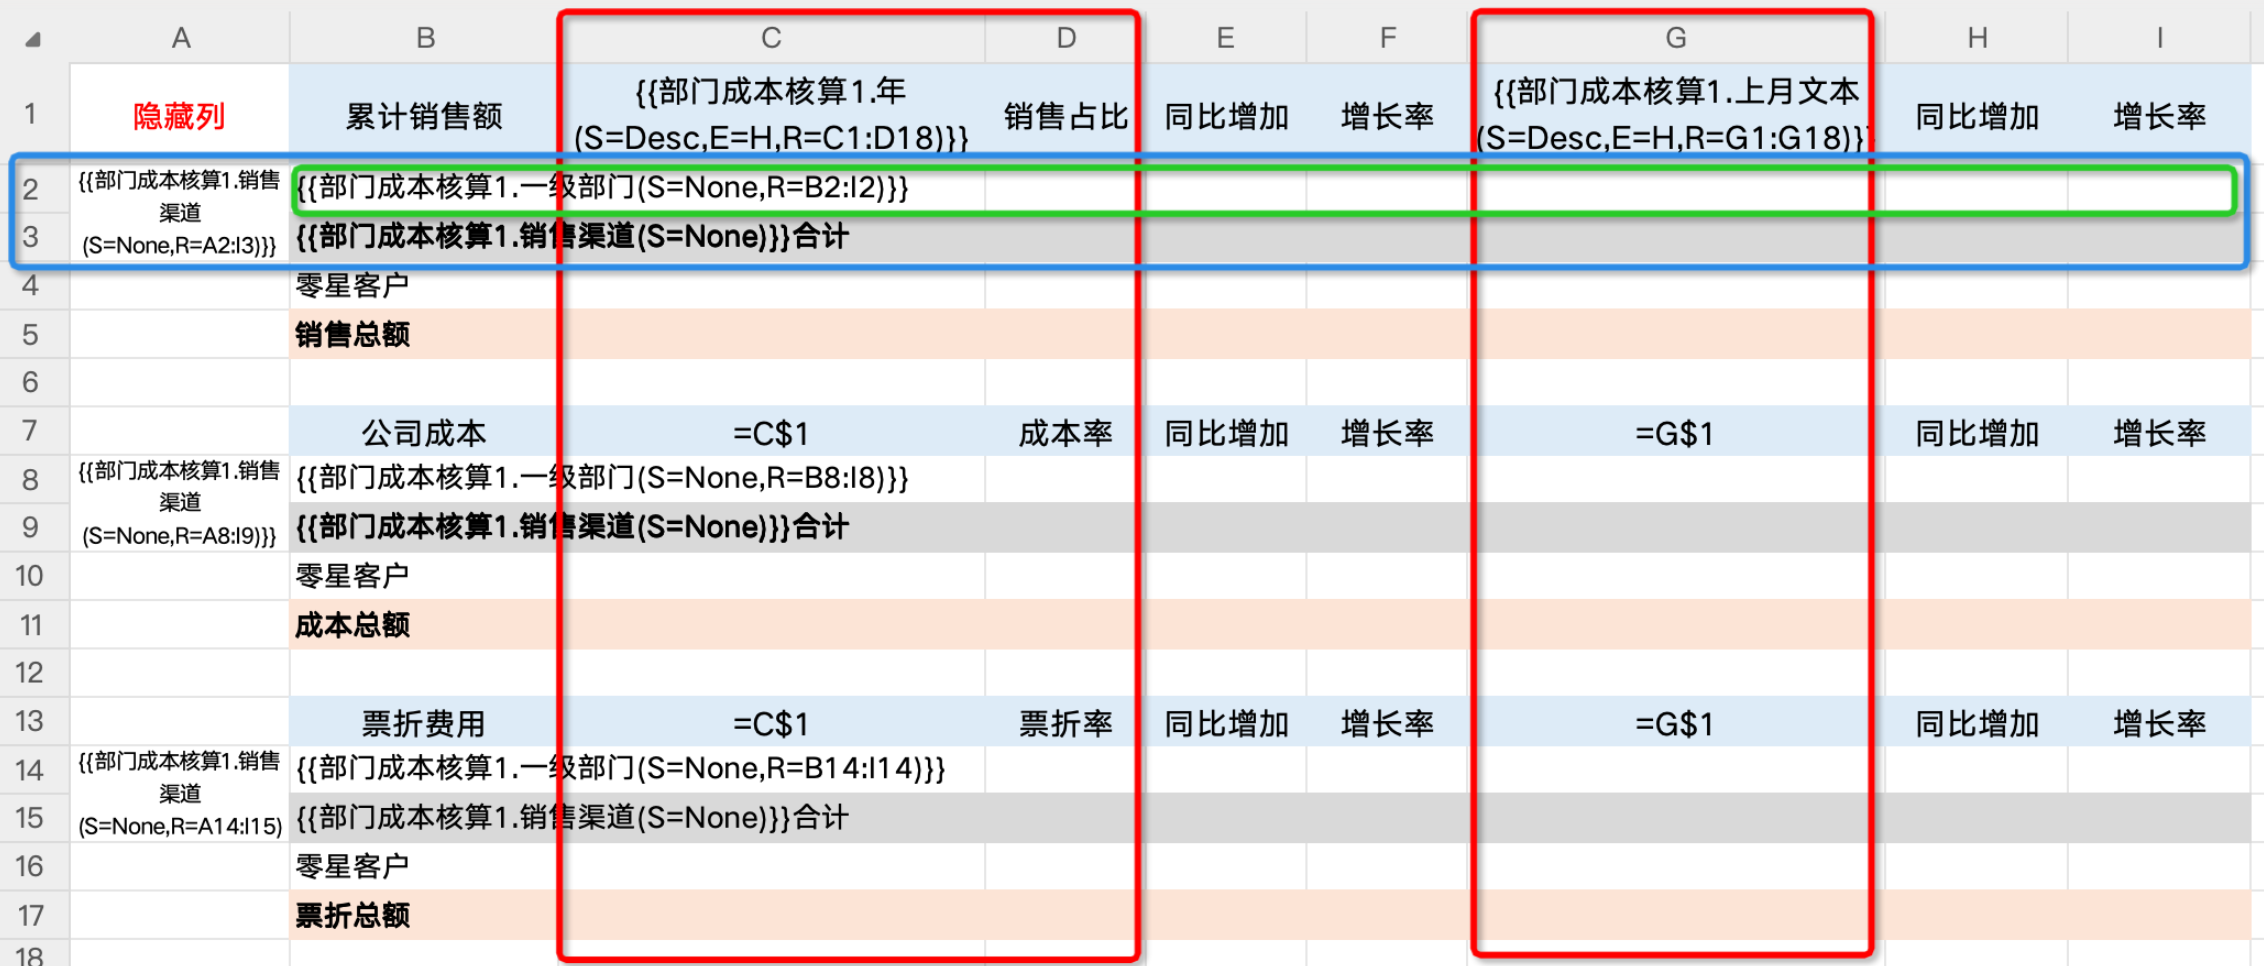
The entire table occupies many cells. Whether using the C property for dynamic expansion or using static text headers plus Excel formulas for filling, the manual workload is large and efficiency is low. Using the R property to batch define child cells greatly improves efficiency, and all metric-type child cells do not need dynamic properties.
Reference R Property Configuration
Notes
1. Both the C property and the R property can only take effect for fields from the same view. However, Excel functions are strictly inter-cell calculations and have no direct relationship with any view. Therefore, the two parent cells of an Excel function can come from different views, or can be located in the intersection range of two views.
2. The R property has lower priority than the C property and default parent cells, so the R property does not take effect when they are mixed. Mixing them is not recommended. However, default parent cells are difficult to avoid. In this case, insert blank hidden rows or columns to ensure that the R property takes effect.
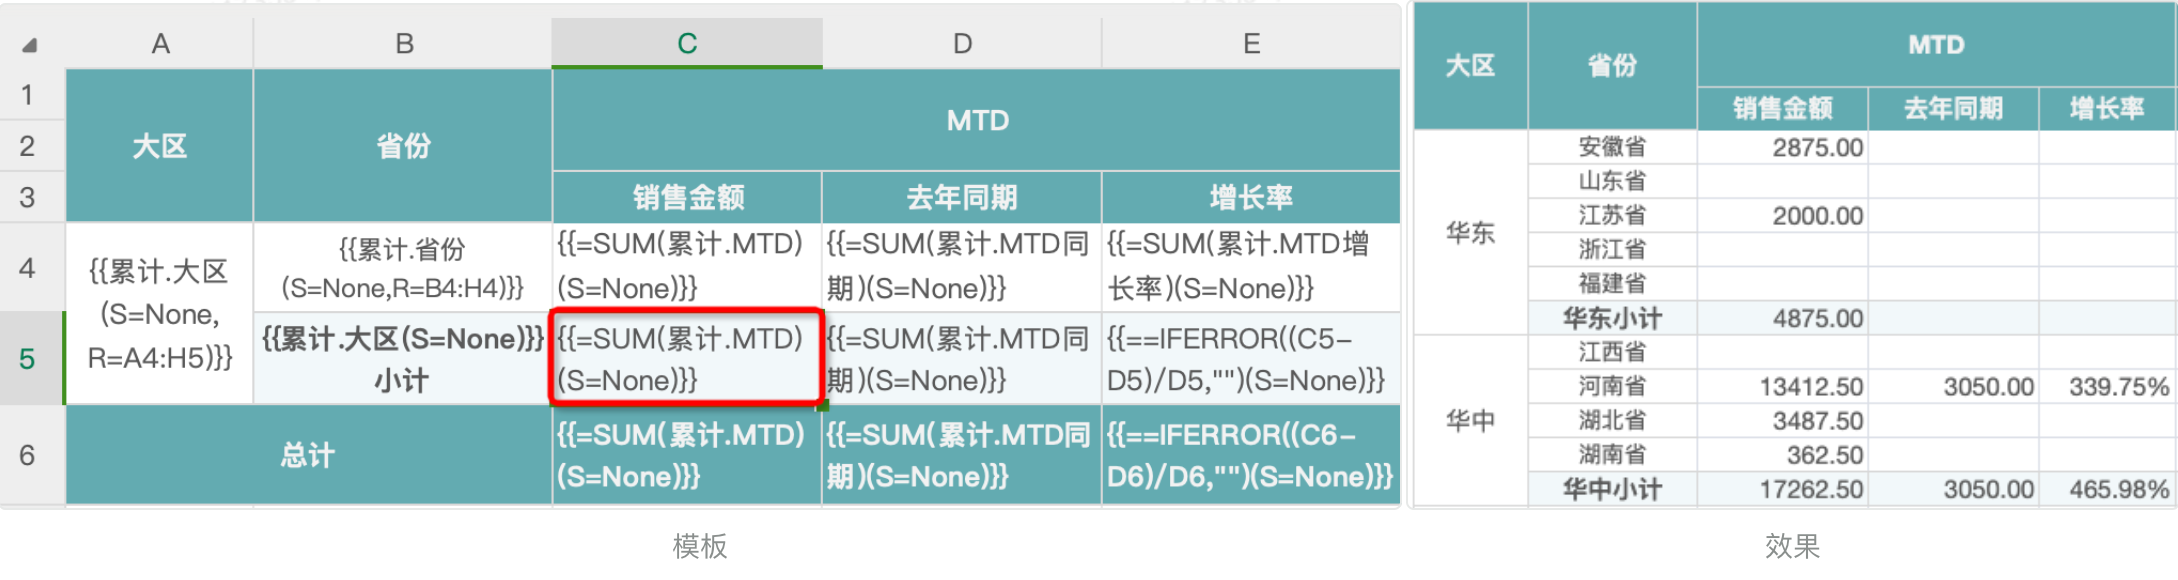
In the figure below, C5 calculates the regional sales amount subtotal. Although it is within the R range set by A4, B5 on the left is also a template cell, so B5 actually takes effect first as the default parent cell. When C5 is filled with a view field, both A4 and B5 are regions and participate in the calculation as filter conditions. The obtained sum results are correct, as shown below.
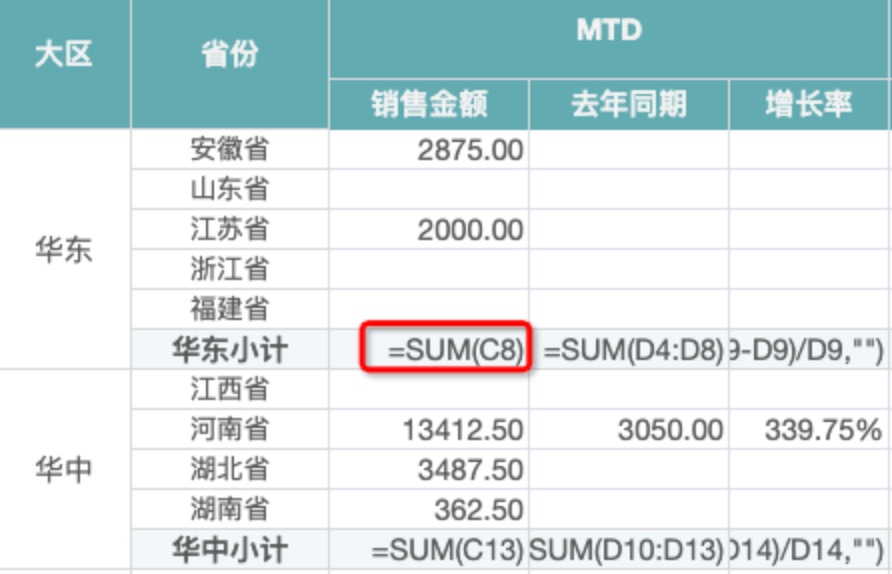
However, when C5 and D5 are filled with Excel functions and then converted into template cells, preview shows that the expanded calculation result of C5 is incorrect, while the data in D5 is correct. Why does this happen?
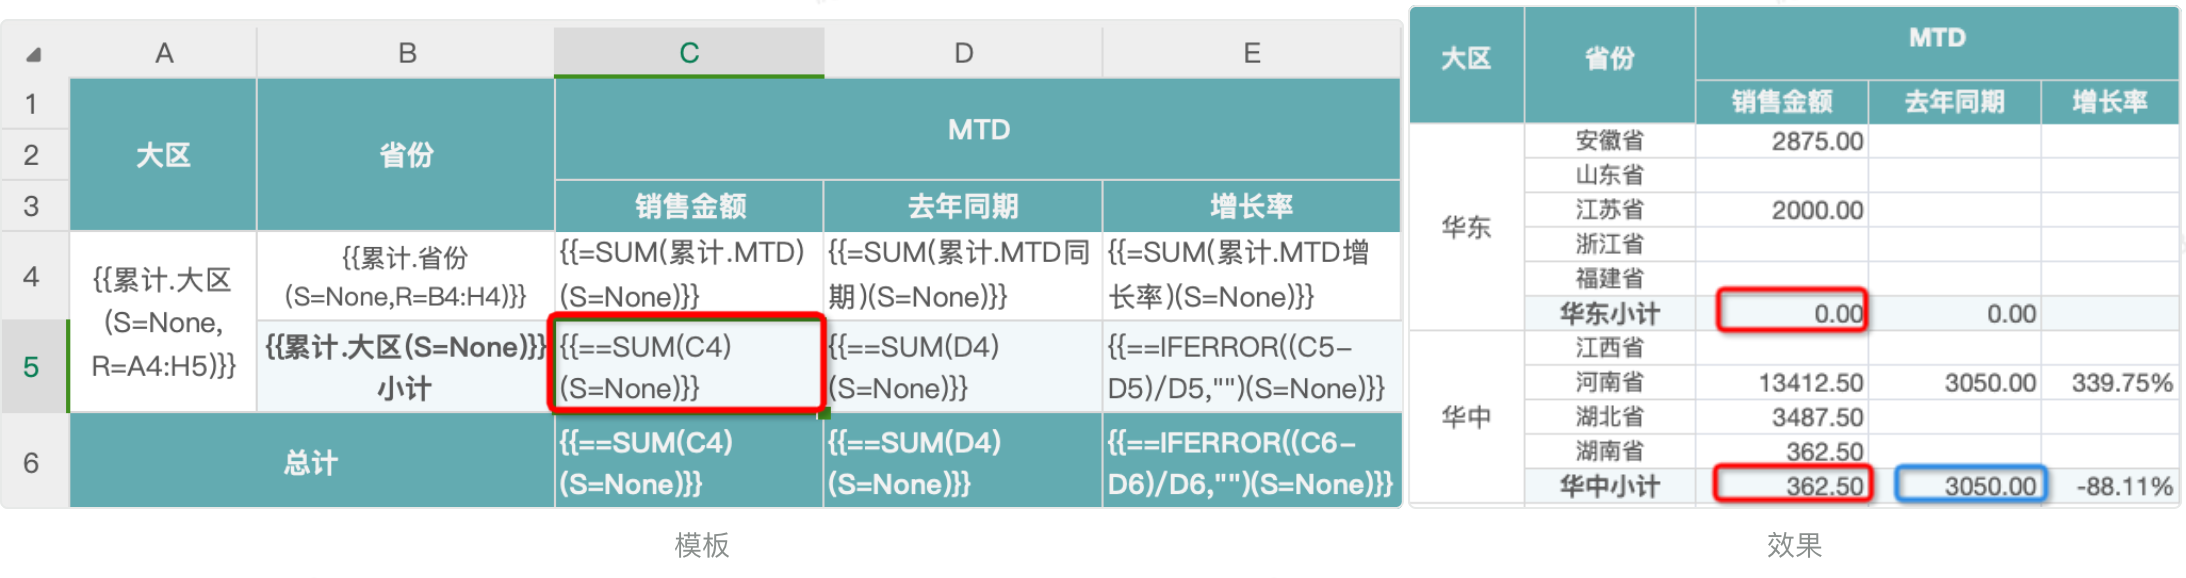
Use the "Show Formulas" feature to check. You will find that C5 only sums the cell above it, while D5 sums the dynamic range expanded by the provinces above it. This is because parent cells play two roles for view fields: following and filtering. However, for Excel formulas or expressions, they only provide following behavior. In other words, parent cells can only drive child cells to expand dynamically and do not participate in calculations. Here, B5 acts on C5 as the default parent cell, while A4 acts on D5 as the parent cell: when B5 expands by one row, C5 calculates only one row. But A4 is a merged cell that covers the province expansion range, so all data expanded by province participates in the calculation.
Solution:
Use fields from the view as much as possible. If Excel functions must be used, insert a blank column between the dimension fields and metric fields (after column B). This invalidates the default parent cell and allows the R property to take effect. Finally, hide the blank column. Similarly, if the default parent cell in a horizontal header prevents the R property from taking effect, insert a hidden row to solve it.
In version 6.0 and later, after rows or columns are inserted, the R range and the cell positions in inter-cell calculations are automatically updated. In versions earlier than 6.0, you need to manually adjust the R range and the cell positions in inter-cell calculations.