Use Same-Row Comparison to Display Data After a Selected Month
Background
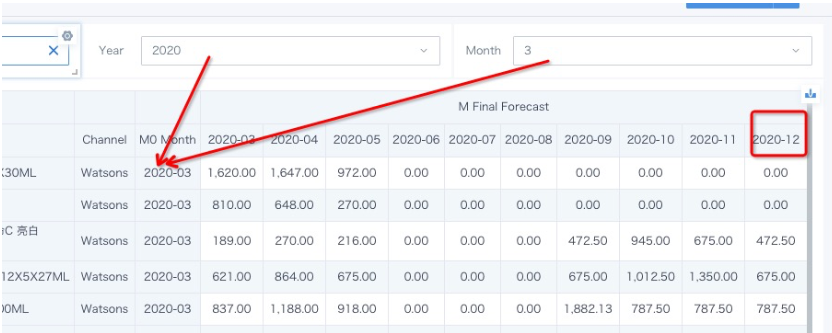
A table contains the fields "FG code", "Channel", "Year&Month", and "Sellin". The primary key consists of FG code, Channel, and Year&Month. The requirement is to display the value of "Sellin" and use a filter to control the display start time, M0 Month, while the display end time is always 2020-12.
Effect
Implementation Idea
- This type of table is suitable for display with the Comparison feature.
- However, because there is only one time dimension, Year&Month, another time dimension, M Year&Month, must be added as the column used for comparison.
Implementation
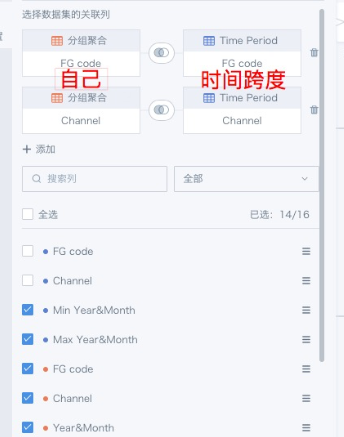
- In ETL, use group aggregation to calculate the Sellin time span for each product determined by FG code and Channel.
This prevents too many dimensions from being added. For example, if one product has been sold since 1900 while other products started selling only this year, there is no need to add time dimensions from 1900 to the present for the products that started selling this year.

- Add the time span fields Min Year&Month and Max Year&Month by joining the table with its own time span.
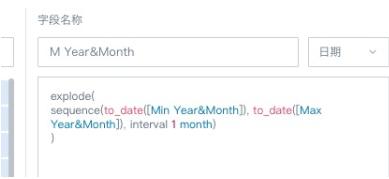
- Add the time field used for comparison, and use a function to automatically complete the calendar.
Max Year&Month can be changed to the end time you need. In this example, Max Year&Month is equal to 2020-12, so it is not changed.
Tip: In explode(sequence([start date], [end data], interval 1 month)), interval 1 month can also be replaced with interval 1 week, and so on.
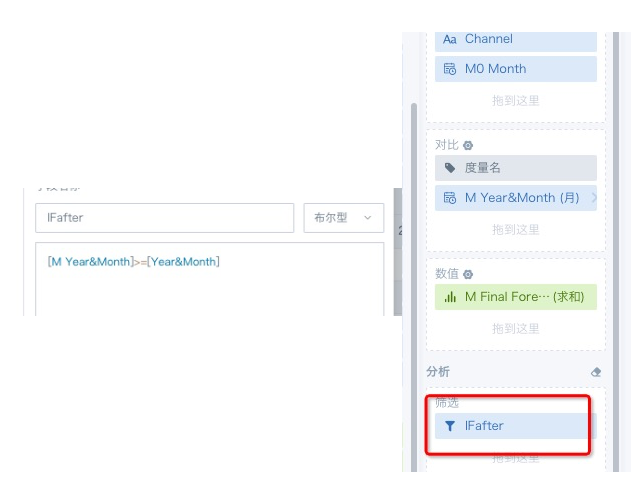
- Because only the months after the time selected by the customer filter need to be displayed for comparison, create a field on the card editing page to control whether data is displayed, and drag this field into the filter area.