Guandata BI Glossary
Overview
Guandata BI is a modern BI solution built around enterprise digital operations and the principle of making data truly usable for the business. It is also an enterprise-grade intelligent BI solution designed for hybrid analytics needs and composed of a suite of products.
This article explains common high-frequency terms and product-specific concepts across the major BI workflow modules, helping users better understand and use Guandata BI.
Data Integration
| Term | Definition |
|---|---|
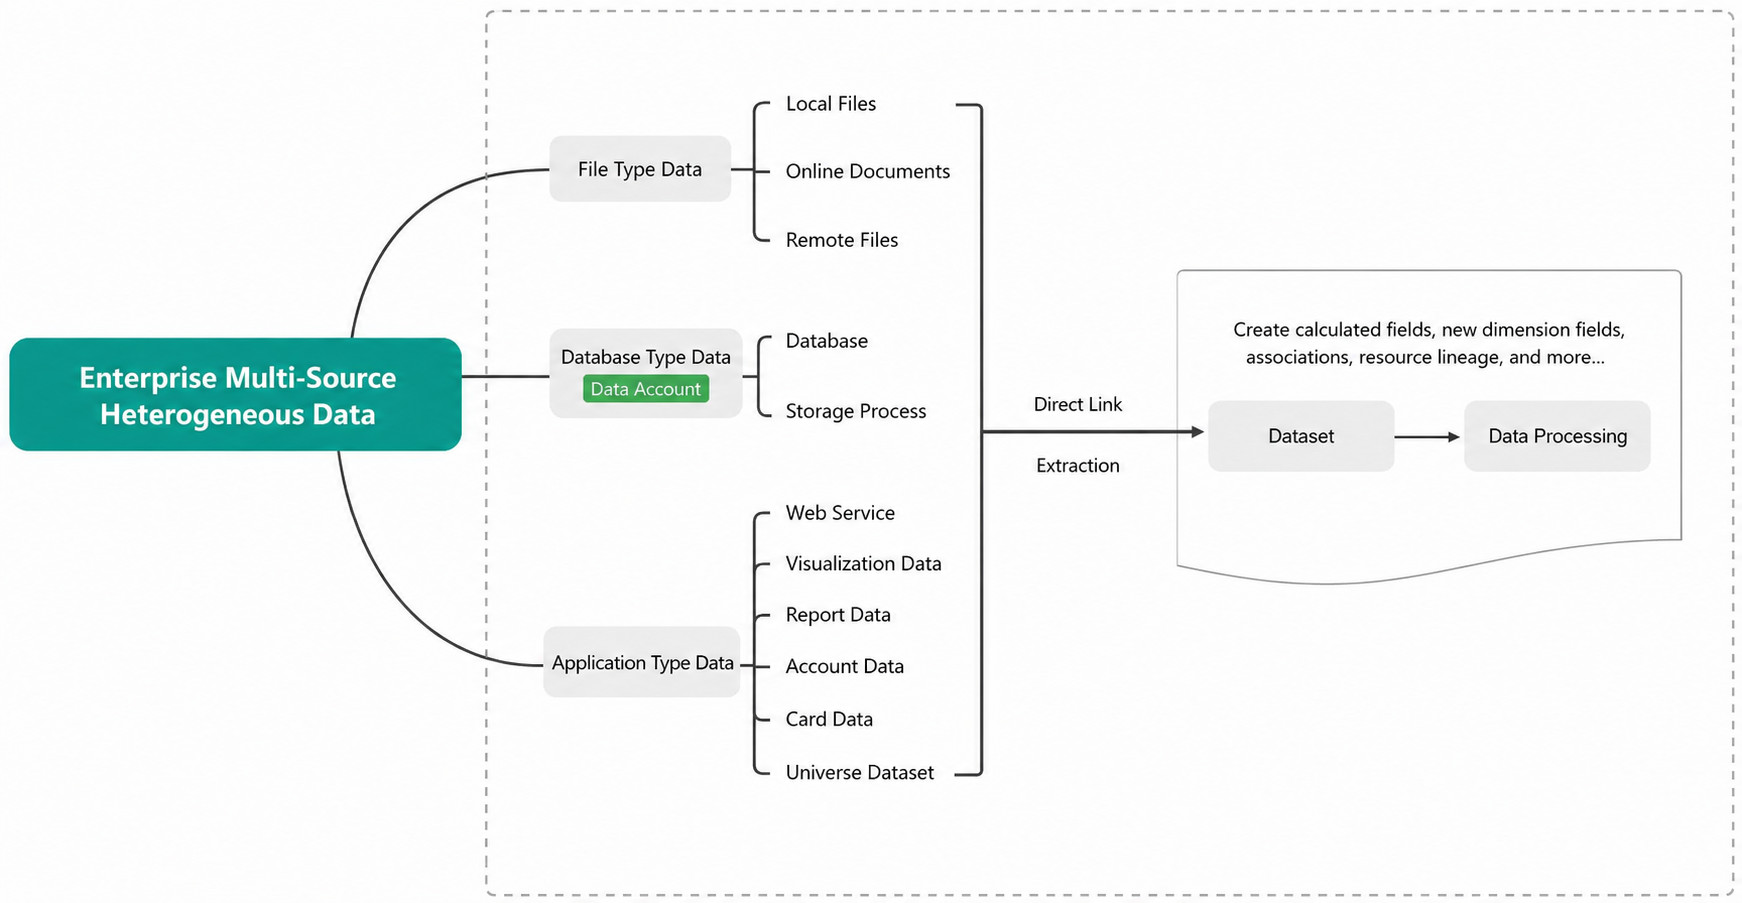
| Data Integration | Bringing scattered, heterogeneous enterprise data from multiple sources into Guandata BI to eliminate data silos and build a unified data pool with a complete view of enterprise data. |
| Data Account | A credential used to connect to a database or service. Users configure connection details such as database type, host address, port, username, and password. It enables quick database access, table discovery, and dataset creation. |
| Direct Connection & Extraction | Two data connection modes are available: direct connection and extraction (Guan-Index). Choose the appropriate mode based on the business scenario. |
| Create Calculated Field | Creating a new calculated field based on existing fields by changing the calculation logic to produce a new business field. For example, Gross Profit Amount = SUM([Sales Amount]) - SUM([Cost]). |
| Create Group Field | Creating a field that groups identical values by condition and then supports analysis based on the grouped data. |
| Related Resource Creation | Used to check whether the current dataset, as a parent resource, has been used to create other BI resources such as ETL flows or datasets. |
| Resource Lineage | Resource lineage lets users clearly see the relationships among data applications, analysis dashboards, ETL flows, datasets, and other assets. It helps users understand end-to-end data flows, accelerate data governance, review upstream and downstream dependencies, assess the risk of changing or deleting resources, and locate issues more quickly. |
| Connector | A tool that connects different data sources and data processing platforms to ensure datasets can be accessed and used correctly. Guandata BI supports more than 40 data sources, including databases, files, Web Services, and third-party applications. |
| Dataset | The basic unit used to store and manage data. A dataset is built by pulling data from various sources through connectors and can be used across Guandata BI for calculation, analysis, and processing. |
| View Dataset | A dynamic dataset based on SparkSQL that supports parameterized execution. Users can dynamically join and calculate one or more non-direct datasets, excluding real-time datasets, to create a new dataset. |
| Form Dataset | Provides multi-terminal data collection through form entry. Users can submit data directly in Guandata BI, including template maintenance, collection, and summarization. The collected data can then be quickly integrated into the Guandata BI analytics platform for subsequent visualization and analysis. |
Data Preparation
| Term | Definition |
|---|---|
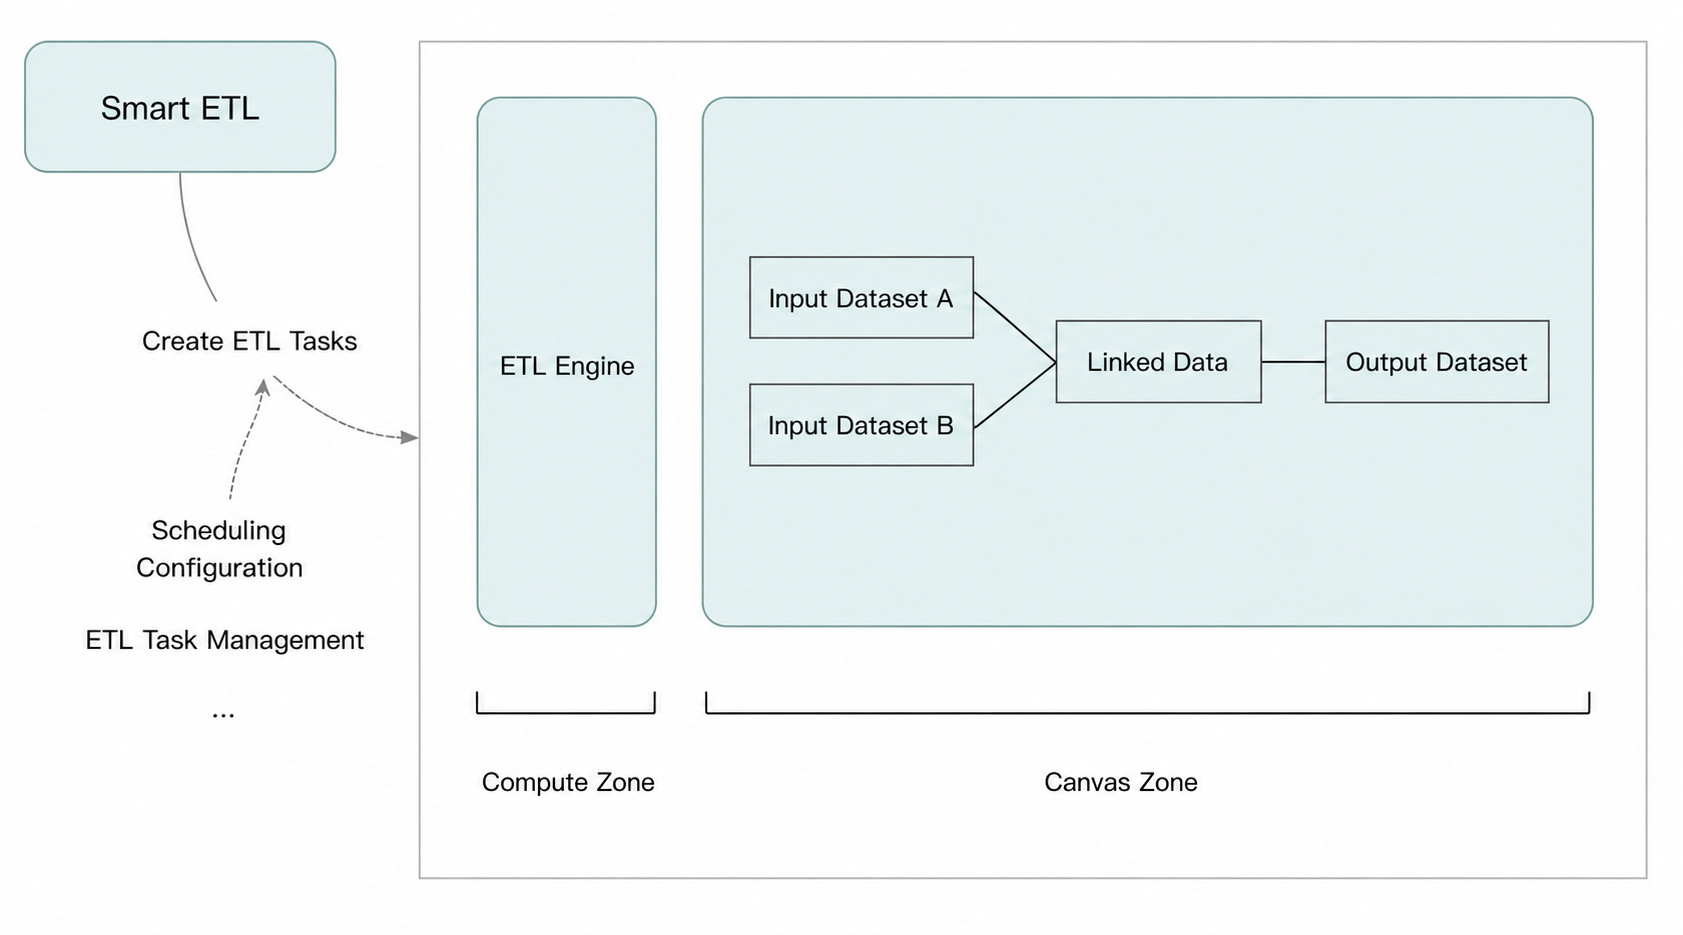
| Smart ETL | Smart ETL is a no-code, fully drag-and-drop self-service data preparation and lightweight data warehouse building tool in Guandata BI. Powered by Smart ETL and its nodes, users can build complete data processing workflows through drag-and-drop and configuration-based operations, including cleansing, transformation, loading, real-time preview, debugging, and output on any node. |
| Smart ETL Operators | Guandata BI provides a wide range of Smart ETL operators across five major categories: input/output, column editing, data editing, data combination, and advanced calculation, with 15+ commonly used operators. |
| Canvas | The Smart ETL workspace used to create and edit ETL workflows. Users can add or remove Smart ETL operators on the canvas and also create or edit annotation notes. |
| Join Data | Joining data means merging two datasets based on shared key columns. Three join methods are supported: inner join, left outer join, and full join.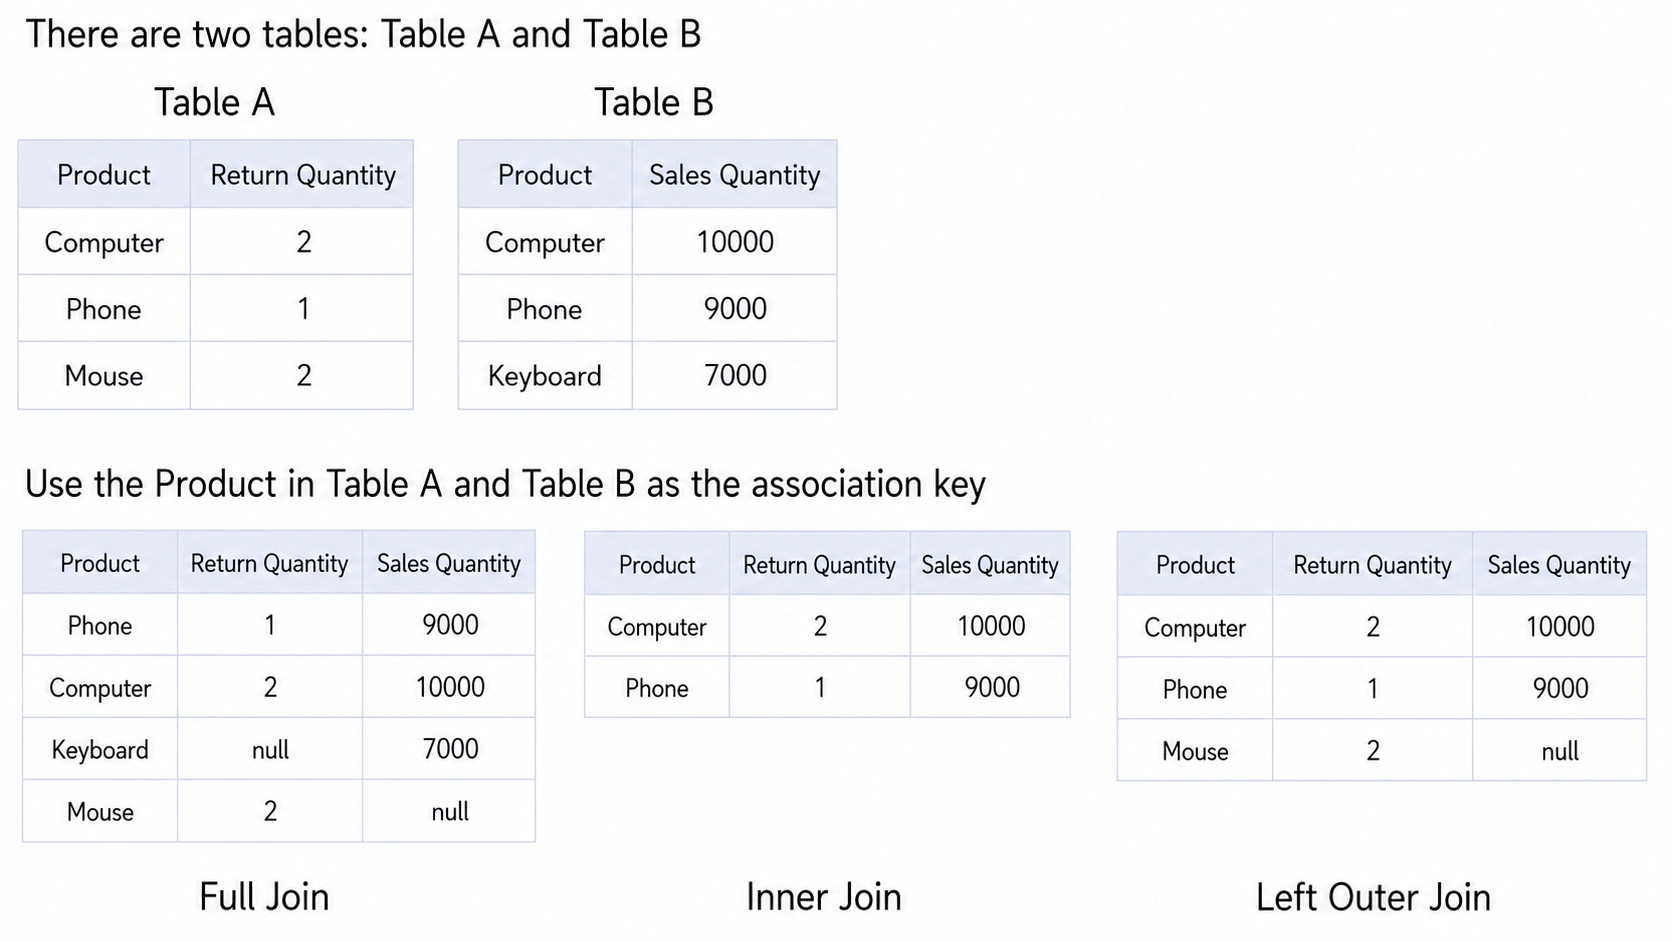 |
Metric Center
Metric Center is a core capability in Guandata BI that provides centralized management of enterprise key metrics.
| Term | Definition |
|---|---|
| Metric Center | Guandata Metrics is a centralized management center for enterprise key metrics. It provides an end-to-end solution covering metric definition, metric production, metric management, metric search, lineage analysis, metric services, and metric insights, helping enterprises build a unified metric system and shift from data-driven to metric-driven decision-making. |
| Atomic Metric | A metric based on a specific business event or behavior and not further divisible in business definition. For example, Net Profit = sum(order net profit), Total Transactions = count(distinct order number). |
| Composite Metric | A metric calculated from multiple metrics, including atomic metrics and composite metrics, through arithmetic operations. For example, Sales Share of Channel A = Sales of Channel A / (Sales of Channel A + Sales of Channel B). |
| Derived Metric | A metric created from a single atomic or composite metric and extended through methods such as cumulative calculations or period-over-period comparisons. For example, year-over-year net profit or cumulative values over the last N days based on net profit. |
| Metric Topic | A classification container used to organize and manage metrics by business domain, department, or other dimensions. |
| Shared Dimension | A foundational analysis dimension that can be reused across multiple metrics, such as time, region, or product dimensions. |
| Metric Tree | A tree-structured view of the hierarchical relationships and calculation logic among metrics, helping users understand how metrics are constructed and where they come from. |
Data Analysis & Visualization
Chinese-style Reporting Pro
| Term | Definition |
|---|---|
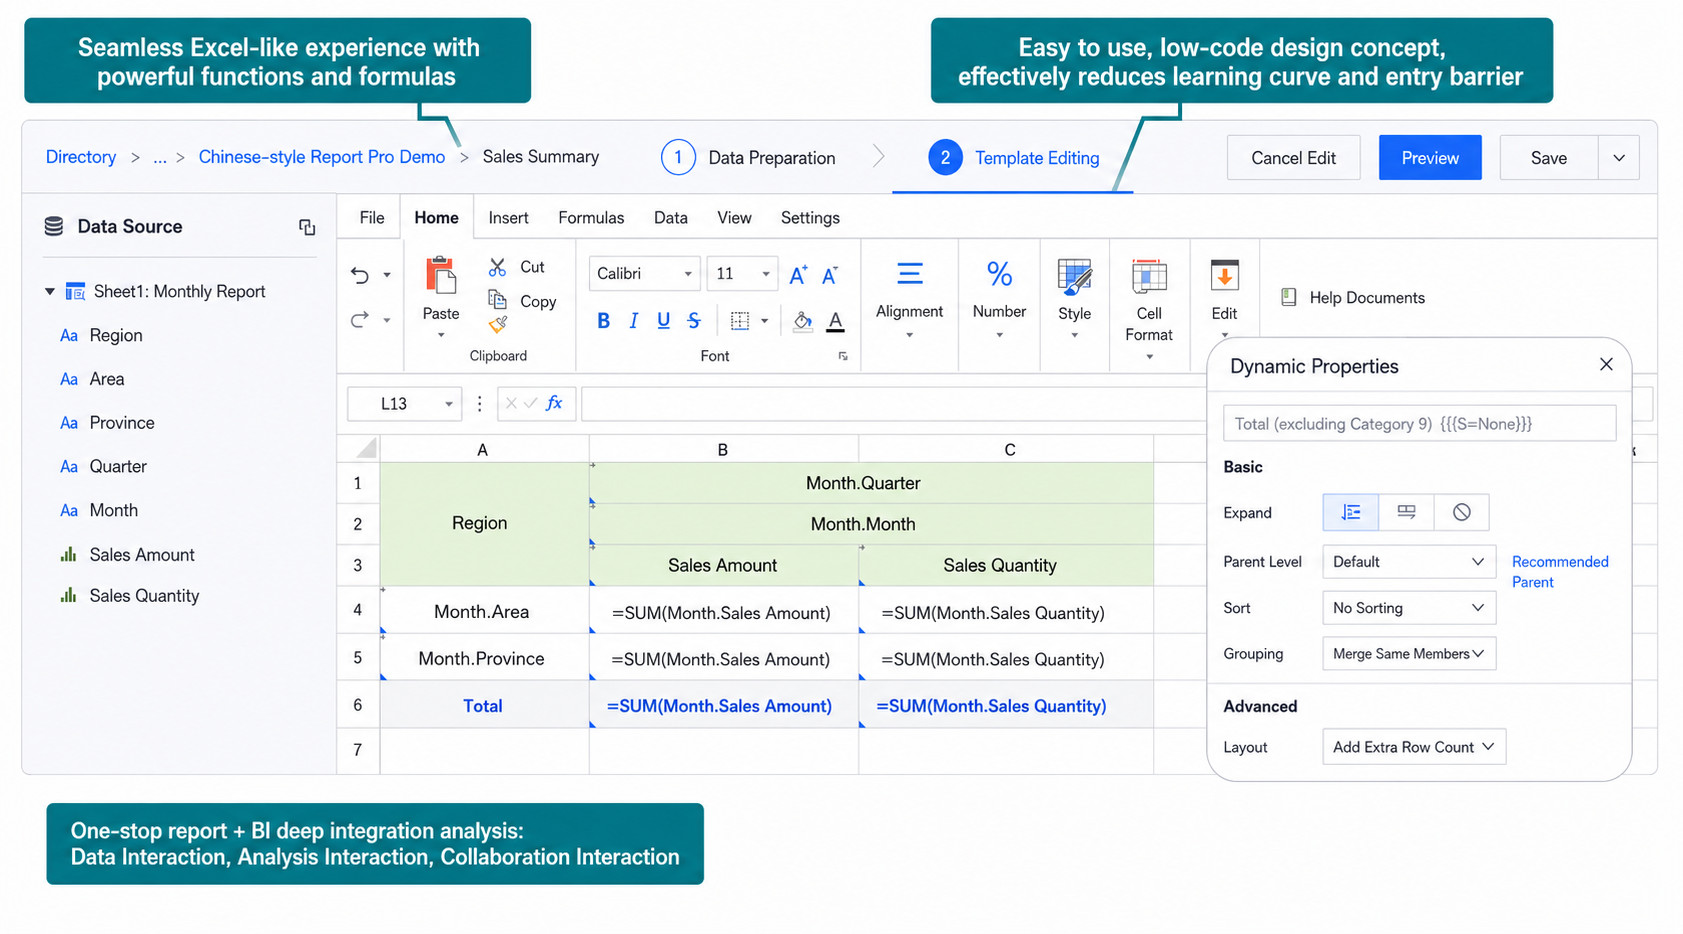
| Chinese-style Reporting Pro | Chinese-style Reporting is a low-threshold, one-stop complex reporting product from Guandata that is highly compatible with Excel user habits. Anyone familiar with Excel can easily develop and maintain Chinese-style reports. At the same time, it also provides BI capabilities such as intelligent data preparation, permission management, integrated chart presentation, linked analysis, drill-down, interoperability of data and analysis, collaboration, and subscriptions. |
| View | A view refers to a dataset and is used during the data preparation phase of report creation. During report design, fields from the view can be dragged into the Excel template. |
| Multi-view Association | During report template editing, multiple data sources can be joined and calculated together. The resulting joined table becomes a virtual view, similar to a dataset combination operator in ETL, and both the virtual view and the source tables can be used in the report. |
| Template Cell | A template cell includes template fields and template properties. It is a cell that can expand dynamically according to configured property rules. |
| Dynamic Property | When a cell is a template cell, its template properties can be configured, including basic properties and advanced properties such as expansion direction, parent cell, sorting, and more. |
Chart Visualization
| Term | Definition |
|---|---|
| Dimension | A classification basis used in analytics to group and slice data, such as time, region, or product category. Dimension fields are typically text or date fields used to describe data attributes. |
| Measure (Value) | A quantitative indicator used to evaluate business performance, such as revenue, order volume, or profit. Measure fields are typically numeric and support aggregations such as sum, average, and count. |
| Fields & Rendering | A field is a column name in a data table and one of the basic units of a database table, including both dimension fields and numeric fields. Rendering refers to the chart design area where dragging fields from the table automatically generates a visualization. |
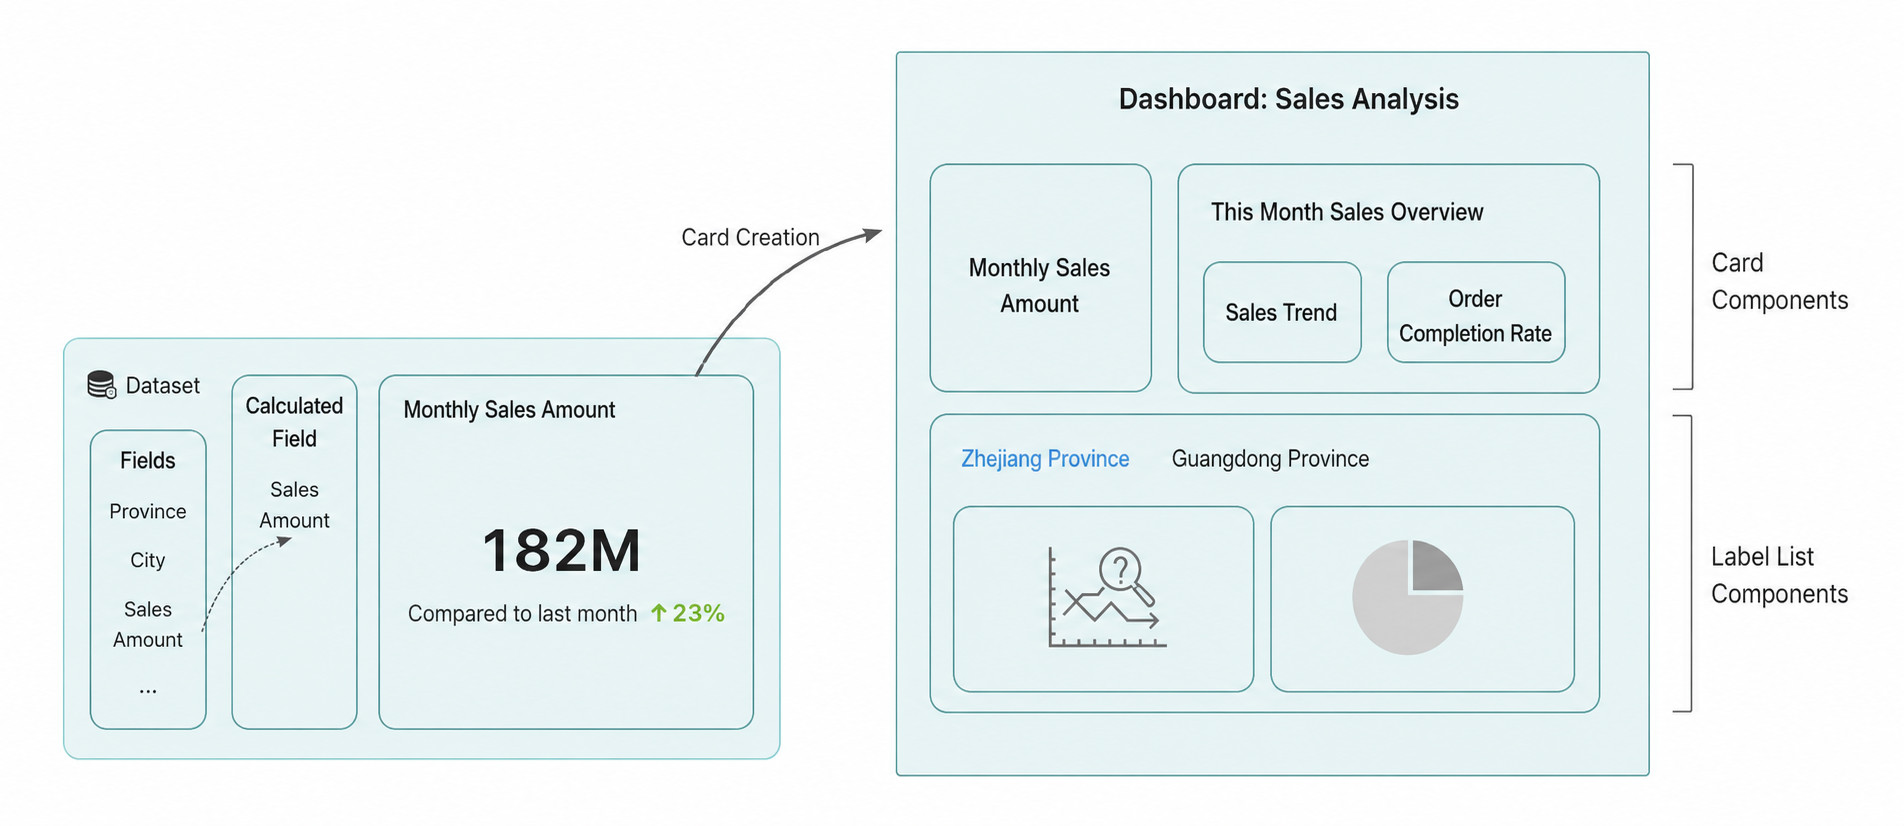
| Card | A card is the smallest analysis result unit and a core element on a dashboard page. By dragging dimensions and measures, users can quickly create and analyze visual data cards. Current supported types include visualization cards, text cards, image cards, and more. |
| Tab Component | A UI component used to switch between and display different content. Different tabs can contain related cards or card groups, and users can click tabs to switch pages and view specific content. |
| Card Group Component | A container for a set of cards. A card group can include multiple related cards, making the page more organized and improving readability. |
| Dashboard | A dashboard is a collection of data visualization analysis cards, that is, an analysis page. Users can customize layout aspects such as card size and position, and can also copy or favorite cards on the page. |
Interactive Analysis
| Term | Definition |
|---|---|
| Drill Down | An analysis method that progressively explores data in finer levels of detail by dimension granularity. For example, from total sales in a sales report, users can drill down to see detailed sales by region, product type, or time. |
| Linkage | Uses one card as a conditional filter to drive filtered analysis in other cards or datasets. |
| Navigation | Allows users to navigate from the current page to a target page or card with carried-over conditions for deeper analysis. |
Guandata Dashboard Insights
| Term | Definition |
|---|---|
| Dashboard Insights | Uses AI capabilities to automatically analyze dashboard data, identify anomalies, trends, and correlations, and help users quickly understand the business insights behind the data. |
| Card Insights | Performs intelligent analysis and anomaly detection on a single card’s data, automatically identifying fluctuations and abnormal patterns. |
| Insight Subscription | Delivers insight results to relevant stakeholders on a recurring subscription basis so that business decision-makers receive insights in a timely manner. |
| Insight Alert | Automatically triggers alert notifications when an anomaly is detected in an insight, helping users identify abnormal data signals at the earliest possible moment. |
Data Application & Consumption
| Term | Definition |
|---|---|
| Self-service Data Retrieval | A flexible report-building and ad hoc querying capability that allows end users to create custom reports through a visual interface based on templates. It helps non-technical business users retrieve data quickly and flexibly through drag-and-drop operations, even when requirements change frequently. |
| Data Portal | A data application management capability in Guandata BI. Through the data portal, analytical applications can be grouped and managed by department, business topic, and other dimensions, creating an intuitive data consumption entry point especially for senior business leaders. |
| Mobile Lightweight App | Integrates multiple mobile dashboards into one lightweight app through no-code drag-and-drop configuration, and also provides a mobile portal page that combines multiple lightweight apps into one page to deliver a personalized native mobile data-viewing experience. |
| Large-screen Dashboard | A large-screen dashboard analyzes data and presents results graphically to provide business teams and decision-makers with direct, intuitive visibility into underlying business conditions, real-time enterprise monitoring, and a more immersive decision-making experience. |
| Subscription | Users can subscribe to cards, pages, datasets, and other content in Guandata BI. Subscription content is delivered through channels such as email, WeCom, DingTalk, and Feishu, allowing recipients to stay informed about the latest data changes without logging in. |
| Alert | When a dimension or value in a card meets a predefined condition, the platform immediately notifies users of abnormal data signals. Alerts help users respond quickly and support both scheduled execution and execution after data updates. |
| Slide Deck | Combines multiple dashboard pages into a presentation-style format for display, supporting both auto-play and manual switching for scenarios such as meeting presentations. |
| Composite Report | Combines multiple cards into one report for export and sharing, with support for customized layouts and formats. |
AI Assistant
AI Assistant is an intelligent capability in Guandata BI that lowers the barrier to data analysis with large model capabilities.
| Term | Definition |
|---|---|
| Smart Formula Generation Assistant | Generates SQL and calculated fields from natural language, helping users define complex logic efficiently during data analysis and lowering the product learning threshold. |
| Smart Chart Generation Assistant | Generates custom charts through natural language, powered by AI-driven conversational interaction, so users can create custom business charts quickly without writing code. |
| Smart Naming Assistant | Automatically generates names and descriptions that fit the content, helping solve inconsistent naming and description issues for dashboards, datasets, ETL flows, and other resources. |
| Smart ETL Assistant | Automatically generates ETL annotations, optimization suggestions, and process documentation. Annotations help explain data processing logic; optimization suggestions analyze ETL workflows and provide process and performance recommendations; process documentation explains logic and data mapping. |
| Smart Plugin Generation | Generates front-end plugins through natural language, powered by AI-driven conversational interaction, allowing users to create Guandata BI front-end plugins without writing code. |
| Product Usage AI Q&A | On any page in the BI platform, users can ask questions through the AI assistant, and the system automatically generates the most suitable answer for the current scenario. |
Related Documents
For detailed operating instructions for each feature, refer to the following documents:
- Product Overview: Product Overview
- Data Integration: Multi-Source Data Integration Overview
- Data Preparation: Smart ETL Overview
- Data Analysis & Visualization: Create a Dashboard
- Guandata Dashboard Insights: Dashboard Insights
- Subscriptions & Alerts: Subscriptions and Alerts
- AI Assistant: AI Assistant