Create Data Snapshots with ETL
Requirement Background
Some fields in a dataset may change from time to time, such as product unit price, membership level, and event progress. If the source database does not store all historical information, or if the data displayed on the dashboard is summarized based on the current time, how can you query past data status or record all data changes?
This is where data snapshots are needed. A snapshot is a fully usable copy of a specified data collection. The copy includes the image of the corresponding data at a specific point in time, namely the copy start time. A snapshot can be a copy or replica of the data it represents. It is like a camera: when the shutter flashes, it records that moment. The difference is that a snapshot can restore data to that moment, while we can never return to the moment captured in a photo.
Applicable Scenarios
When the data volume is small or only changed data needs to be recorded, use Guandata BI built-in ETL to create data snapshots. When the data volume is huge, create a zipper table to store historical data. This requires UDF time series functions or view datasets, which are not covered in this article.
Implementation Method
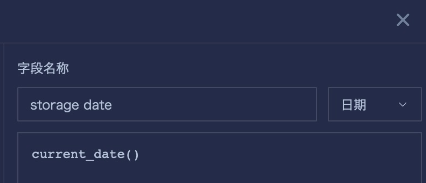
- In ETL, process and aggregate the raw data as needed, preferably using group aggregation, to reduce the data volume. Then create a calculated field named storage date to timestamp the data. For daily snapshots, use current_date().
- Set the output dataset name and save path, and then run the ETL.
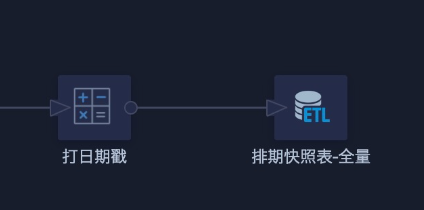
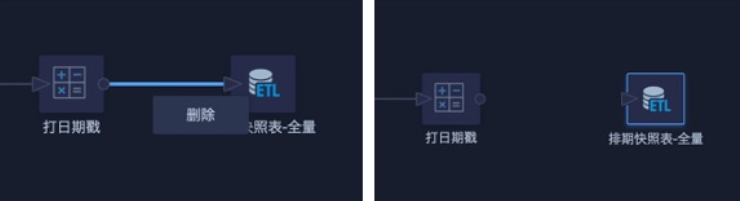
- Return to the ETL editing page and temporarily disconnect the output dataset in the ETL from the previous step. Delete only the association line, not the output dataset.
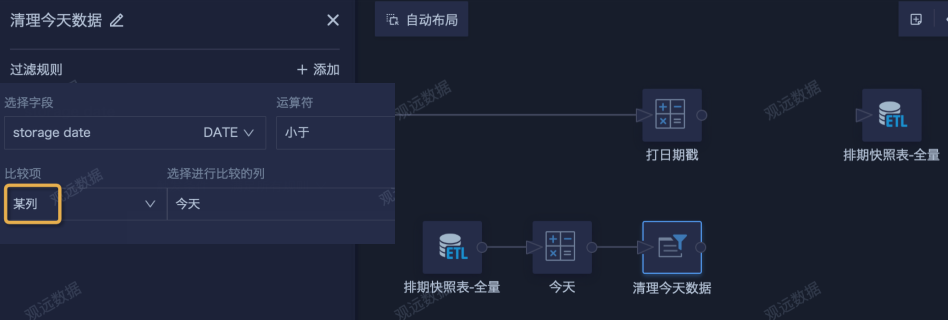
- Add a new Input Dataset and select the output dataset generated by the previous ETL run. To prevent redundant data caused by multiple ETL runs in one day, add a calculated column named Today using the current_date() function. Then filter storage date to be earlier than today and clean out data generated today first. This is equivalent to pre-cleaning and produces historical data.
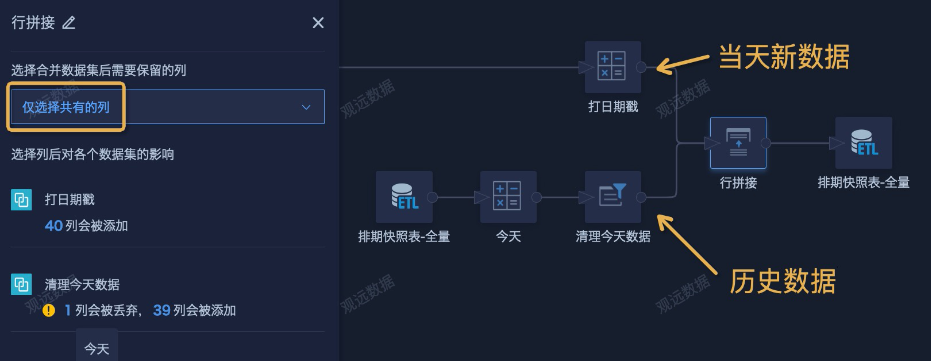
- Use a Row Append node to append the latest data from today and the historical data from the two branches. Then associate the original output dataset and save it. Also set a daily scheduled update. In general, updating once per day is enough.
Case Sharing
Assume a task schedule snapshot table has already been created using the method above. Now you need to filter out records whose task schedules changed each day and generate snapshots, so that the dashboard can show schedule changes within any time range, as well as all tasks that changed during a specific schedule cycle.
Implementation Steps
-
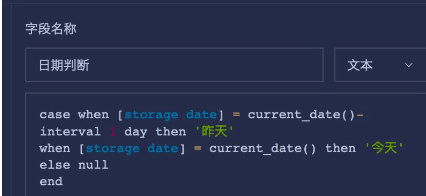
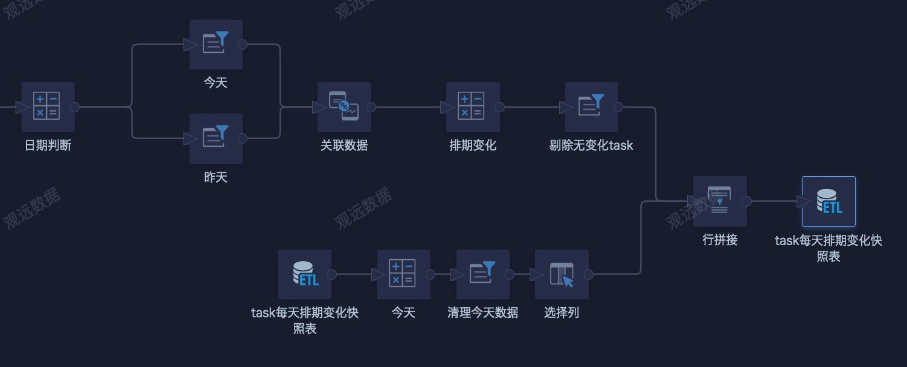
Create an ETL, select the input dataset, and add calculated columns to identify today and yesterday.
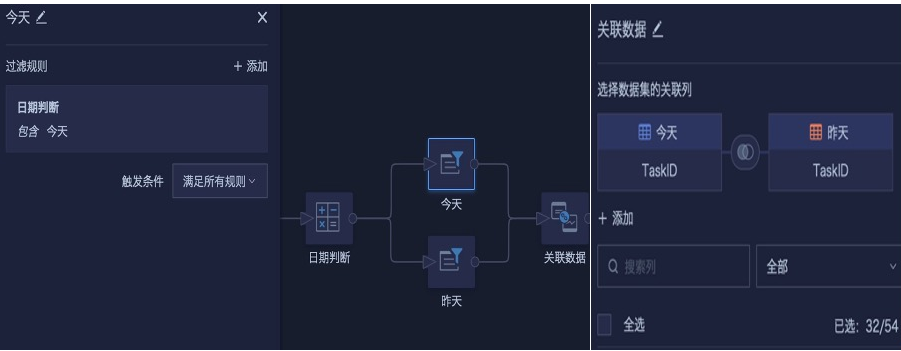
- Add two Filter Rows nodes to filter Today and Yesterday separately. Then use Today as the base table and left-join Yesterday. During association, select only the required fields and rename them as needed.
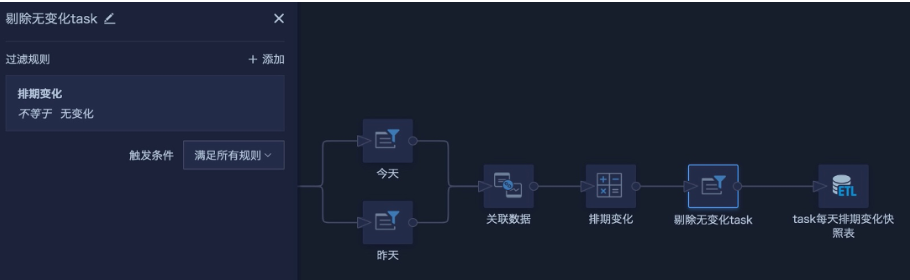
- Create fields to compare yesterday's data with today's data, determine whether the schedule changed, filter out data with no schedule changes, configure the output dataset, save, and run.
- Reference the output dataset generated in the previous step as the input dataset, append it with the original data table, save again, run the ETL, and set a daily scheduled update. After the first run, only data from the run day exists. As the ETL runs daily, schedule changes that occur each day are recorded and saved, completing the snapshot table.
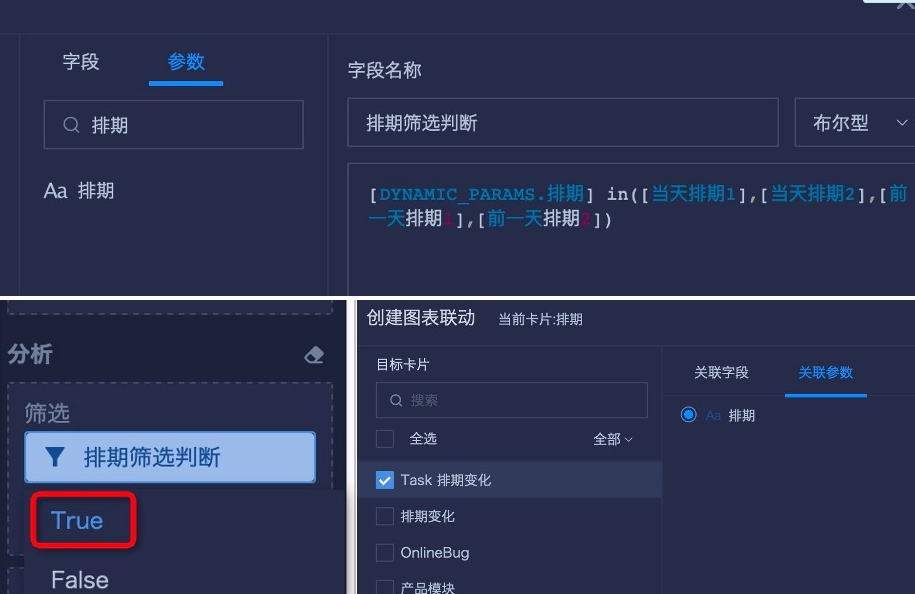
- Create page cards. Link the date filter to the date stamp field, storage date, created in ETL. Schedule information needs cross-field search, so create a field that references a global parameter.
- The final page display is as follows:

Snapshot Table Maintenance
During the early stage of ETL creation, after the first ETL run and before adding row append, check data quality and determine the final fields to retain. If you modify logic or add/delete fields after the ETL has run for a while, modify both branches before Row Append in ETL.