Flexible Date Filter Control Time Range Display
Requirement Background
Under the same page, only one date condition is needed, but the controlled cards need to display data for various time ranges such as the last 7 days of the selected date, the 10th to 25th of the month where the date is located, the last 12 months, the last 3 years, etc.
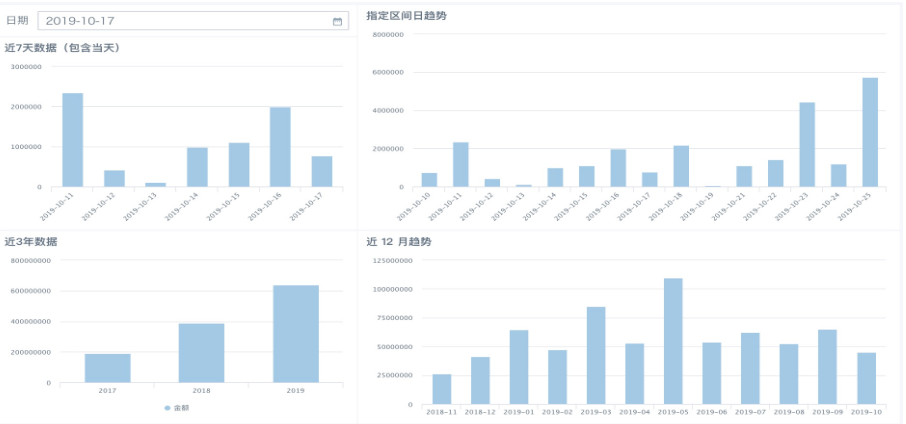
For example, filter date 2019-10-17, to see card time ranges: 2019-10-112019-10-17 for 7 days, 2019-10-102019-10-25, 2018-112019-10 for 12 months, 20172019 for 3 years. The visualization effect is as follows.
New Scenario Five: Filter date 2019-10-17, display daily sales amount from 2019-10-012019-10-17, cumulative sales amount from 2019-10-012019-10-16 (not counting 2019-10-17).
Scenario One: Display Last 7 Days Data of Selected Date (Can Specify Date Range)
Method Steps:
(1) Set a date global parameter;
(2) Create 1 new calculated field in the card, calculate the interval days between each row's date and the corresponding incoming parameter date, control the free range through the difference, as shown in the figure below;

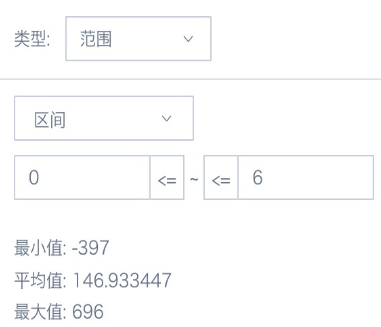
(3) In the card's filter, drag the calculated field created in the previous step, then set the control interval;
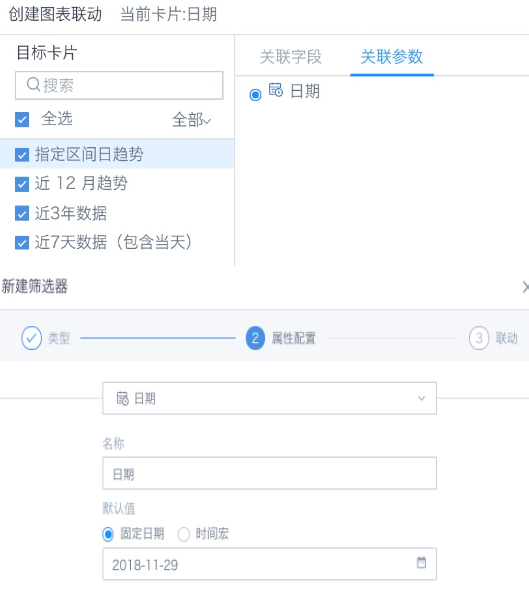
(4) Add an external time filter, set the association condition to associate with the date global parameter used in the card; or create a new parameter filter, select the date global parameter used in the card.
Scenario Two: Display Data Within Fixed Interval of Selected Date's Month
Method Steps:
(1) Set a date global parameter;
(2) Add 3 calculated fields in the card to control year, month, and day filtering respectively, as shown in the figure below;
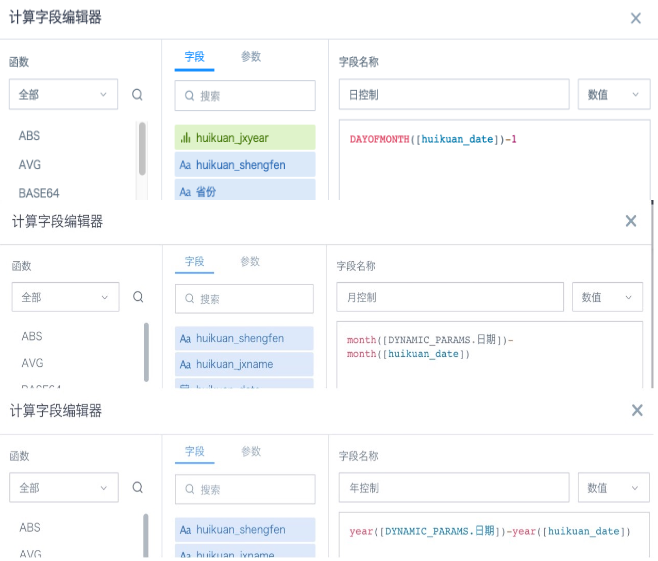
The principle is to calculate the difference between each row's date and the corresponding incoming parameter date's year, month, and day, and control the free range through the difference.
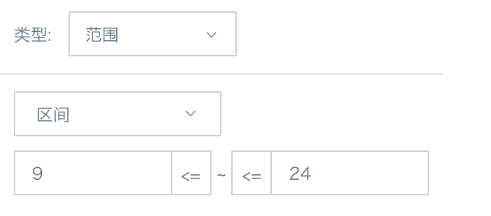
(3) In the card's filter, drag the three calculated fields that control year, month, and day, then set the control interval. Day control is as shown below, year and month are respectively set to equal 0;
(4) Add an external time filter, set the association condition to associate with the date global parameter used in the card; or create a new parameter filter, select the date global parameter used in the card.
Scenario Three: Display Last 12 Months Data of Selected Date
Method Steps:
(1) Set a date global parameter;
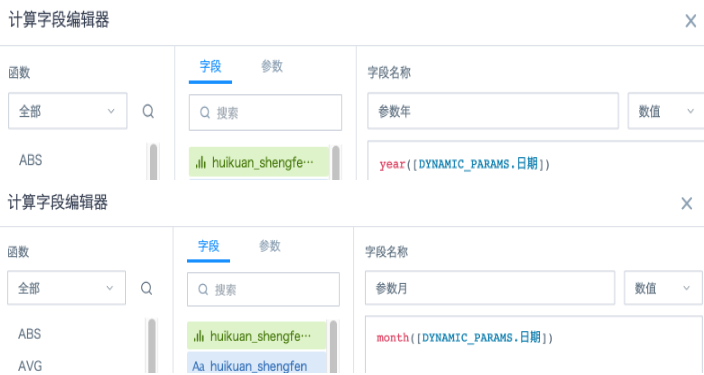
(2) Add 2 calculated fields in the card to extract the year and month of the incoming date parameter;
-
Parameter Month: month([DYNAMIC_PARAMS.Date])
-
Parameter Year: year([DYNAMIC_PARAMS.Date])
(3) This step is very important: The principle is to control the filter range through the method of start year month <= dataset year month <= end year month. The control principle is to do mutual subtraction, i.e., data where start year month - dataset year month <= 0 is within the range that needs to be displayed, and dataset year month - end year month is the same. Here the end year month is actually the parameter year month.
Operation: Before controlling the dataset year month calculation, add 3 new calculated fields as follows:
-
Dataset Year Month: year([Date Field])*100+month([Date Field])
-
Start Year Month: case when [Parameter Month] =12 then [Parameter Year]*100+1 when [Parameter Month]<12 then ([Parameter Year]-1)*100+[Parameter Month]+1 end【Logic: If parameter month is December, take January of the current year; if not December, take the previous year's selected month +1】
-
End Year Month: [Parameter Year]*100+[Parameter Month]
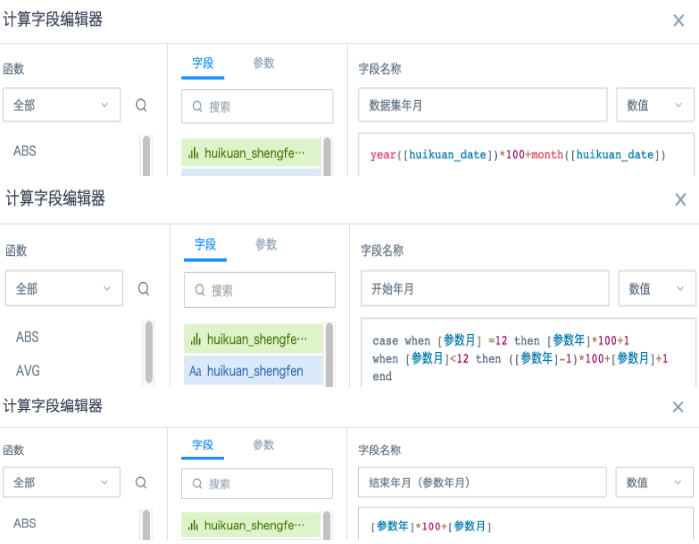
The reason for calculating through numerical values instead of directly using year month concatenated values concat() is because single-digit months like January 1st become 20191 instead of 201901 after processing, which would cause calculation errors with double-digit months like October 201910, so it must be handled this way.
(4) Add 2 fields to do year month subtraction:
-
Start Control: [Start Year Month]-[Dataset Year Month]
-
End Control: [Dataset Year Month]-[End Year Month]
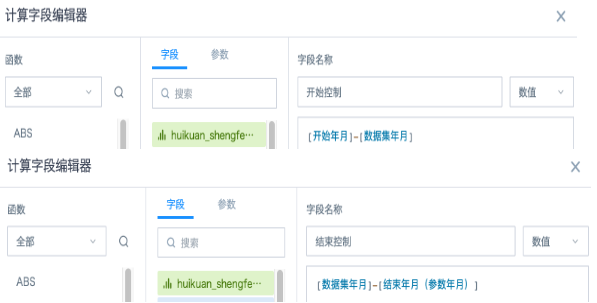
(5) Put the two fields from (4) into the card's filter, control range all as <=0;
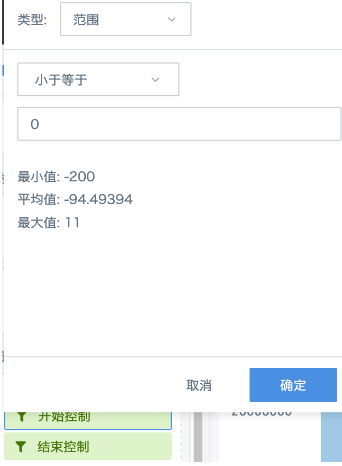
(6) Add an external time filter, set the association condition to associate with the date global parameter used in the card; or create a new parameter filter, select the date global parameter used in the card.
Note: The above formulas are implemented based on extracted datasets (i.e., Spark functions). If using direct connection datasets, you need to replace with the corresponding database function syntax.
For example, in Oracle direct connection datasets, directly creating calculated fields in cards will report error ORA-00904: "YEAR": invalid identifier.
The reason is that Oracle doesn't support directly using year, month functions to get date year and month. You need to change to EXTRACT(MONTH FROM TO_DATE([DYNAMIC_PARAMS.Date],'DD')) and EXTRACT(MONTH FROM TO_DATE([DYNAMIC_PARAMS.Date],'DD'))
Scenario Four: Display Last 3 Years Data of Selected Date
Method Steps:
Please completely refer to Scenario Three steps to create fields, adjust according to needs as follows:
-
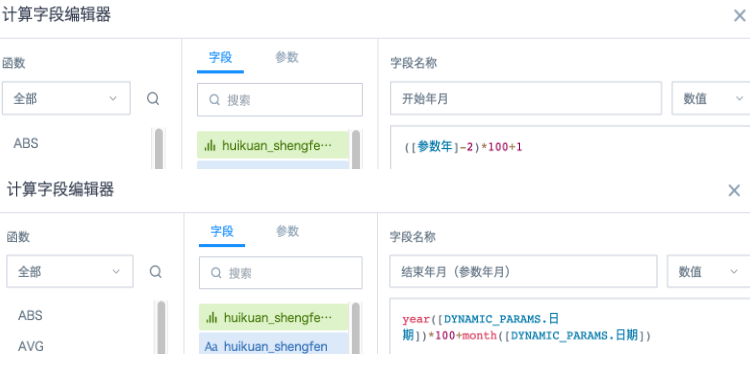
Start Year Month: ([Parameter Year]-2)*100+1
-
End Year Month: [Parameter Year]*100+[Parameter Month] (only to the parameter's year month)
[Parameter Year]*100+12 (entire year of parameter's year)
Scenario Five: Display Selected Date's Daily Sales Amount, Cumulative Sales Amount from Beginning of Month to Yesterday
Method Steps:
1. Set a date global parameter;
2. Add 3 calculated fields in the card to control year, month, and day filtering respectively, as shown in the figure below;
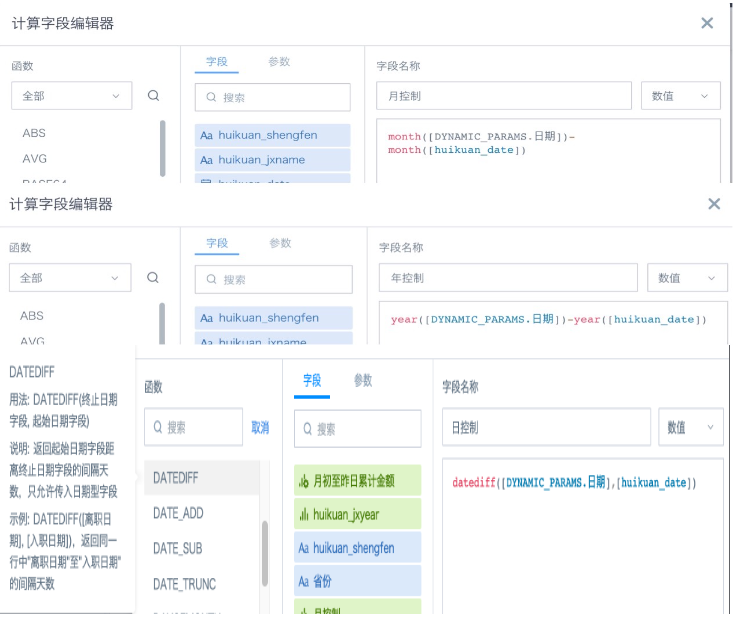
The principle is to calculate the difference between each row's date and the corresponding incoming parameter date's year, month, and day, and control the free range through the difference.
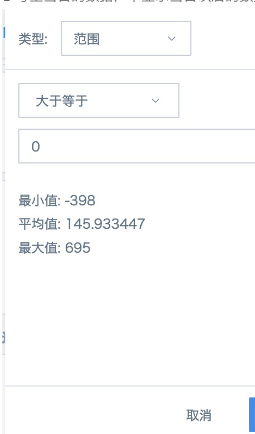
3. In the card's filter, drag the three calculated fields that control year, month, and day, then set the control interval. Day control is greater than or equal to 0 (as shown below), year control and month control are respectively set to equal 0. This can only filter out data from the 1st of the current month to the current day, not displaying data after the current day.
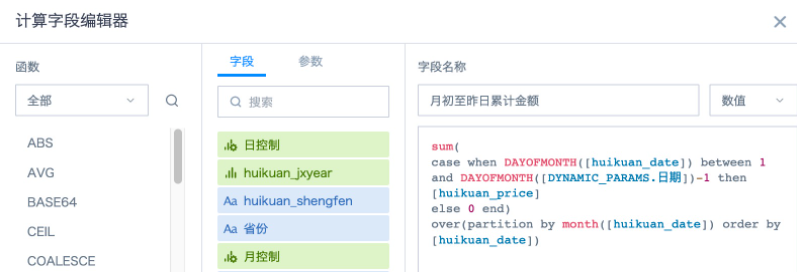
4. Create a new field "Cumulative Amount from Beginning of Month to Yesterday" using combination functions to calculate the cumulative amount from beginning of month to yesterday.
Conditional function *case when DAYOFMONTH([huikuan_date]) between 1 and DAYOFMONTH([DYNAMIC_PARAMS.Date])-1 then [huikuan_price]else 0 end
Can filter out daily sales details from beginning of month to yesterday, window function sum( ) over(partition by month([huikuan_date]) order by [huikuan_date]) can perform cumulative calculation on daily sales details from beginning of month to yesterday. If you need to group statistics by more dimensions, you can add dimension fields to the partition by in order. For specific usage of cumulative calculation, please refer to How to Calculate Monthly Cumulative Sales Amount
5. Drag the date field to the dimension bar, drag the sales amount field from the dataset to the numerical bar, aggregation method select "Sum", rename to "Daily Sales Amount"; then drag the newly created field "Cumulative Amount from Beginning of Month to Yesterday" to the numerical bar, aggregation method select "No Processing".
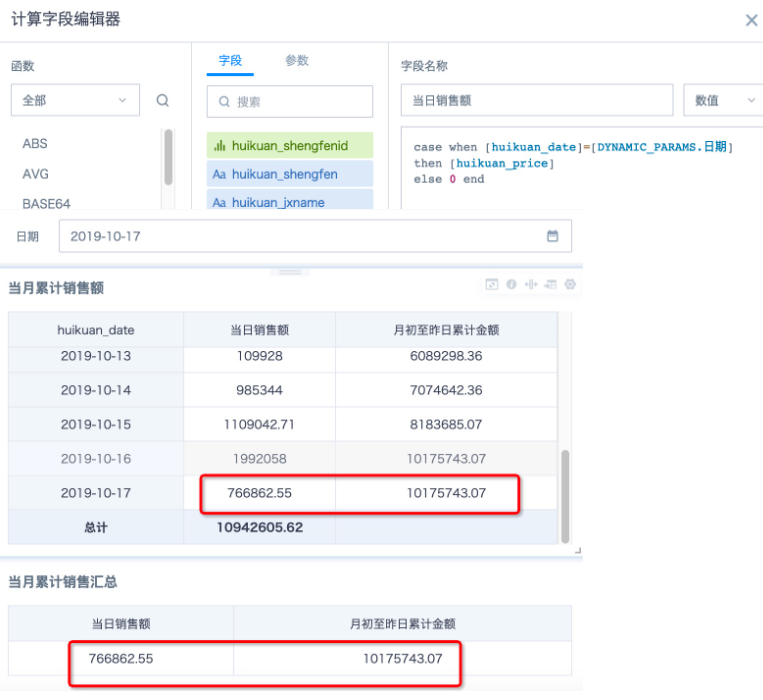
Note: If the dimension bar doesn't have a date field, then the "Daily Sales Amount" field "Sum" statistics actually get the cumulative sales amount from beginning of month to current day, not the daily sales amount. At this time, you need to create a new field *case when [huikuan_date]=[DYNAMIC_PARAMS.Date] then [huikuan_price]*else 0 end
And drag to the numerical bar to count daily sales amount, aggregation method select "Sum". The effect comparison of the two methods is shown in the figure below.
6. Add an external time filter, set the association condition to associate with the date global parameter used in the card; or create a new parameter filter, select the date global parameter used in the card
Note: All calculated fields above use system built-in Spark SQL functions. If cards use direct connection datasets, please use the corresponding database functions.
Case
Demo Experience
Login to experience case Demo Custom Quick Date Range.
Case Download
Download this case to local environment from Guandata Application Market Dynamic Time Macro.