Use Multidimensional Sankey Charts
Background
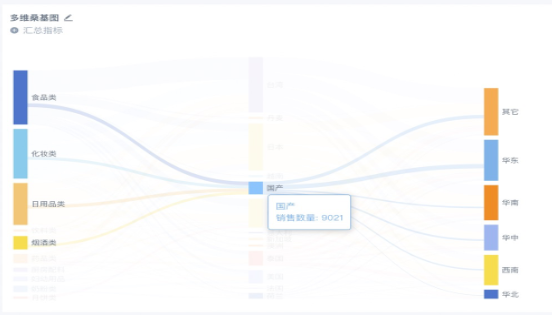
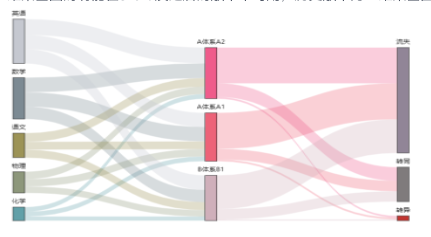
A Sankey chart, also called a Sankey energy flow chart or Sankey energy balance chart, is a specific type of flow chart. The width of each branch corresponds to the size of the data flow. The most obvious feature of a Sankey chart is that the total width of the branches at the start and end is equal. In other words, the total width of all main branches should equal the total width of all outgoing branches, maintaining balance.
The multidimensional Sankey chart feature is available in version 3.8.0 and later. The historical version was a two-dimensional Sankey chart, which was removed in December 2021 and is no longer maintained.
Creation Method
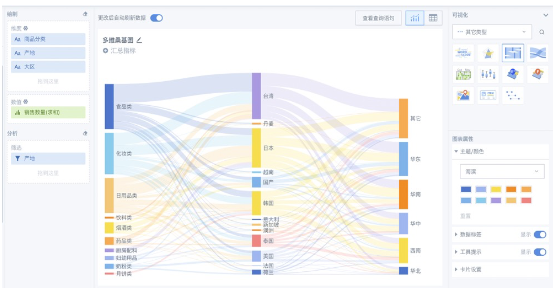
Create a card and select Other Types - Multidimensional Sankey Chart. A Sankey chart requires at least three fields: two dimension fields and one value field. A multidimensional Sankey chart supports up to five dimension fields.
Before creating the card, we recommend processing the data in ETL first.
Click a category to highlight its source and destination.