Use DuPont Analysis Charts
Background
The DuPont analysis chart was first used by the DuPont Company in the United States. It organically combines several ratios used to evaluate enterprise operating efficiency and financial condition according to their internal relationships, forming a complete metric system and ultimately reflecting the result through return on equity.
In practical applications, we sometimes need to use the DuPont analysis method to combine various business metrics and build a model structure that reflects relationships between business metrics, so that goals and methods can be displayed quickly and clearly.
In this case, you can create a DuPont analysis chart in the dashboard, allowing relationship diagrams between KPI cards or comparison KPI cards to be drawn.
Setup Guide
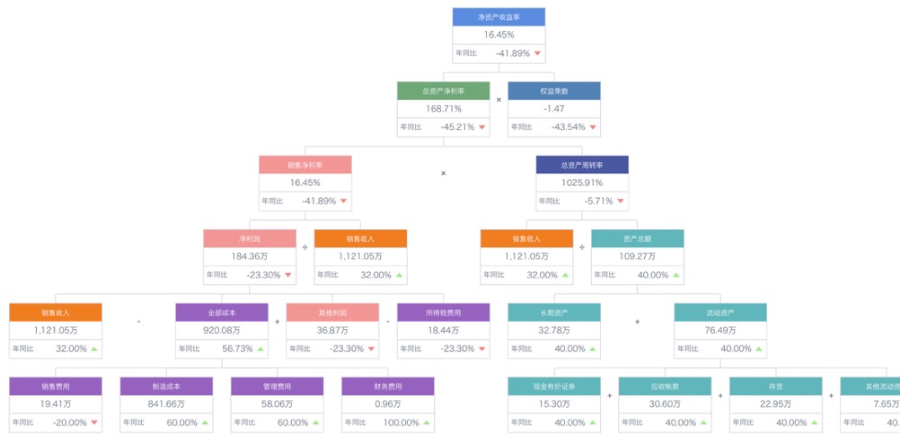
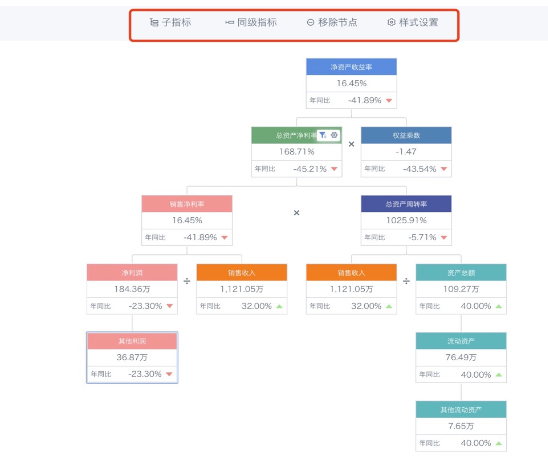
Use the following DuPont chart as an example:
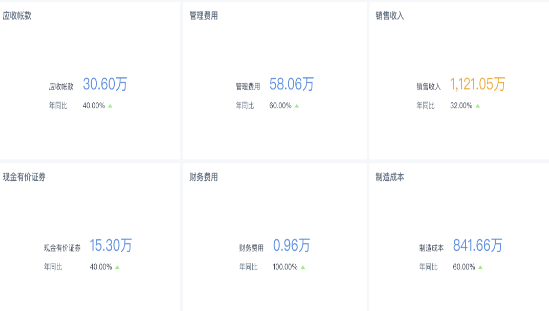
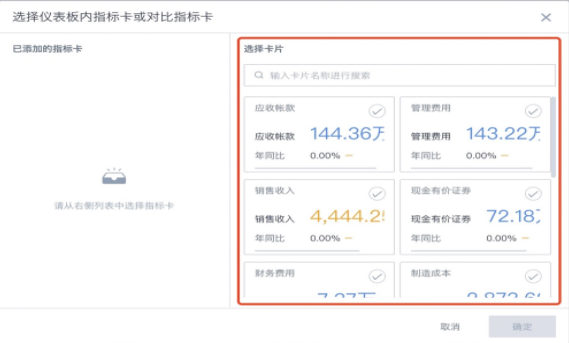
- First, create a batch of KPI cards on the page.
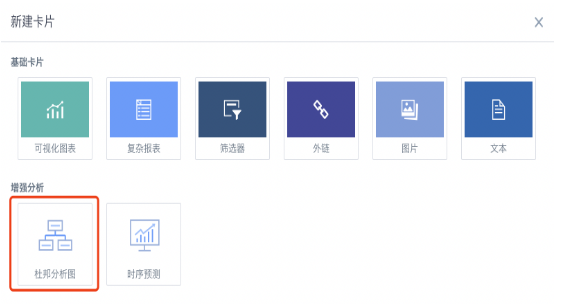
- Then create a DuPont analysis chart. You can select the KPI cards just created.
- The structure of a DuPont analysis chart is pyramid-like from top to bottom. The top parent node has only one node, while child nodes can have multiple nodes.
Except for the top parent node, which cannot add peer metrics, subsequent child nodes can add child metrics, peer metrics, remove metrics, and set styles.
Operation: select a node and click the operation button above.
-
Newly created nodes automatically inherit styles.
-
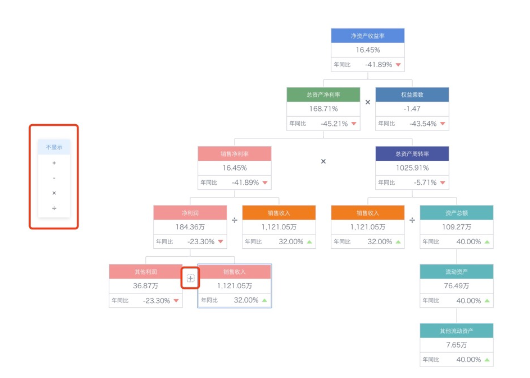
You can add operators such as +, -, *, and / between peer nodes to represent their relationships.
These operators only indicate relationships. No actual calculations are performed between peer cards or between parent and child cards.
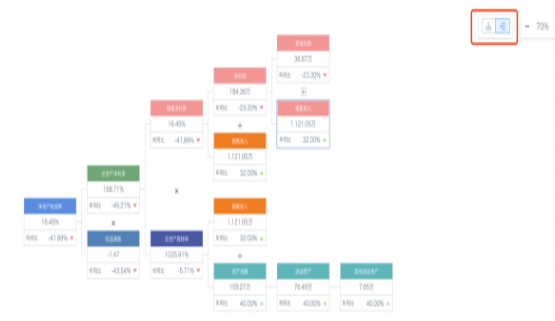
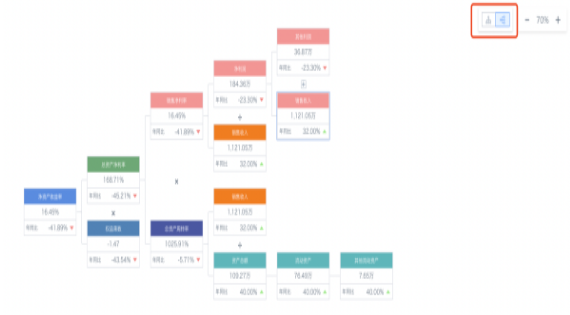
- In addition to top-to-bottom structure, you can also select a left-to-right structure.
- To view partial data, you can also create filters on the page and configure linkage with KPI cards inside the DuPont analysis chart. When the filter has a selected range, KPI card data changes accordingly.