Create Dynamic-Dimension Reports with Global Parameters
Requirement Background
The customer needs to create reports by year, month, week, and day. In general, this requires four cards with the same structure and style. The customer wants to merge them into one report card and use a filter to specify the report date dimension, switching between year, month, week, and day views.
Implementation
Use a global parameter filter to switch report dimensions.
Detailed Steps
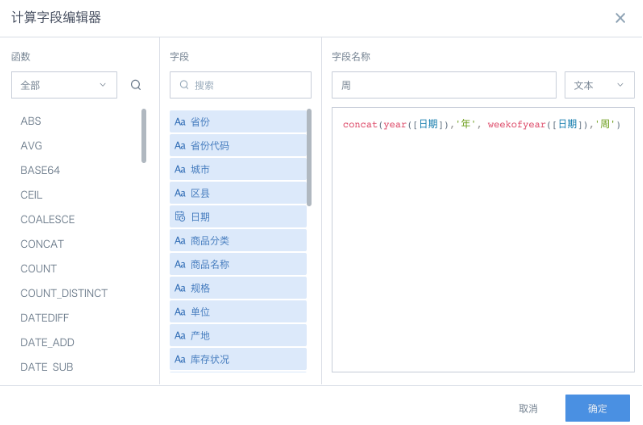
1. On the dataset overview page or in ETL, create calculated fields to extract the year, month, and week from the date field. Text type is recommended. Year: use year([Date]); month: see Function for Extracting Year and Month; week: concat(year([Date]), ' Year ', weekofyear([Date]), ' Week ').
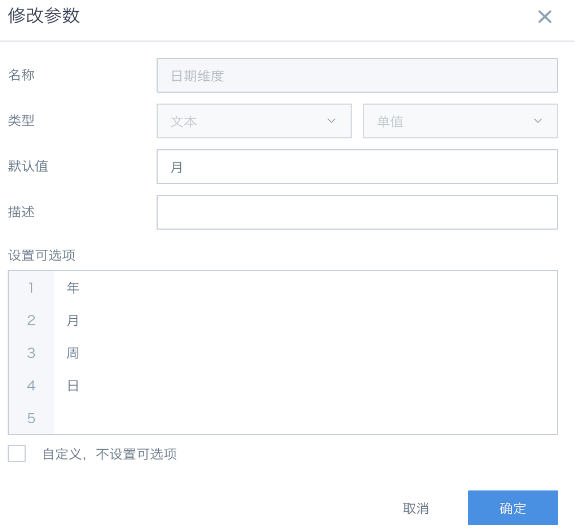
2. Create a global parameter. Set it as a text, single-value parameter, with optional values Year, Month, Week, and Day, and configure the default value.
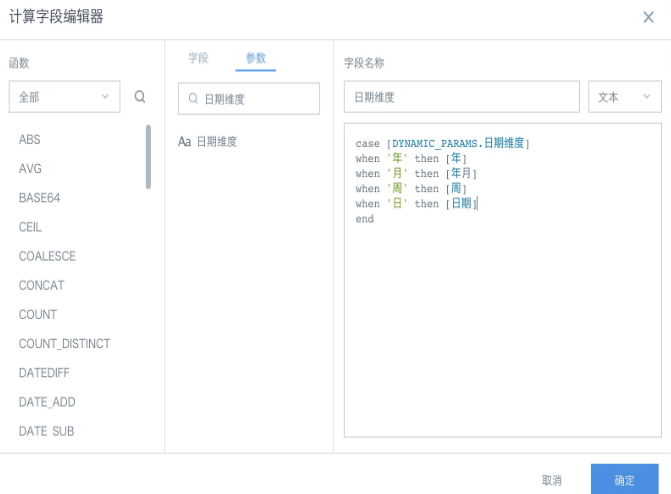
3. On the card editing page, create a calculated field with the following global-parameter logic. Then drag this field into the dimension area.
This field can only be created in the card.
| 1 | case [DYNAMIC_PARAMS.Date Dimension] when 'Year' then [Year] when 'Month' then [YearMonth] when 'Week' then [Week] when 'Day' then [Date] end |
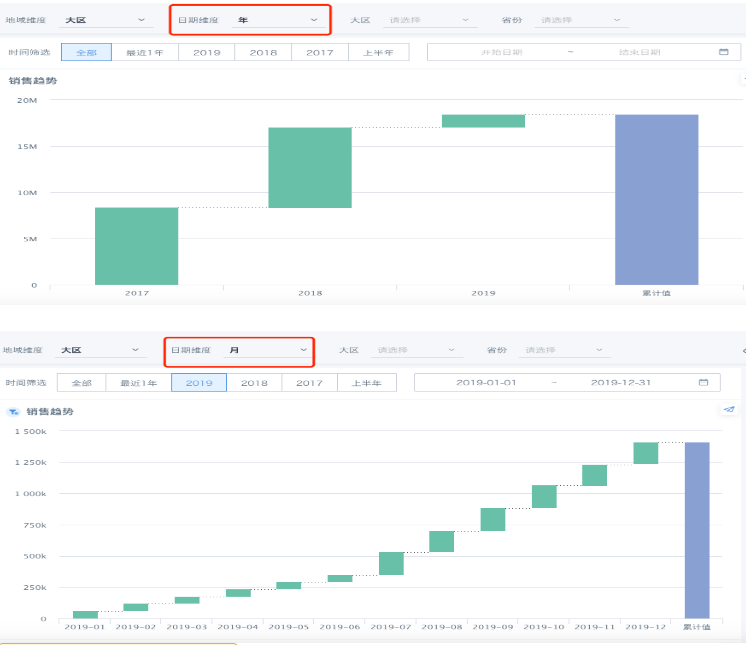
4. Return to the dashboard page. Create a parameter filter, specify the global parameter created in Step 2, and save. The filter automatically links to cards that use this global parameter. If you need to restrict the time range, create an additional date filter to link to the card. The usage effect is shown below.
Case Reference
Report requirement: the dimensions must include region and date. Region needs to switch between large region and province. Date needs to switch freely between year, month, week, and day. Cumulative sales amount also needs to be calculated based on dimension changes.
Implementation:
1. Refer to the steps above to create dynamic date dimensions and geographic dimensions.
2. To calculate cumulative sales amount, create a calculated field to specify the cumulative time dimension. If the preceding dimension is Day and you want to accumulate by month, recalculating in the next month, set the cumulative time dimension to YearMonth. To accumulate by year, set the cumulative time dimension to Year. Use a case when function to determine the cumulative time dimension. Then create another calculated field, use a window function to calculate the cumulative amount, drag it into the value area, and set the aggregation method to Maximum. For details about cumulative calculation, see Calculate Monthly Cumulative Sales Amount.
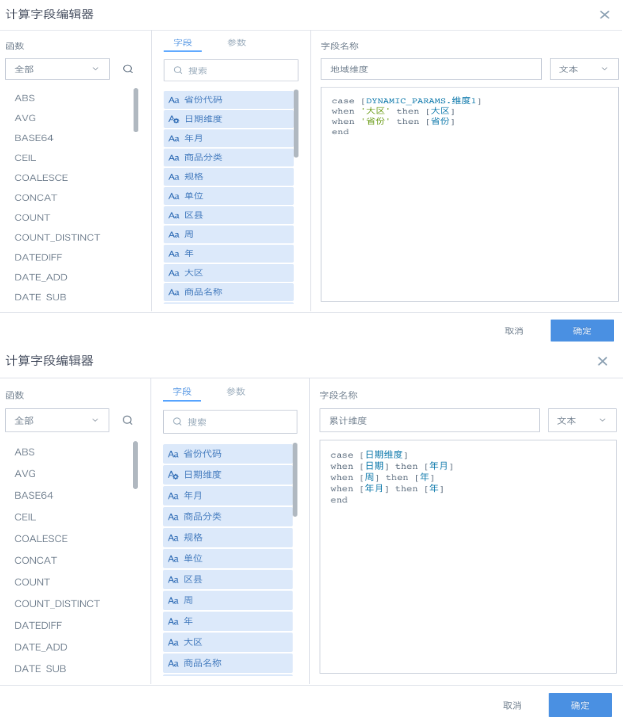
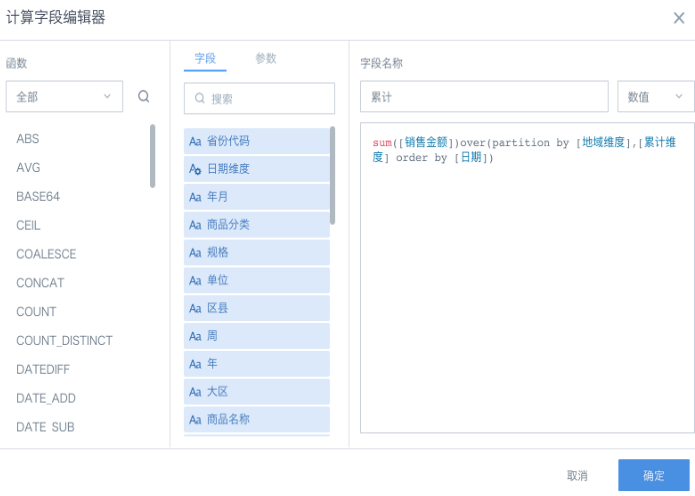
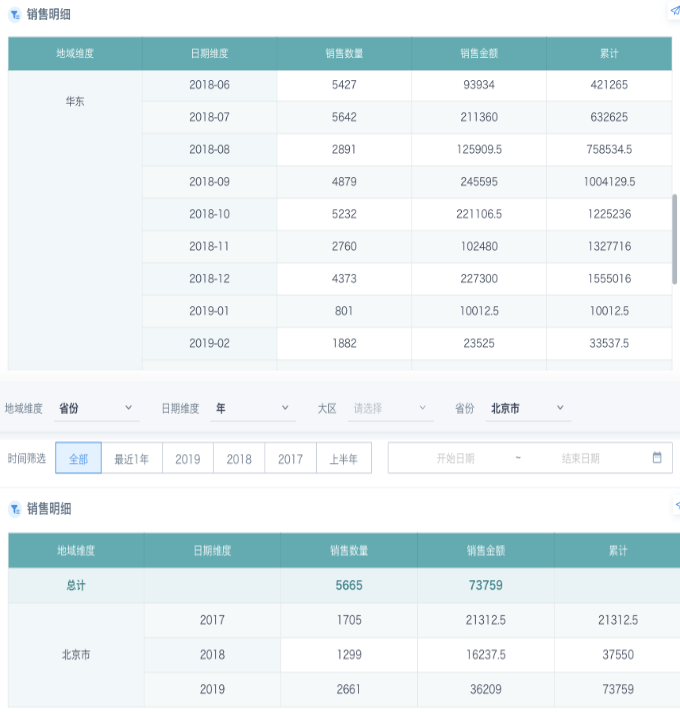
3. In addition to the parameter filter, create two selection filters to filter Large Region and Province, and configure linkage. The effect is as follows:
Note: The datasets and cards in this document are based on Guan-index extracted data or datasets created from files. The system supports Spark SQL functions by default. If you use direct datasets and direct cards, use the functions of the corresponding database.