Create and Use Indoor Maps
Scenario
A department store needs an intuitive way to display counters on different floors. It needs to show performance, sales per square meter, and other information on the floor plan to support decisions on counter layout adjustment. With linkage effects, users can also quickly locate highly related brand information.
Solution
Use indoor maps to display sales status for counters on different floors.
Implementation
Data Requirements
1)A table mapping counter codes to counter names.
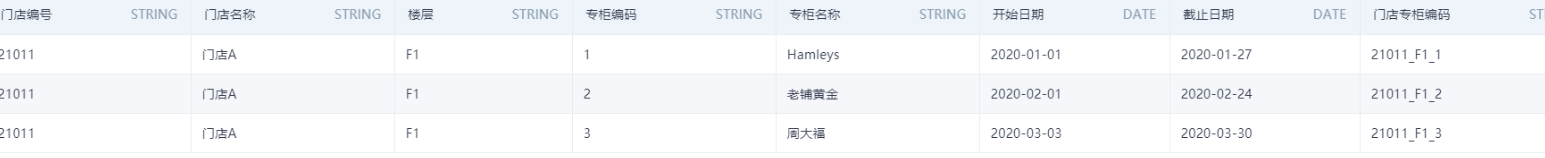
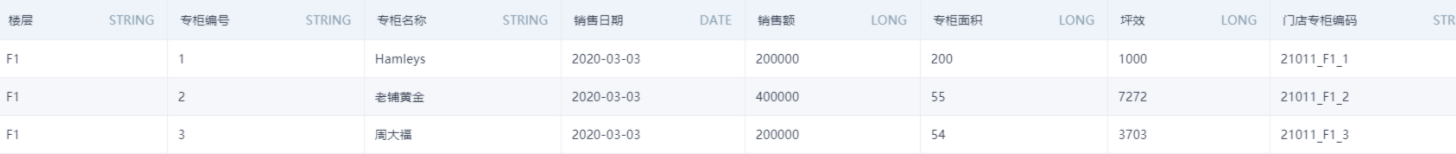
2)A sales data table for each counter in each store.
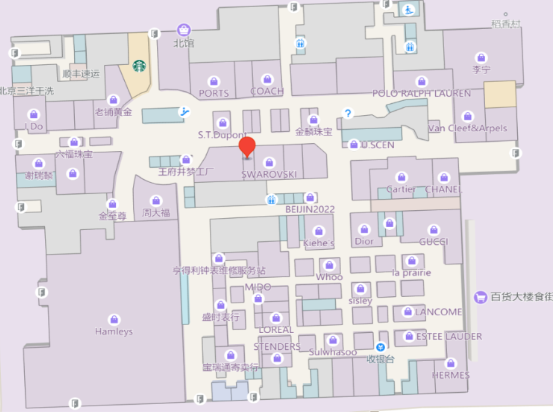
3)A floor plan of a floor that contains counter division areas. To achieve a better final effect, the clearer the map, the better the result. In addition, use a lighter background color for the base image as much as possible.
Use the Indoor Map to Associate the Two Data Tables Above, and Create One Indoor Map for Each Floor
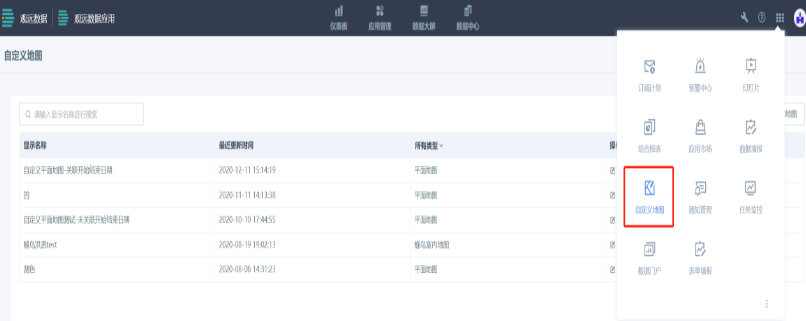
1)Indoor map creation entry: nine-grid icon -- Custom Map.
Note: If your account does not see this entry in the nine-grid menu, ask an administrator to grant your account the relevant permissions in role permission configuration.
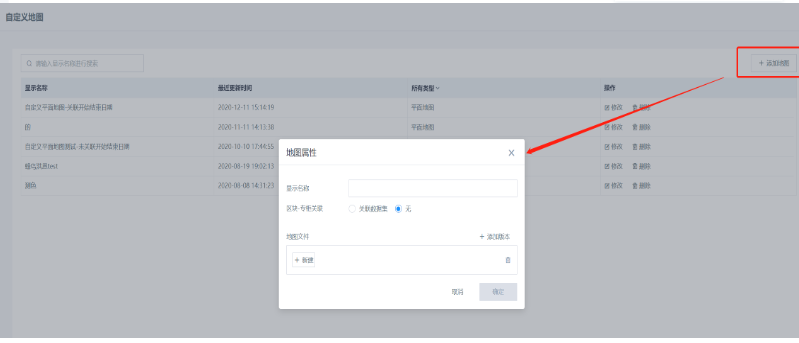
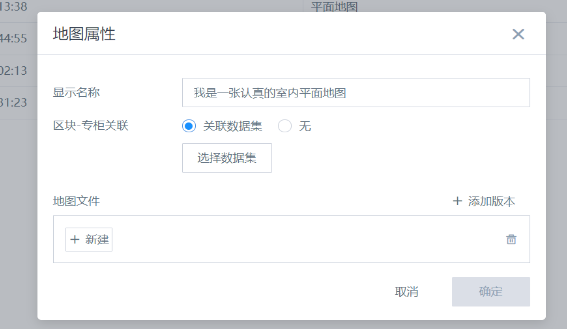
Name the map and select the associated dataset:
2)After selecting a dataset, map associated fields one by one to the fields in the table.
When associating the dataset, pay special attention to the following required fields marked with *:
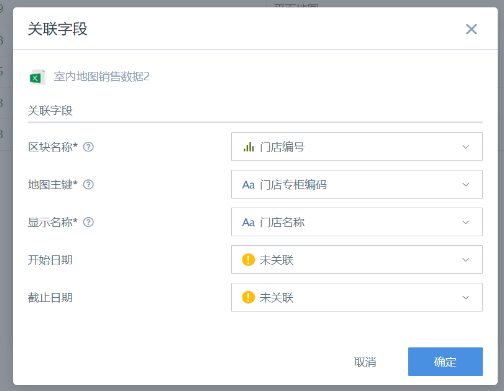
- Block Name: the Block Name in the map editing page.
- Map Primary Key: the Dimension field in the card editing page when the chart type is Floor Map.
- Display Name: the name displayed for each block when the map is finally used.
- Start Date and End Date: if the current map does not use multi-version management, these two fields do not need to be associated. If multi-version management is needed, fill in the valid time of this map here.
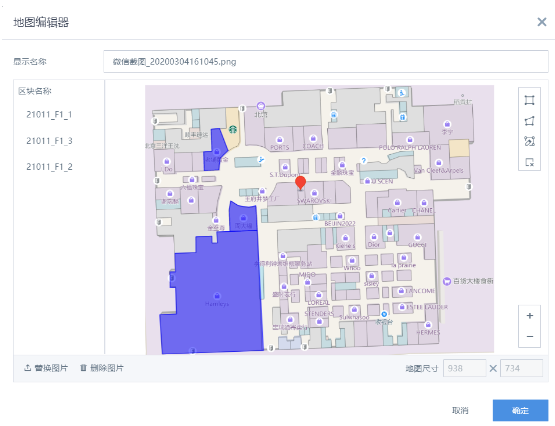
3)After the dataset is successfully associated, click New under Map File to enter the map editing page.
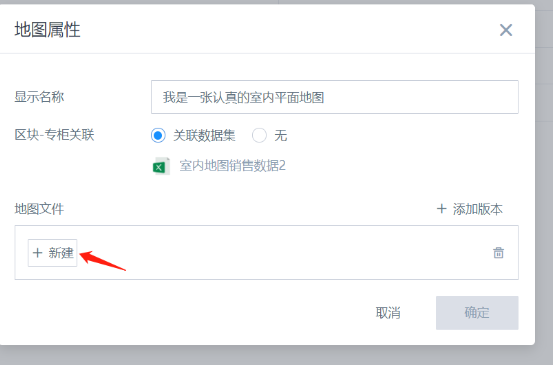
Draw the counter outline and mark the counter code as shown below. Click Confirm to save.
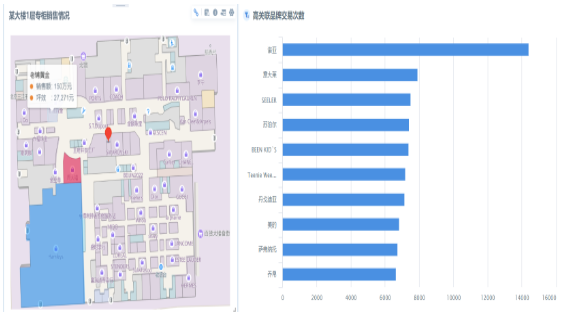
Display Counter Sales Data for All Floors of Each Store on the Dashboard
1)For Dataset, select the sales data table for each counter in each store. 2)For Dimension, select Store Counter Code. 3)Select the corresponding indoor map image.
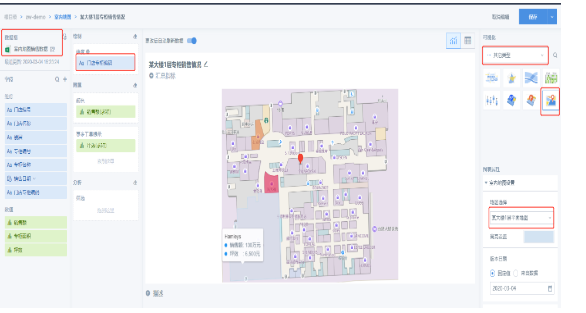
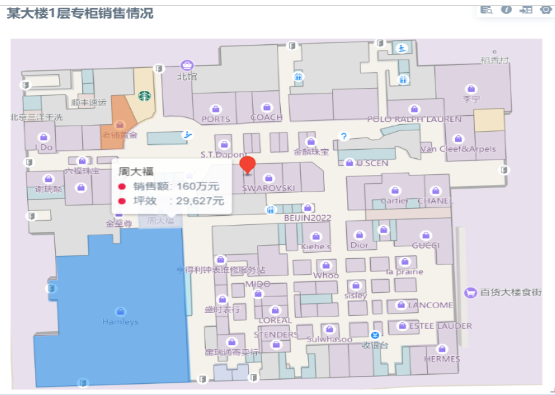
4)Finish creating the indoor map.
5)Create a highly related brand card.
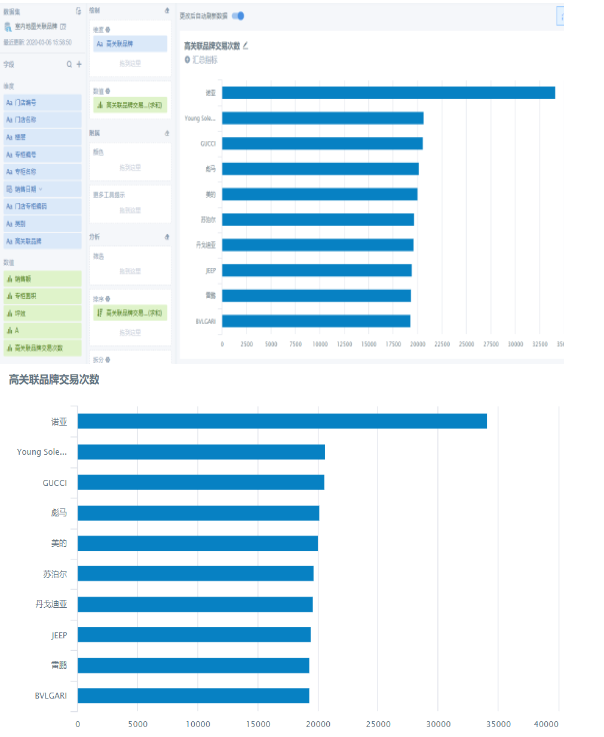
6)Create linkage between the map and highly related brands. When a counter is clicked, the transaction count of highly related brands can be viewed dynamically.
Later Updates and Maintenance
For some shopping malls, the base image changes after counter layout adjustments. Updating a floor map is very convenient. Find the original map editing entry and upload the new image. You can see that the previously drawn counter layers are retained, so only the adjusted areas need to be edited again.
Note: First, the new base image and the old image must have the same dimensions, so that the original layers can be placed in the same areas. In addition, after the base image is updated, added or removed brands require updates to the counter and brand mapping table.