Implement Dynamic Metric Display with Global Parameters
Case 1: Display Only the Sales Curve of the Selected Month by Default, and Display Multiple Metrics Simultaneously When Multiple Options Are Selected
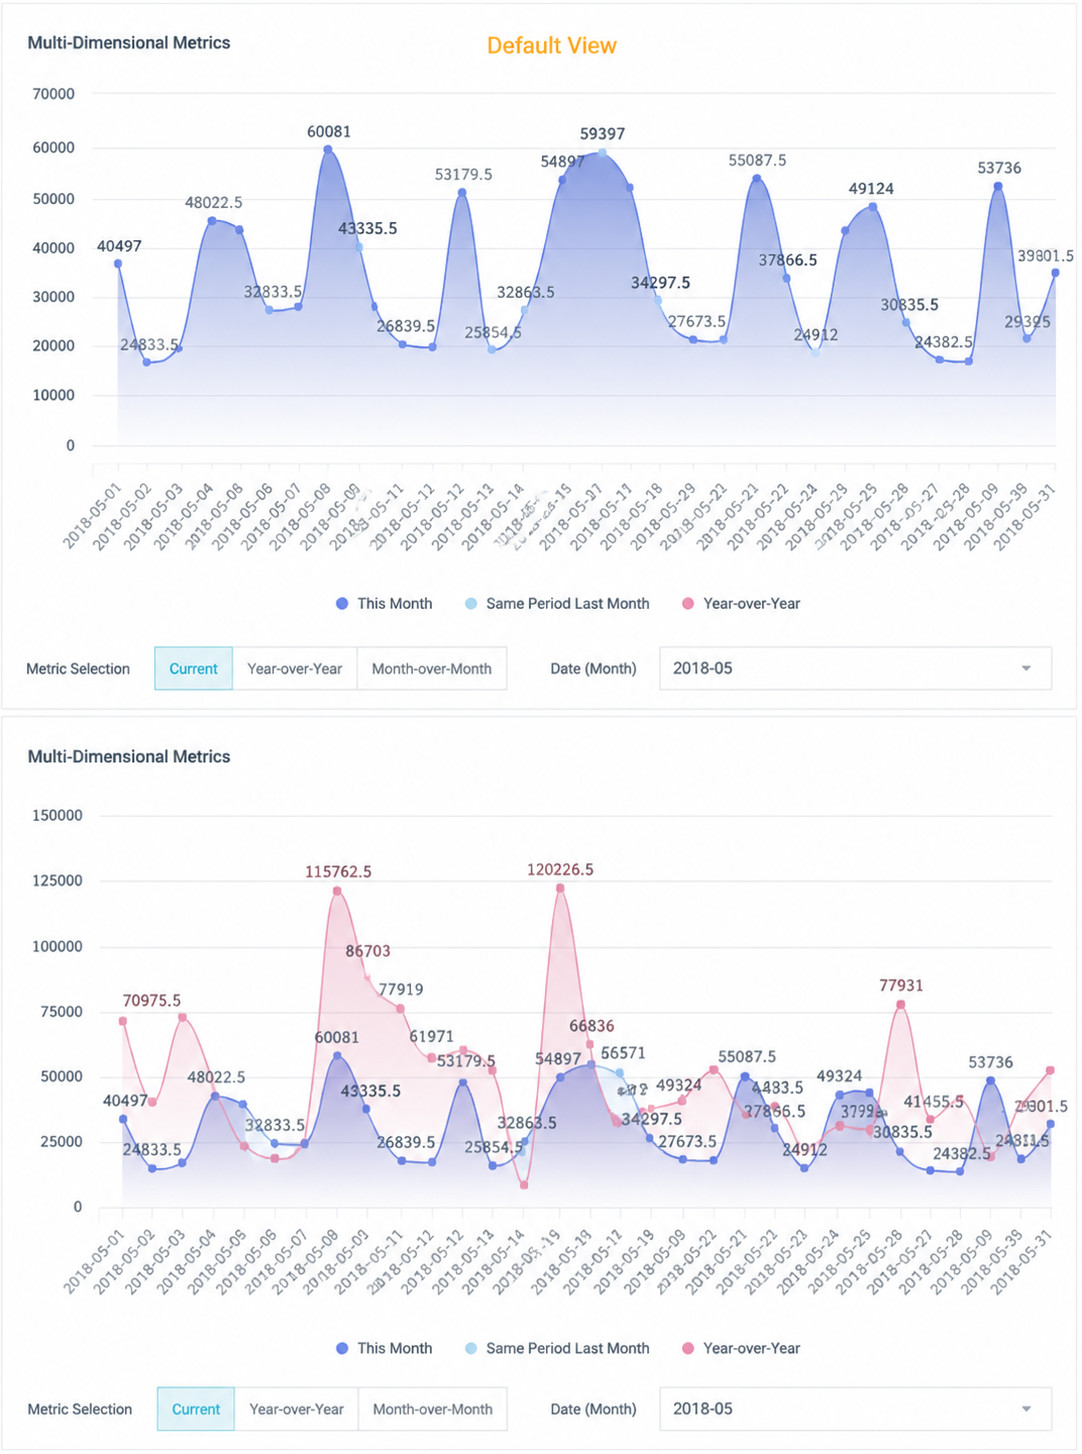
Using a multi-line chart as an example, in many cases, one line represents one metric, and multiple metrics are displayed together in the card. For example, an original multi-line chart has three lines: daily sales amount within a month, YoY sales amount, and MoM sales amount. Expected effect: by default, the card displays only the sales curve for the month selected by the filter. When multiple options are selected, multiple metrics are displayed at the same time. The expected effect is shown below.
Implementation
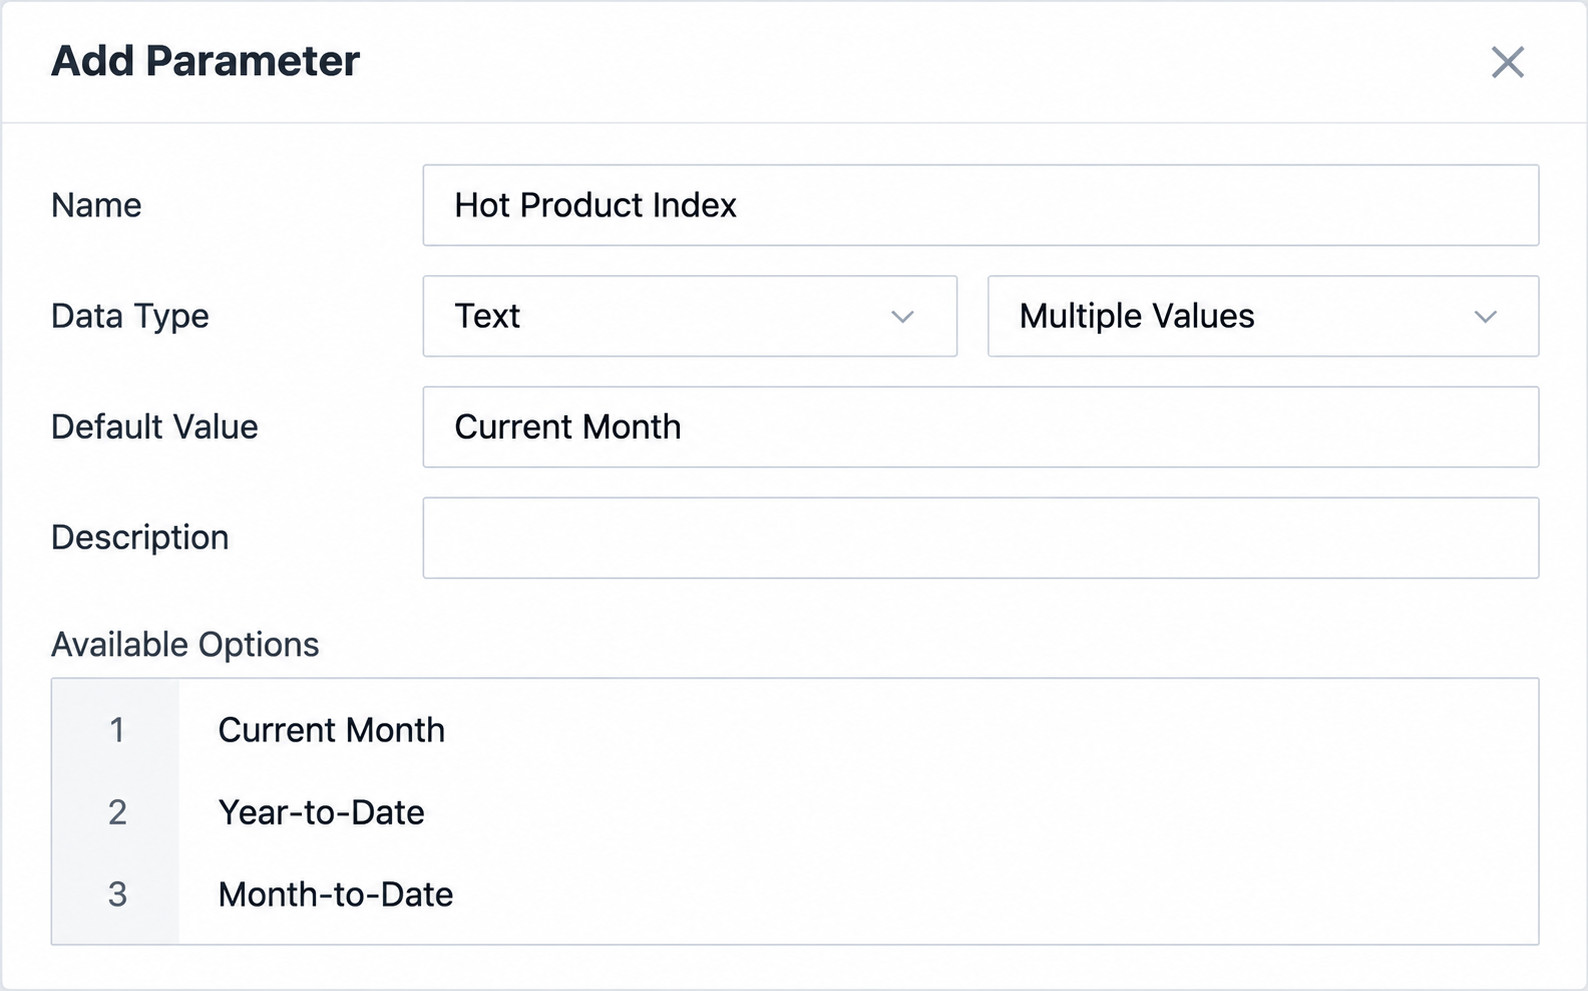
1. Create a global parameter. Set it as text - multi-value type. Set the default value to Current Month, and set optional values to Current Month, YoY, and MoM. You can also use another existing multi-value text parameter and reset the default value and optional values in the parameter filter.
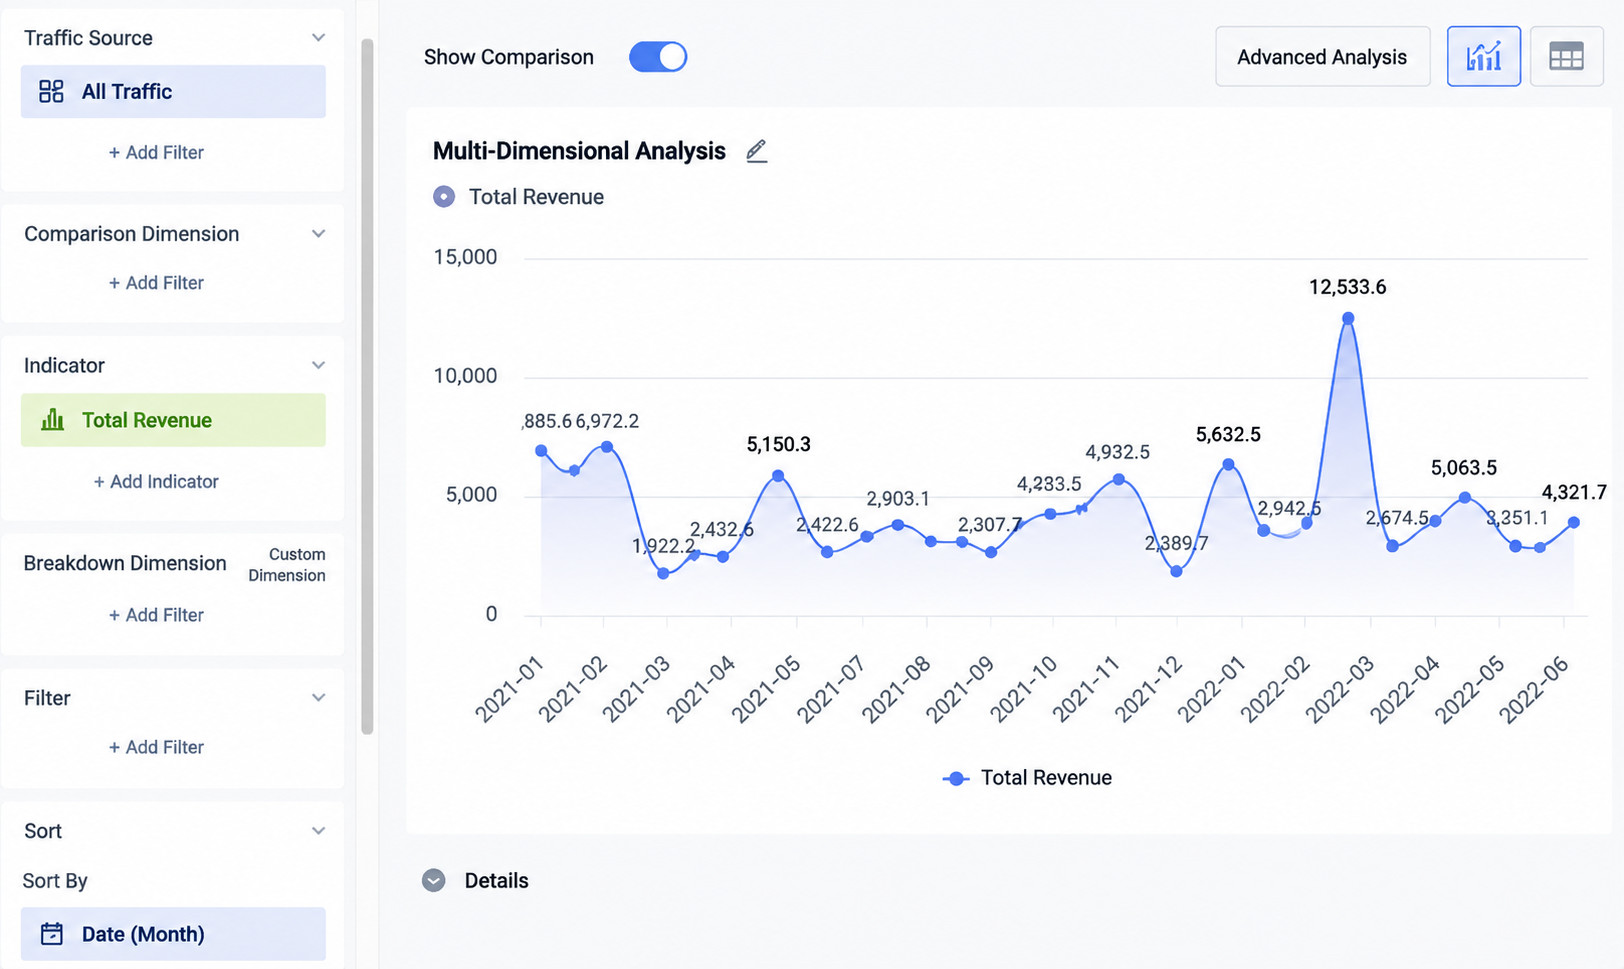
2. Create a multi-line chart. Drag the date field into the dimension area, drag Sales Amount into the value area, set the aggregation method to Sum, rename it to Current Month, drag subdate "Date (Month)" into the filter area, and select any month. The sales amount trend for Current Month is now displayed.
3. Create a calculated field named Parameter, with text type. Select the text parameter to use from the parameter list on the left. In this example, an existing text parameter is used.
Note: Multi-value text parameters cannot be directly referenced by subsequent calculated fields with complex logic. You need to create a calculated field to convert the parameter to text format before use.

4. Create two calculated fields, YoY and MoM, with numeric type. Principle: determine whether the parameter contains YoY or MoM. If it does, use the value of Sales Amount. If it does not, do not use any field value. In non-table cards, this can make the graphic invisible.

5. Drag the MoM field created in the previous step into Overlay Graphic Value - Main Axis, set the aggregation method to Sum, and configure Advanced Calculation as YoY/MoM - MoM - Comparison Value. Use the same method to set Advanced Calculation for YoY as YoY/MoM - YoY - Comparison Value. If Growth Rate is selected, we recommend placing it in Overlay Graphic Value - Secondary Axis.
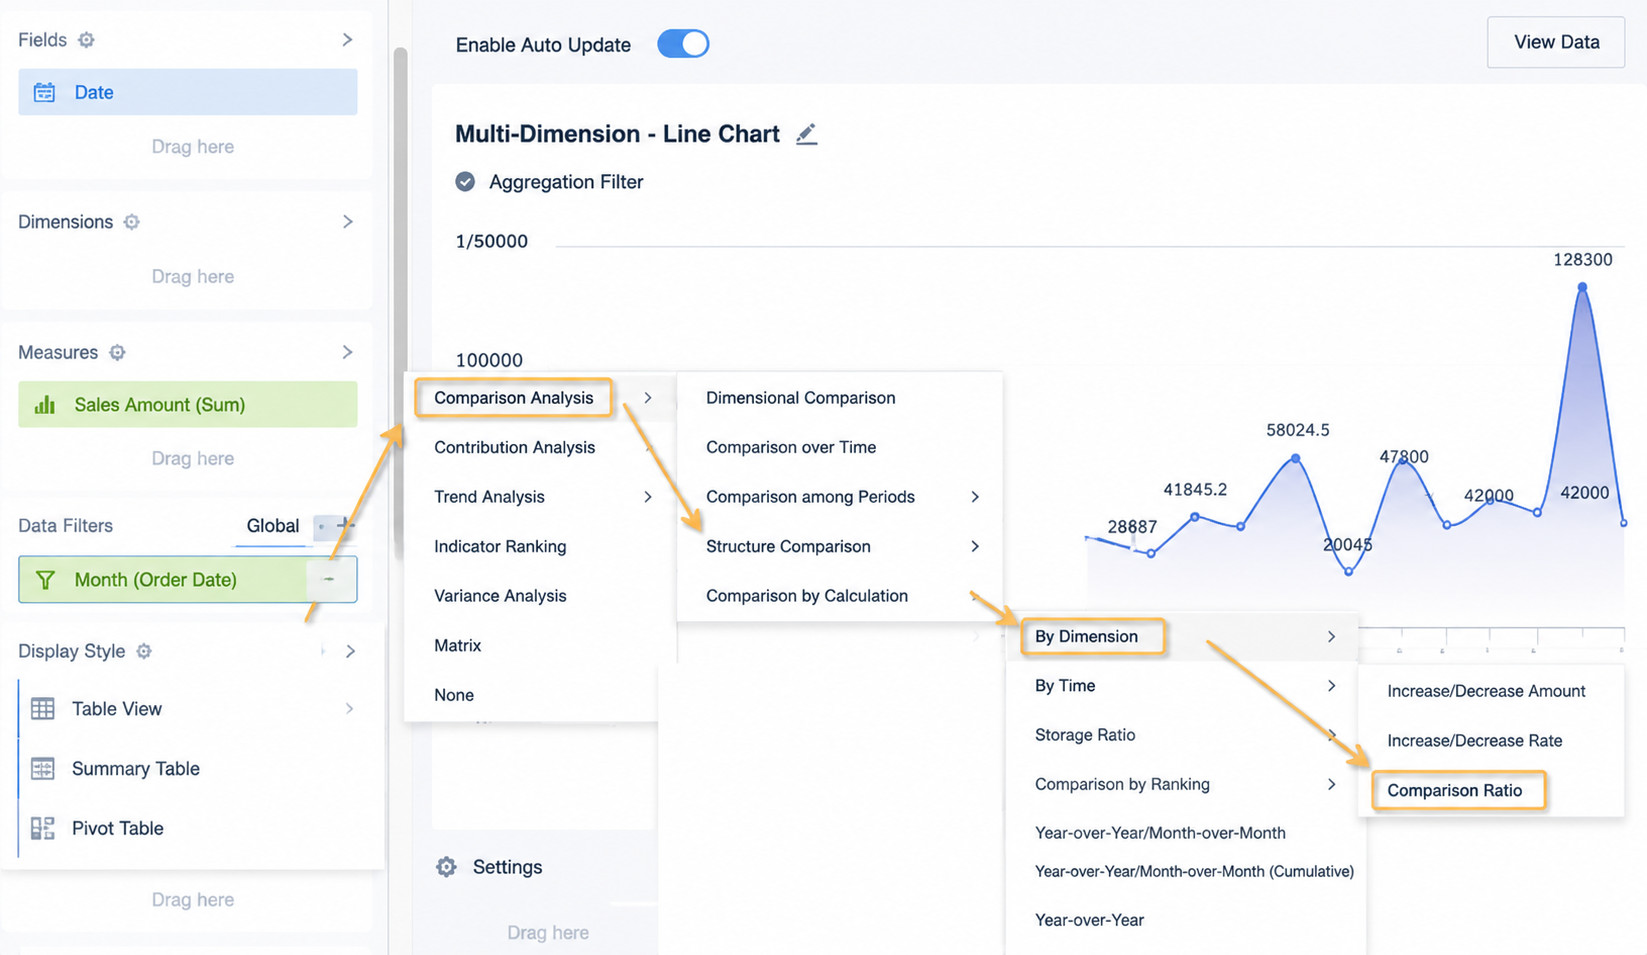
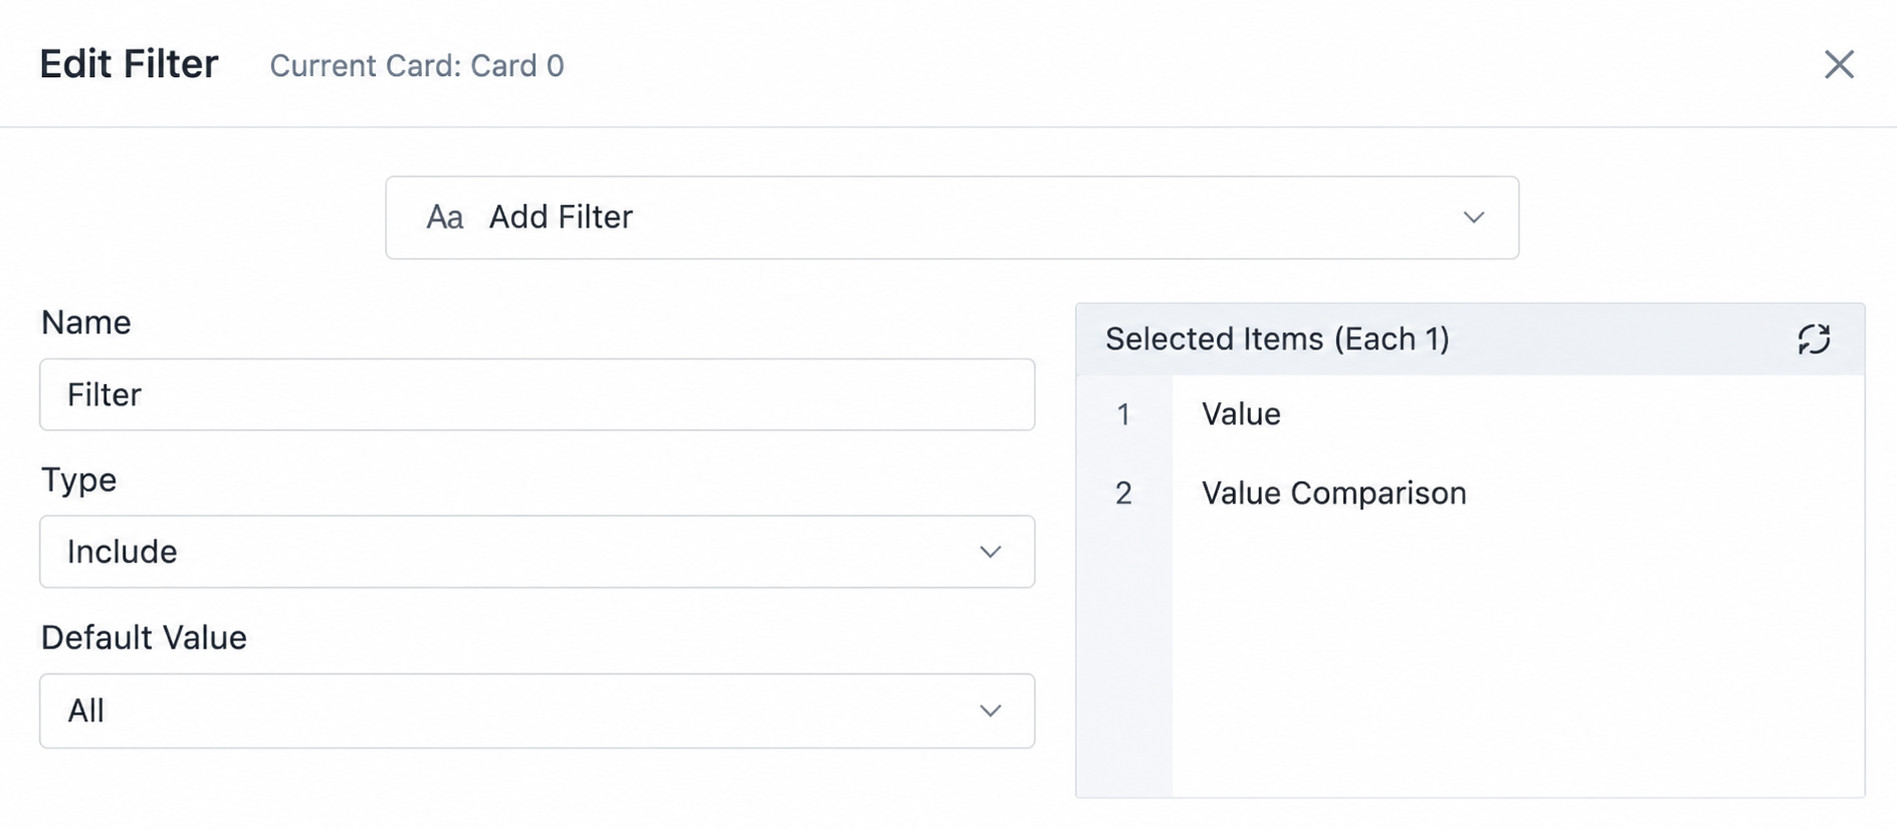
6. Save the card and return to the page where the card is located. Create a parameter filter and reference the global parameter used in the card. You can edit the default value, filter options, and style. After saving, the filter automatically links to all cards on the current page that use the same global parameter. It can also be used together with other regular filters, such as Month.
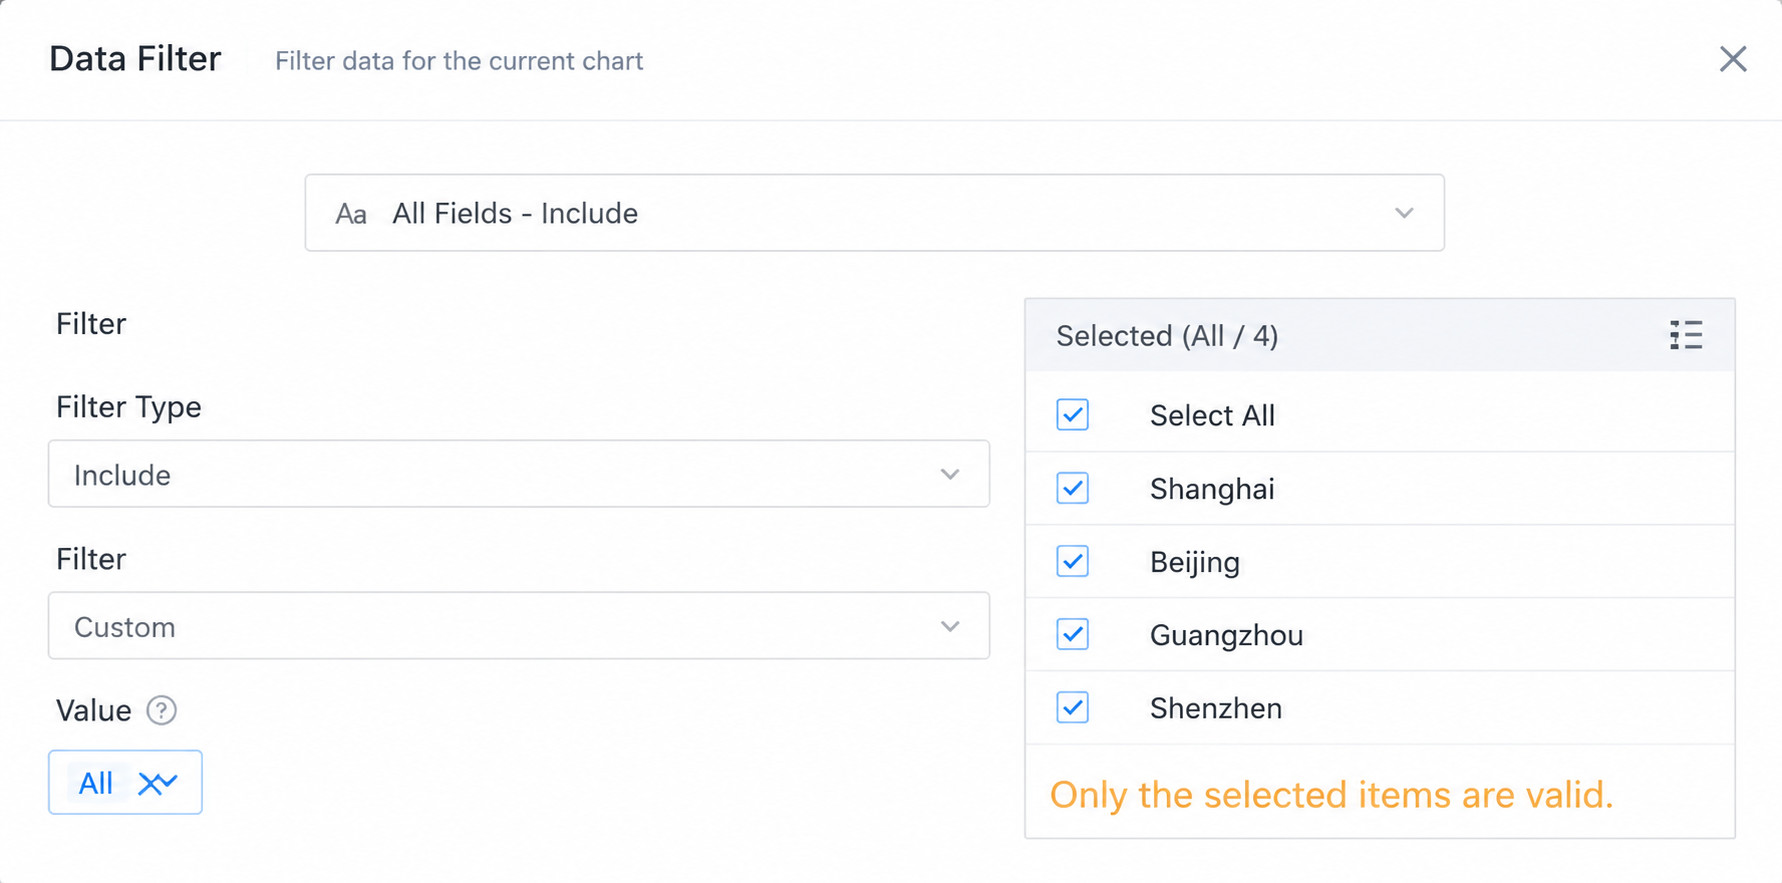
Note: Lines in a multi-line chart can be hidden, but legends cannot be hidden.
Case 2: Use a Filter to Decide Which Metric Is Displayed in a Multi-Line Chart
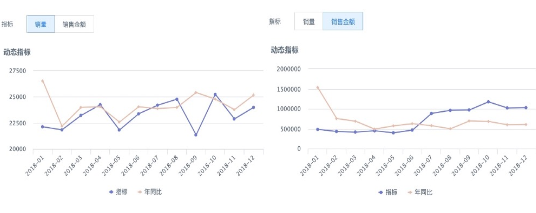
Using a multi-line chart as an example, the requirement is to use a filter to decide whether the metric displayed in the multi-line chart is Sales Amount or Sales Volume, with only one metric displayed at a time. The expected effect is as follows.
Implementation
1. Create a new single-value text parameter, or use an existing one. Optional values are Sales Volume and Sales Amount.
2. Create a multi-line chart card and drag in dimension fields as needed. Create a calculated field and use the parameter value to determine which value field to use.

3. Drag the field created in the previous step into the value area, and select an appropriate aggregation method or advanced calculation. Here, the same field is used twice: one Sum based on the date filter and one YoY. Rename the fields.
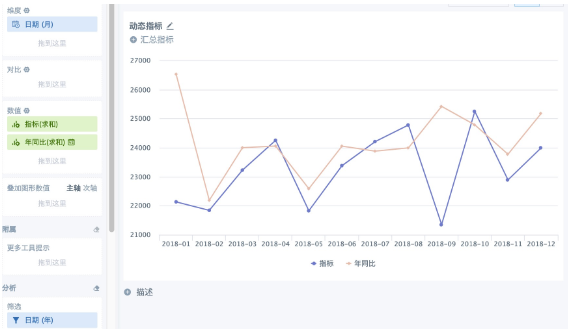
4. Save the card and return to the page where the card is located. Create a parameter filter and reference the global parameter used in the card. You can edit the default value, filter options, and style. After saving, the filter automatically links to all cards on the current page that use the same global parameter. It can also be used together with other regular filters.