Implement Complex Business Scenarios with LOD
Overview
LOD (Level of Detail) fields aggregate metrics at a specified granularity independently of the current chart dimensions. Use LOD when the same view must present both metrics at the current dimension level and metrics calculated at another level.
LOD separates the business definition of a metric from the display granularity of a chart. A chart can drill from province to city or switch from region to category, while metrics such as global sales, province sales, and annual customer sales remain calculated at their predefined granularity.
With LOD, you can:
- Fix the calculation granularity: Lock a metric to customer, year, region, or global granularity to prevent recalculation after drill-down.
- Maintain a stable benchmark: Keep the global total, parent-dimension total, or peer average in a detailed view for percentage and variance analysis.
- Add calculation granularity: Include dimensions such as category without displaying them in the chart, enabling analyses such as the maximum value within a region.
Choose an LOD type based on the following principles:
- FIXED: Locks calculations to customer, year, region, or global granularity. It is suitable for maximum values, frequency, global denominators, and regional benchmarks.
- EXCLUDE: Removes a detail dimension from the current view granularity and calculates at the parent level.
- INCLUDE: Adds a dimension to the current view granularity and then aggregates the more detailed results.
For the entry point, editor configuration, supported scope, and limitations of LOD fields, see Create New Field.
Prerequisite: Create an LOD Field
All scenarios in this document use the Sample Dataset for Complex LOD Scenarios. Download and upload the file to reproduce the scenarios.
Before proceeding, make sure you know how to perform these common operations:
- On the card editing page, click + next to the dataset field area and select Create LOD Field.
- Configure the field name, LOD type (FIXED, INCLUDE, or EXCLUDE), specified dimensions, and calculation.
- Verify the Expression Preview on the right, and click OK.
- Drag the generated LOD field to the Values area, or combine it with other fields in a calculated field.
- FIXED can have no specified dimension, which means it calculates over the global scope.
- INCLUDE and EXCLUDE require at least one specified dimension.
- An LOD field is numeric and can be nested in or combined with a calculated field.
- A card can use multiple LOD fields. Each field is calculated independently at its defined granularity.
- After creating an LOD field, add or remove chart dimensions to verify that the metric retains the expected definition.
General Procedure for Creating LOD Fields
- Define the business granularity: Determine the dimension level at which the metric should be calculated before deciding how the chart displays it. Use FIXED to lock dimensions, INCLUDE to add a calculation dimension, and EXCLUDE to remove a dimension.
- Create an LOD field: On the card editing page, click + > Create LOD Field, enter a field name, select the LOD type, specify dimensions, and configure the calculation.
- Verify the expression preview: Ensure that the preview matches the business logic, for example,
{ FIXED [Region]: AVG([Sales]) }. - Combine fields (optional): To calculate a percentage, variance, or count, use the LOD field in a new calculated field.
- Add fields to the drawing area: Drag dimensions and the LOD field, or a calculated field based on it, to the corresponding drawing areas. Adjust the display format and save the card.
Fixed Calculation Granularity (FIXED)
FIXED locks a metric to the specified dimensions, regardless of the current chart dimensions. It is suitable for stable business definitions such as annual customer sales, annual purchase frequency, and global sales.
Scenario 1: Maximum Annual Sales per Customer
Business Requirement
First aggregate sales by Customer ID × Year, and then calculate the maximum annual sales for each customer.
Business Value
This metric helps evaluate a customer's historical annual sales peak and compare current-year sales with that peak for customer segmentation, target setting, and performance reviews.
Recommended LOD Expression
{ FIXED [Customer ID]: MAX({ FIXED [Customer ID], [Date (Year)]: SUM([Sales]) }) }
Logic:
- The inner
FIXED [Customer ID], [Date (Year)]calculates annual sales for each customer. - The outer
FIXED [Customer ID]returns the maximum of those annual totals for each customer.
Procedure
-
Create the annual-granularity field "Date (Year)"
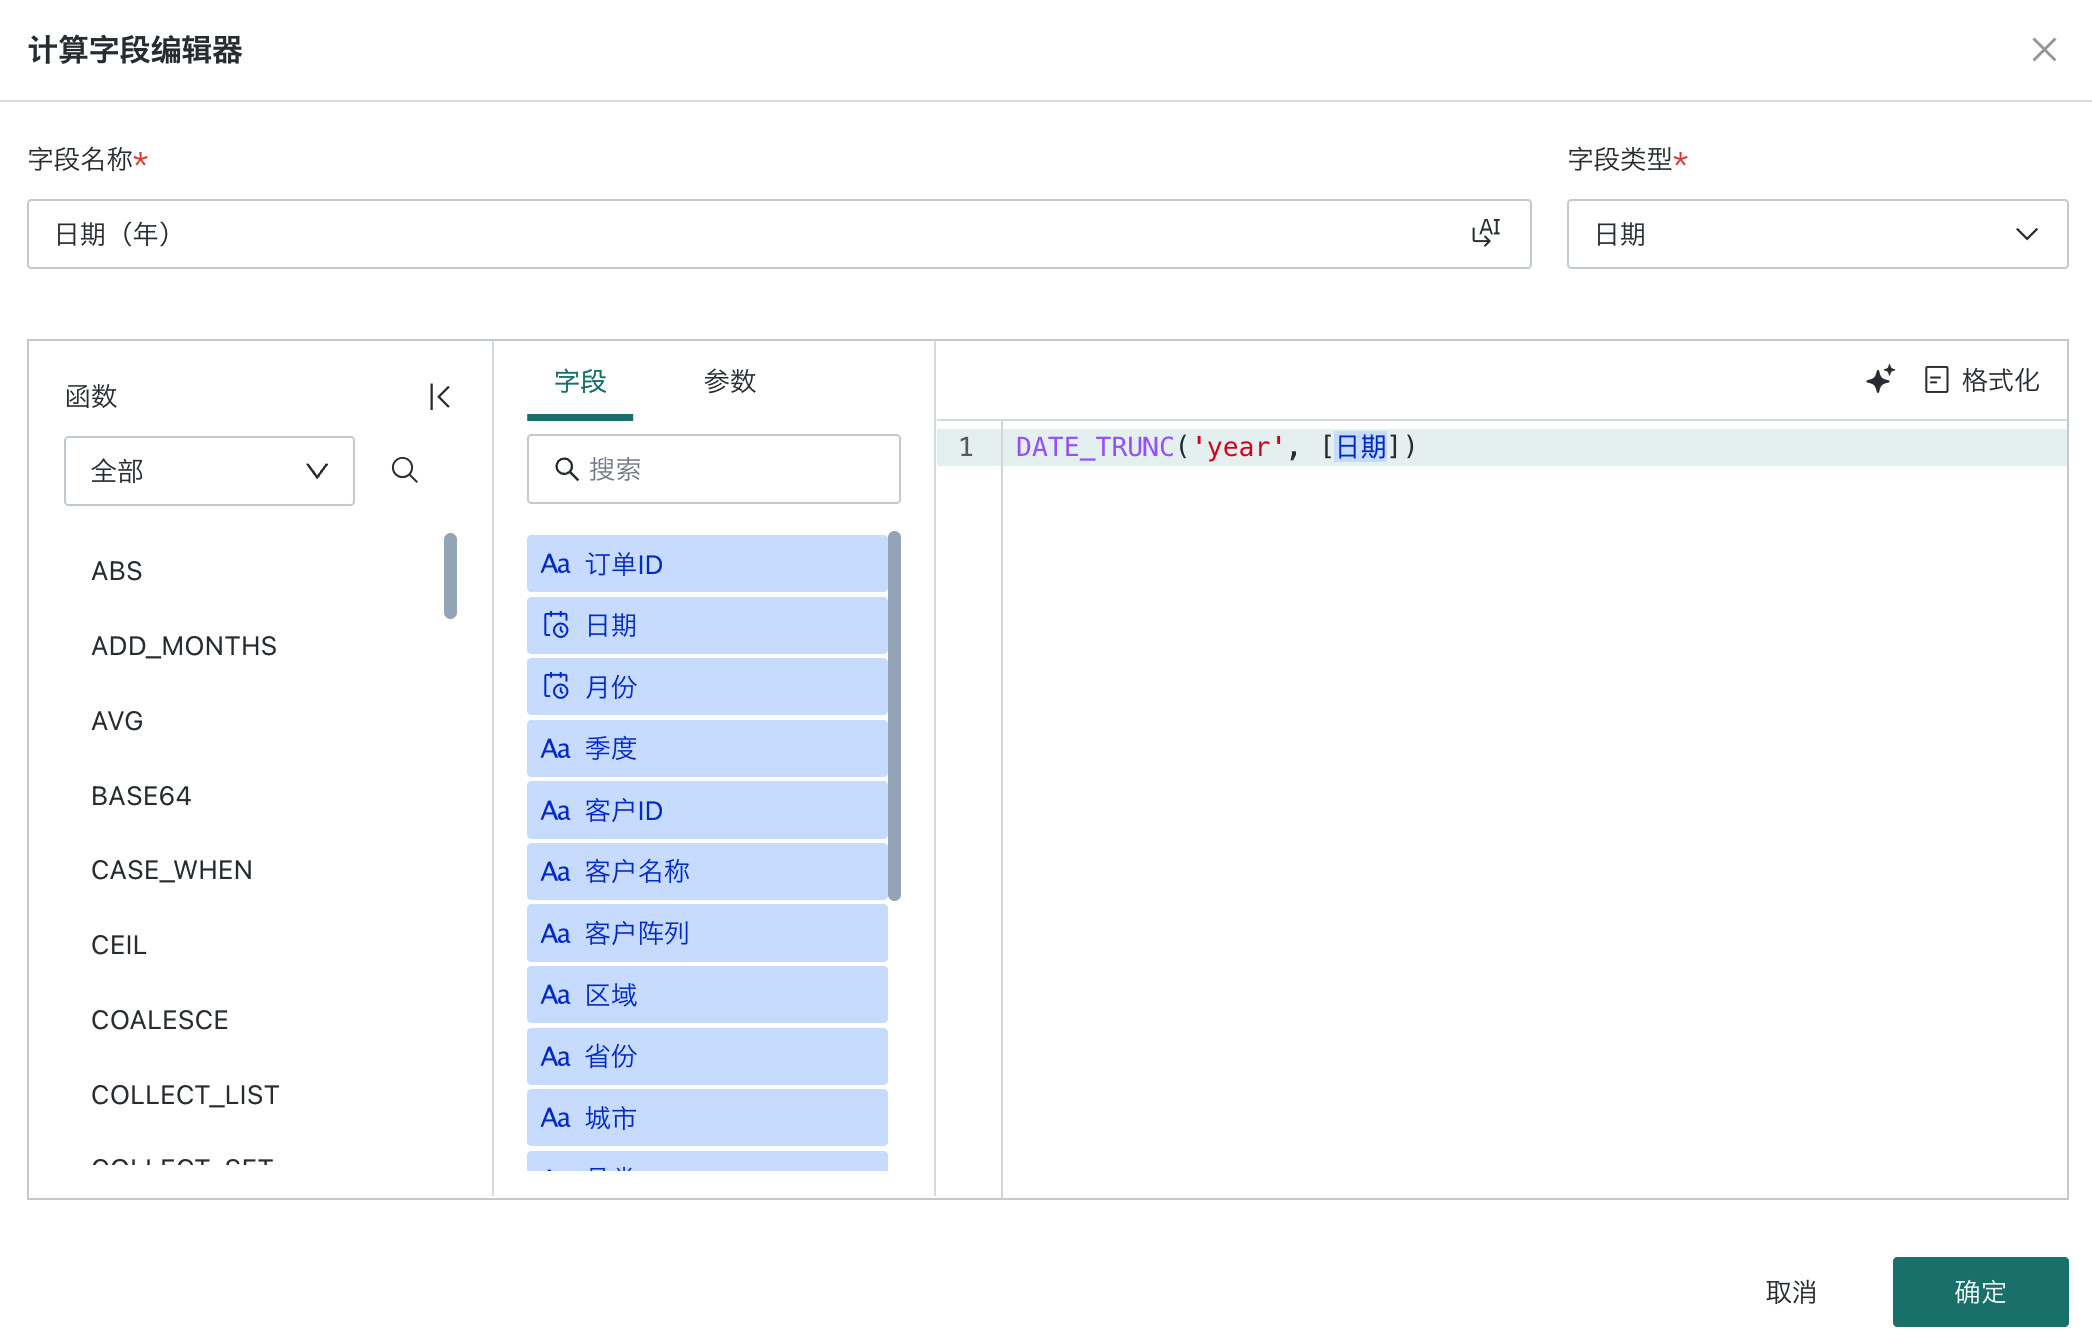
Click + > Create Calculated Field in the field area and configure:
- Field name:
Date (Year) - Field type:
Date - Formula:
DATE_TRUNC('year', [Date])
The formula converts every date in a year to the first day of that year. For example, both
2024-03-15and2024-12-31return2024-01-01, so the field can be used as an annual LOD dimension.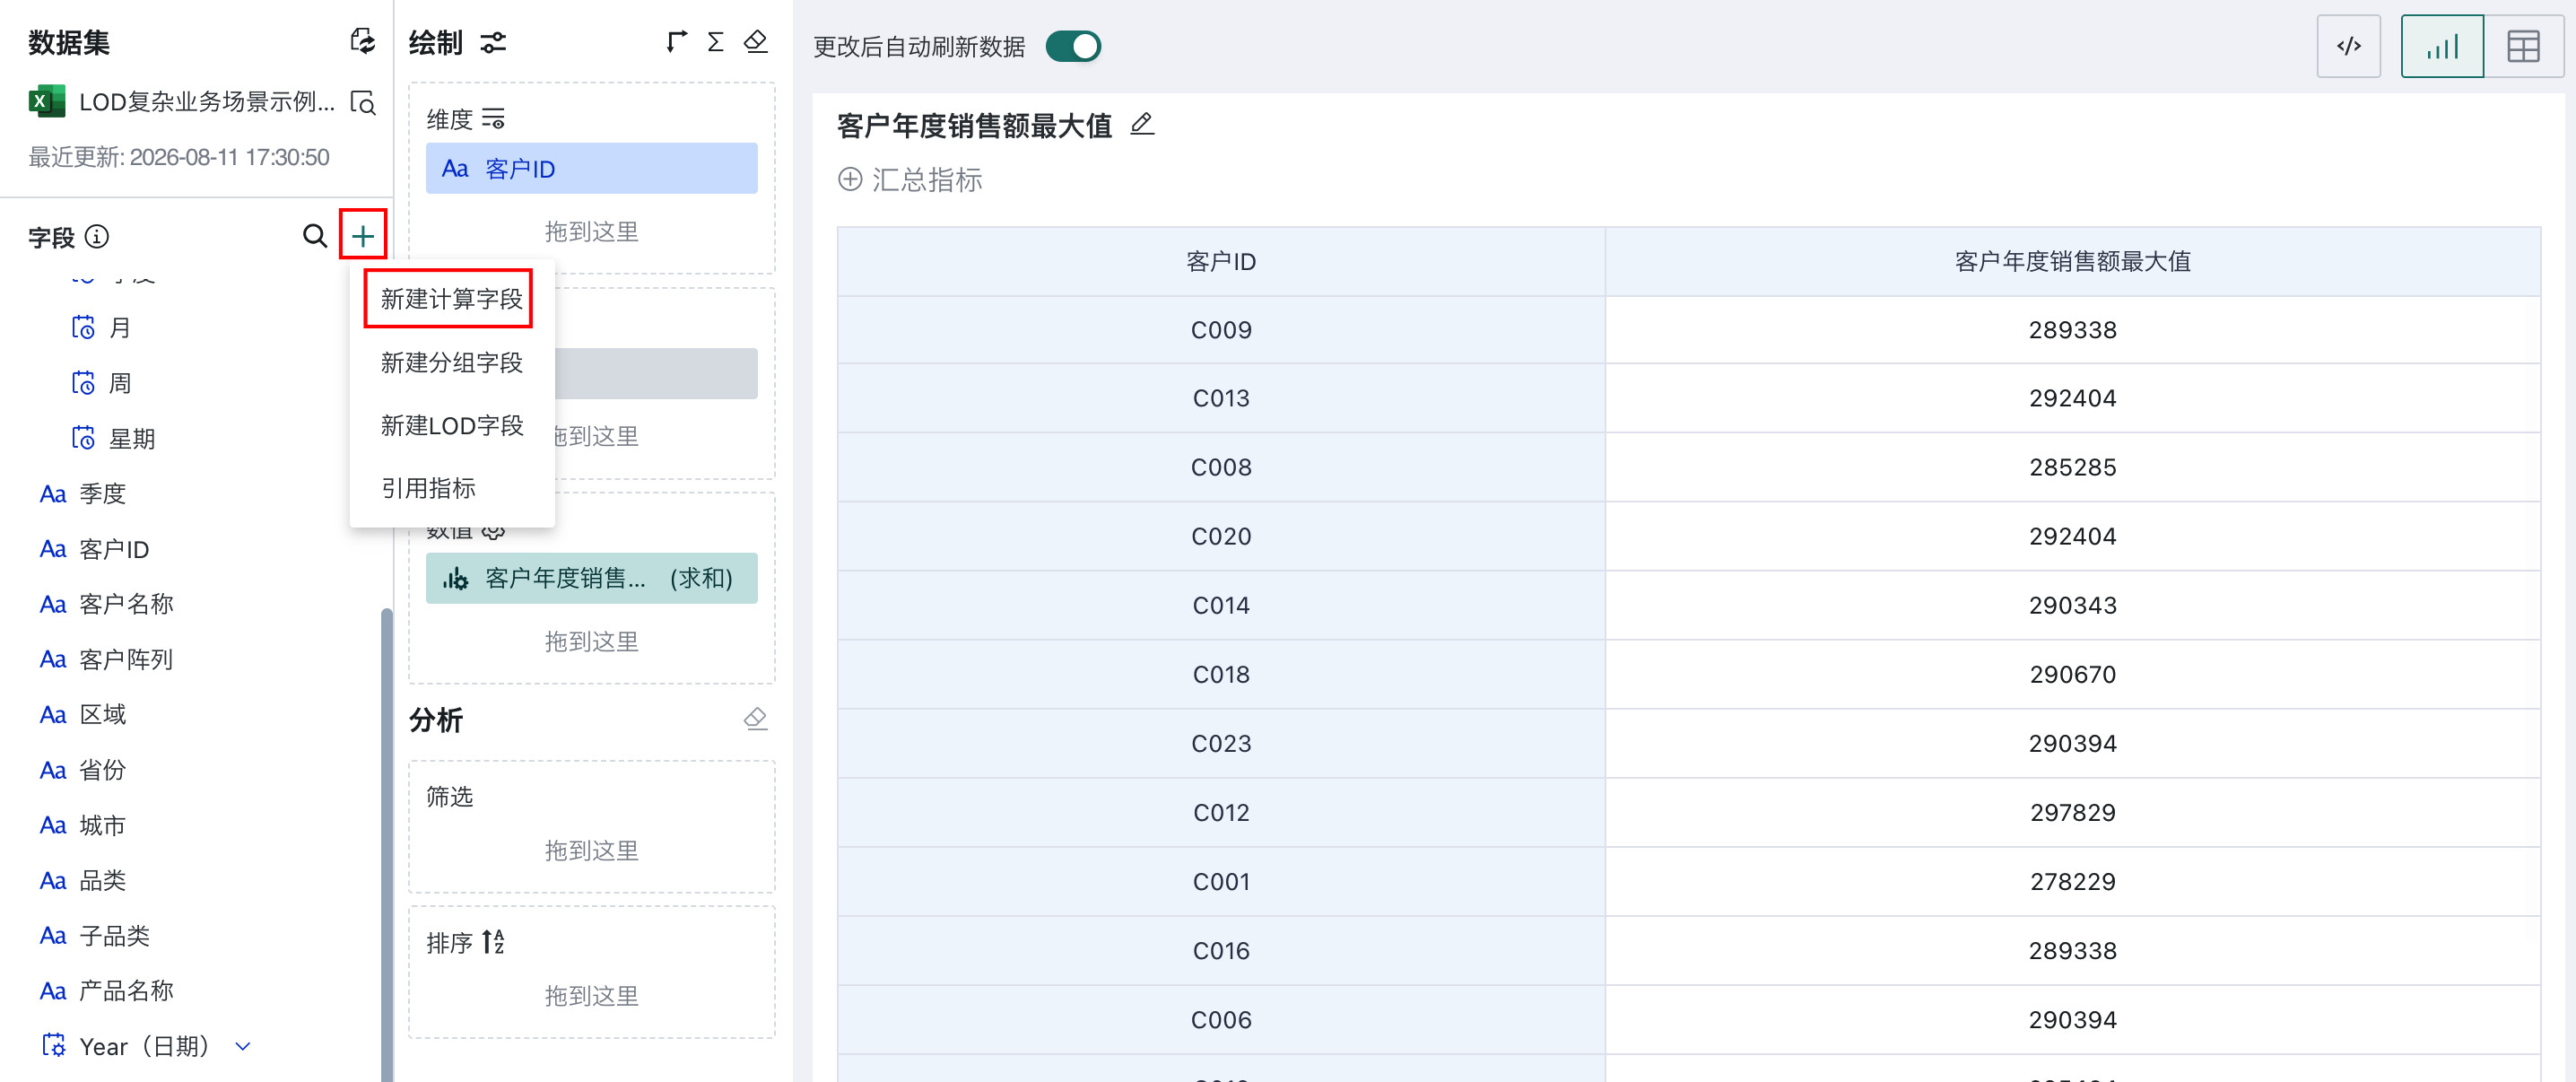
- Field name:
-
Create the nested LOD field "Maximum Annual Customer Sales"
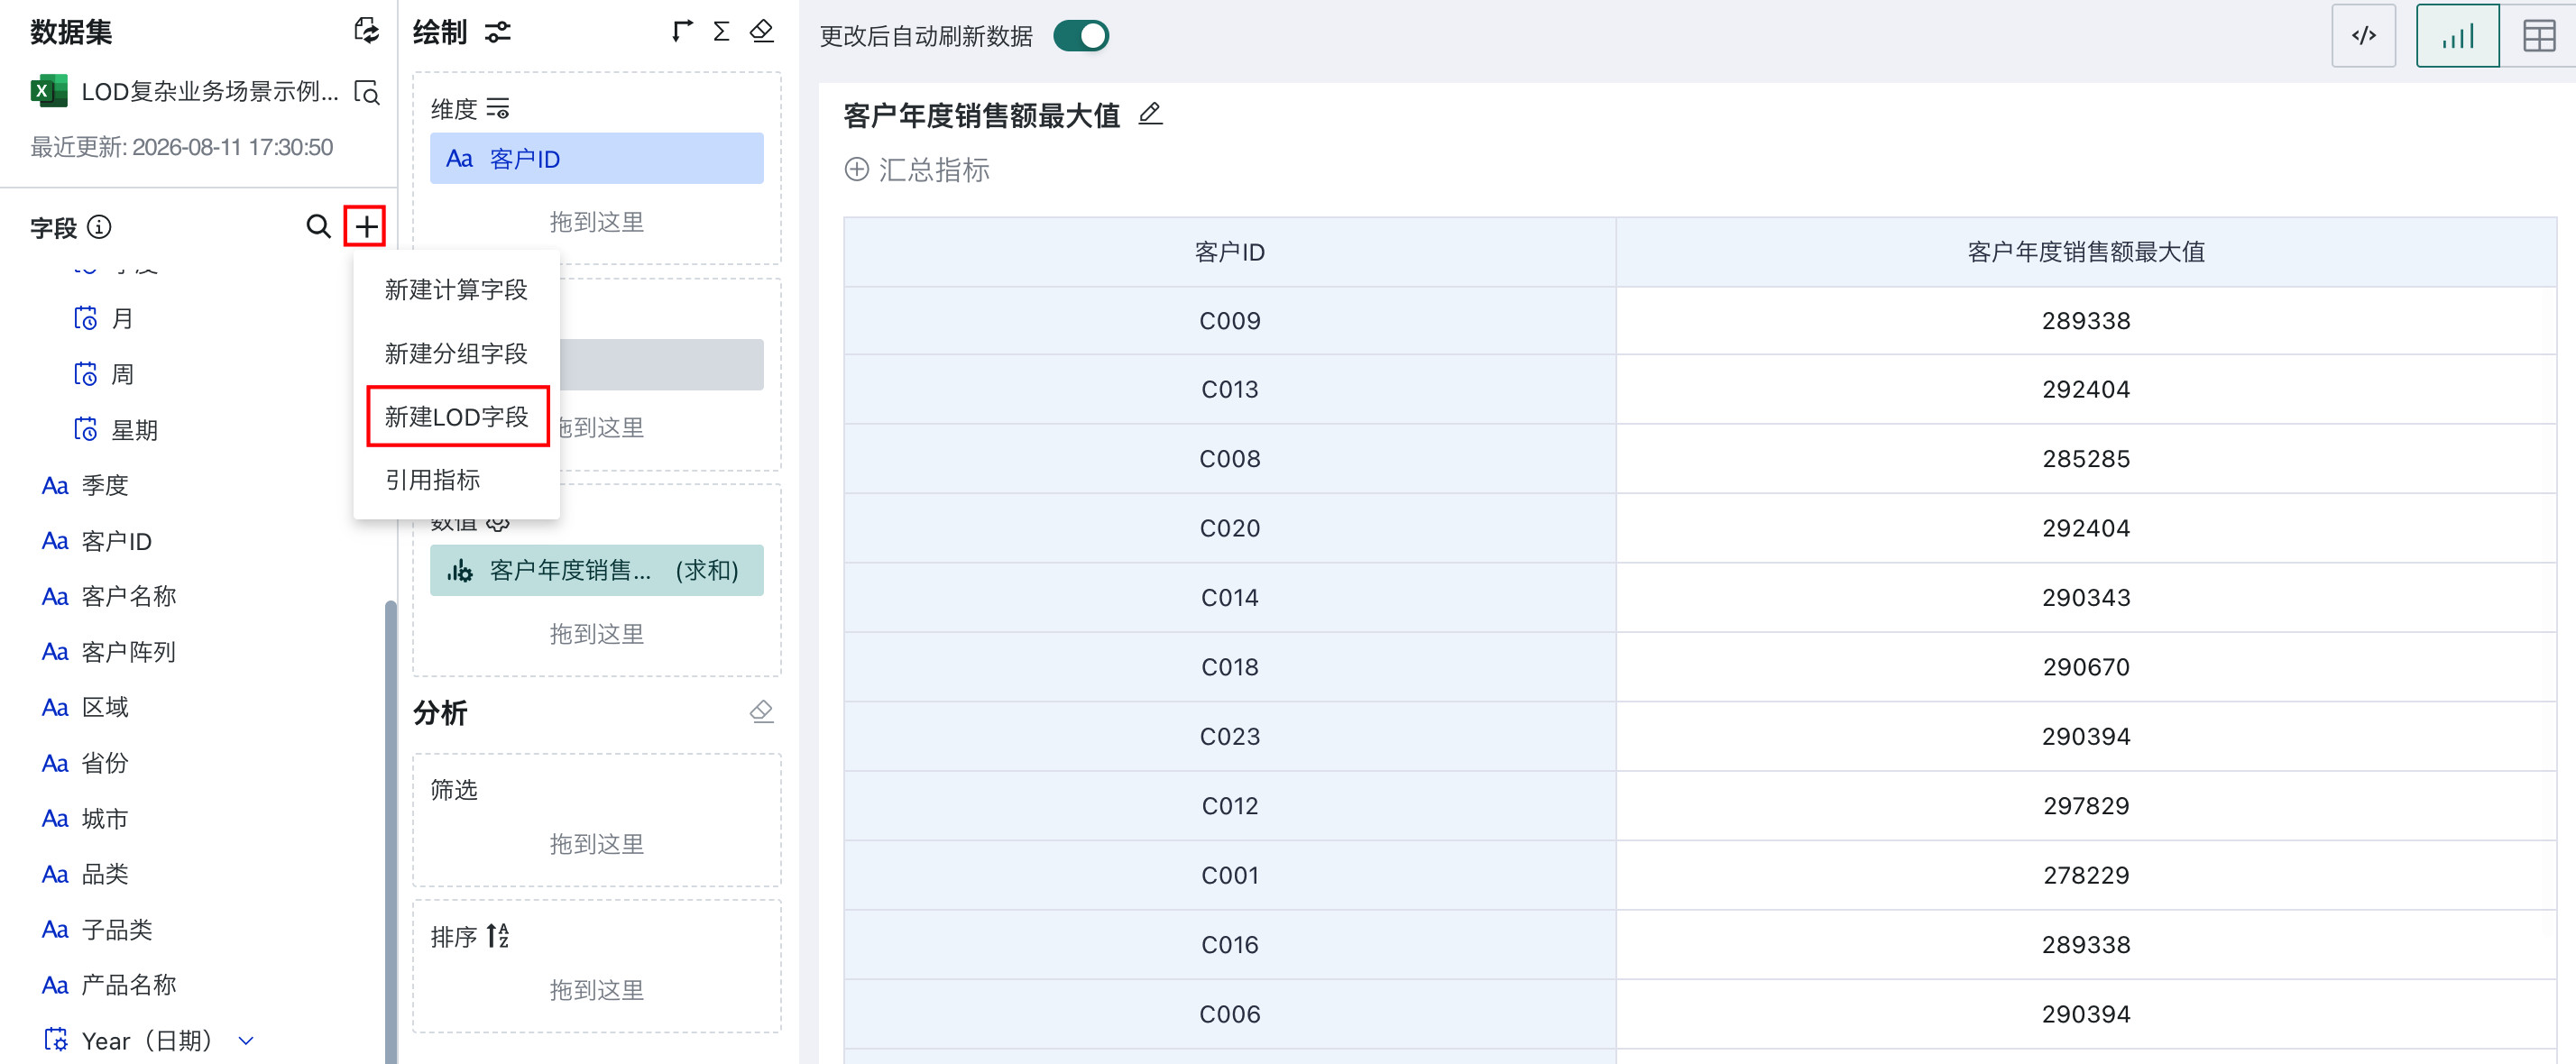
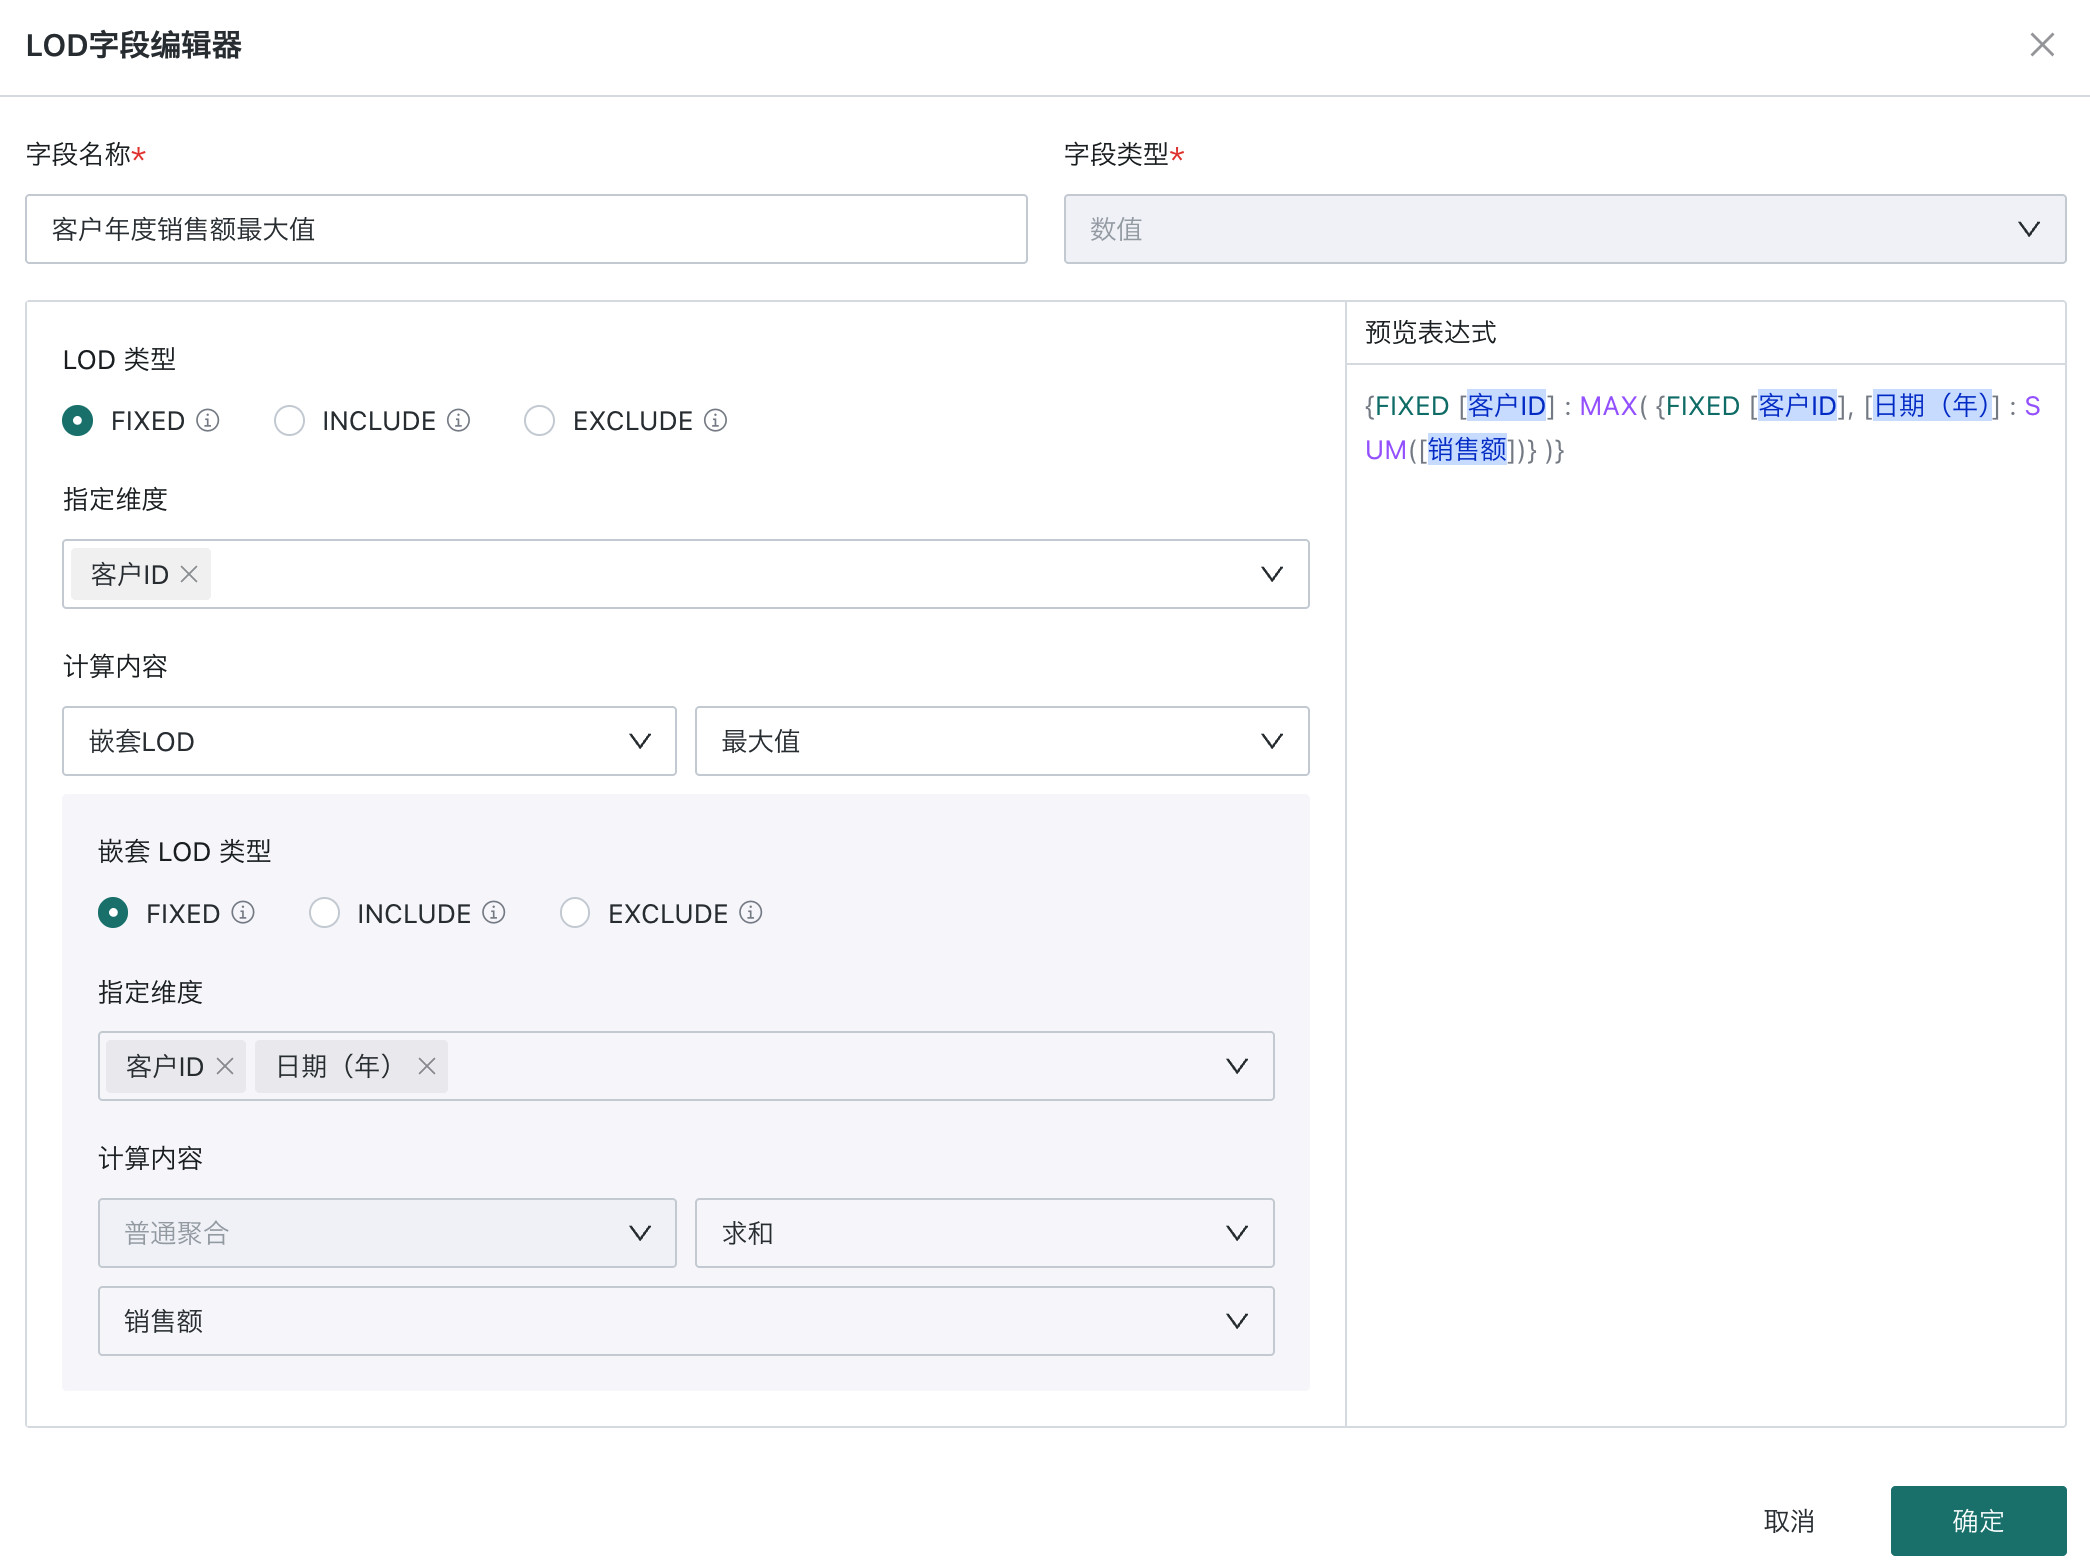
- Click + > Create LOD Field and enter
Maximum Annual Customer Sales. - For the outer LOD, select FIXED, specify Customer ID, select Nested LOD, and use Maximum as the aggregation.
- For the inner LOD, select FIXED, specify Customer ID and Date (Year), and select Standard Aggregation > Sum > Sales.
- Verify the preview expression and click OK.
- Click + > Create LOD Field and enter
-
Create the chart
- Drag Customer ID to the Dimensions area.
- Drag Date (Year) to the Dimensions area to verify the LOD calculation granularity.
- Drag Maximum Annual Customer Sales to the Values area.
Result
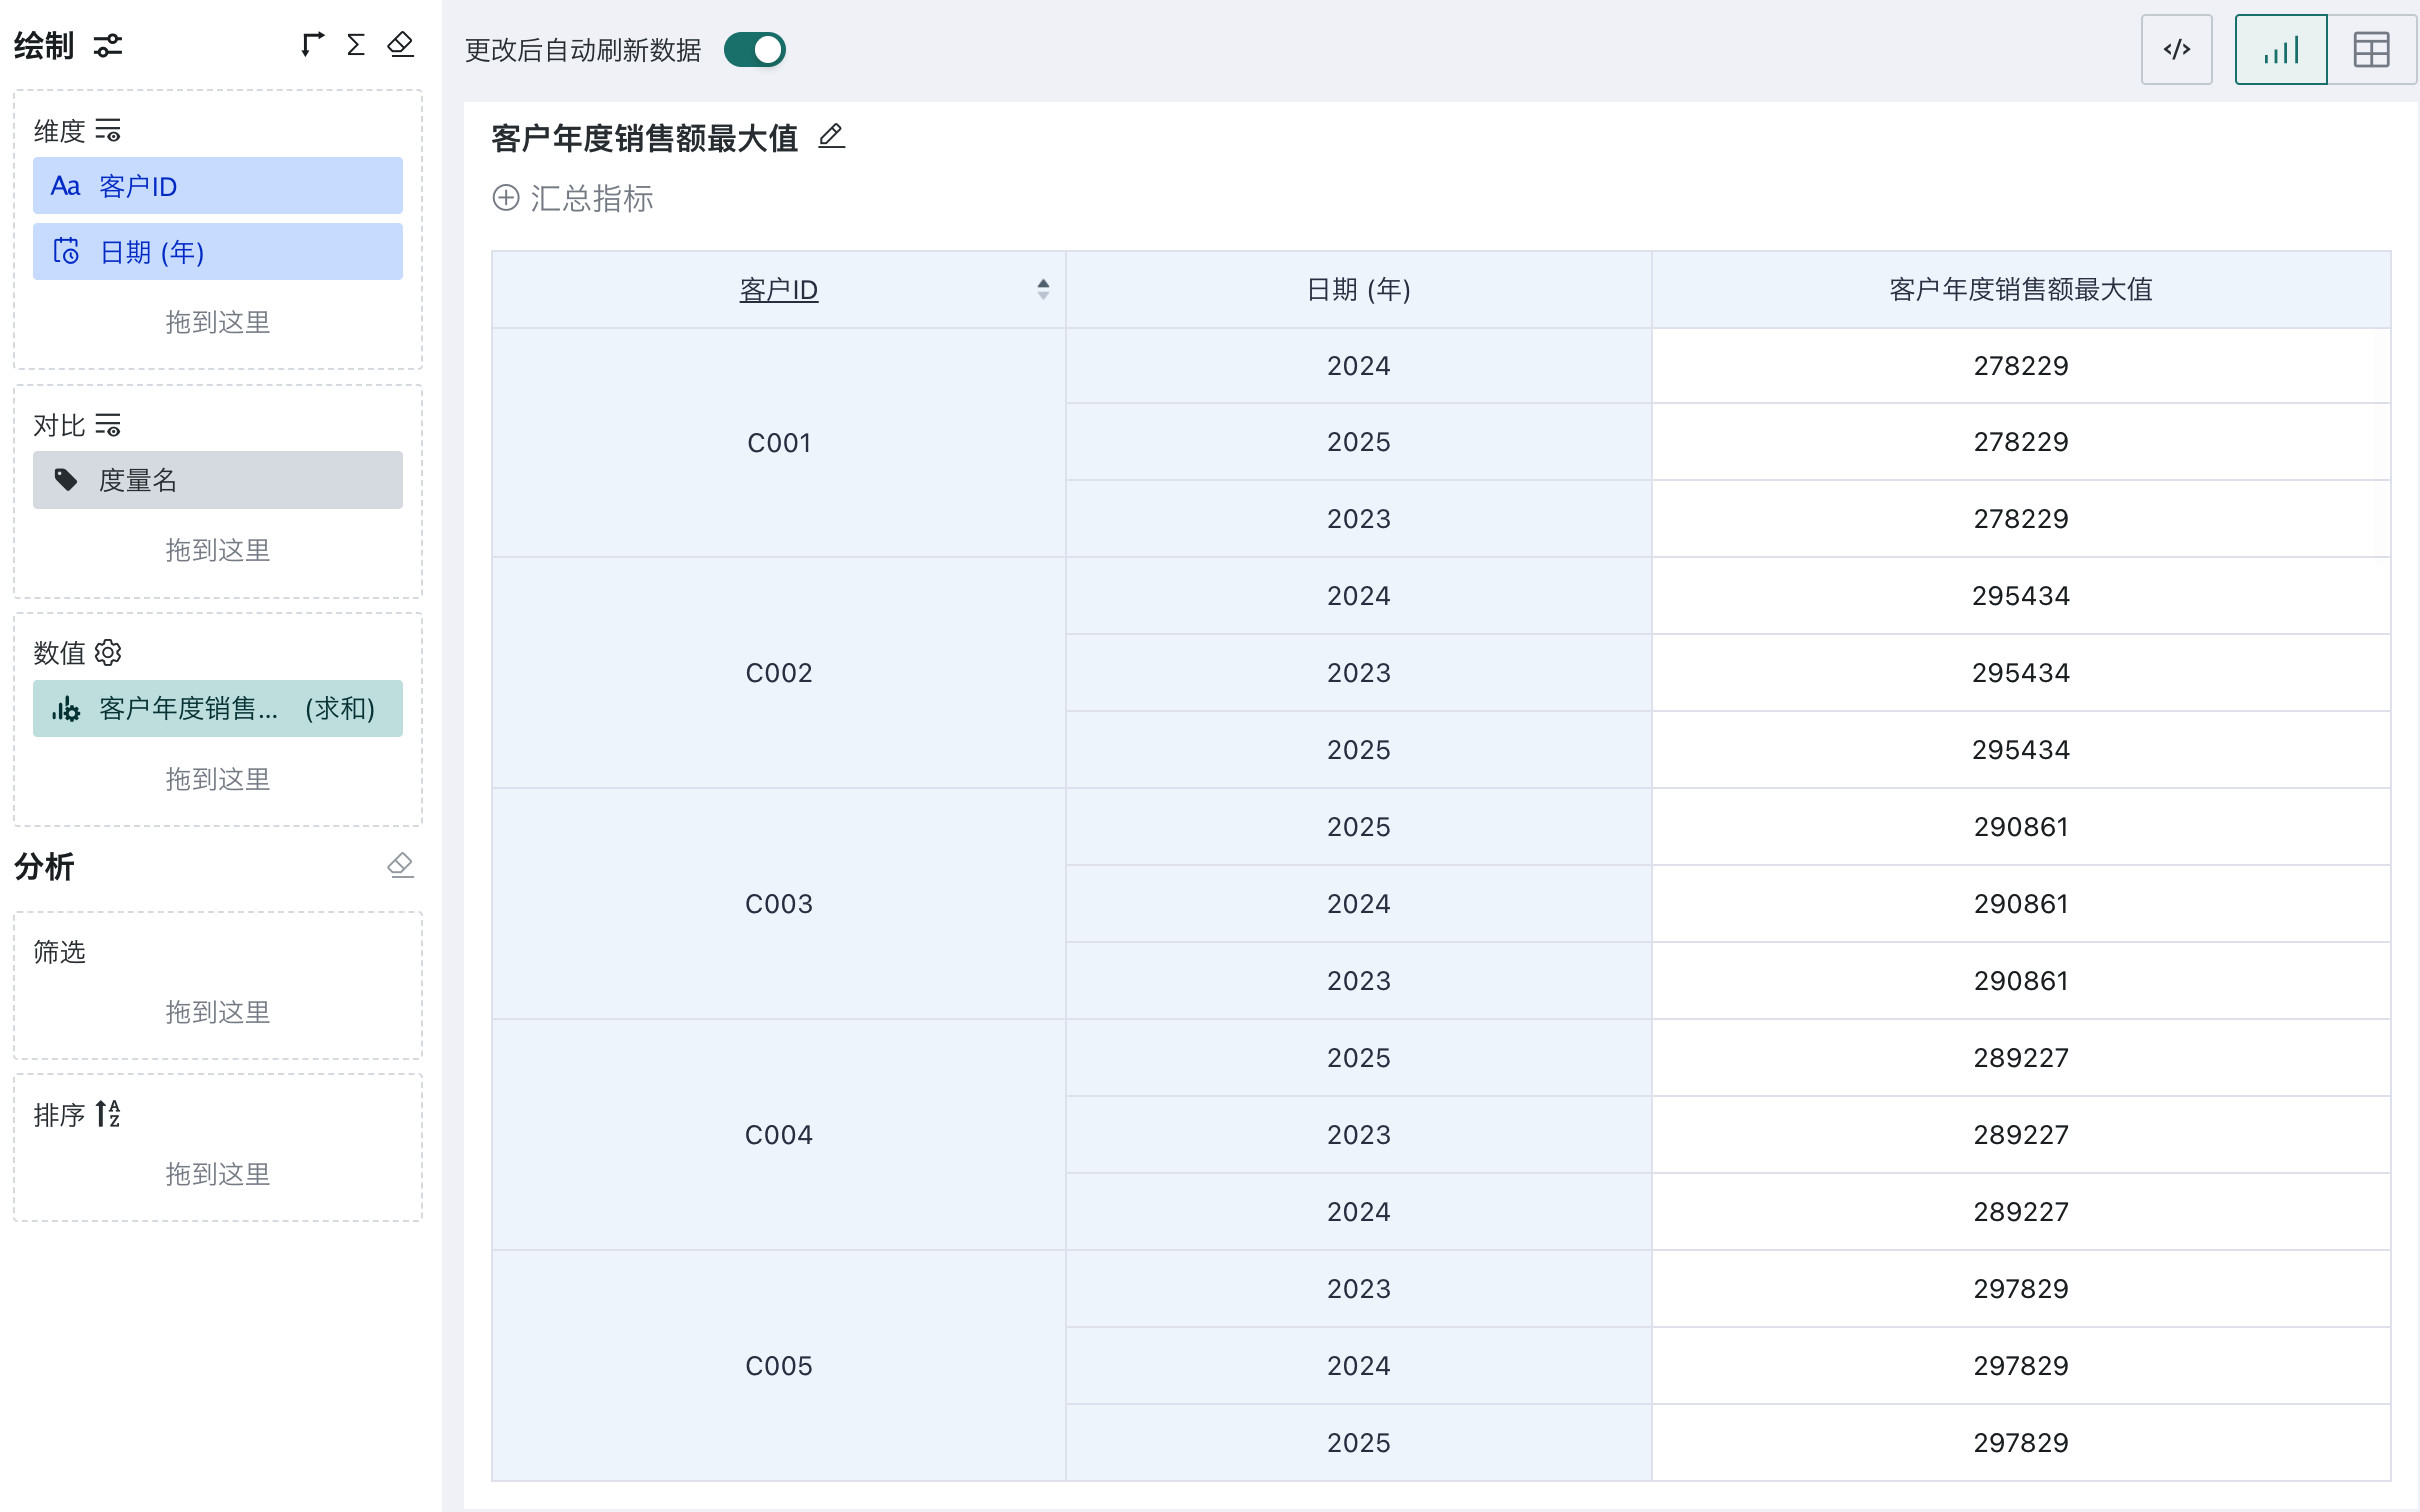
After adding Year as a display dimension, all year rows for the same customer show the same maximum annual sales value. For example, C001 displays 278,229 in 2023, 2024, and 2025. This confirms that the metric remains fixed at Customer ID granularity.
To identify the year corresponding to the maximum annual sales, use ETL to join the annual aggregate with the maximum-value result.
Scenario 2: Annual Purchase Frequency per Customer
Business Requirement
Count distinct orders for each customer in each year to measure annual purchase frequency.
Business Value
This metric compares annual repurchase frequency for a customer while retaining the Customer ID × Year definition when the chart expands by category, region, or another dimension.
Recommended LOD Expression
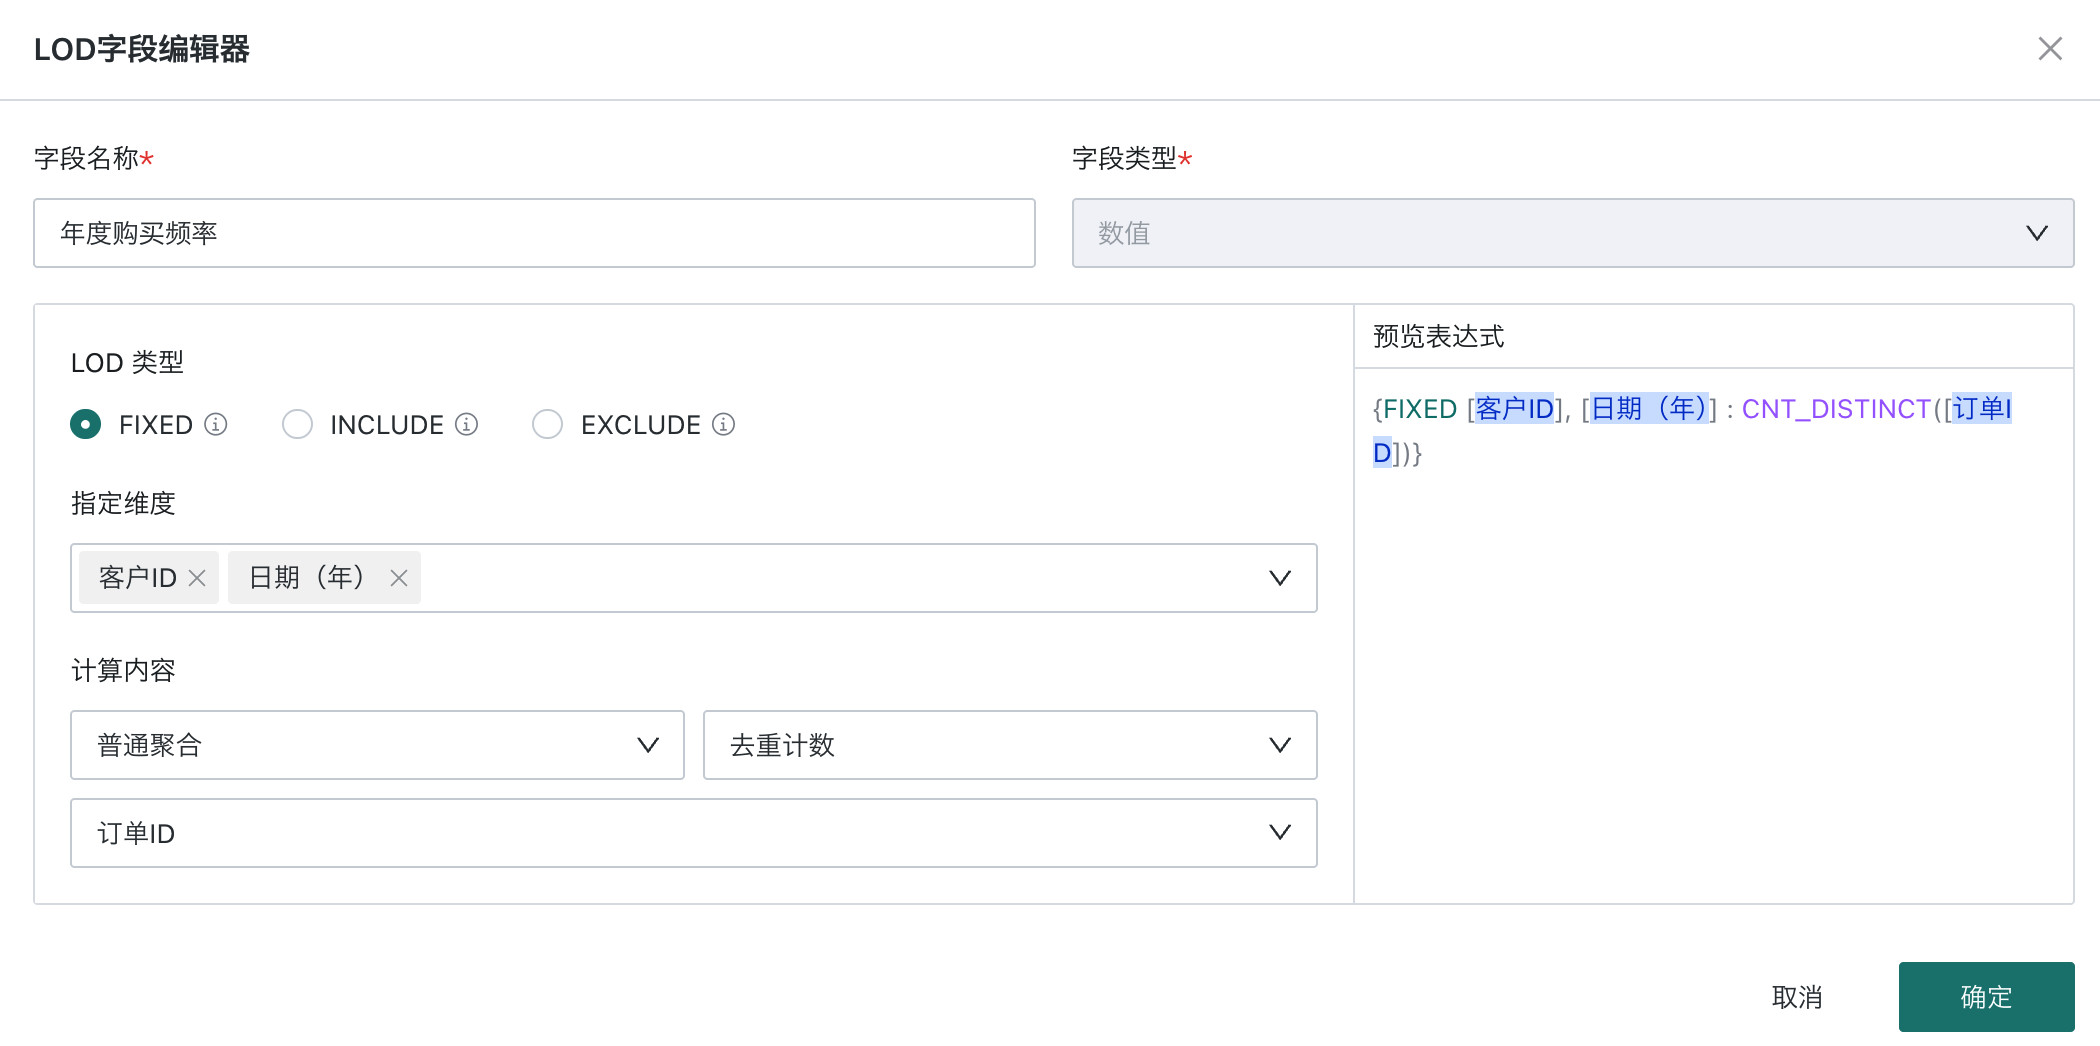
{ FIXED [Customer ID], [Date (Year)]: CNT_DISTINCT([Order ID]) }
FIXED locks Customer ID and Date (Year), while CNT_DISTINCT([Order ID]) prevents duplicate counting when an order has multiple detail rows.
Procedure
-
Reuse the "Date (Year)" field created in Scenario 1. If it does not exist, create a Date field using
DATE_TRUNC('year', [Date]). -
Create the LOD field "Annual Purchase Frequency" with the following settings:
- LOD type:
FIXED - Specified dimensions:
Customer ID,Date (Year) - Calculation:
Standard Aggregation > Count Distinct > Order ID
Verify the preview expression and click OK.
- LOD type:
-
Create the chart
- Drag Customer ID and Category to the Dimensions area.
- Drag Date (Year) to the Comparison area and expand by year.
- Drag Annual Purchase Frequency to the Values area and select Maximum as the aggregation.
Result
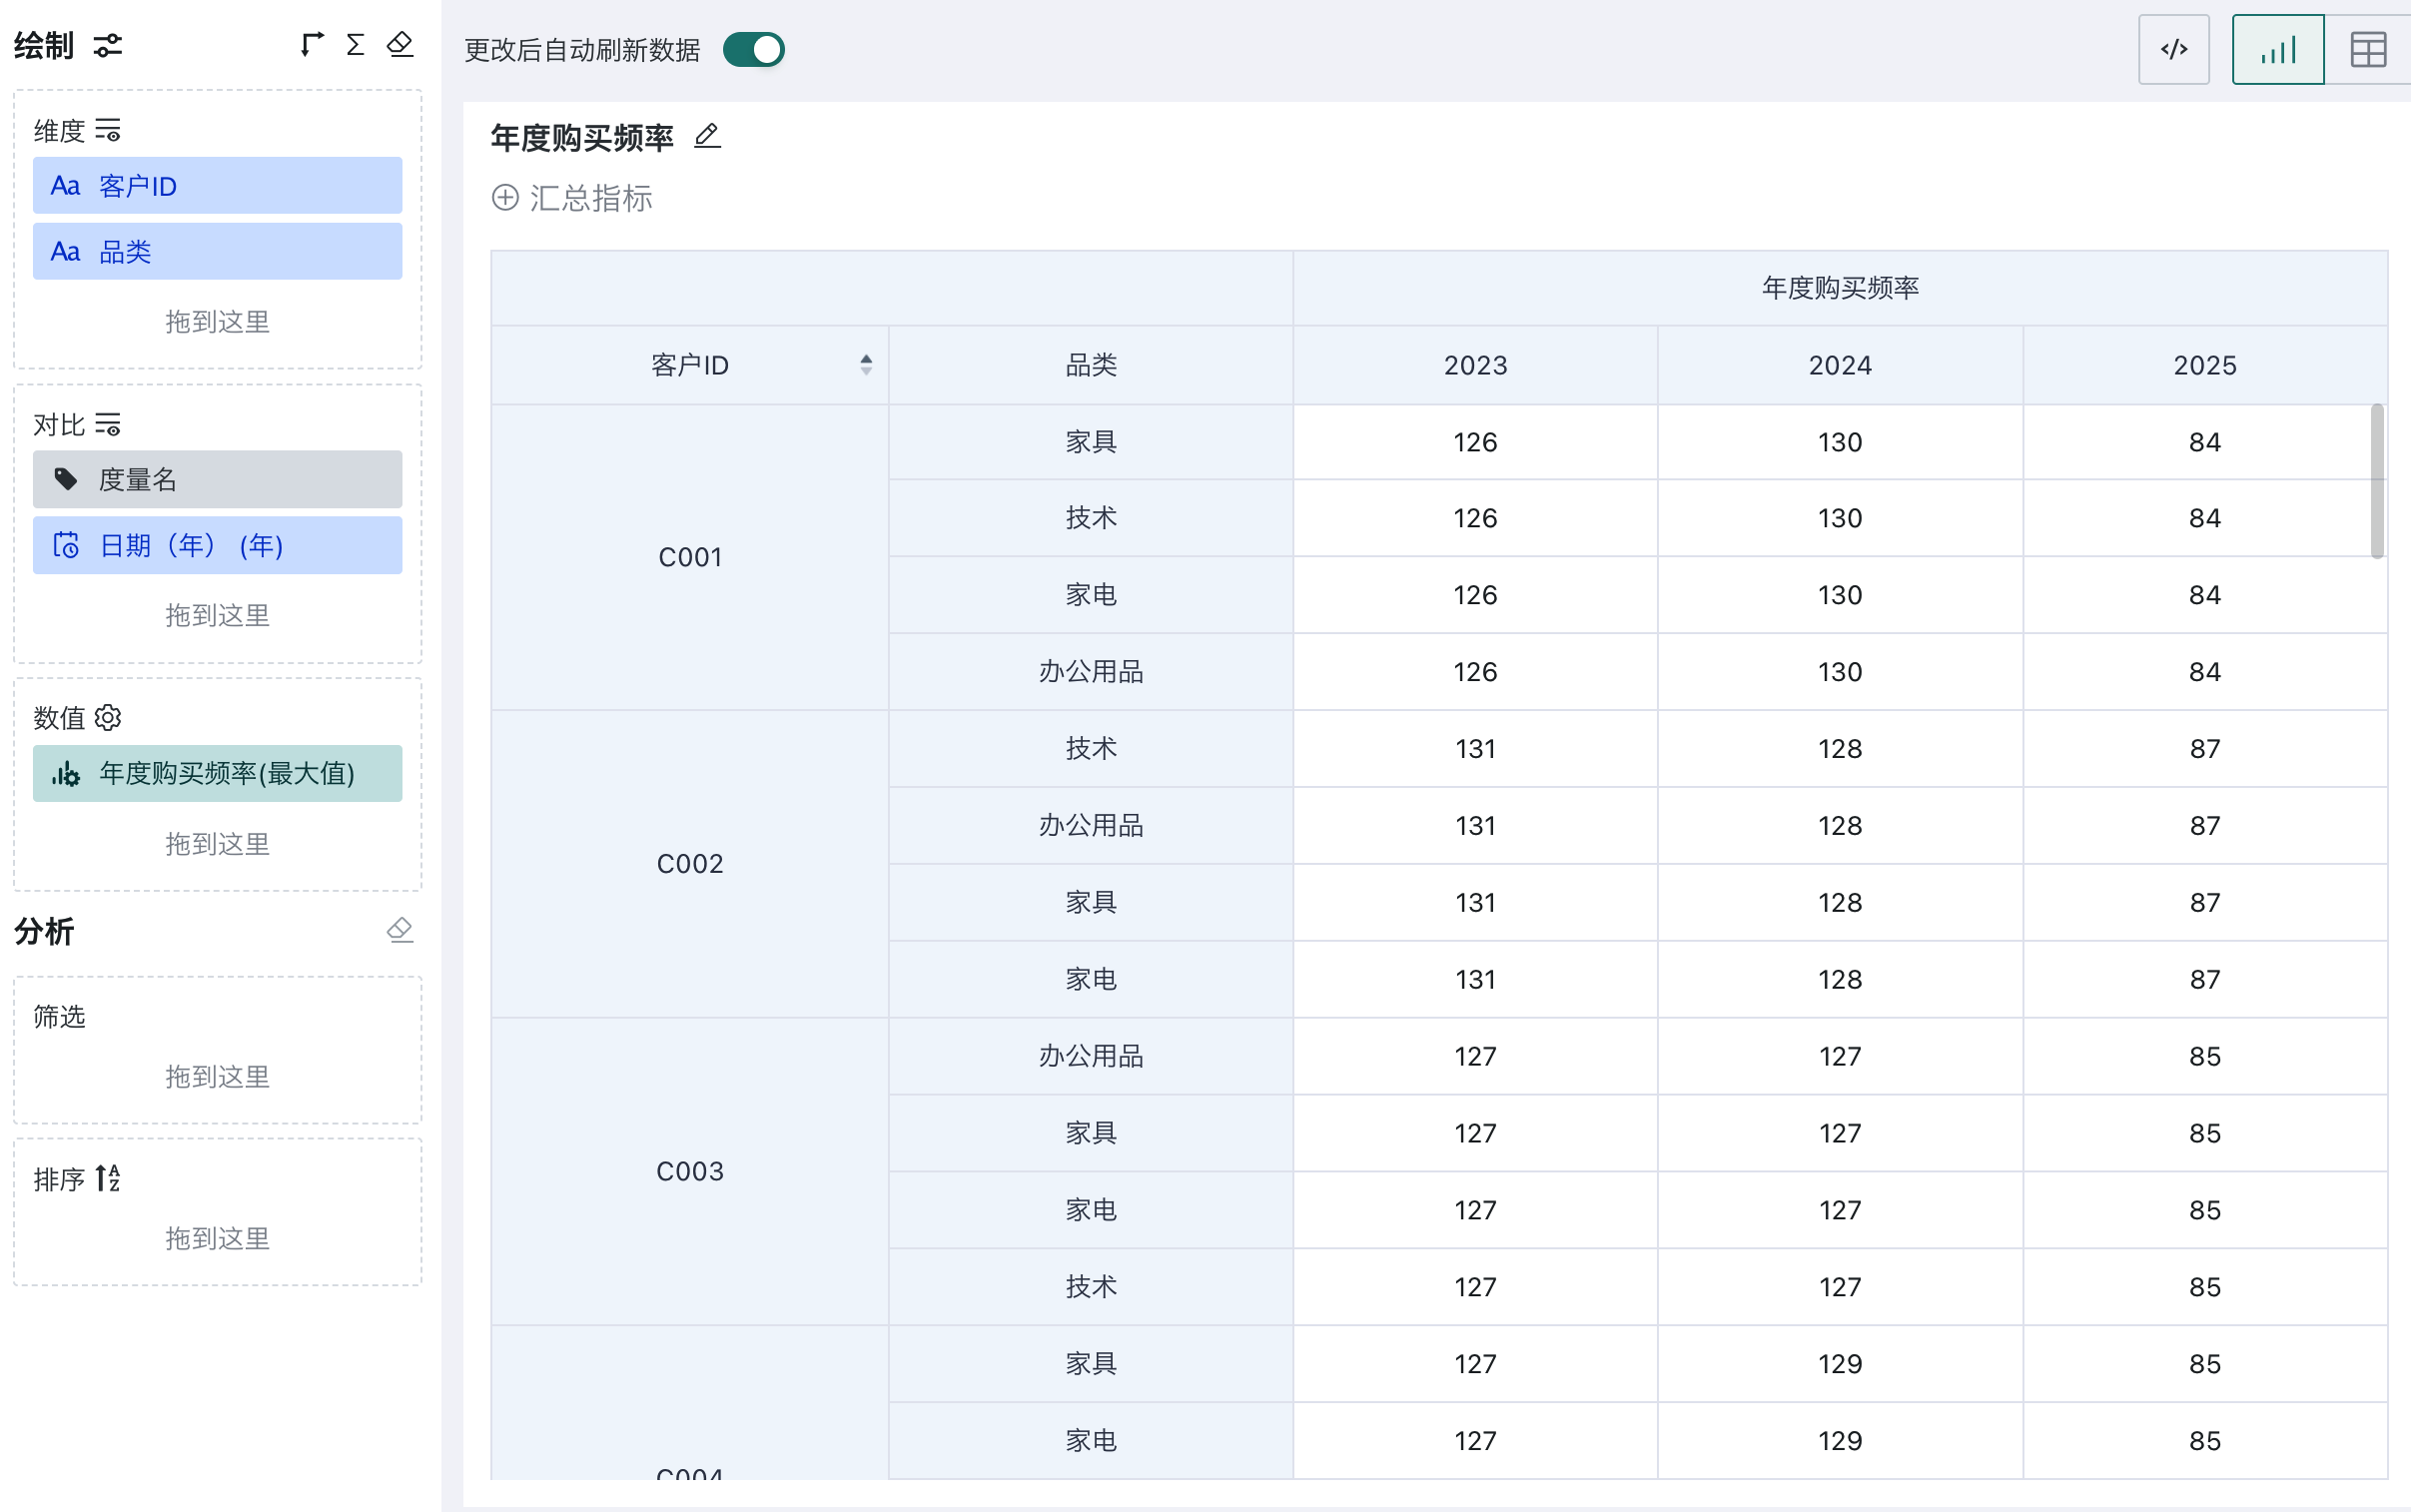
After Category is added, the annual purchase frequency remains the same across category rows for the same customer and year. For example, C001 shows 126 for every category in 2023, 130 in 2024, and 84 in 2025. The metric is therefore calculated at Customer ID × Year granularity rather than the displayed category granularity.
Scenario 3: Sales as a Percentage of Global Sales
Business Requirement
Calculate each province's and city's sales as a percentage of global sales, including the province percentage on subtotal rows.
Business Value
This metric consistently measures the contribution of different geographic levels to global sales and is useful for contribution rankings, sales mix analysis, and target contribution analysis.
Recommended LOD Expression
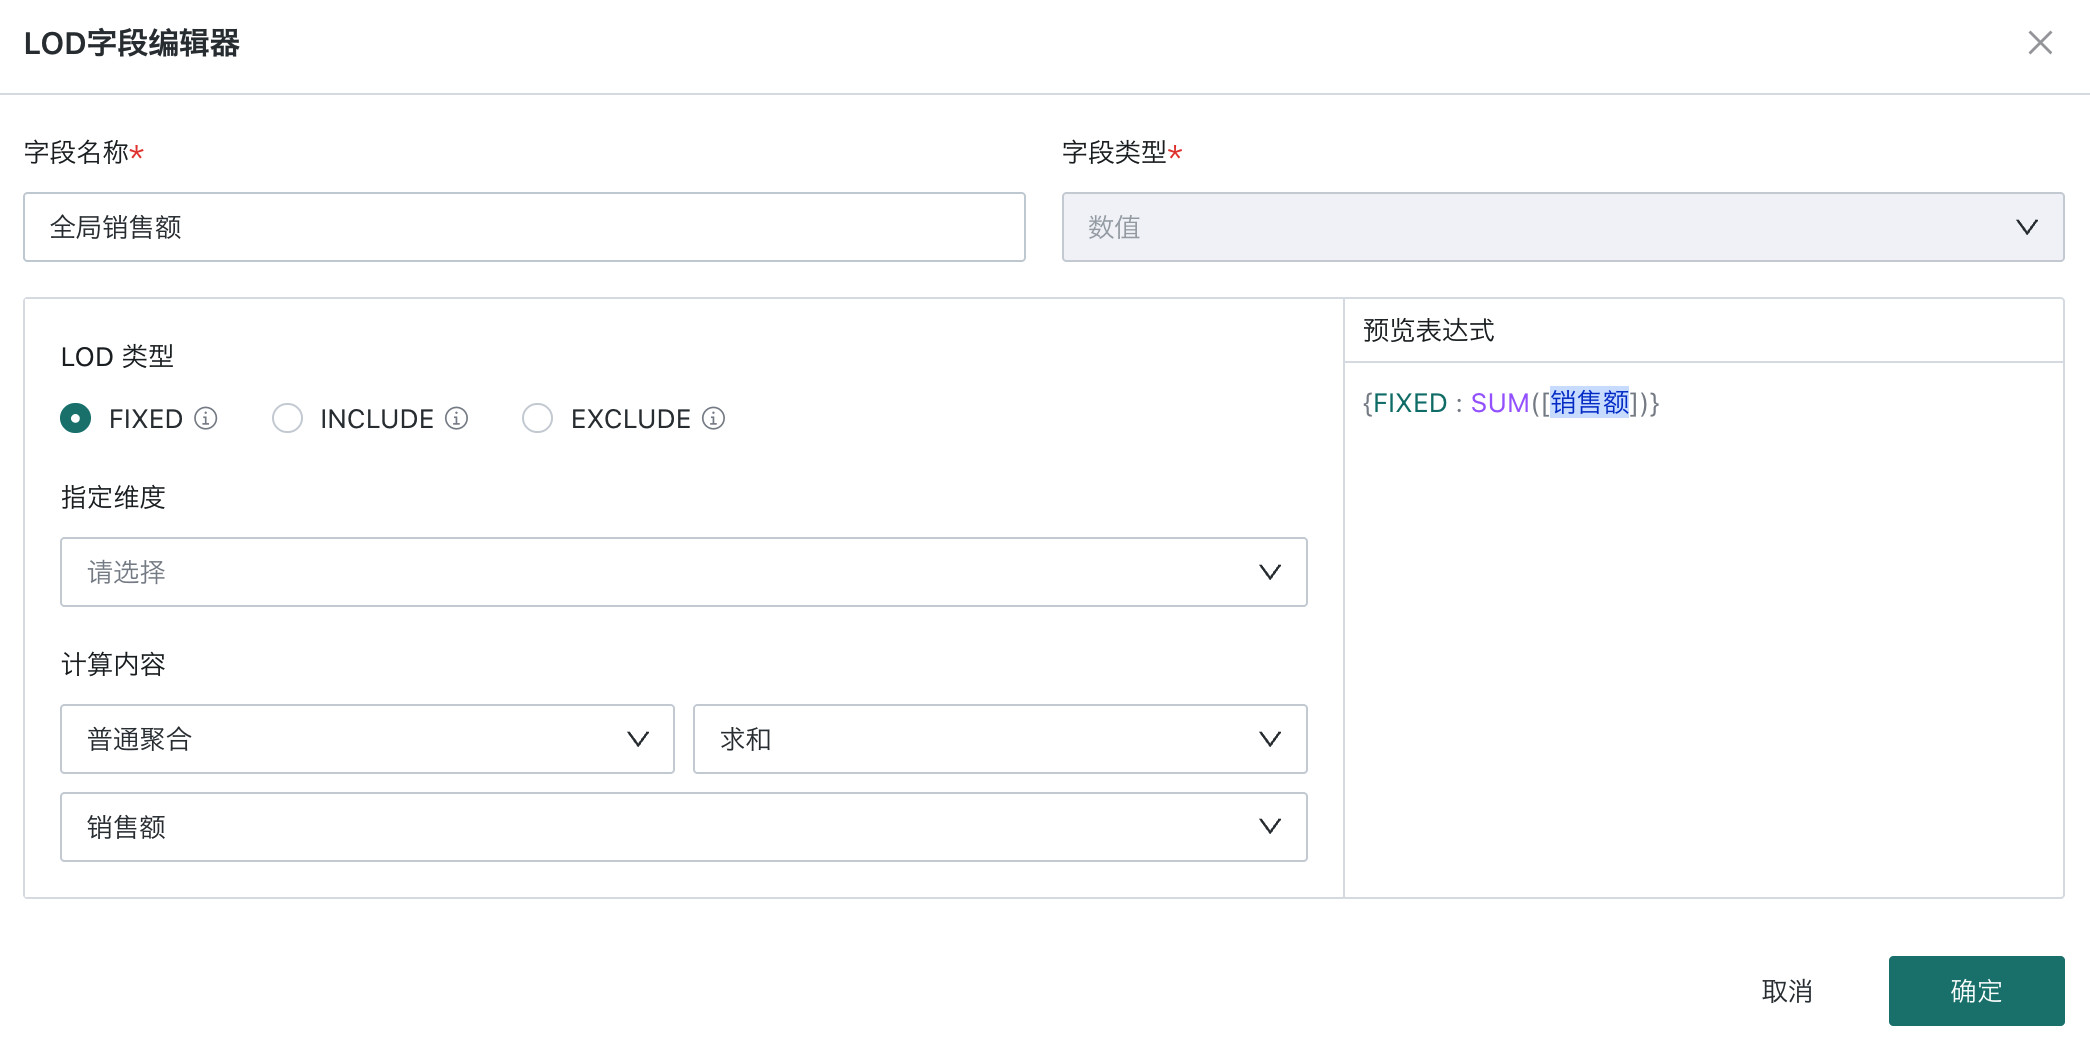
{ FIXED : SUM([Sales]) }
FIXED without a dimension aggregates globally. Global Sales is the fixed denominator, while the current chart row supplies the numerator.
Procedure
-
Create the LOD field "Global Sales"
- LOD type:
FIXED - Specified dimensions: Leave blank
- Calculation:
Standard Aggregation > Sum > Sales
- LOD type:
-
Create the calculated field "Percentage of Total" using:
SUM([Sales]) / SUM([Global Sales])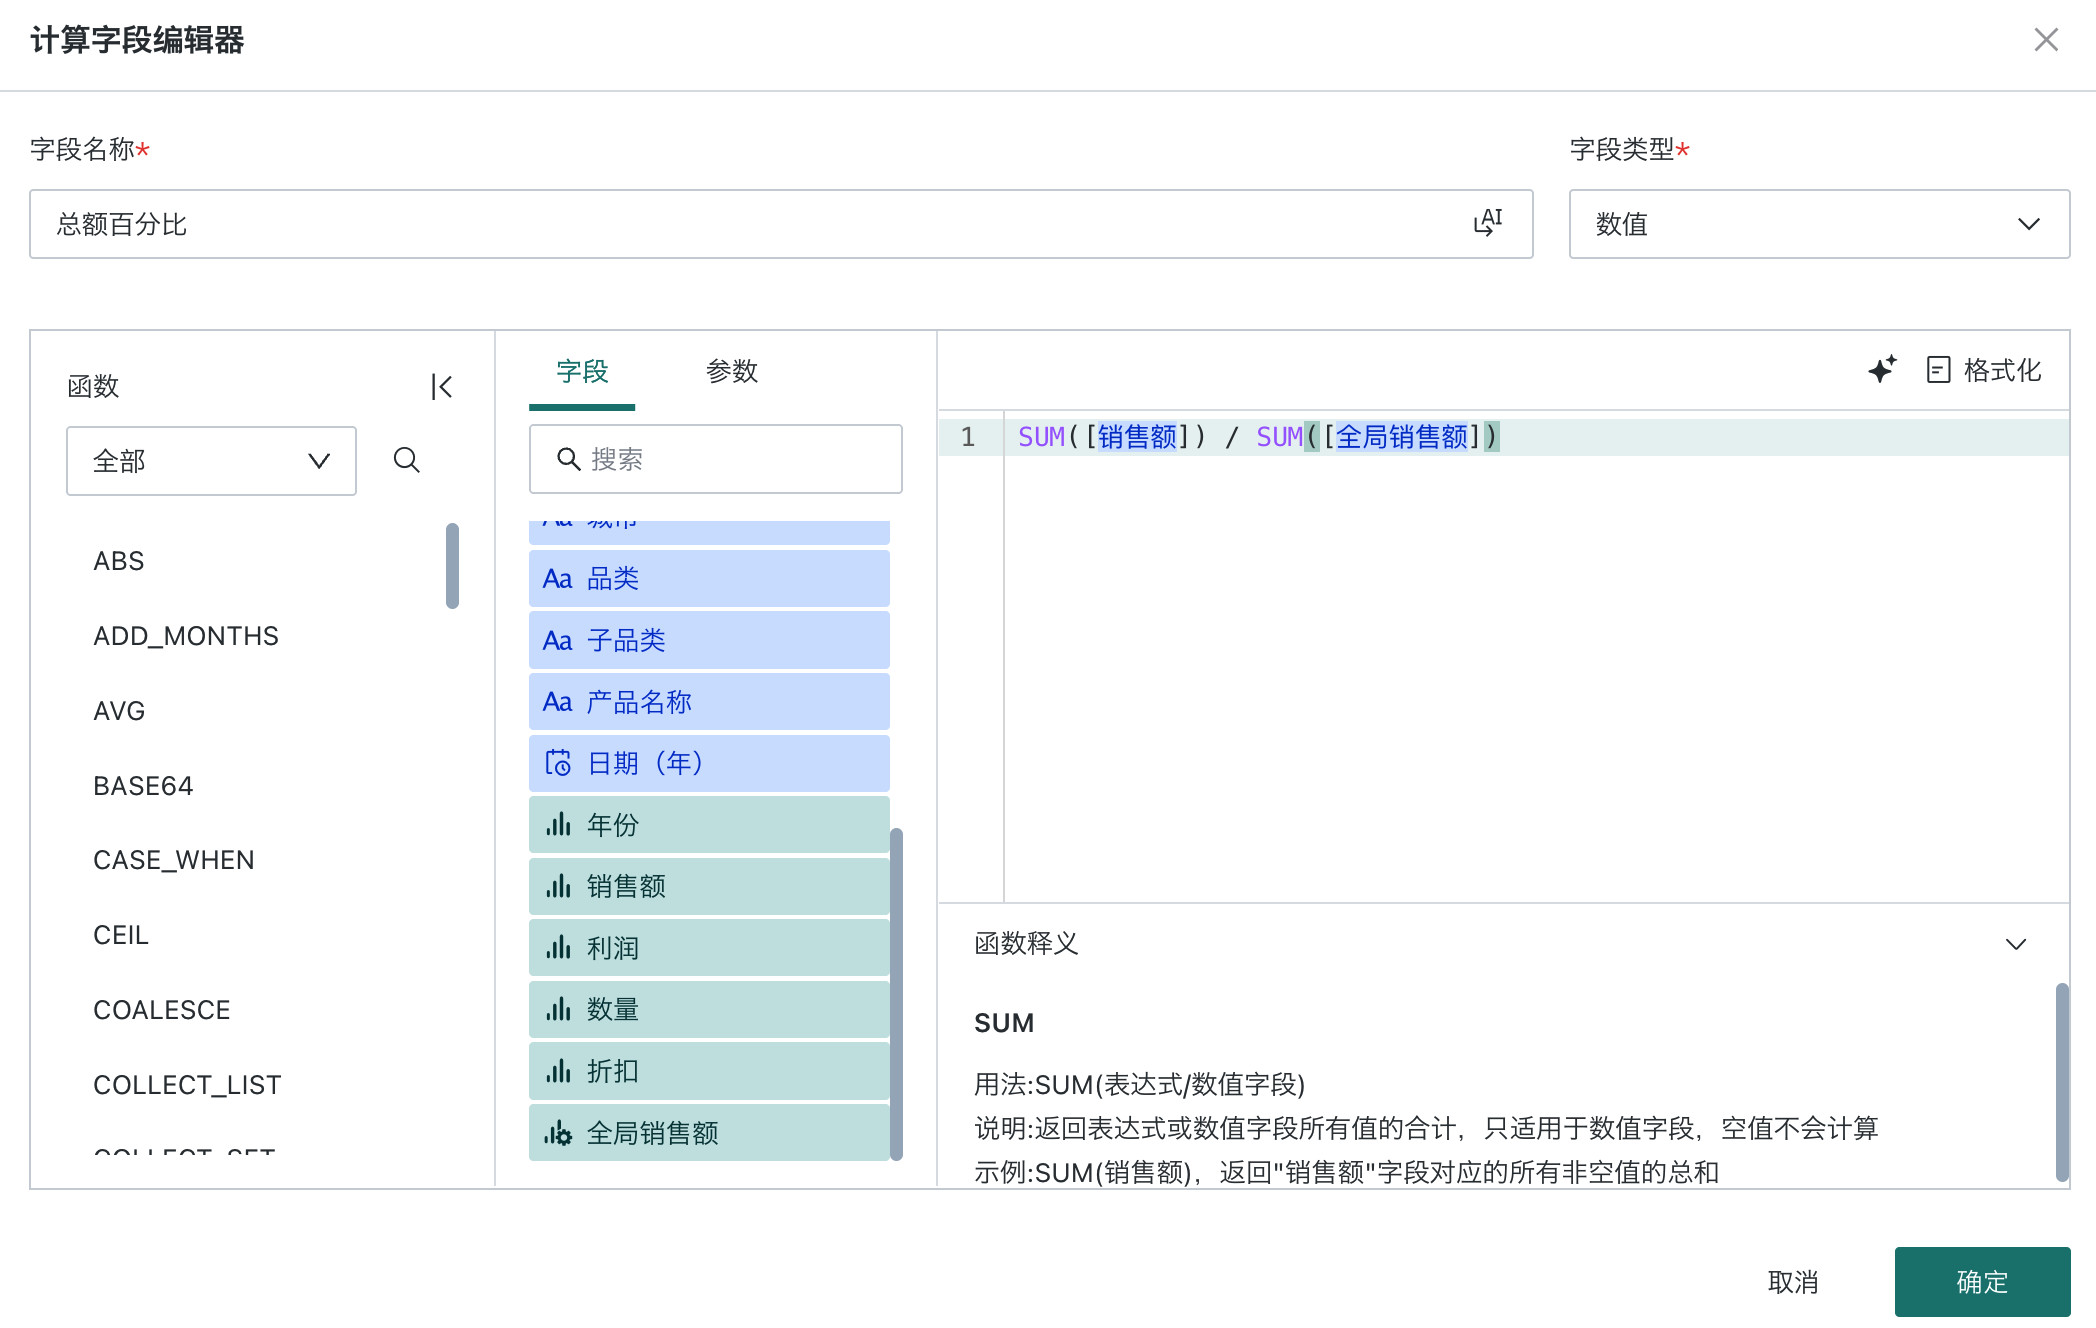
-
Create the chart
- Drag Province and City to the Dimensions area, with Province before City.
- Drag Percentage of Total, Sales, and Global Sales to the Values area.
- Set the aggregation of Global Sales to Maximum to avoid repeated accumulation.
- Format Percentage of Total as a percentage and enable province subtotals.
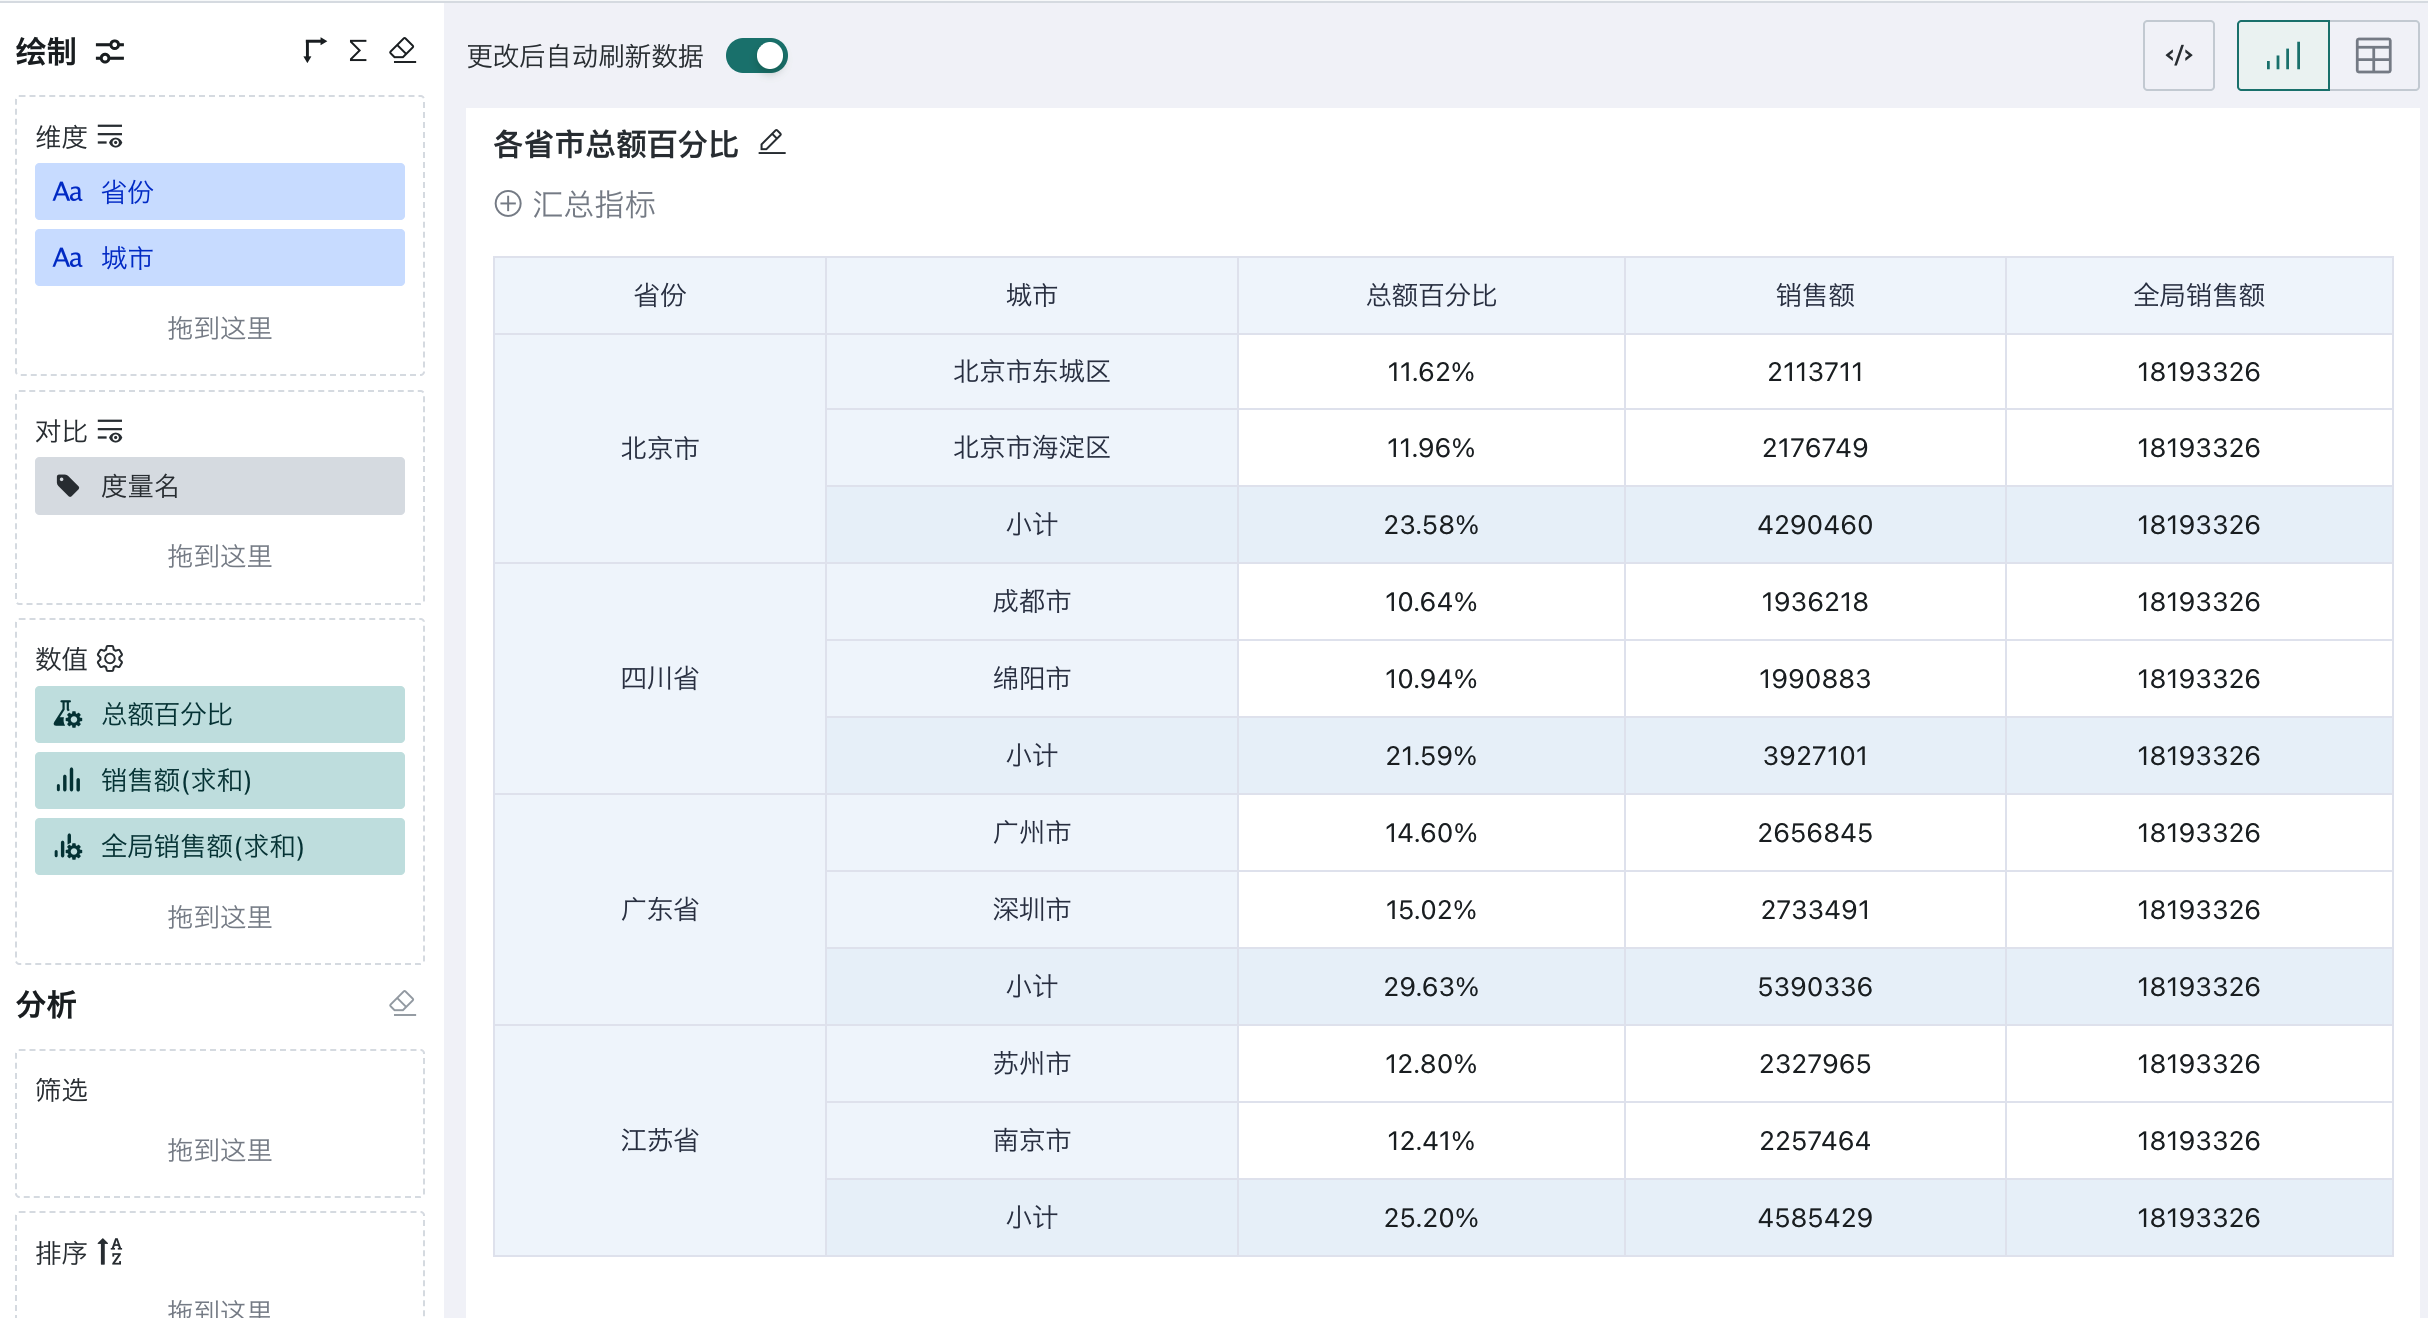
Result
When Province and City are expanded, Sales changes by row while Global Sales remains 18,193,326 for every city and province subtotal. For example, Dongcheng District has sales of 2,113,711, or 11.62%, and the Beijing subtotal is 4,290,460, or 23.58%. City percentages within a province add up to the province subtotal percentage, and all province subtotals add up to 100%.
Scenario 4: Variance from Average Category Sales by Region
Business Requirement
Calculate the difference between each category's sales and the average category sales in its region.
Business Value
The regional average is a benchmark fixed at Region granularity. Even when the chart expands to Category, you can identify categories above or below the regional average.
Recommended LOD Expression
{ FIXED [Region]: AVG({ FIXED [Region], [Category]: SUM([Sales]) }) }
Logic:
- The inner FIXED calculates total sales for each Region × Category.
- The outer FIXED averages those category totals within each region.
- Subtracting this average from the current category sales shows whether the category is above or below its regional average.
Procedure
-
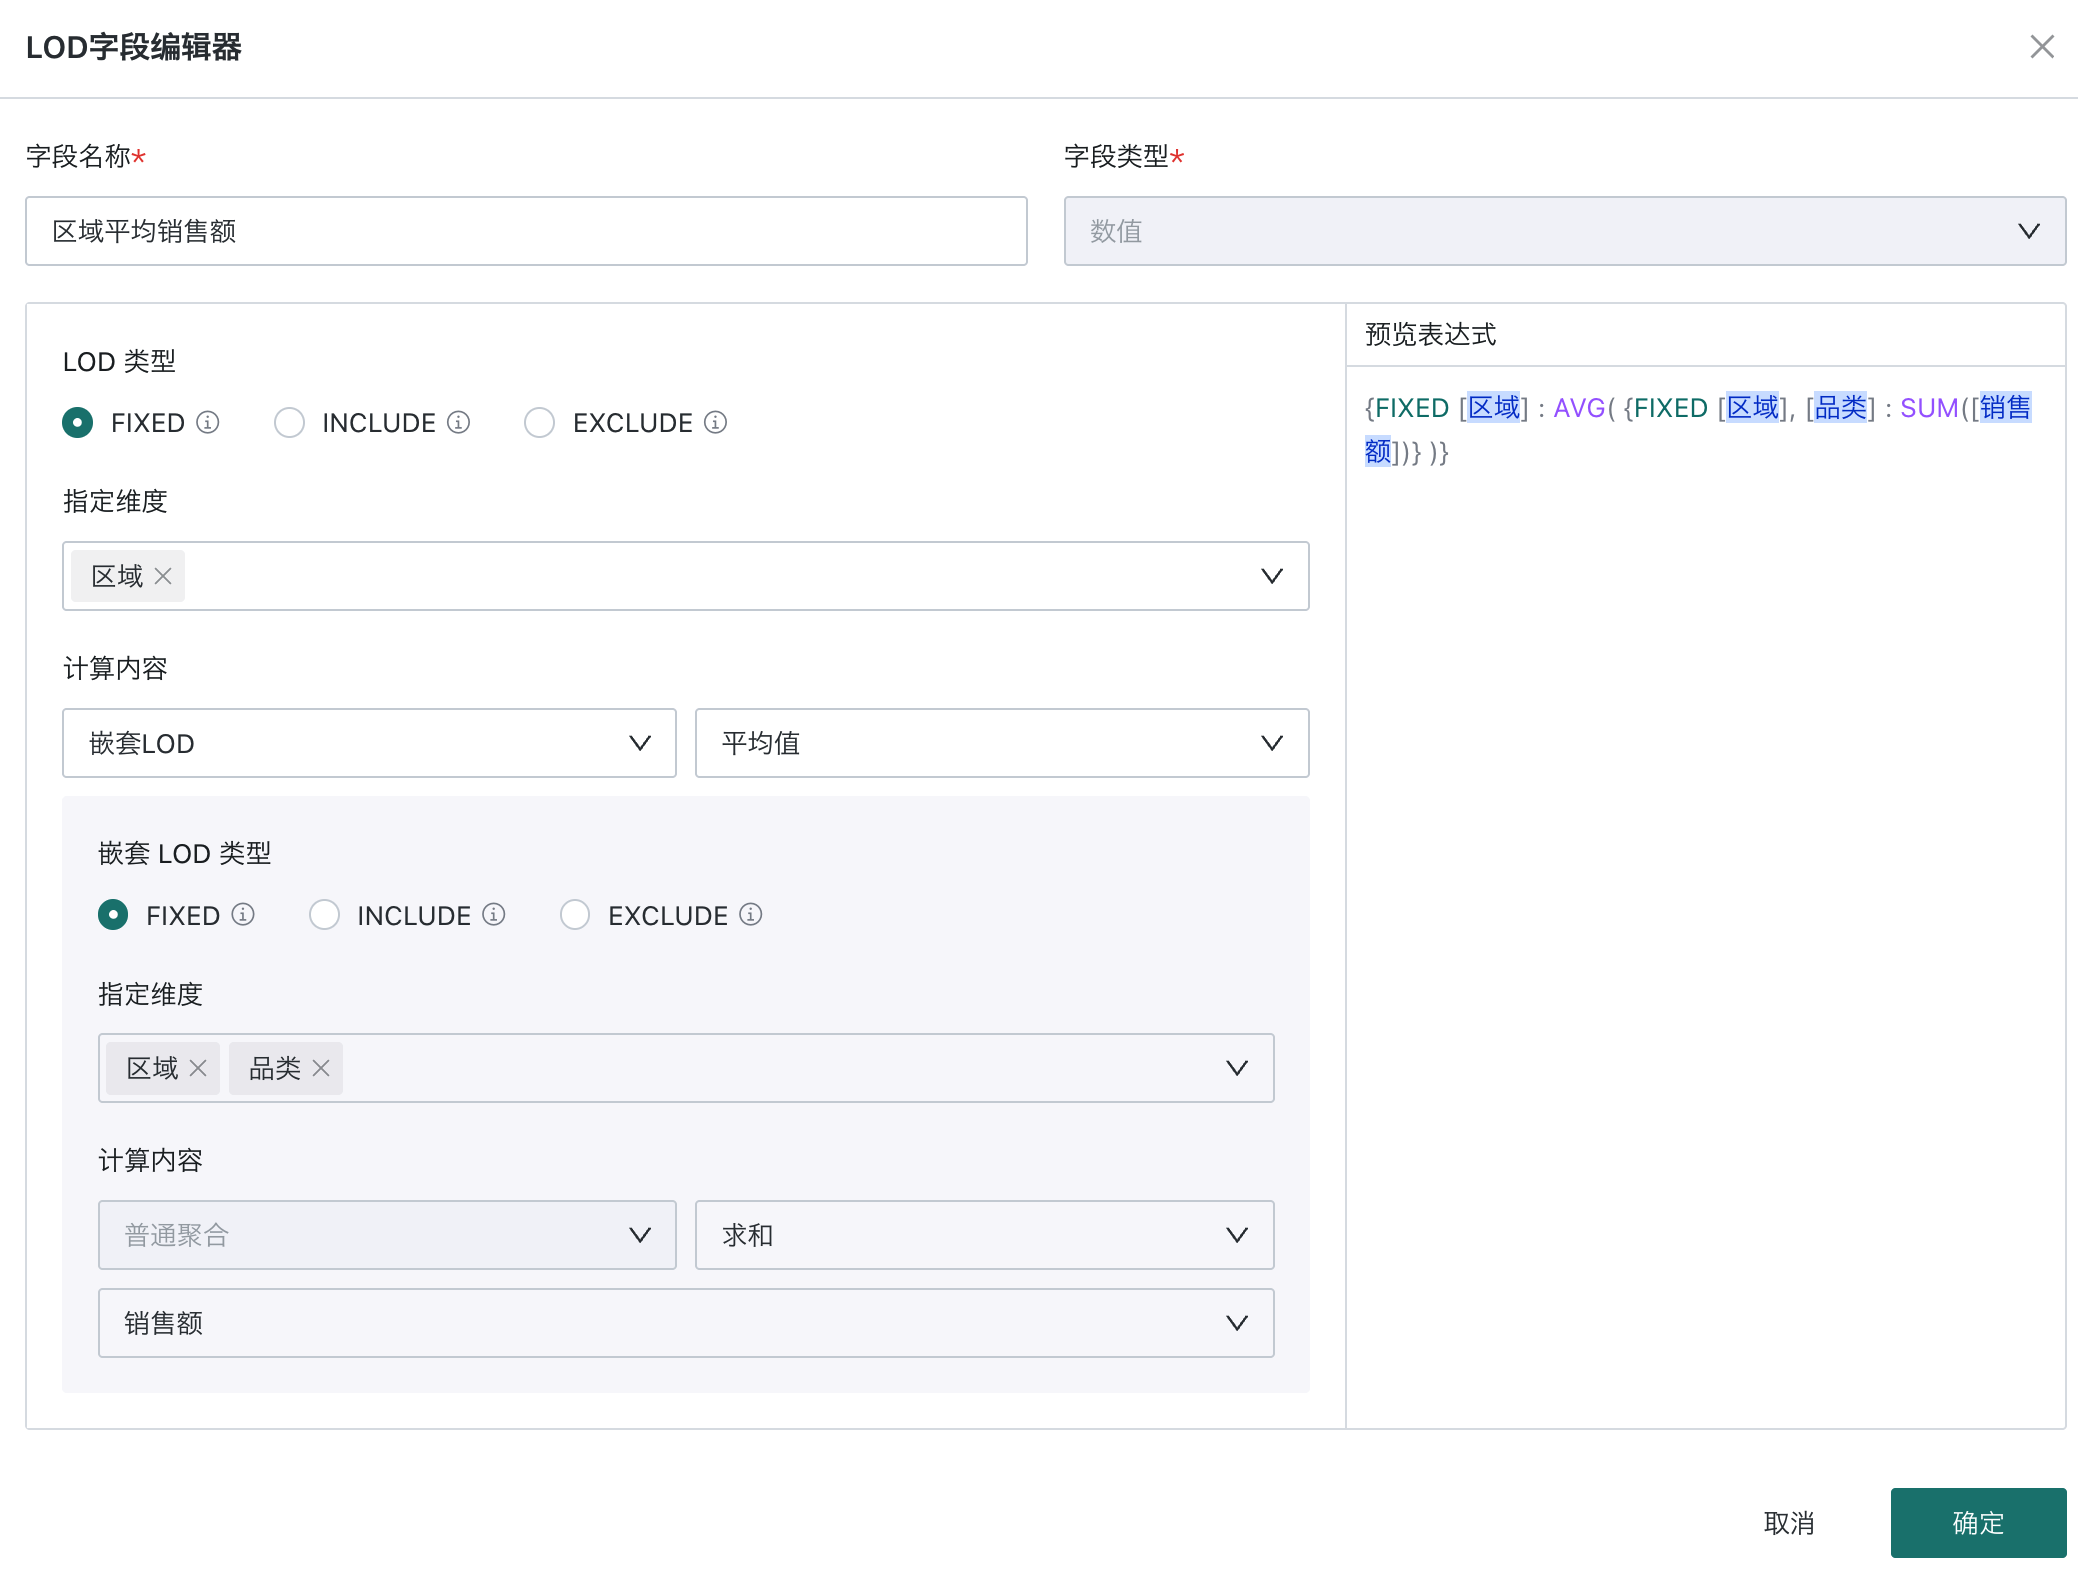
Create the LOD field "Average Regional Sales"
- Outer LOD type:
FIXED - Outer dimension:
Region - Outer calculation:
Nested LOD > Average - Inner LOD type:
FIXED - Inner dimensions:
Region,Category - Inner calculation:
Standard Aggregation > Sum > Sales
- Outer LOD type:
-
Create the calculated field "Variance from Regional Average" using:
SUM([Sales]) - SUM([Average Regional Sales])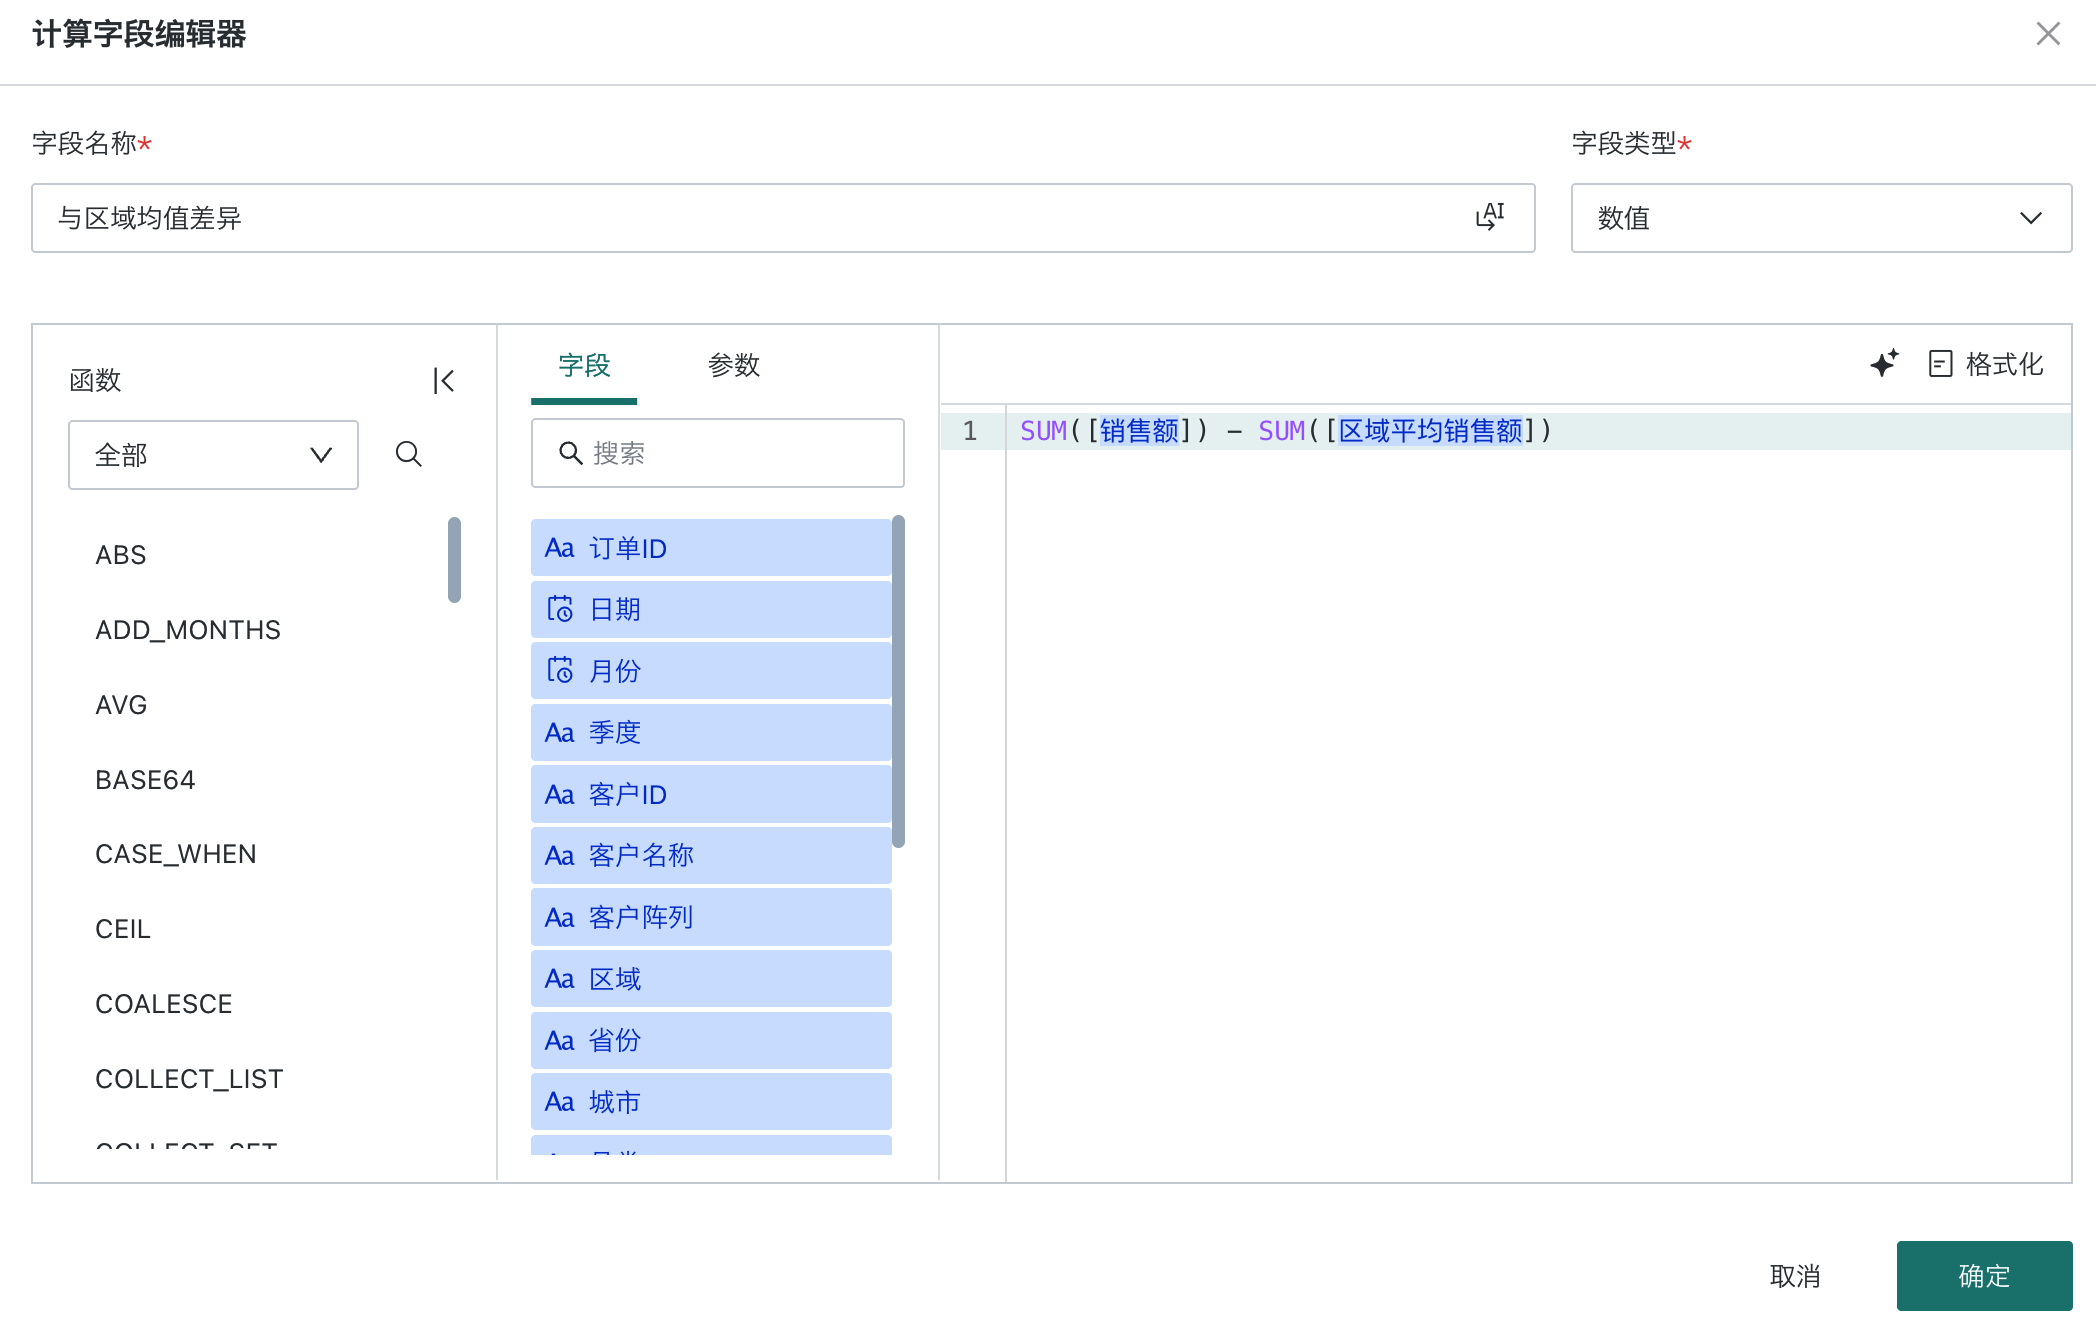
-
Create the chart
- Drag Region and Category to the Dimensions area, with Region before Category.
- Drag Average Regional Sales, Sales, and Variance from Regional Average to the Values area.
- Optionally configure positive and negative arrows or conditional formatting for the variance.
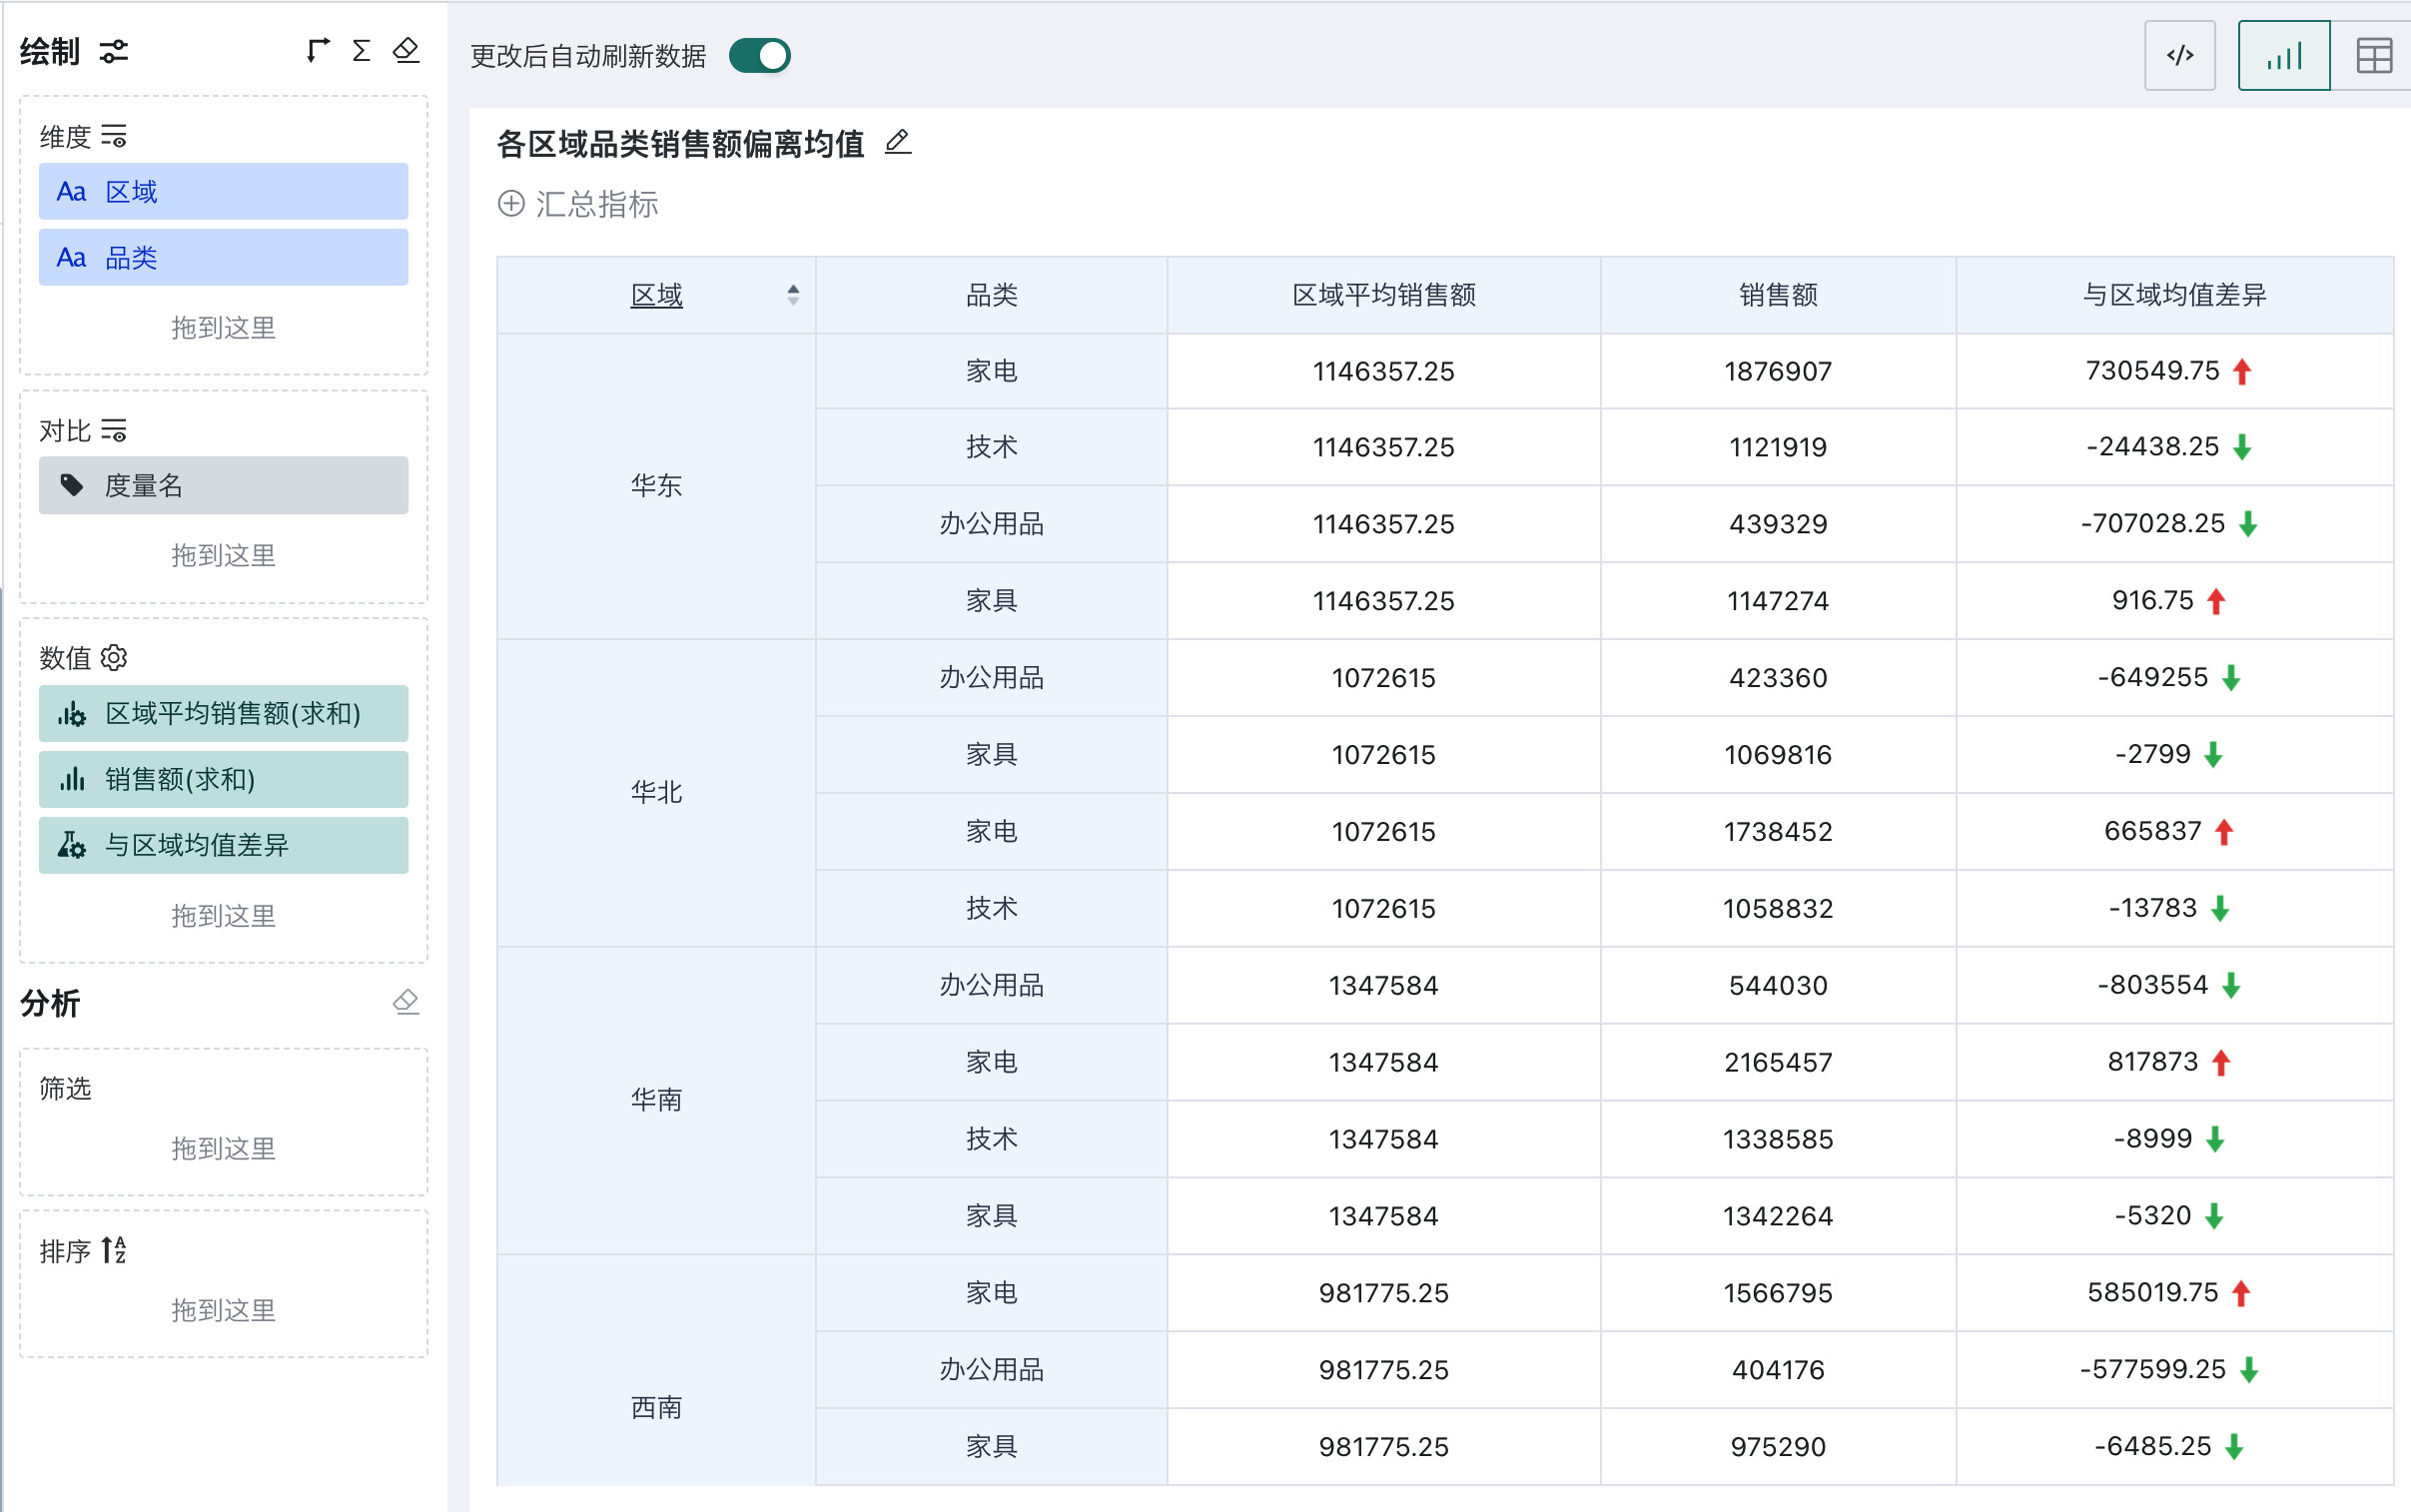
Result
A positive result means that category sales are above the regional average; a negative result means they are below it. For East China, the average is 1,146,357.25. Home Appliances has sales of 1,876,907, a positive variance of 730,549.75, while Office Supplies has sales of 439,329, a variance of -707,028.25. Variances for all categories in a region should sum to 0.
Exclude the Current Dimension (EXCLUDE)
EXCLUDE removes a specified dimension from the current chart granularity, causing the metric to calculate at the parent level. The following scenario excludes City from a Province × City view to obtain province sales as a fixed denominator.
Scenario 5: City Sales as a Percentage of Province Sales
Business Requirement
Calculate each city's sales as a percentage of its province's sales.
Business Value
When the chart displays cities, province sales remain the common denominator. This supports city contribution rankings, regional resource allocation, and city sales mix analysis.
Recommended LOD Expression
{ EXCLUDE [City]: SUM([Sales]) }
Logic:
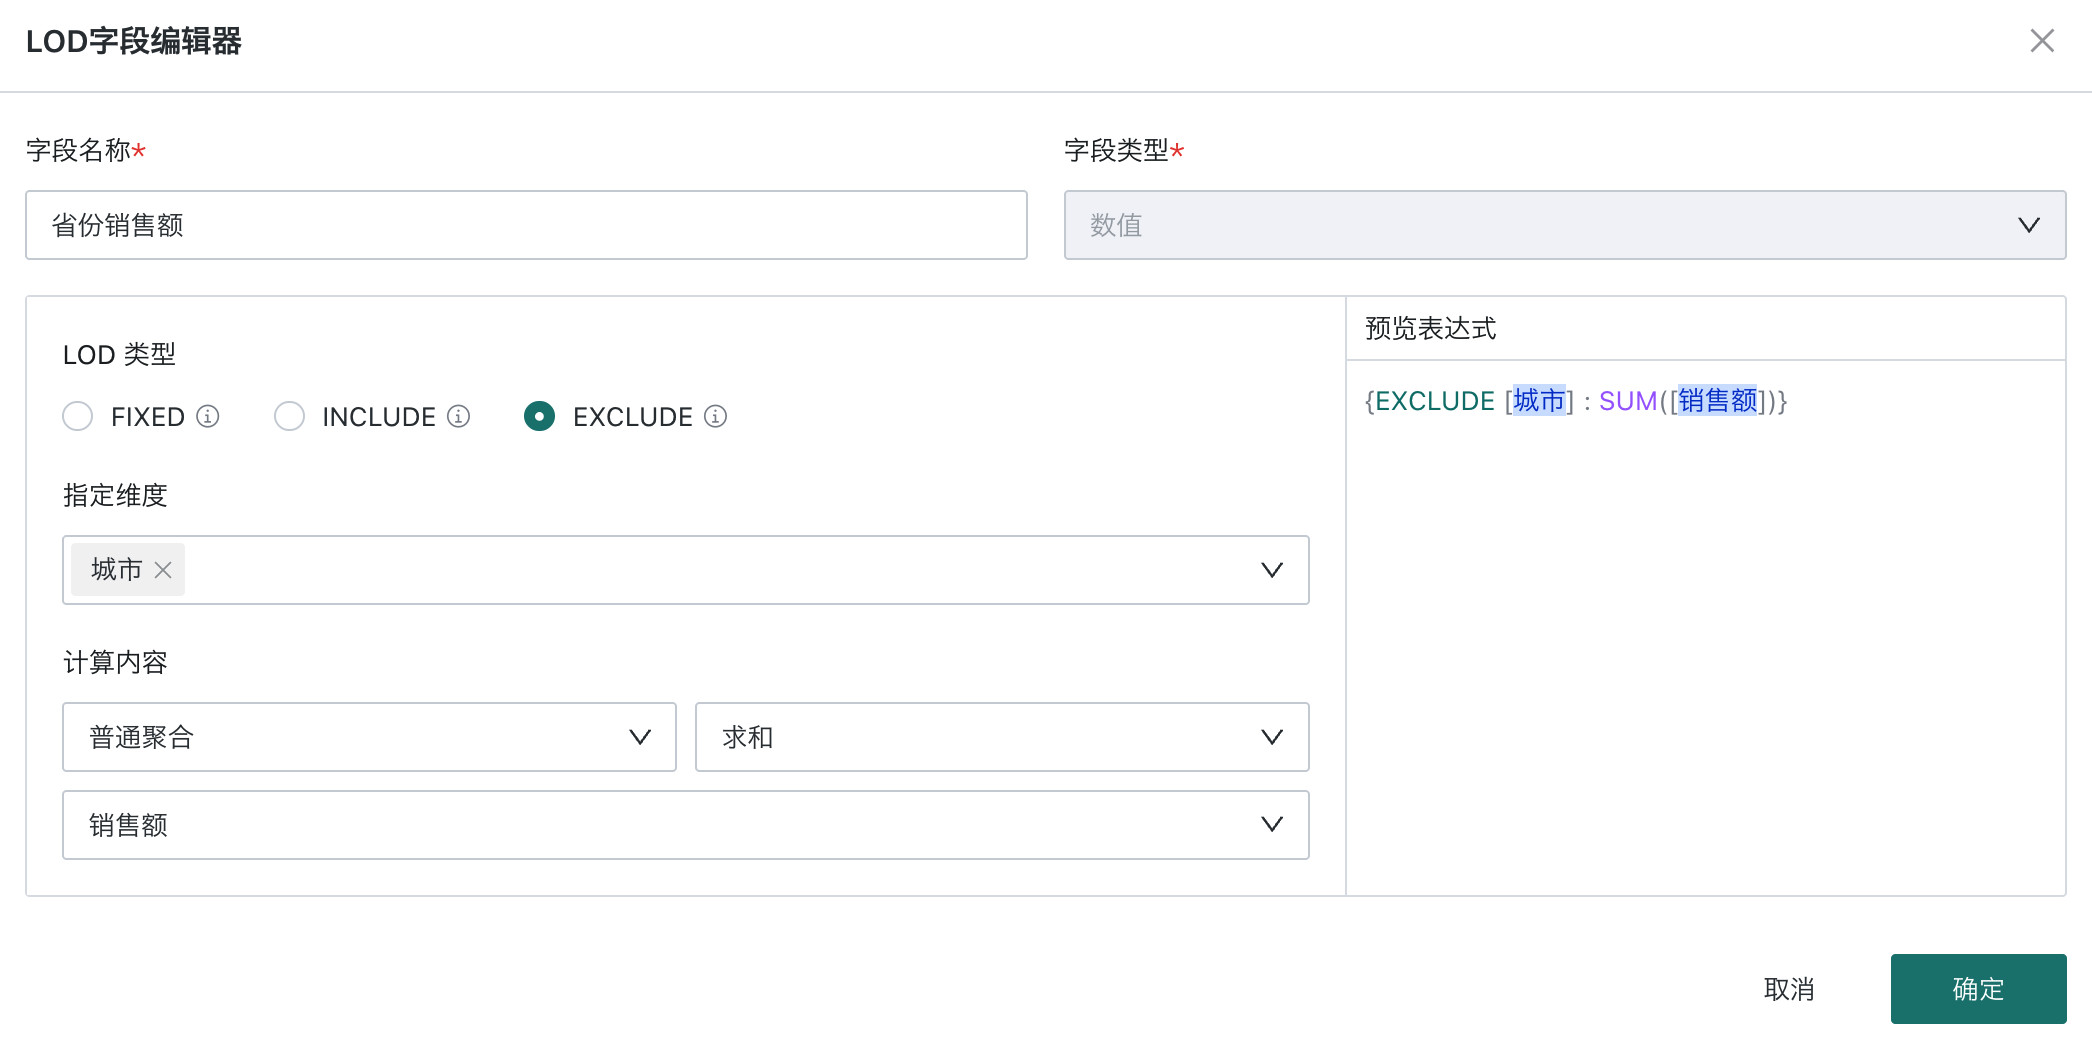
EXCLUDE [City]removes City from the calculation granularity.- In a Province × City view, the LOD field falls back to Province granularity and returns total sales for all cities in that province.
- Both Province and City must be in the Dimensions area, with Province before City.
Procedure
-
Create the LOD field "Province Sales"
- LOD type:
EXCLUDE - Specified dimension:
City - Calculation:
Standard Aggregation > Sum > Sales
- LOD type:
-
Create the calculated field "City Sales Percentage" using:
SUM([Sales]) / SUM([Province Sales])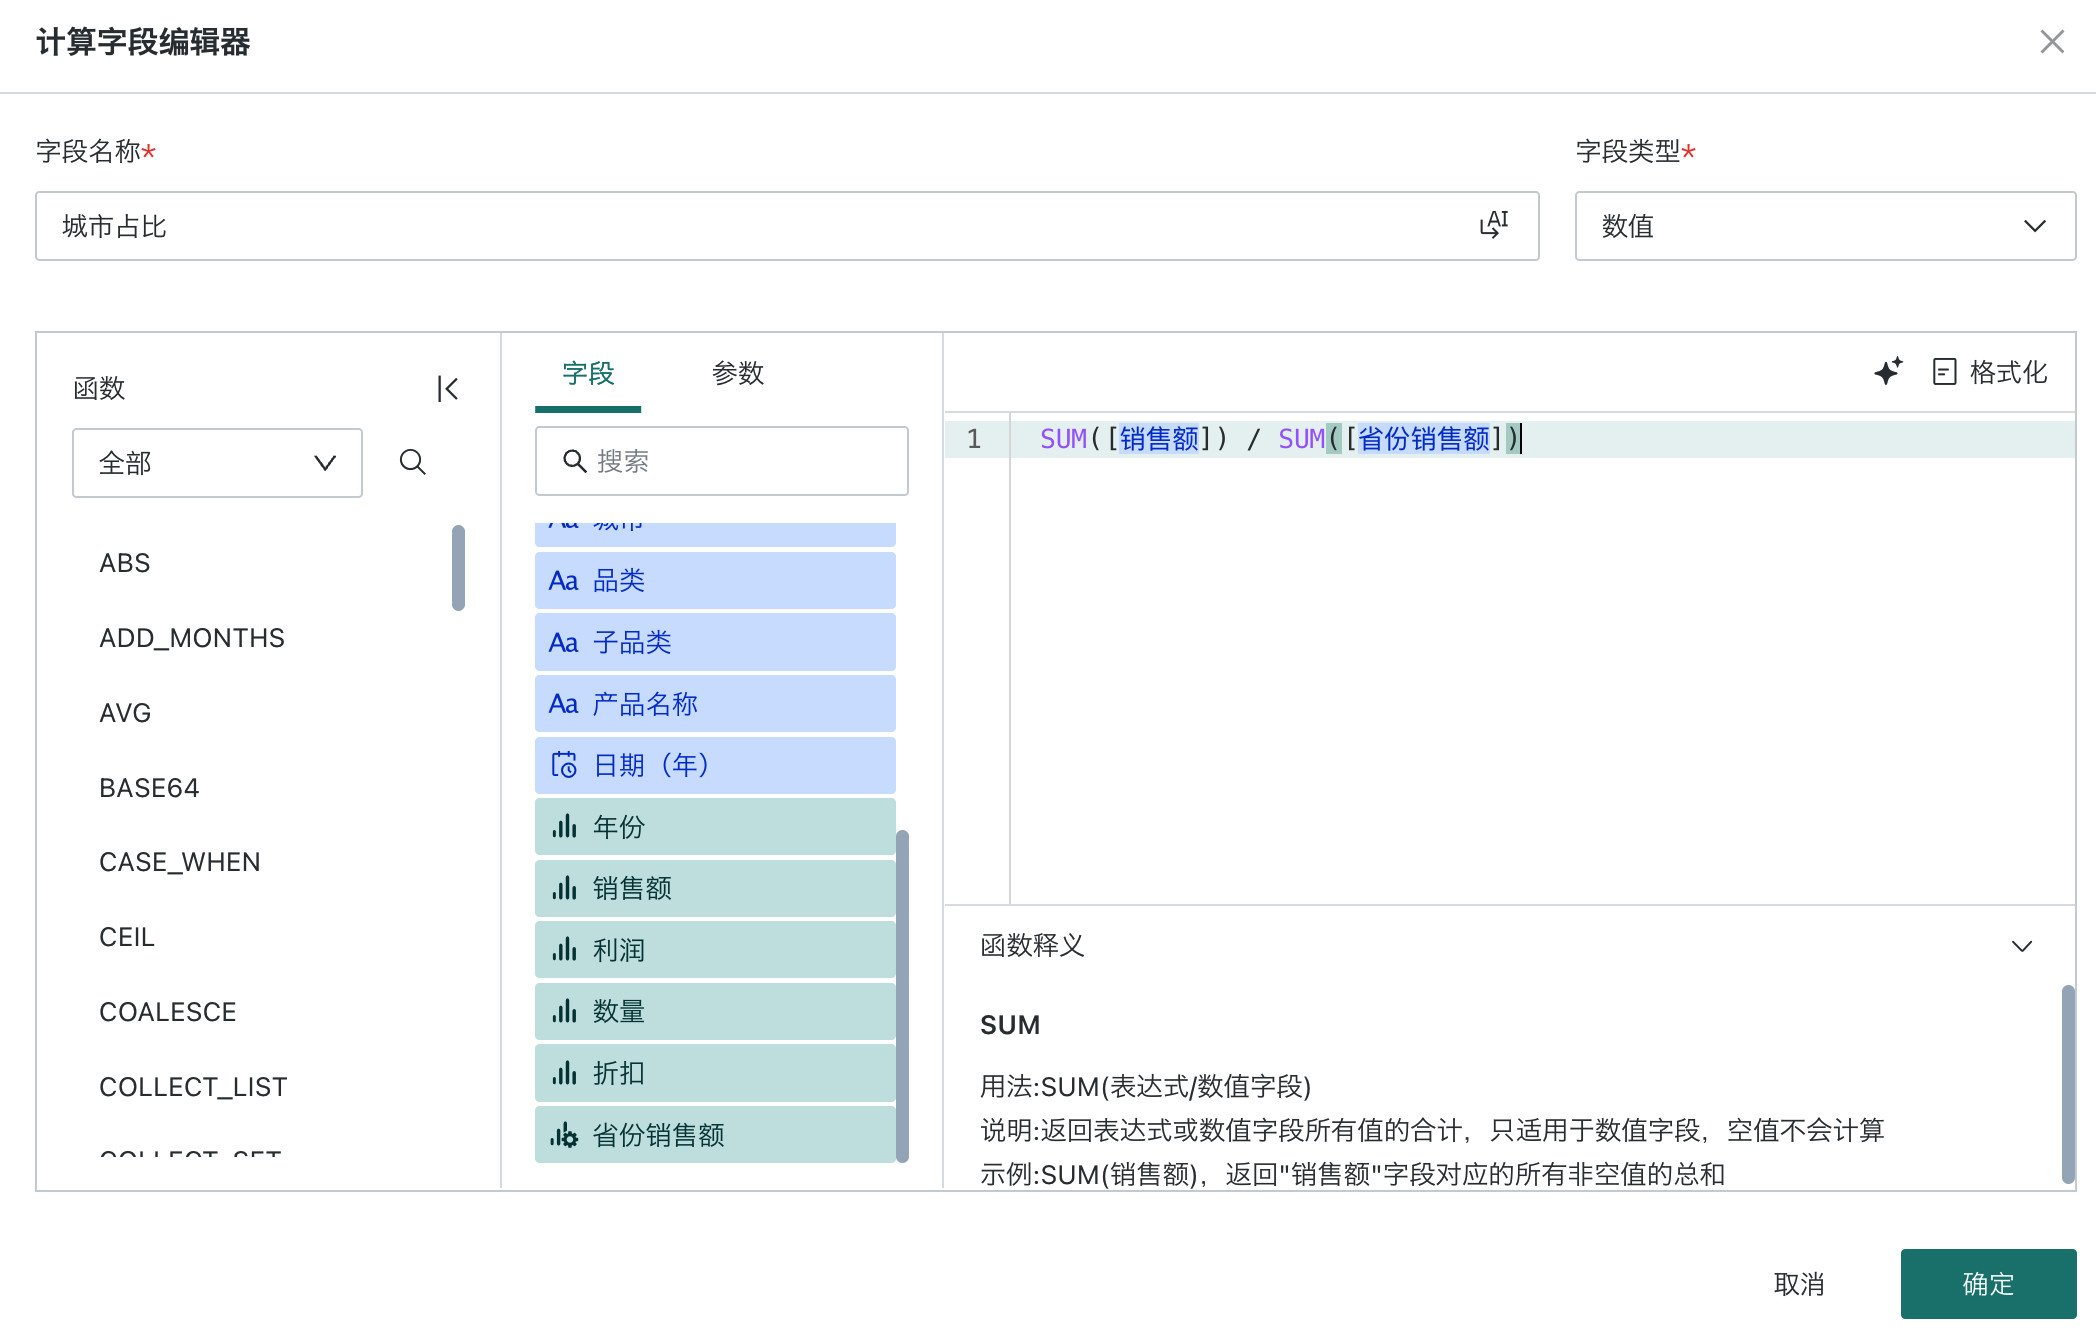
-
Create the chart
- Drag Province and City to the Dimensions area, with Province before City.
- Drag City Sales Percentage to the Values area.
- Format the value as a percentage and save the card.
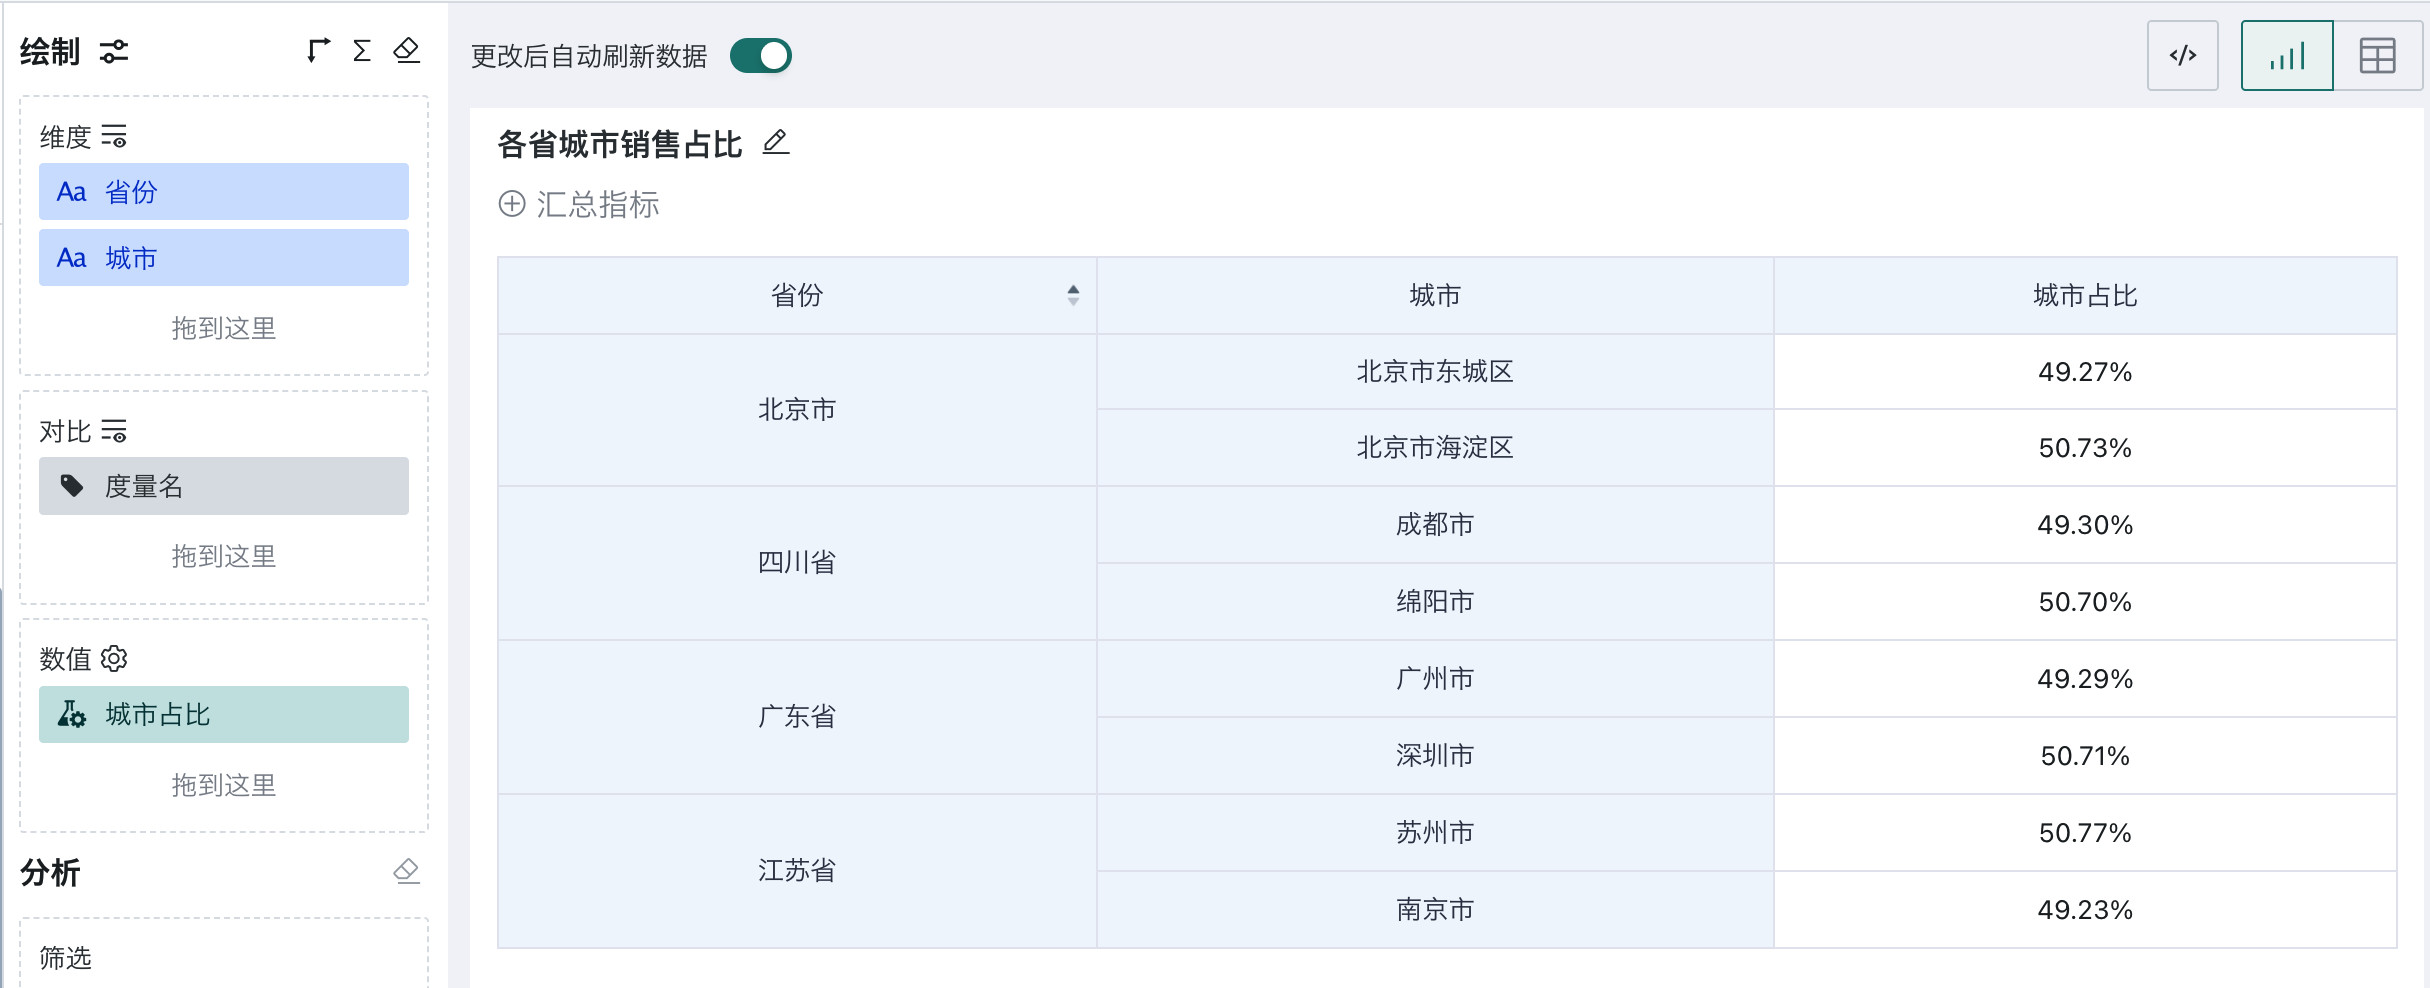
Result
Each row shows a city's contribution to its province. For example, 52% means the city contributes 52% of the province's sales. Percentages for all cities in the same province should add up to 100%.
Add Calculation Granularity (INCLUDE)
INCLUDE adds a specified dimension to the current chart granularity. This lets a chart calculate from detailed results without displaying all detail dimensions. The following scenario first calculates sales by Region × Category and then returns the maximum of those detailed results.
Scenario 6: Maximum Category Sales by Region
Business Requirement
For each region, calculate the maximum sales value among its categories.
Business Value
Without displaying category details, compare the best-performing category sales across regions to quickly identify each region's category sales ceiling and scale.
Recommended LOD Expression
{ INCLUDE [Category]: SUM([Sales]) }
Logic:
- The chart granularity is Region.
INCLUDE [Category]adds Category during calculation. - The LOD field first calculates sales for each Region × Category. The chart then takes the maximum of these values for each region.
Procedure
-
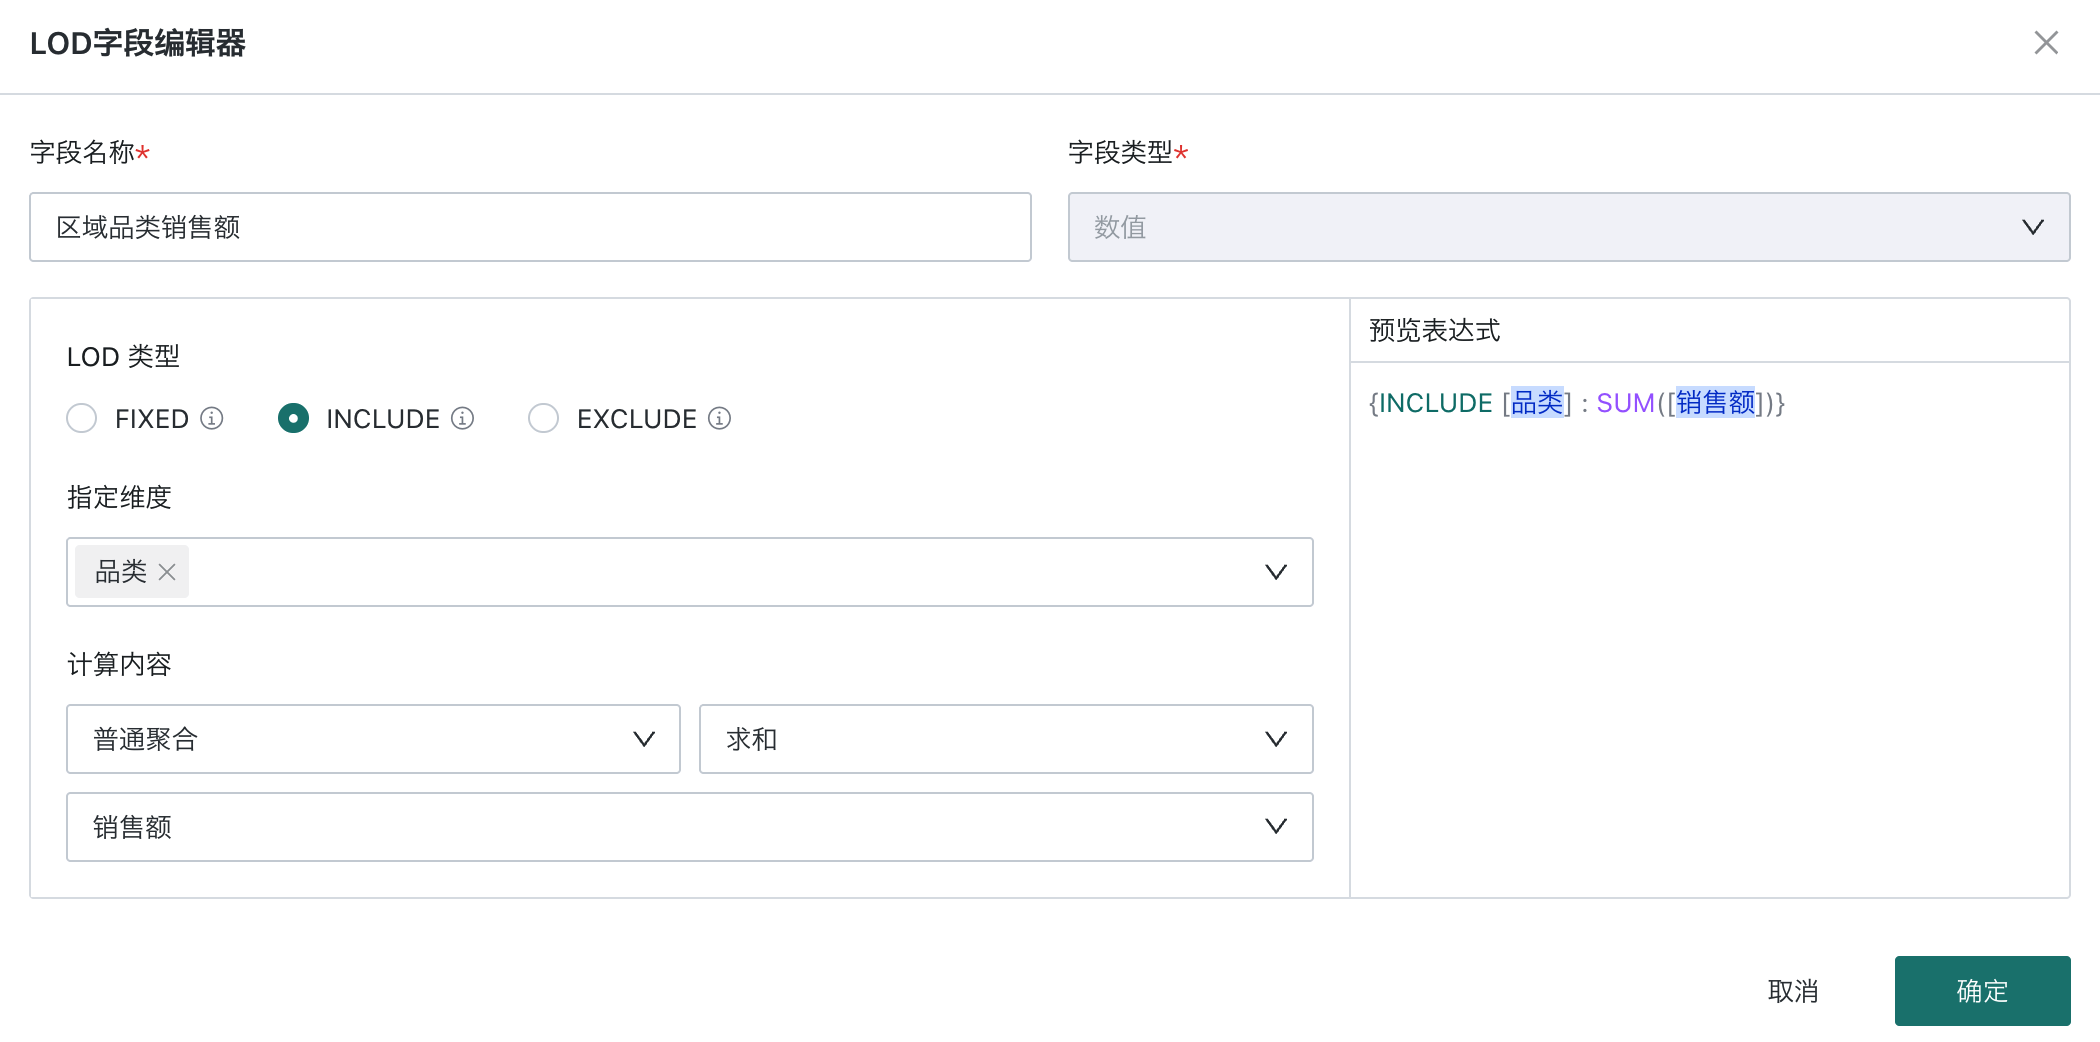
Create the LOD field "Regional Category Sales"
- LOD type:
INCLUDE - Specified dimension:
Category - Calculation:
Standard Aggregation > Sum > Sales
- LOD type:
-
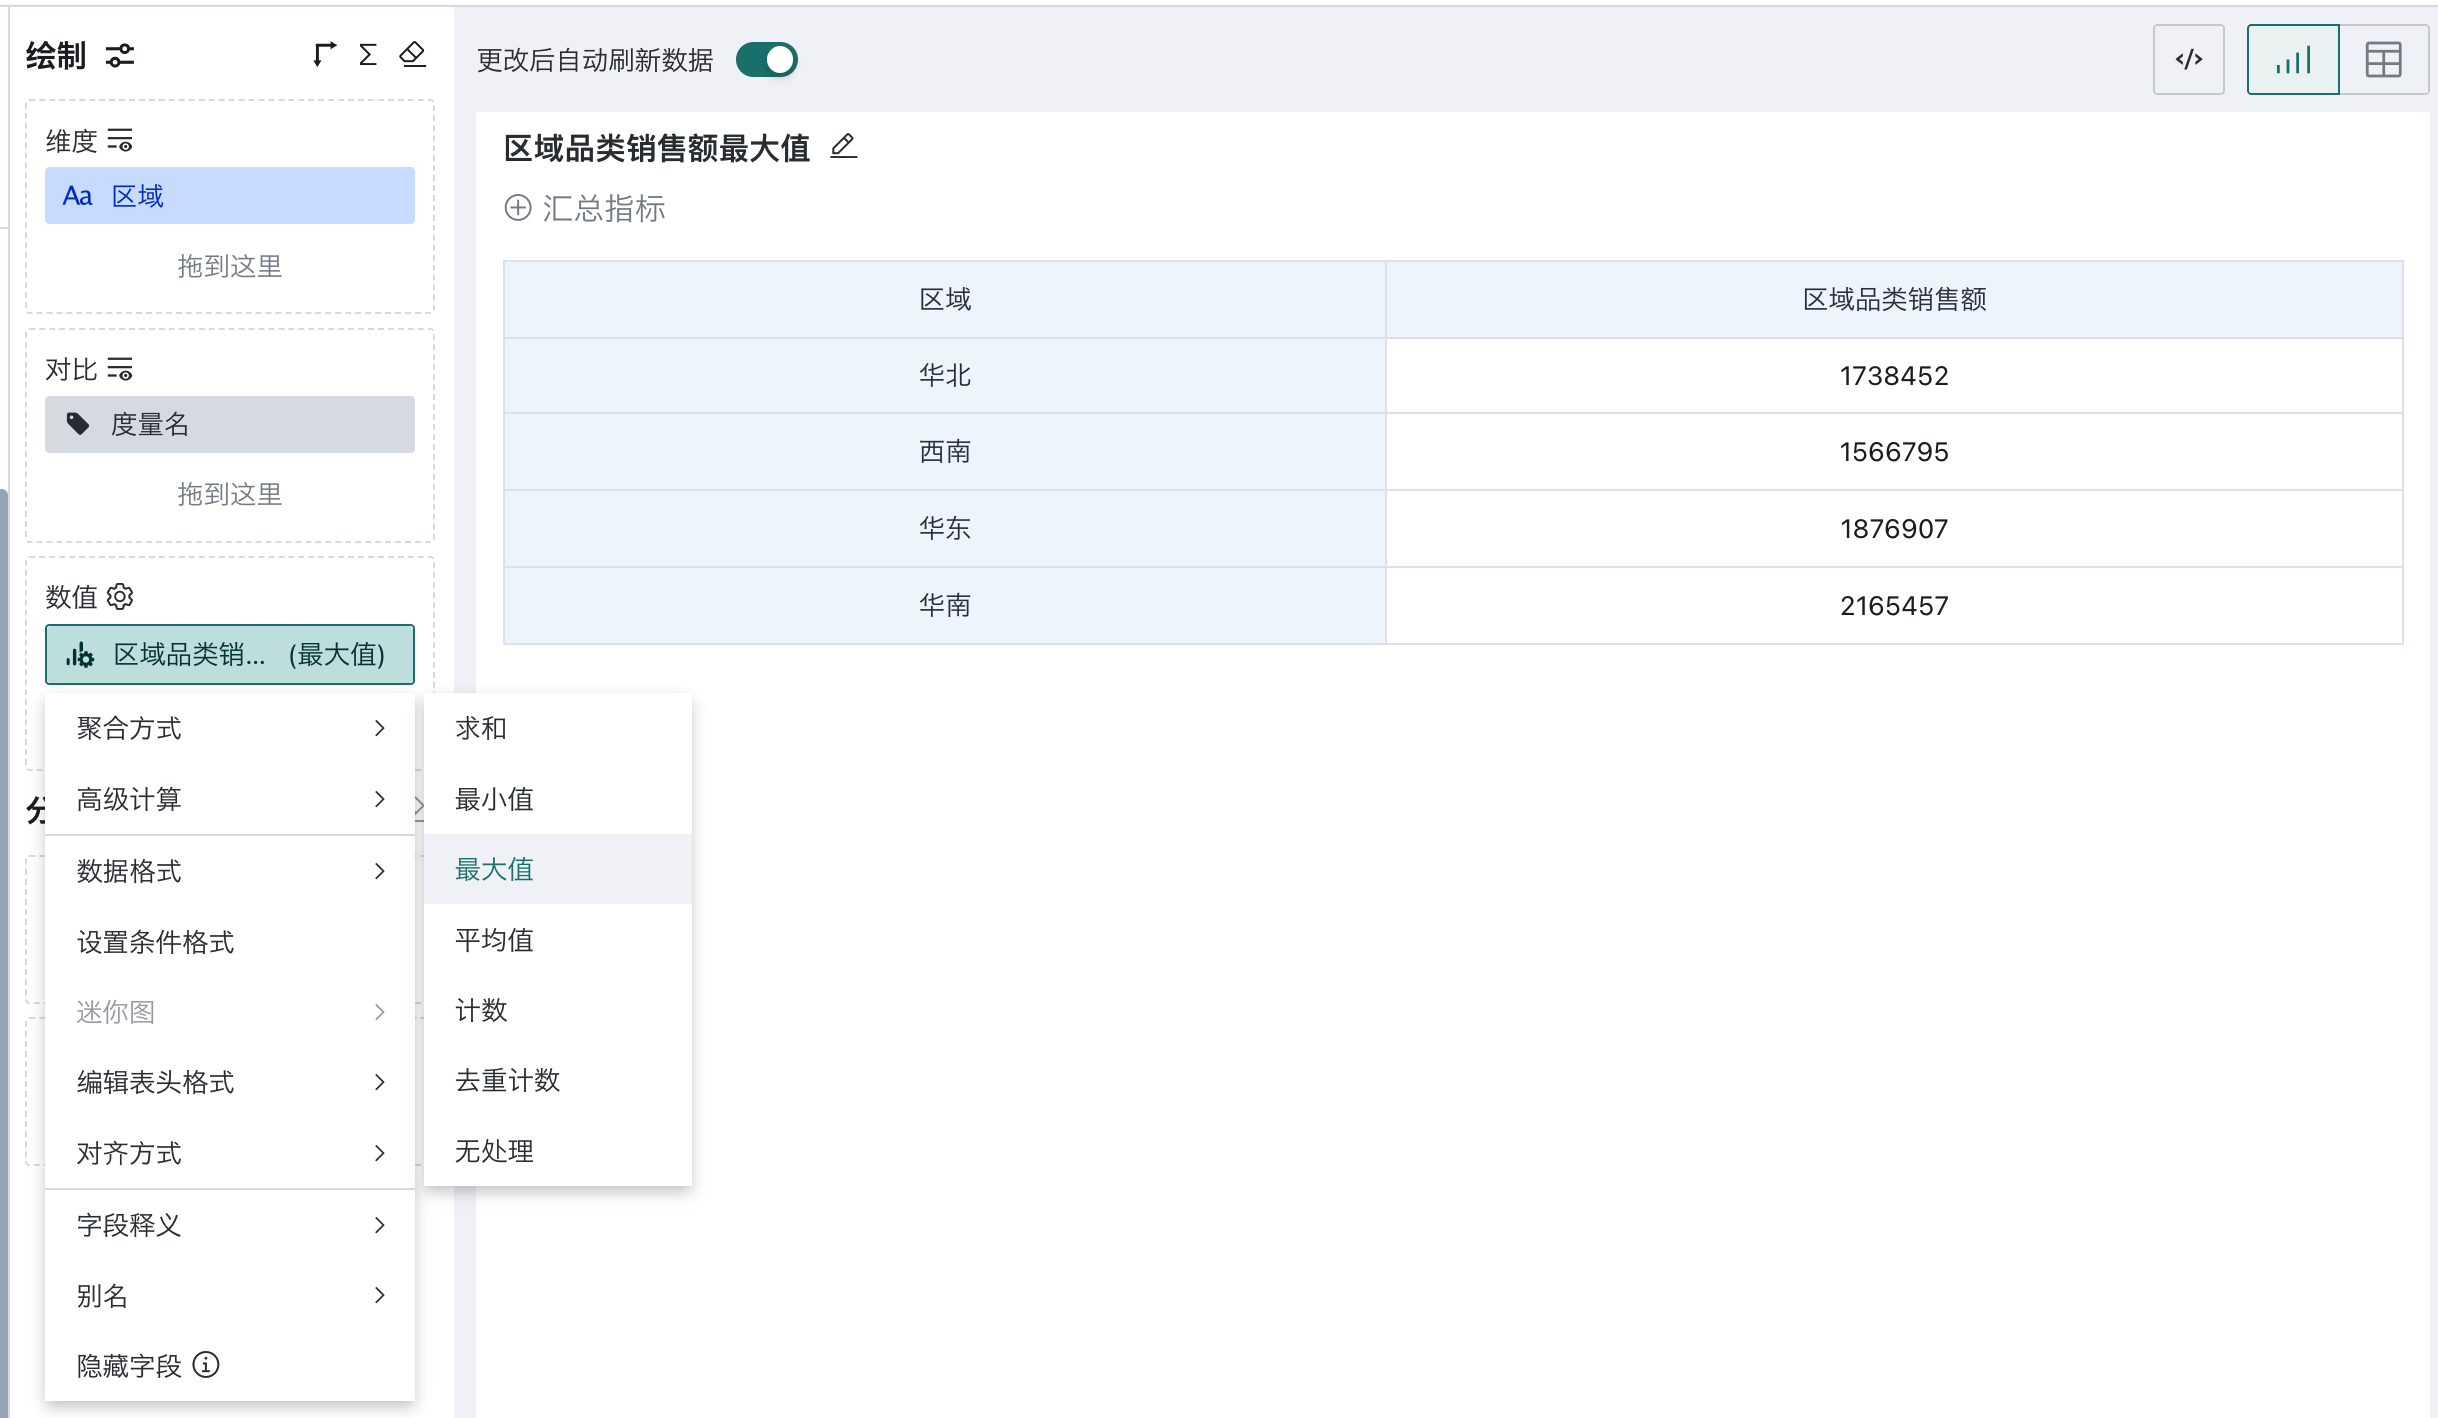
Create the chart and set the maximum aggregation
- Drag Region to the Dimensions area.
- Drag Regional Category Sales to the Values area.
- Click the value field and select Maximum under Aggregation.
- Save the card. The final chart contains only Region and Regional Category Sales.
Result
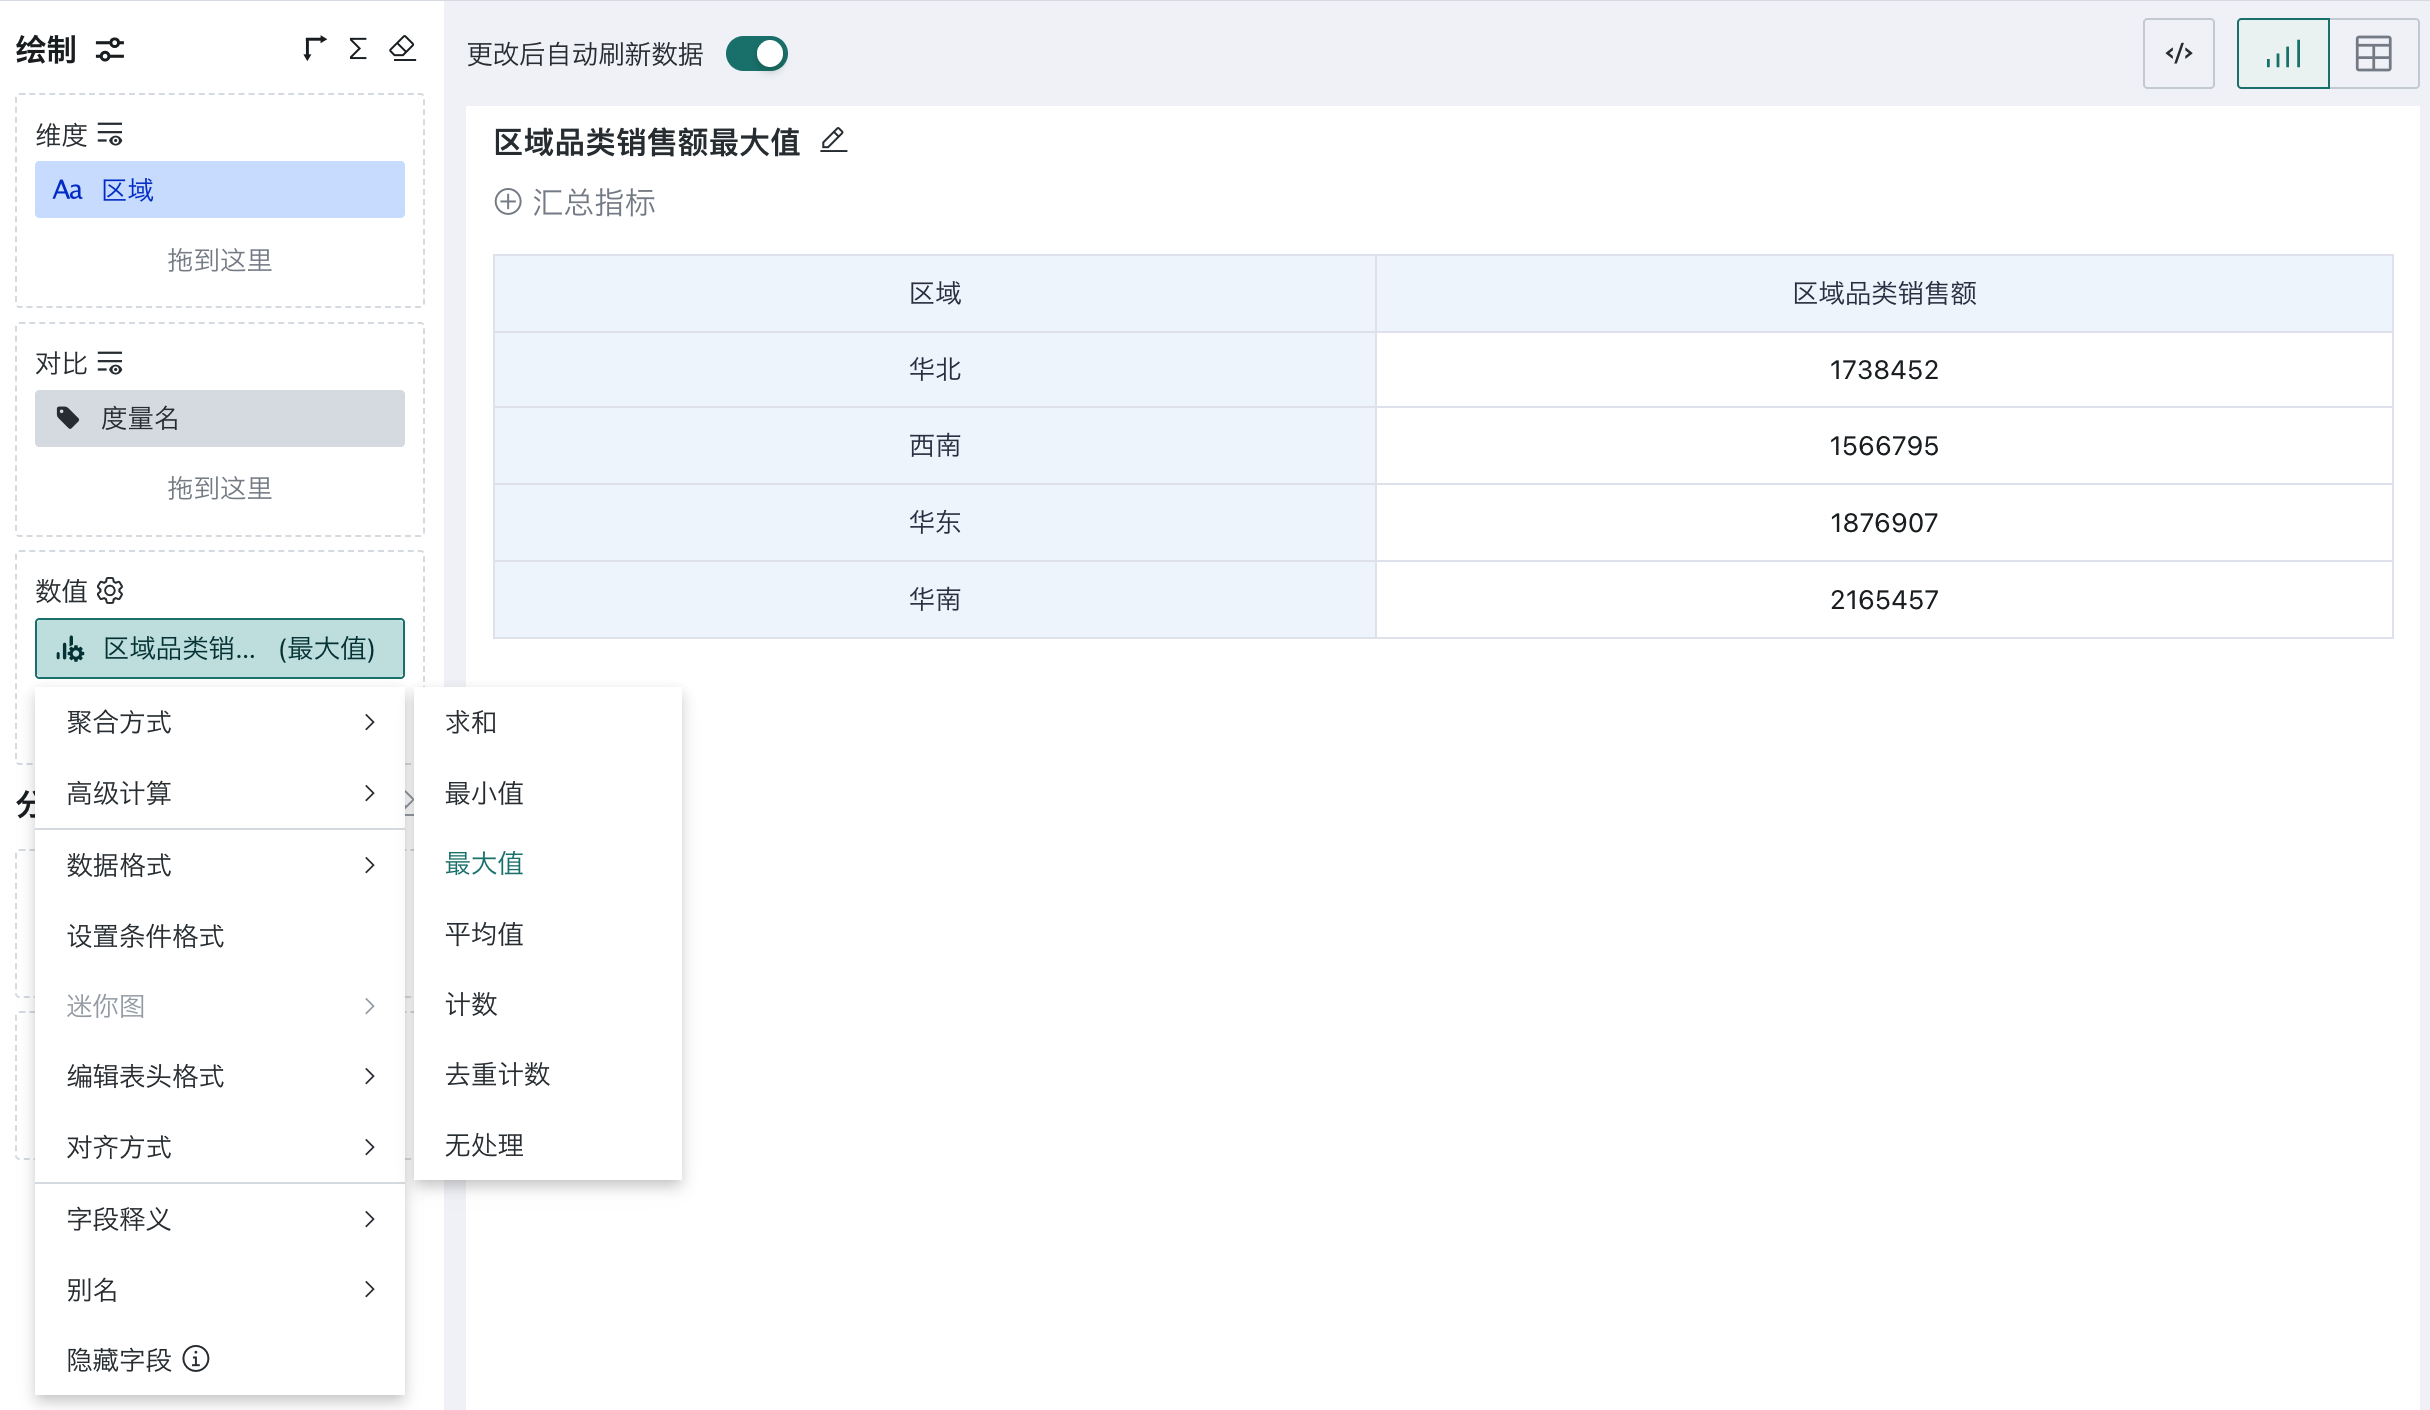
Each row shows the maximum category sales in that region. For example, North China is 1,738,452, East China is 1,876,907, and South China is 2,165,457.
This scenario returns the maximum sales value, not the corresponding category name. To identify the category, display Region, Category, and Regional Category Sales and sort by sales in descending order, or use ETL to filter category records whose sales equal the regional maximum.