Create New Field
Overview
Feature Overview
When the fields provided by a dataset do not meet your analysis needs during chart creation, you can use Create New Field to build new fields on top of existing ones through calculations, grouping, or filtering, and then analyze data with those newly created fields.
Three methods are supported: creating grouped fields, filtered fields, and calculated fields. Users can choose the most appropriate method based on the actual business requirement.
Use Cases
In a sales analysis scenario, for example:
- If you need to analyze gross profit, but the raw data provides only sales amount, quantity, and cost price, you can create a calculated field for gross profit.
- If you want to analyze sales by region but the data includes only store information and not region information, you can create a grouped field to assign stores to regions and complete the regional sales analysis.
- If you want sales amount for specific product categories such as cosmetics, daily necessities, or food, you can create a filtered field with a condition like
Product Category = Cosmetics, generate a new field such as Cosmetics Sales Amount, and analyze sales for that product category.
Create a Calculated Field
Overview
When charting, if the existing fields do not meet your needs, you can create a calculated field to obtain the required metric.
There are two ways to create a calculated field: in the dataset or in the card. If you want the calculated field to be reusable by all users, it is recommended to create it in the dataset. In practice, there is no difference in how the two are used.
Calculated fields support a wide variety of scenarios, including aggregation, arithmetic operations, window functions, string splitting and merging, and complex grouping. For common functions, see Common Spark Functions.
Function Details
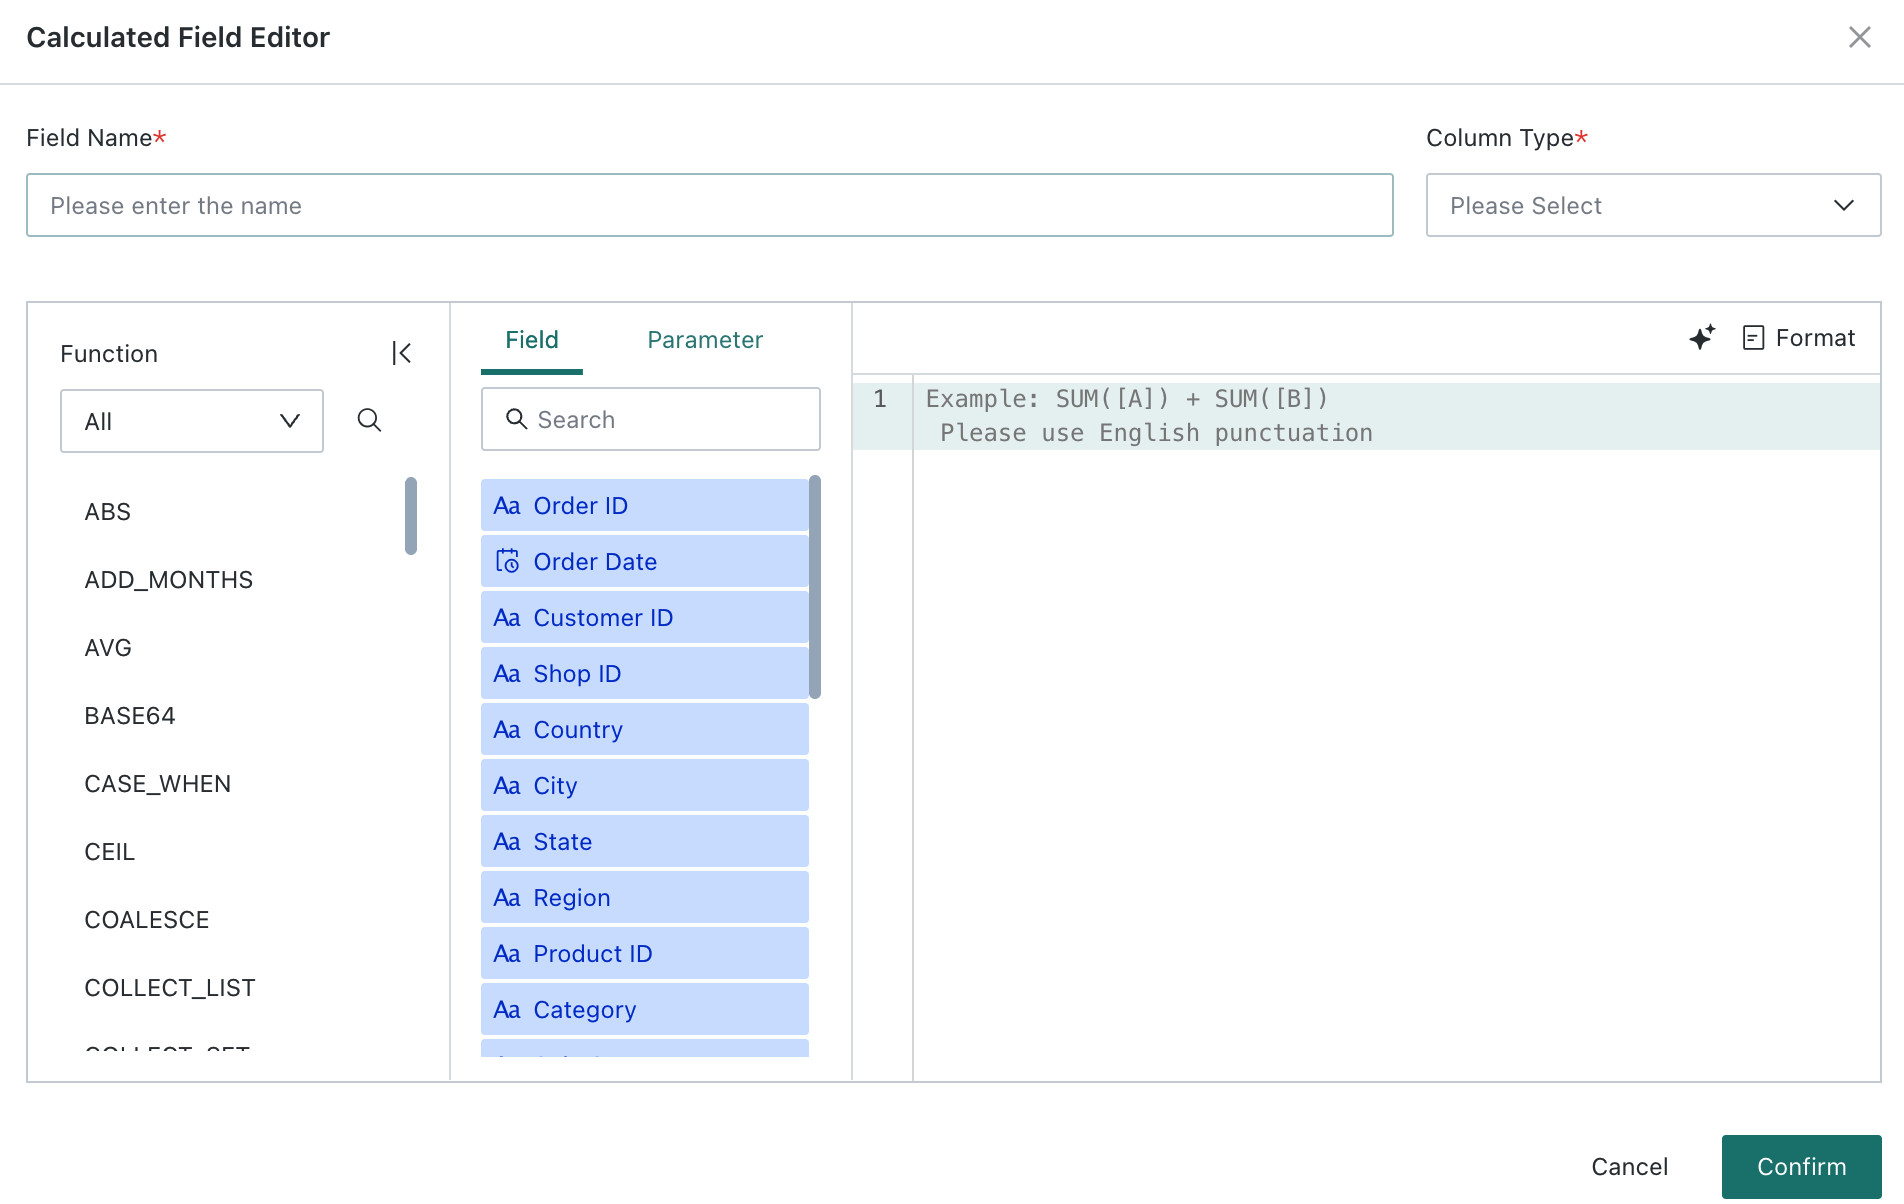
The calculated field editor consists of five parts, as shown below:
- Field Name: the name of the new field
- Field Type: five types are available, namely text, numeric, date, date-time, and boolean
- Function List on the left: provides a rich set of functions. In extracted mode, all Spark functions are also supported beyond the listed ones. For details, see Function List
- Field and Parameter List in the middle: the field list shows all raw and newly created fields in the current dataset, while the parameter list shows global parameters preset by administrators
- Formula Editor on the right: after a formula is entered, hints appear below it, and one-click formatting is supported to improve readability
- In addition to typing field names manually, you can click a field or parameter in the middle area to insert it directly. If you type manually, the field name must be wrapped in square brackets
[]to be recognized correctly. - When deleting a field or a function, it is treated as a whole and can be deleted in one operation, reducing manual effort.
- When typing functions manually, matching functions are recommended automatically based on keywords.
Common Use Cases
For more examples, see the following references:
- Field Split Case Study
- Use Window Functions for Cumulative Calculation
- Use Distinct Count Functions for Windowing
- Combined Function Use Cases
- How to Use count_if
- Functions for Extracting Year and Month
- Sorting Functions and Use Cases
Create a Grouped Field
Overview
If you want to group dimension members or measure values, you can use Create Grouped Field.
For example, you can group the values of the dimension field Province into regions such as East China and South China and then analyze with Region as the dimension. You can also bucket the measure Sales Amount into ranges such as 0-100, 100-300, and 300-500 to analyze performance across value ranges.
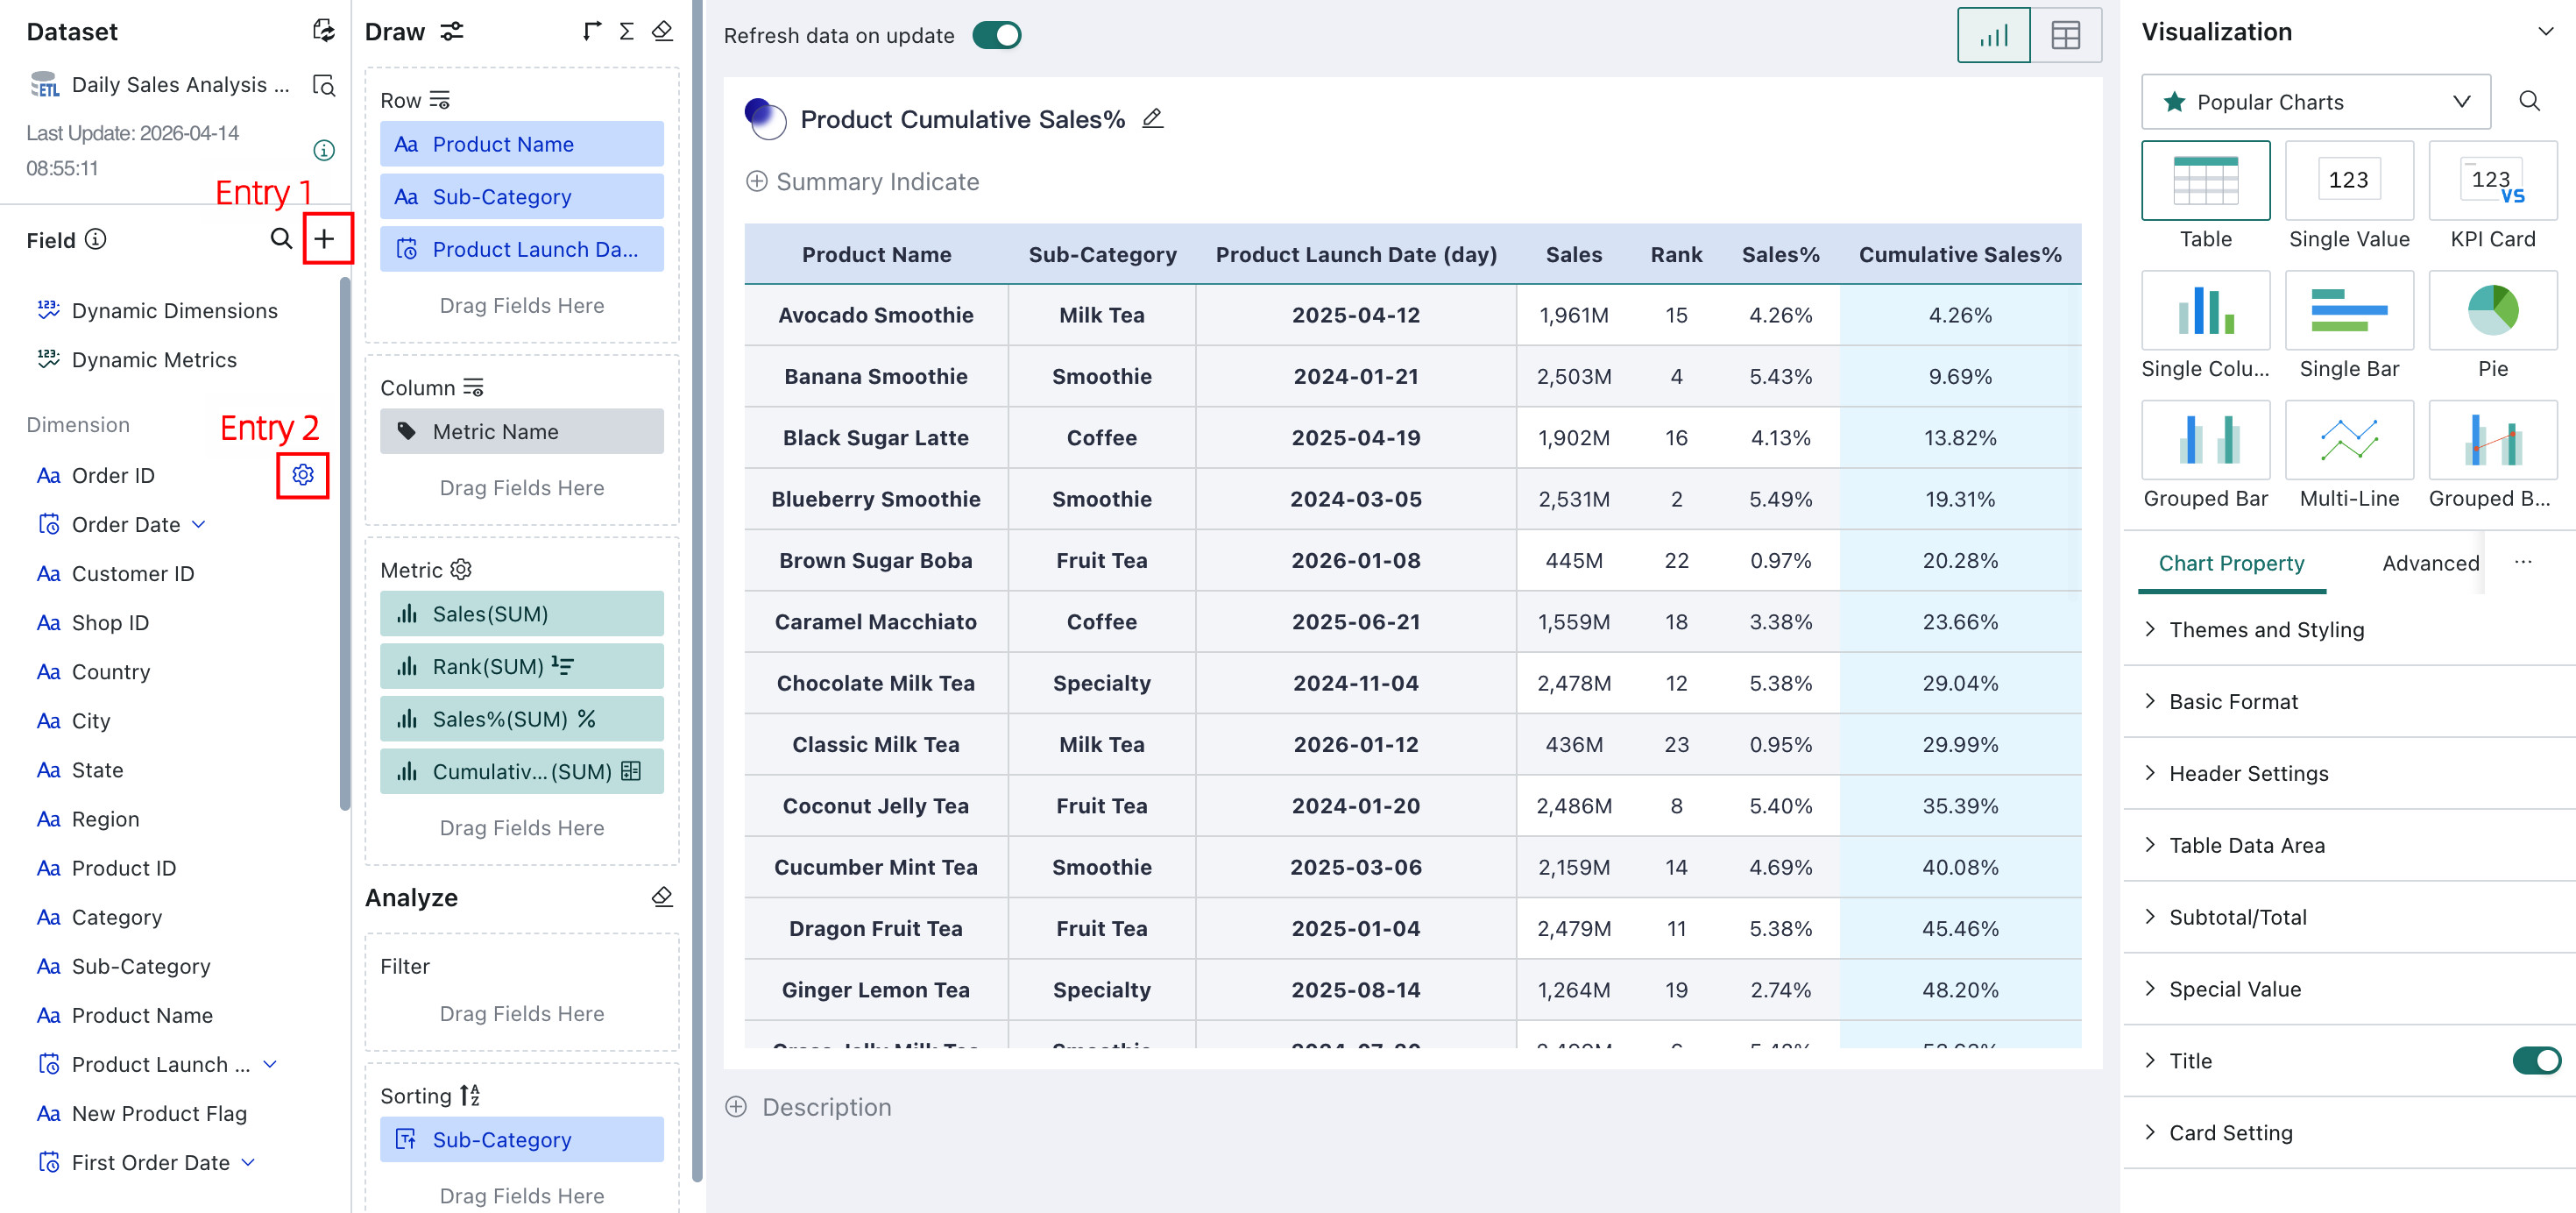
Feature Overview
When you need to group dimension or measure fields, that is, merge values of the same type into groups based on specified conditions, you can use the grouped field feature.
There are two entry points, as shown below: the + button at the top right of the field list, or the settings button that appears when hovering over a field name.
Different grouping methods are provided for different field types:
Text fields: item grouping and condition grouping
Date/time fields: after grouping, the result becomes a text field. Three grouping methods are supported: item grouping, fixed step, and custom step
Numeric fields: after grouping, the result becomes a dimension field. Three grouping methods are supported: item grouping, fixed step, and custom step
Usage Instructions
Text Type
For text-type dimension fields, Item and Condition grouping are supported. Ungrouped items can either be merged or kept as separate items.
-
Item: select and group dimension members manually, as shown below:
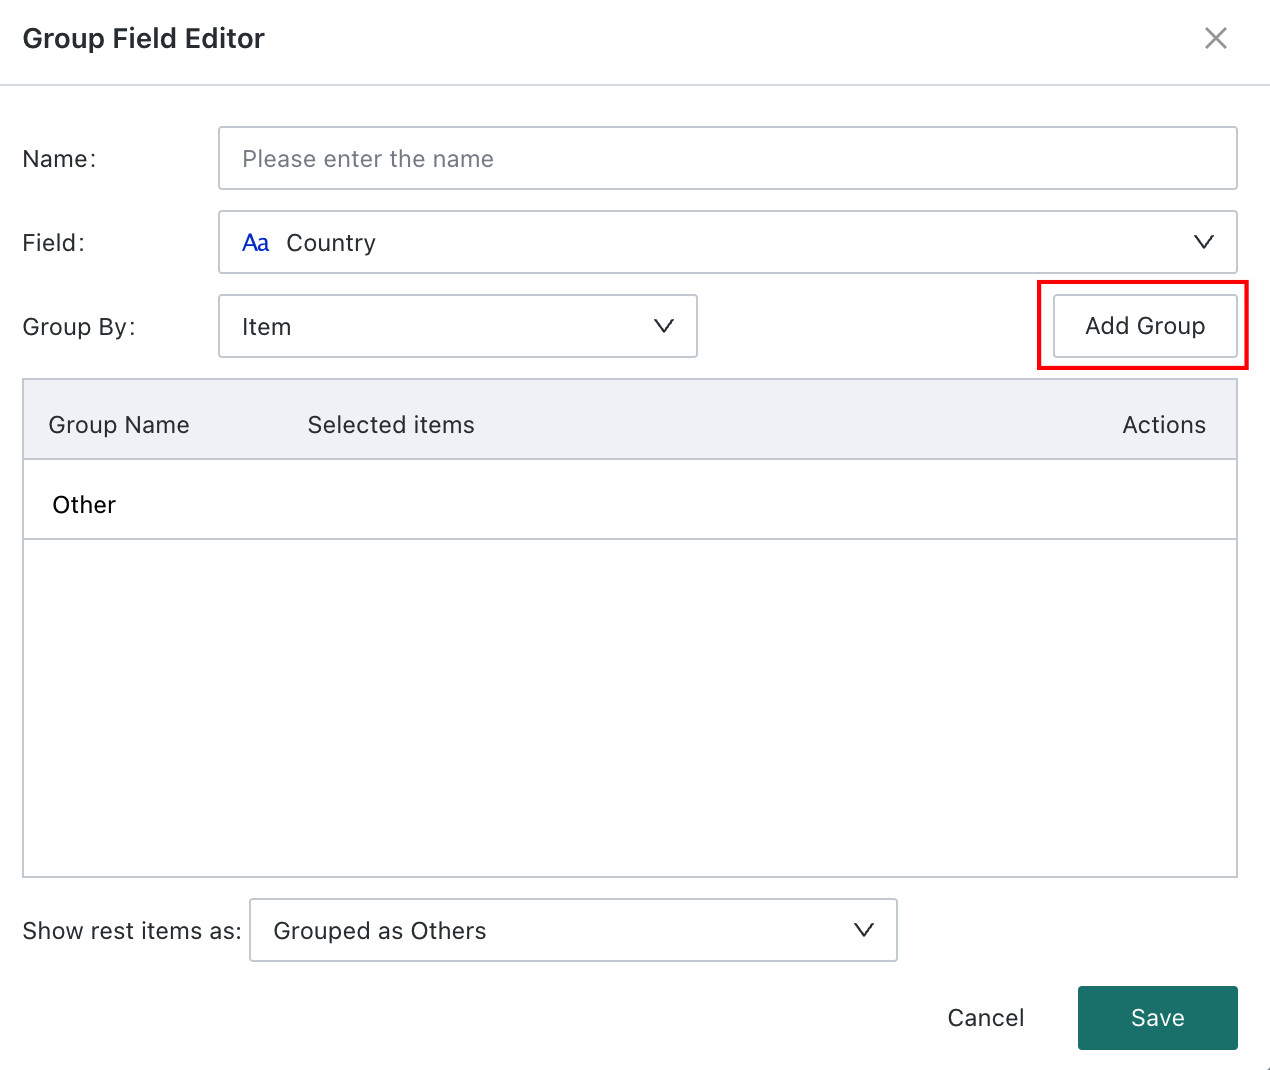
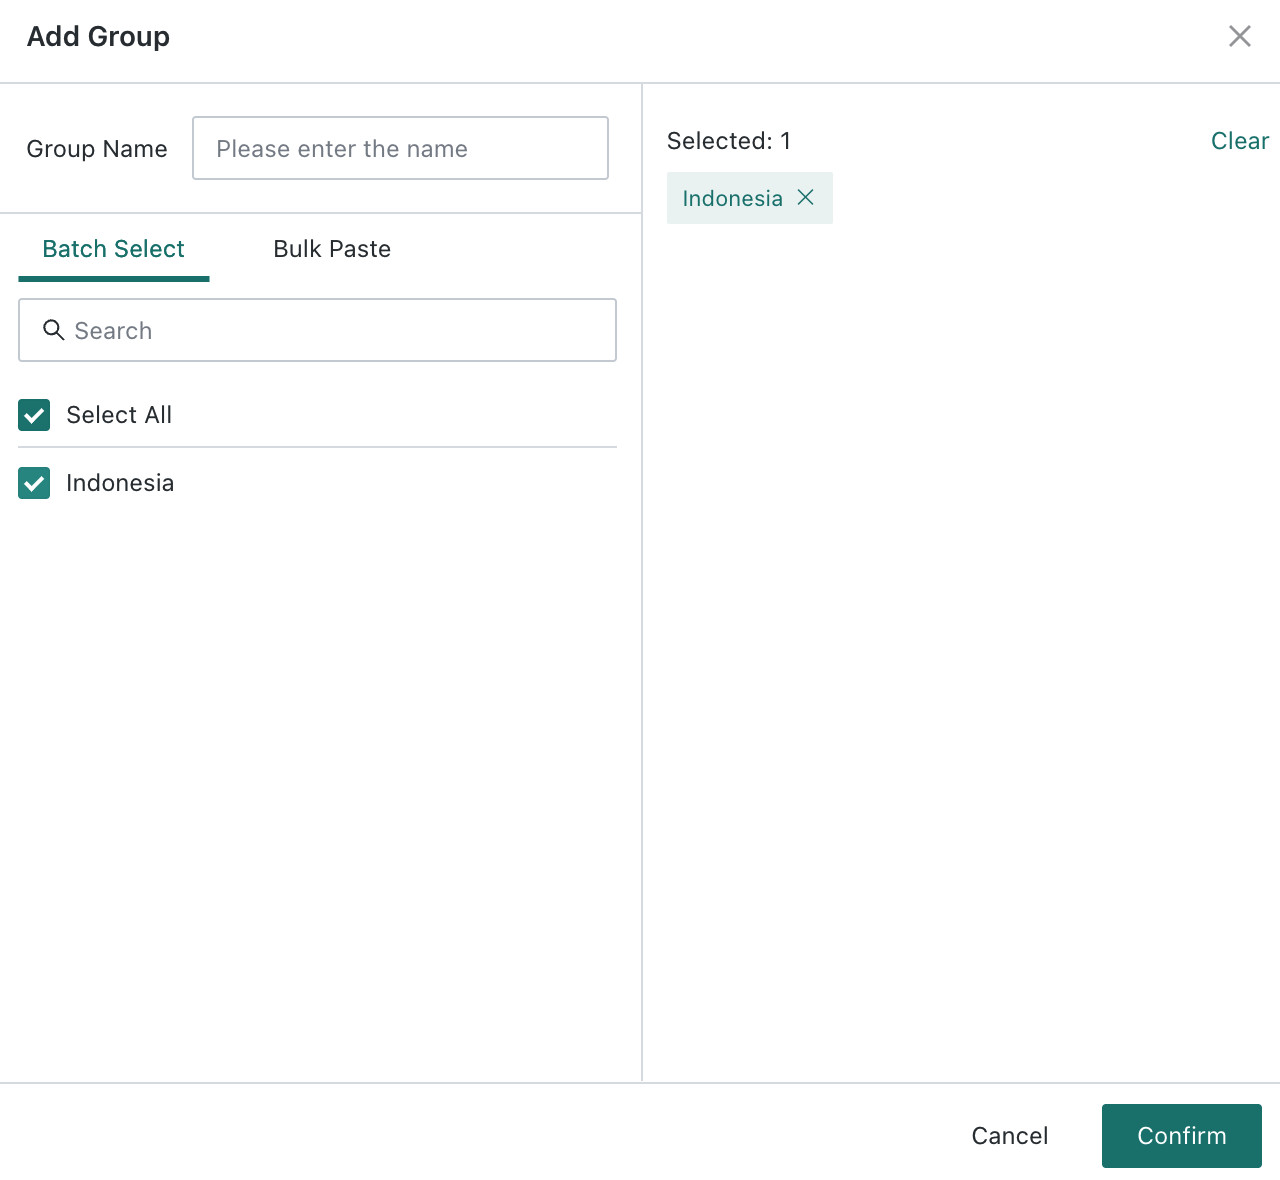
After creation, the new grouped field such as Region Grouping appears in the dimension field area. Hover over the field and use the settings icon to edit it again, regroup it, or delete it.
Ungrouped fields support two modes:
- Separate Items: every uncategorized dimension member is shown as its own group
- Merged Items: all uncategorized dimension members are merged into Others
-
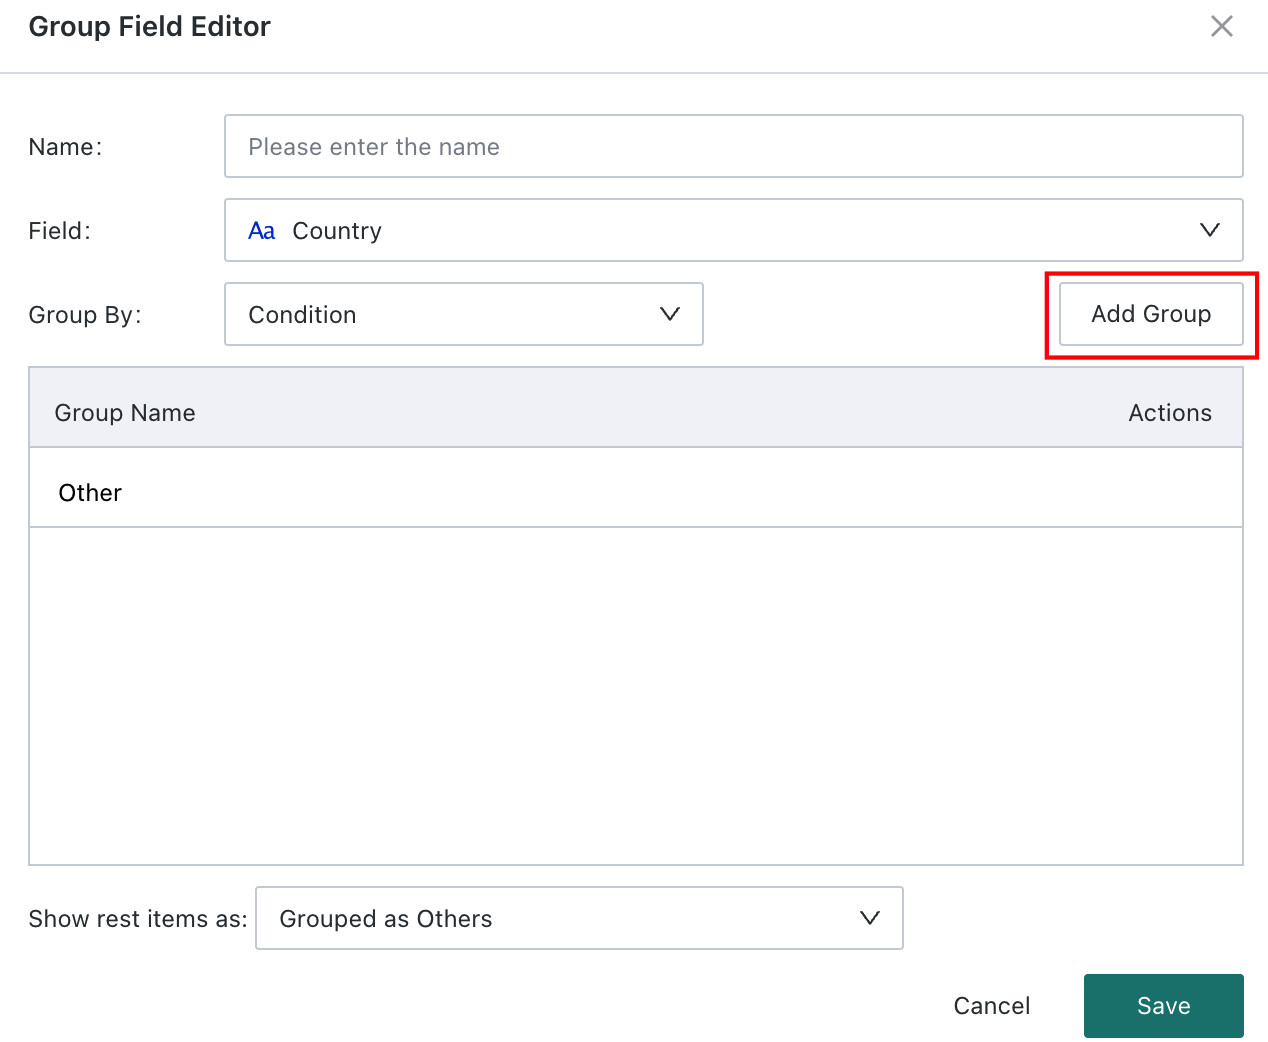
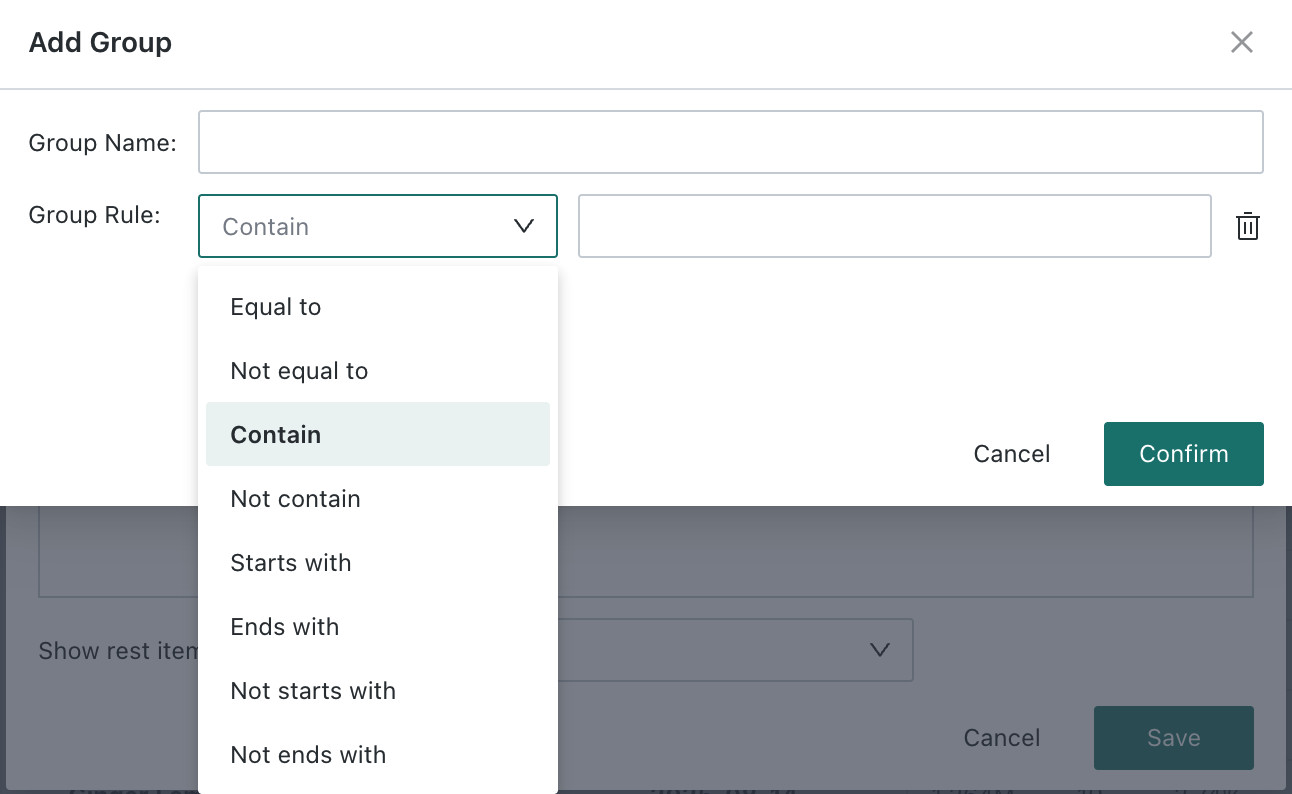
Condition: create a group for data that matches a specified condition. Supported operators include equals, does not equal, contains, does not contain, starts with, ends with, does not start with, and does not end with.
Date Type
After grouping, date/time fields become text fields. Three grouping methods are supported: item grouping, fixed step, and custom step. Ungrouped fields can either be merged or kept separate.
-
Item: manually group dimension members one by one. The logic is the same as item grouping for dimension fields.
-
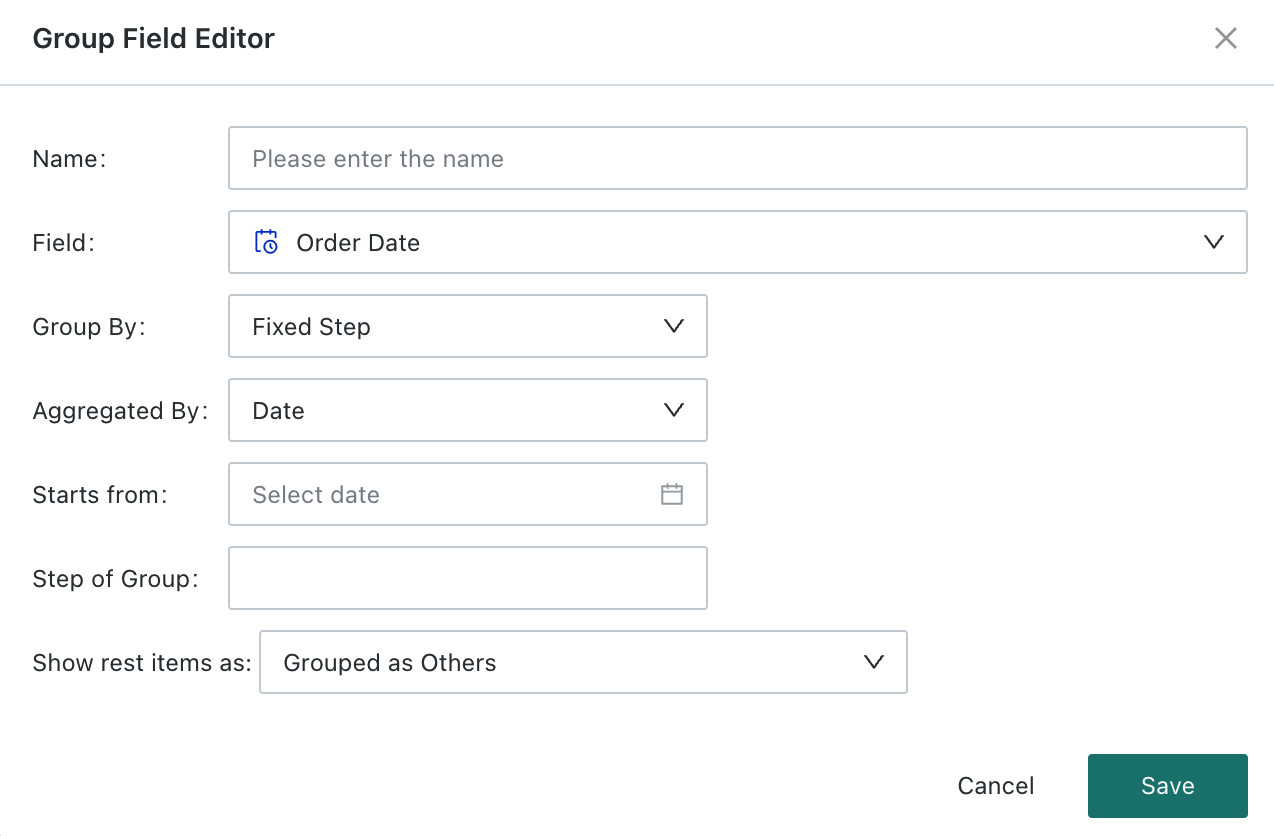
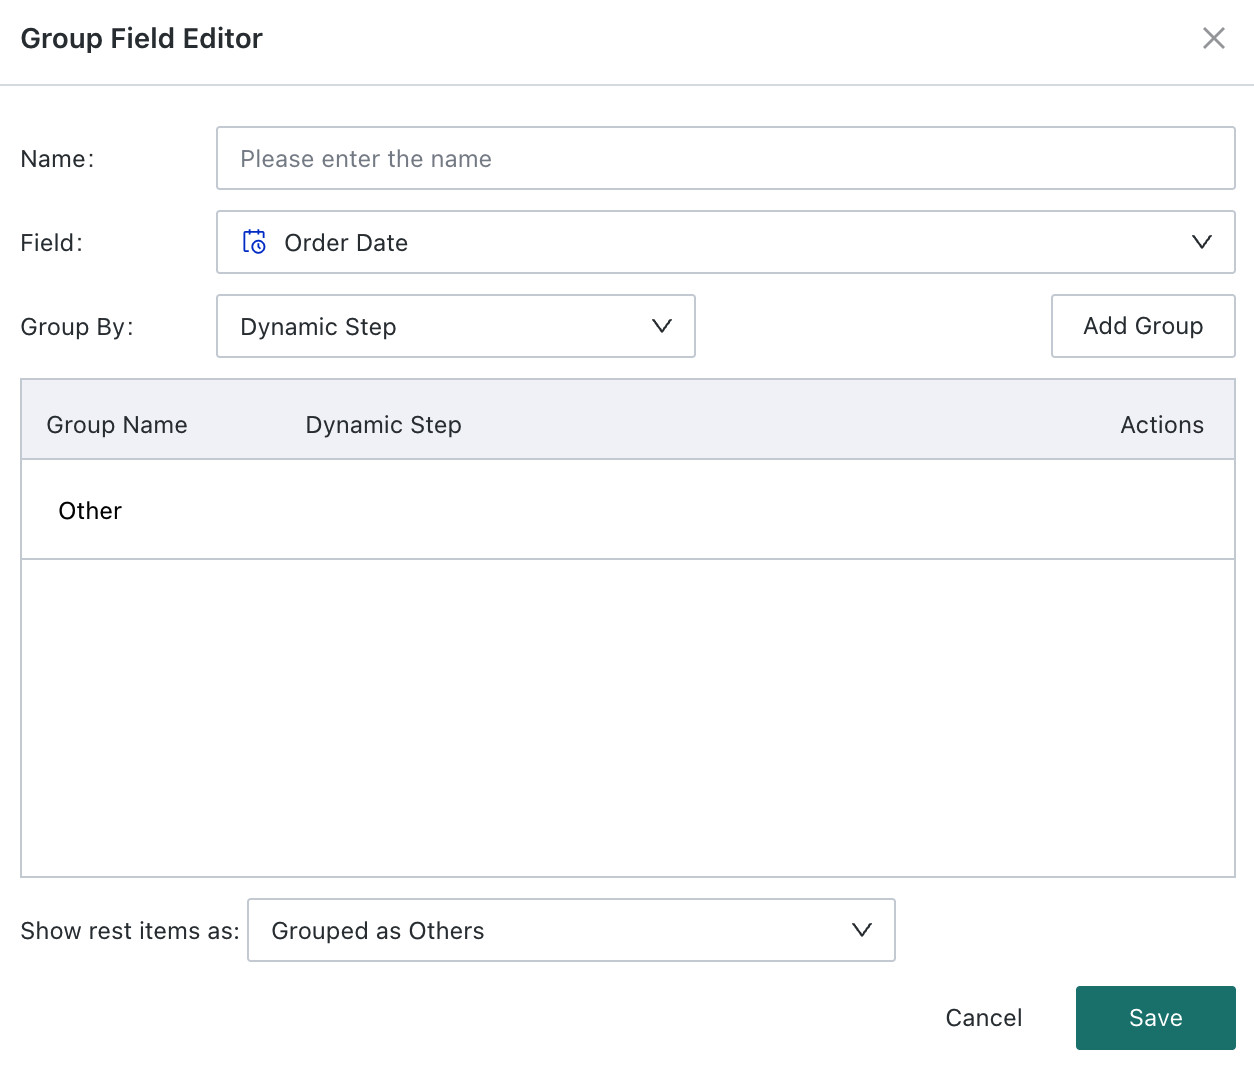
Fixed Step: when you want to group dates according to a regular interval, such as several days, weeks, months, quarters, or years, use this option.
Notes- Aggregation granularity can be configured as day, week, month, quarter, or year.
- A start time is required.
- Group step must be a positive integer. For example, when the step is 2 and the aggregation granularity is month, each group contains two months, and the interval is closed on both sides.
For example, if you want to analyze sales in 15-day intervals since January 1, 2022, set the aggregation granularity to day, the start time to January 1, 2022, and the step to 15.
-
Custom Step: when you want to define several time periods manually as groups, use custom step. Only day granularity is supported.
Numeric Type
After grouping, numeric fields become dimension fields. Three grouping methods are supported: item grouping, fixed step, and custom step. Ungrouped fields can either be merged or kept separate.
- Item: manually group dimension members one by one. The logic is the same as item grouping for dimension fields.
- Fixed Step: when you want to divide a specified numeric range into regular intervals, use this option. In the example below, sales amount from
0-5000is grouped with a fixed step of1000. Each interval is left-closed and right-open by default. - Custom Step: when you want to define the range of each group yourself, use custom step. In addition to customizing the interval range, you can also customize whether each side of the interval is open or closed.
Create a Filtered Field
Overview
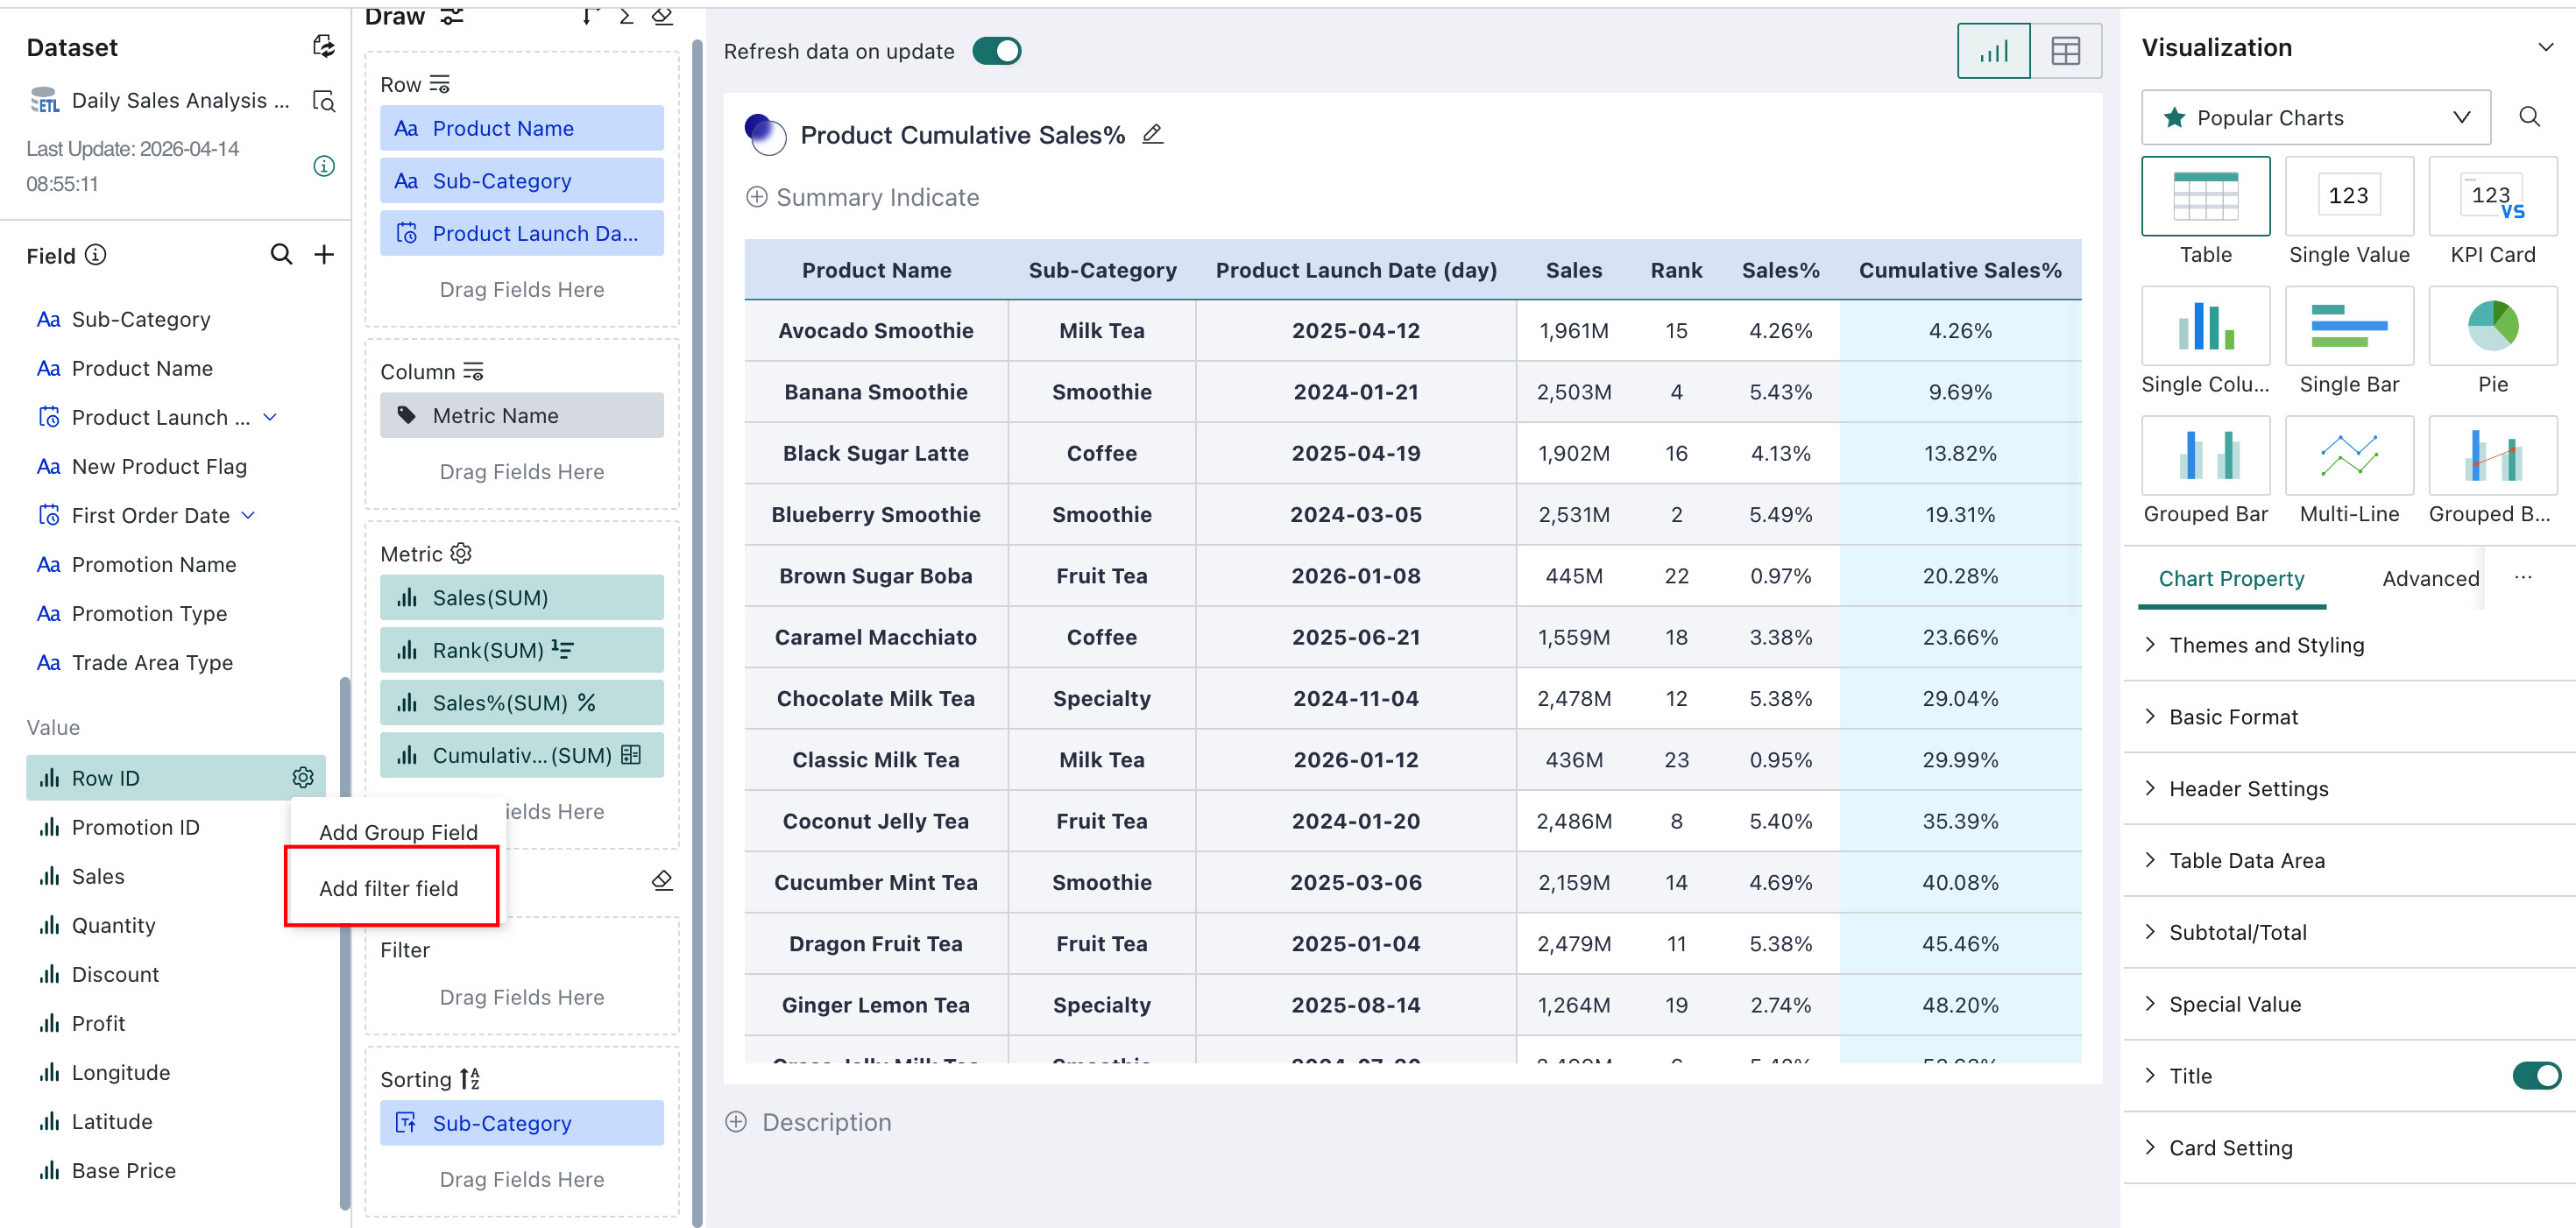
When you need to view data under specific conditions, you can create a filtered field and apply filter conditions to complete metric analysis under those conditions.
Feature Overview
A filtered field applies specified conditions to an existing numeric field and forms a new field from the filtered result. It supports AND and OR combined conditions, with up to five levels of condition nesting.
Usage restriction: only numeric fields support creation of filtered fields. Dimension fields, calculated fields, and aggregated measures are not supported.