Overview
When editing a Card in Guandata BI, the editing page is mainly divided into four areas: the Data Area, the Plotting Area, the Preview Area, and the Visualization Area. This section introduces the configuration operations available in each area to help you create visualization charts successfully.
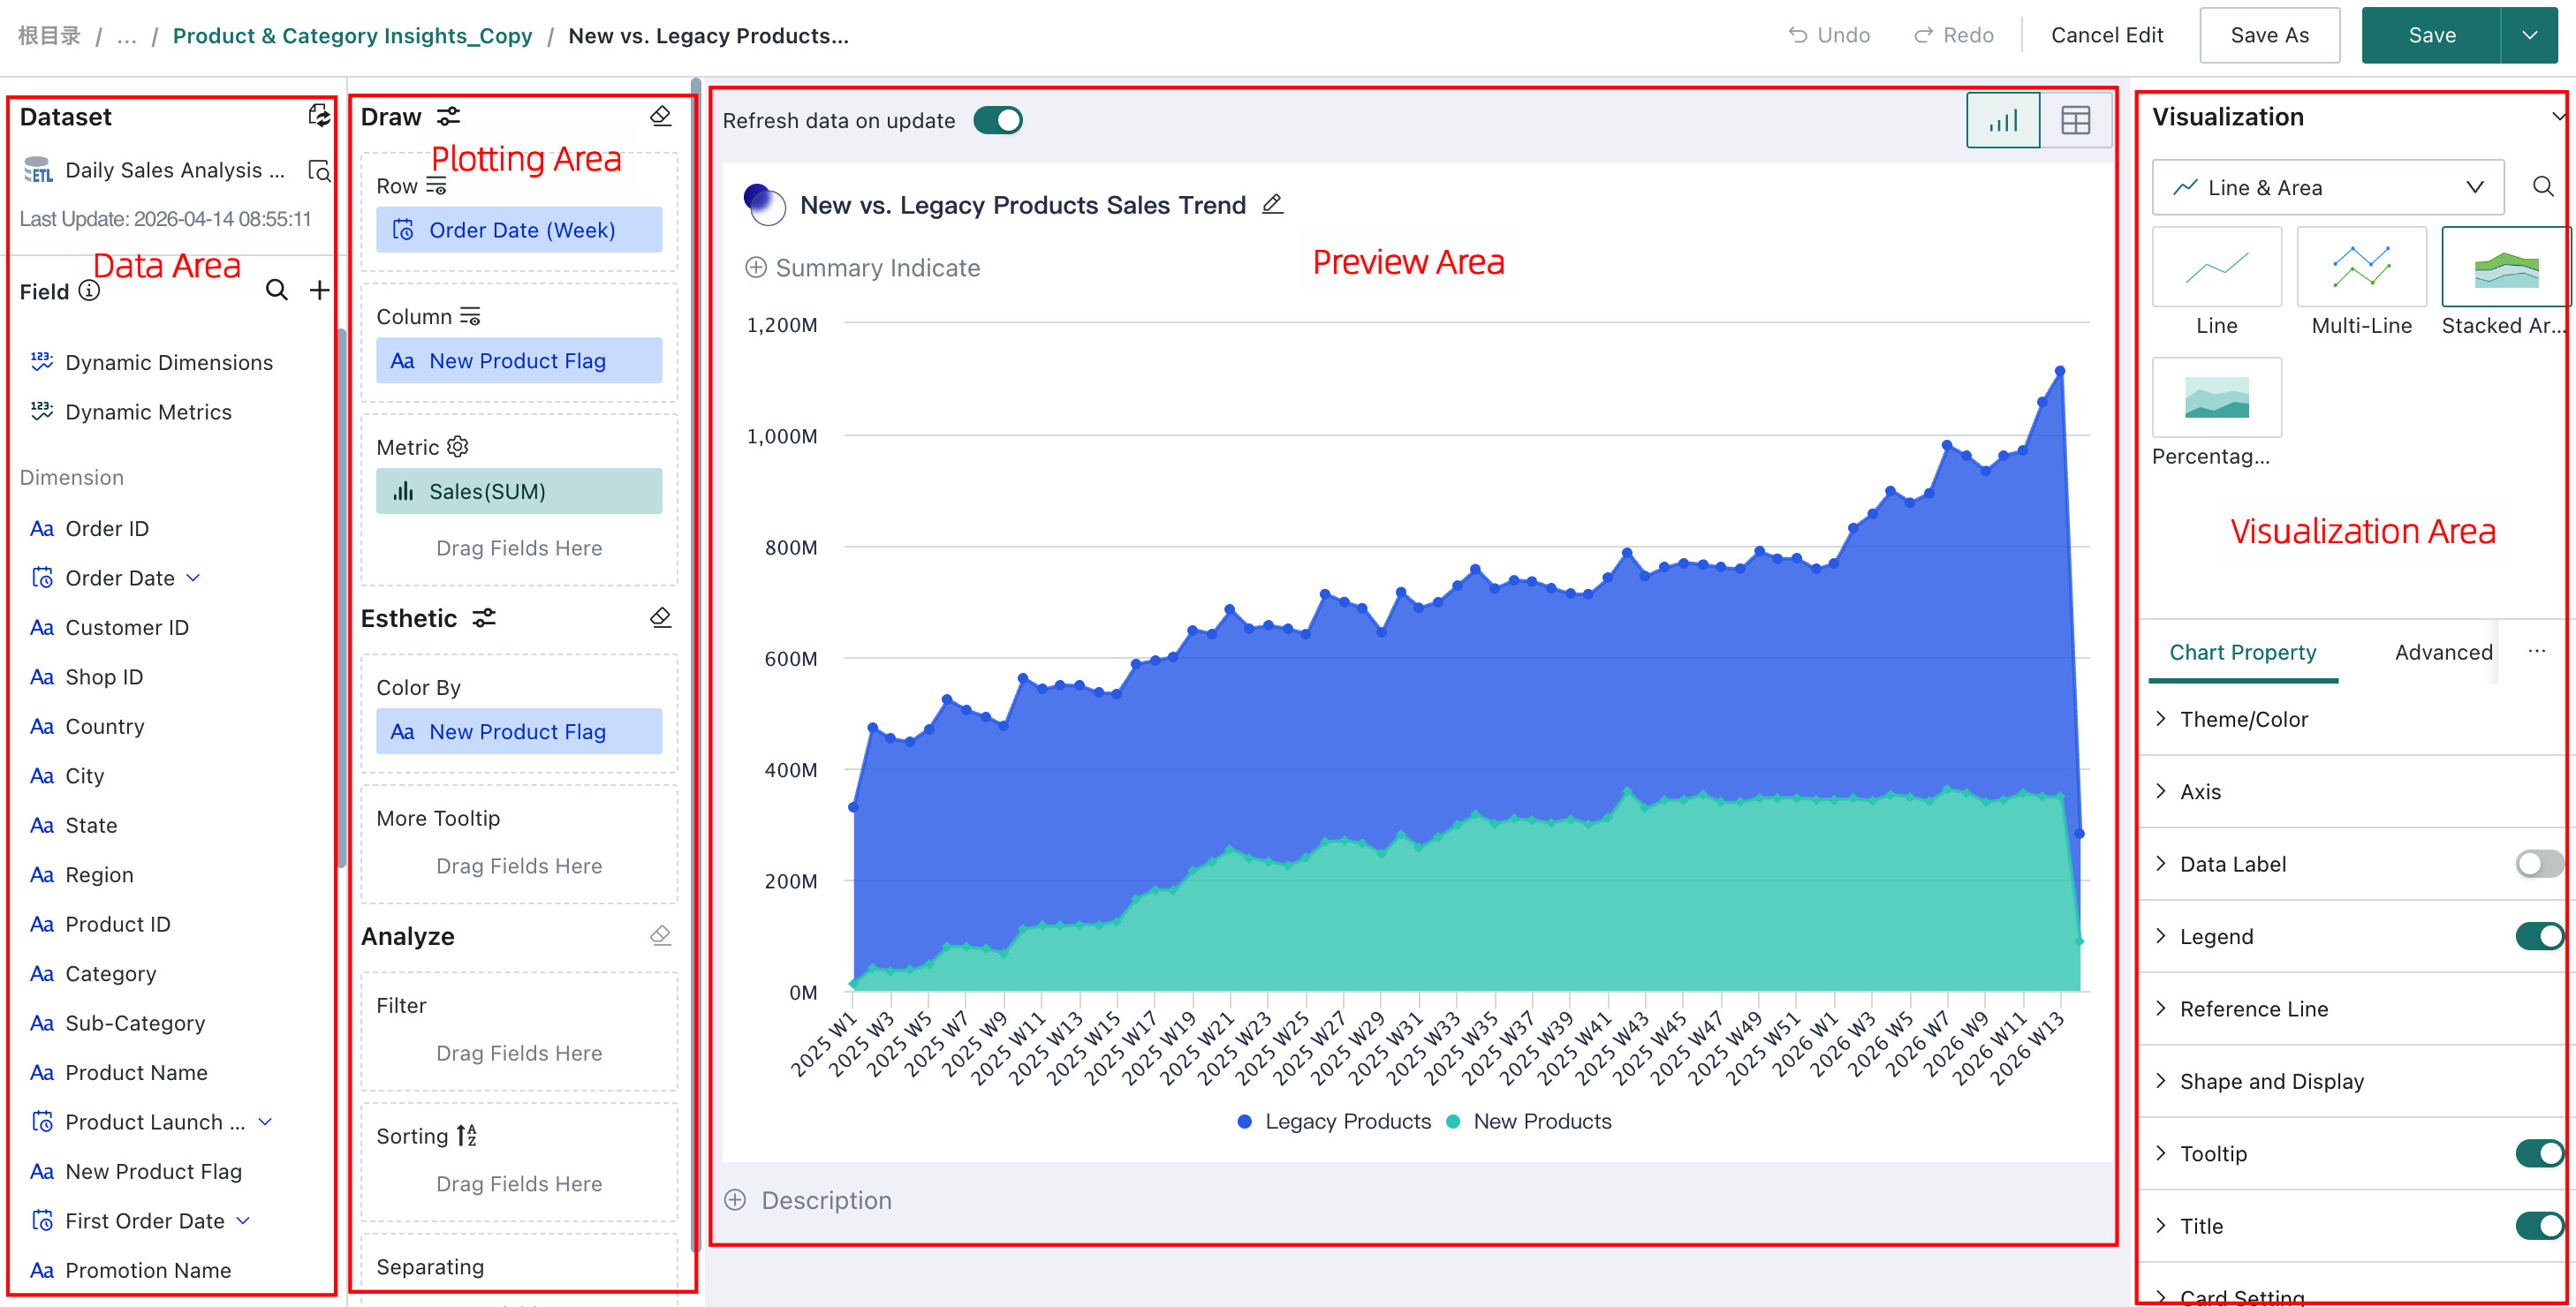
The different operation areas are described below:
| Area | Description |
|---|---|
| Data Area | Preview or switch the source Dataset of the chart Card, and create calculated or grouped fields. |
| Plotting Area | Drag fields into Dimensions, Comparison, and Metric sections, then apply filtering, sorting, and other analysis. |
| Preview Area | Preview chart results in real time during editing. You can also configure summary metrics, edit the Card title and description, view query statements, and switch between chart and table views here. |
| Visualization Area | Switch chart types, modify chart properties, and add interaction effects. |
Getting Started
To help you master chart creation systematically, we have organized the following learning path and prepared a practical example for reference.You will learn how to create a new Card, understand different visualization chart types, become familiar with the configurations involved in chart creation, and use Advanced Settings to handle deeper insight or additional analysis requirements.
You can follow the tutorials below to learn how to create visualization charts. The recommended learning path is as follows:
|
Learning Path |
Tutorial |
Description |
|
Example
|
This example uses a simple chart or table as a starting point and guides users through building visualization charts or tables from scratch. It helps users understand the core steps of creating visualizations.
|
|
|
Visualization Chart Types |
This article introduces the four built-in table types in Guandata BI and helps users better understand how each table type should be used. |
|
|
Guandata BI includes many built-in visualization chart types. This article introduces the purpose and configuration method of each chart type to help users better understand and build them. |
||
|
Create Visualization Charts |
This article shows users how to switch and preview the dataset used by a card. |
|
|
This article introduces all configuration items involved in chart creation and helps users perform visual analysis. |
||
|
Advanced Calculation supports analytical calculations under complex conditions, including YoY and PoP, Percentage of Total, Ending Value, Repeat Rate, and Ranking. This article explains how to configure them. |
||
|
If existing fields cannot meet the analytical needs of the current business scenario, users can use Create New Field to calculate, group, or filter existing fields with functions and generate new fields for data analysis. This article explains the configuration process in detail. |
||
|
You can configure dynamic time macros to meet the need for flexible date settings while viewing and analyzing data, allowing dates to change automatically. This feature can be used in card titles, default filter values, subscriptions and alerts, and dataset creation. This article explains the configuration process in detail. |
||
|
Guandata BI supports the flexible use of parameters in multiple stages of data integration and data analysis, such as cards, dataset calculated fields, View Datasets, and the SQL of Direct Connection Datasets. Through parameters, users can implement complex dynamic analysis, such as switching analytical dimensions, switching analytical metrics, dynamic data categorization, and cross-table dynamic queries. This article explains the configuration process in detail. |
||
|
In the analysis preview area of the card editing page, Guandata BI allows users to switch chart visualization types and preview, modify, and save charts. This article explains the related configuration items in detail. |
||
|
Chart properties can be used to optimize the visual effect of charts. This article introduces the configuration items in both chart and table chart properties in detail. |
||
|
Advanced Settings |
Free Drill-down is a data analysis feature. Through Free Drill-down, users can preset fields available for drill-down according to different business needs, and then freely choose the drill-down field during analysis. This article explains how to configure it. |
|
|
Knowledge Feedback is a feature for collecting feedback on table data. Users can use it to collect, manage, and analyze feedback information in tables. This article explains the configuration process in detail. |
||
|
If users want to save and export analyzed data, they can use `Analysis Result Storage` to store the current filtered and linked data into a specified dataset. This article explains the configuration process in detail. |