Table Types
Overview
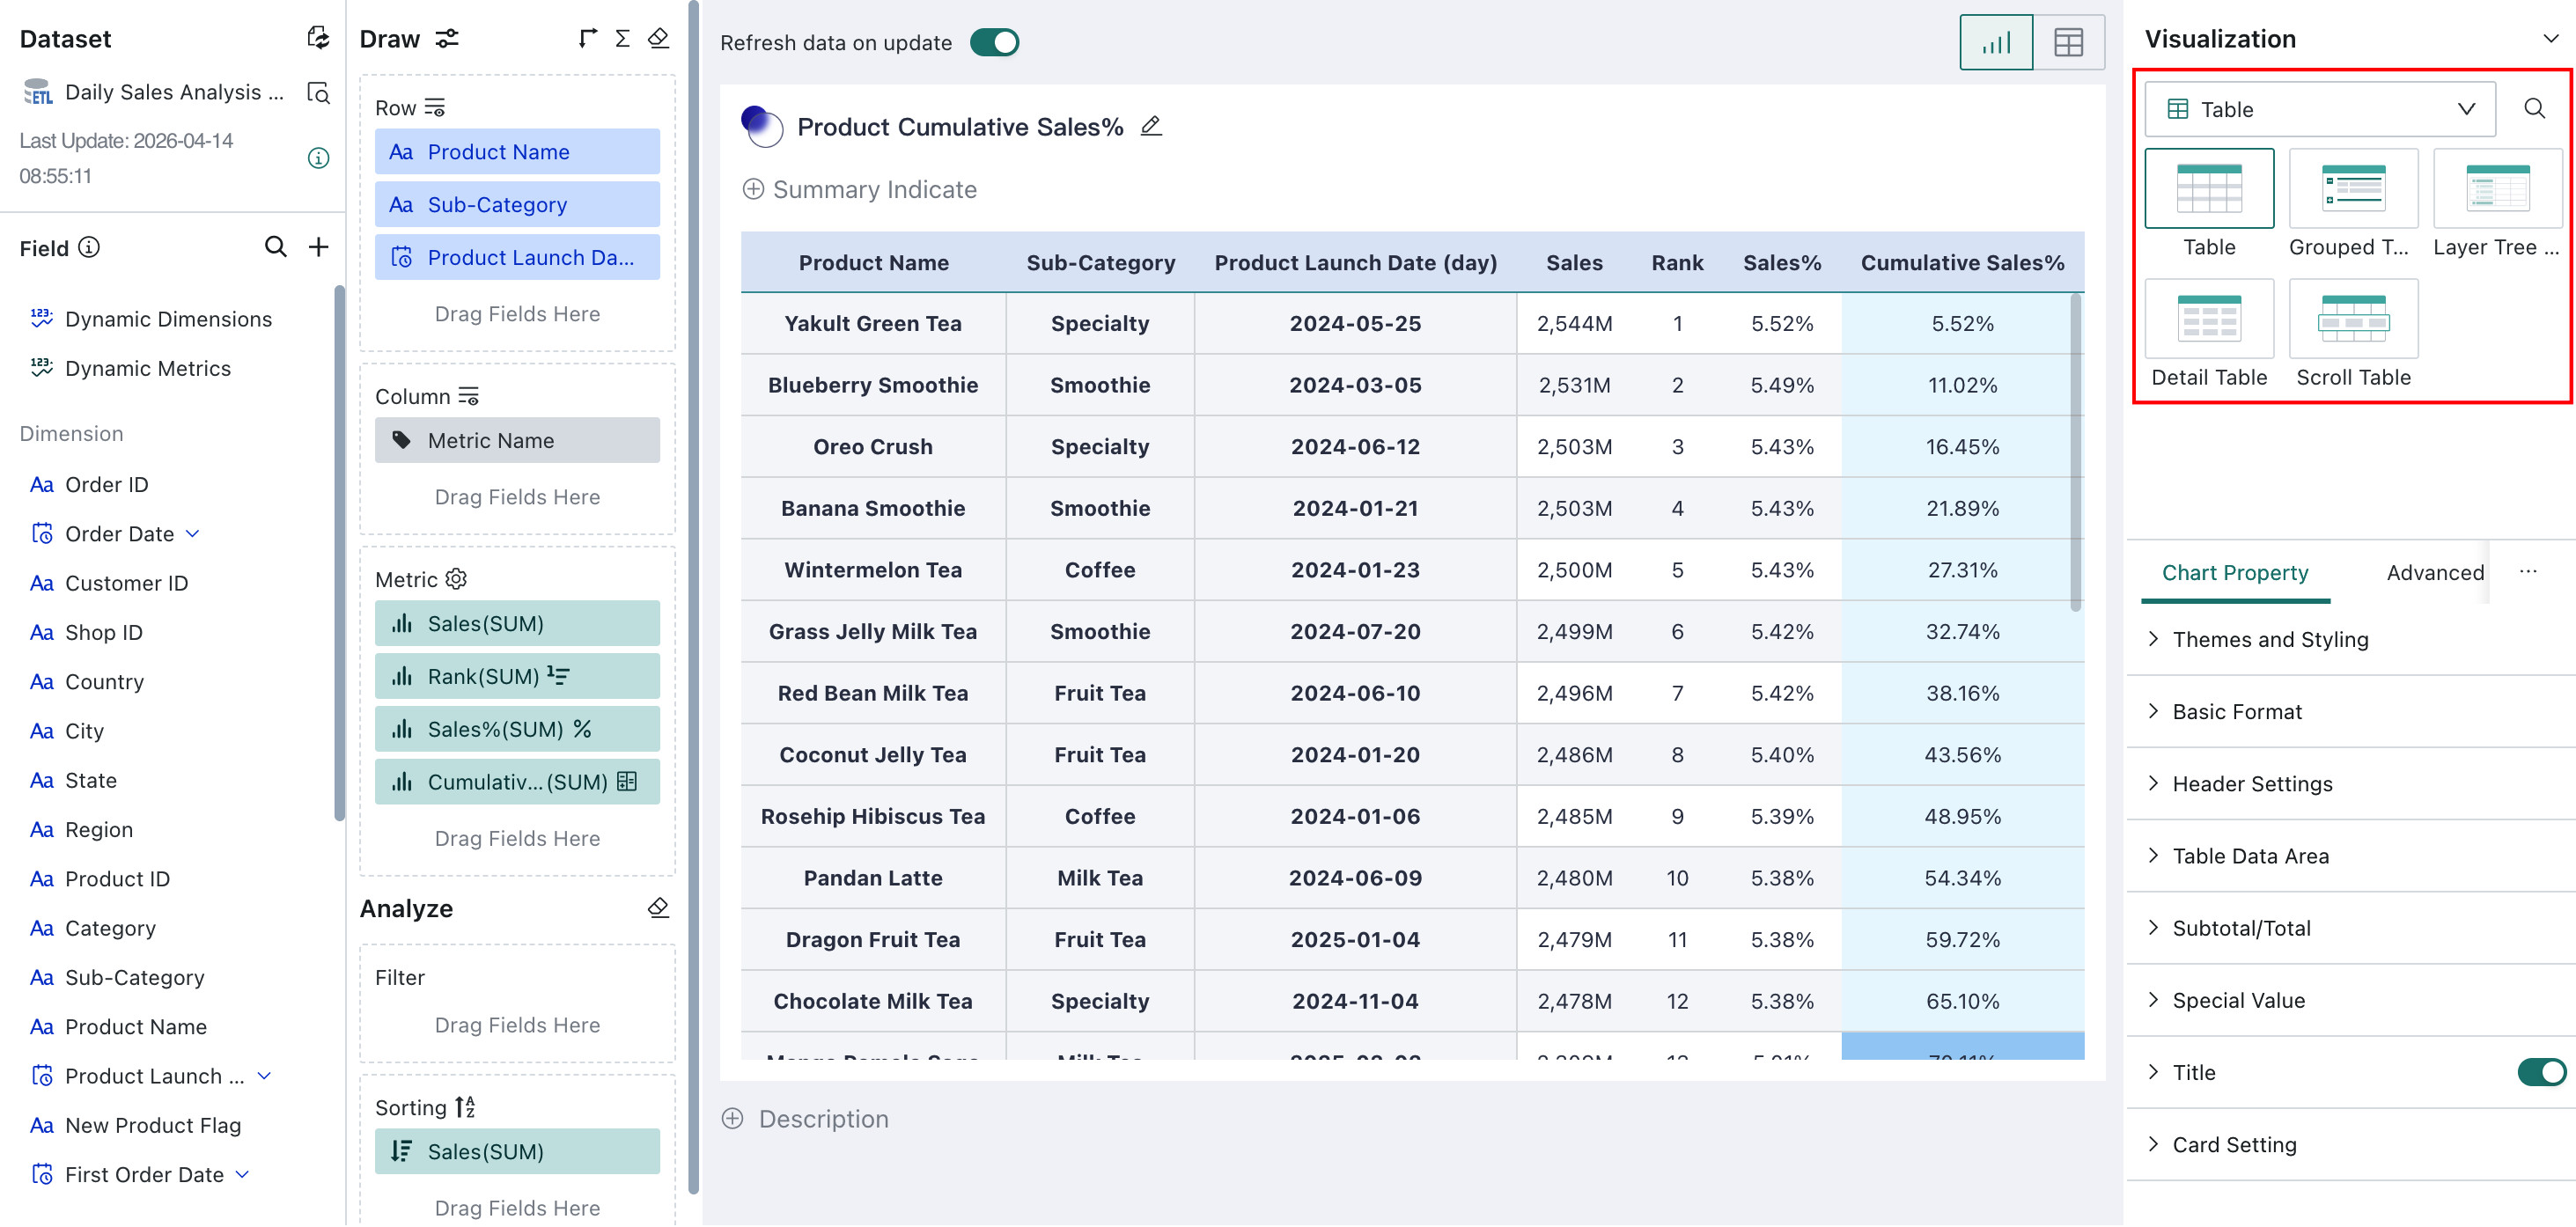
Tables are among the most frequently used chart types in Guandata BI. Guandata BI provides five table styles: Table, Grouped Table, Layer Tree Table, Scroll Table, and Detail Table.
In the chart type panel on the upper right, select the table style that best matches your scenario. Then follow the visual guidance and drag the required dimensions and measures into the charting area. You can also configure multiple visual options for tables, such as themes, basic formatting, header styles, table data, subtotals and totals, and special values.
Detailed Description
Table
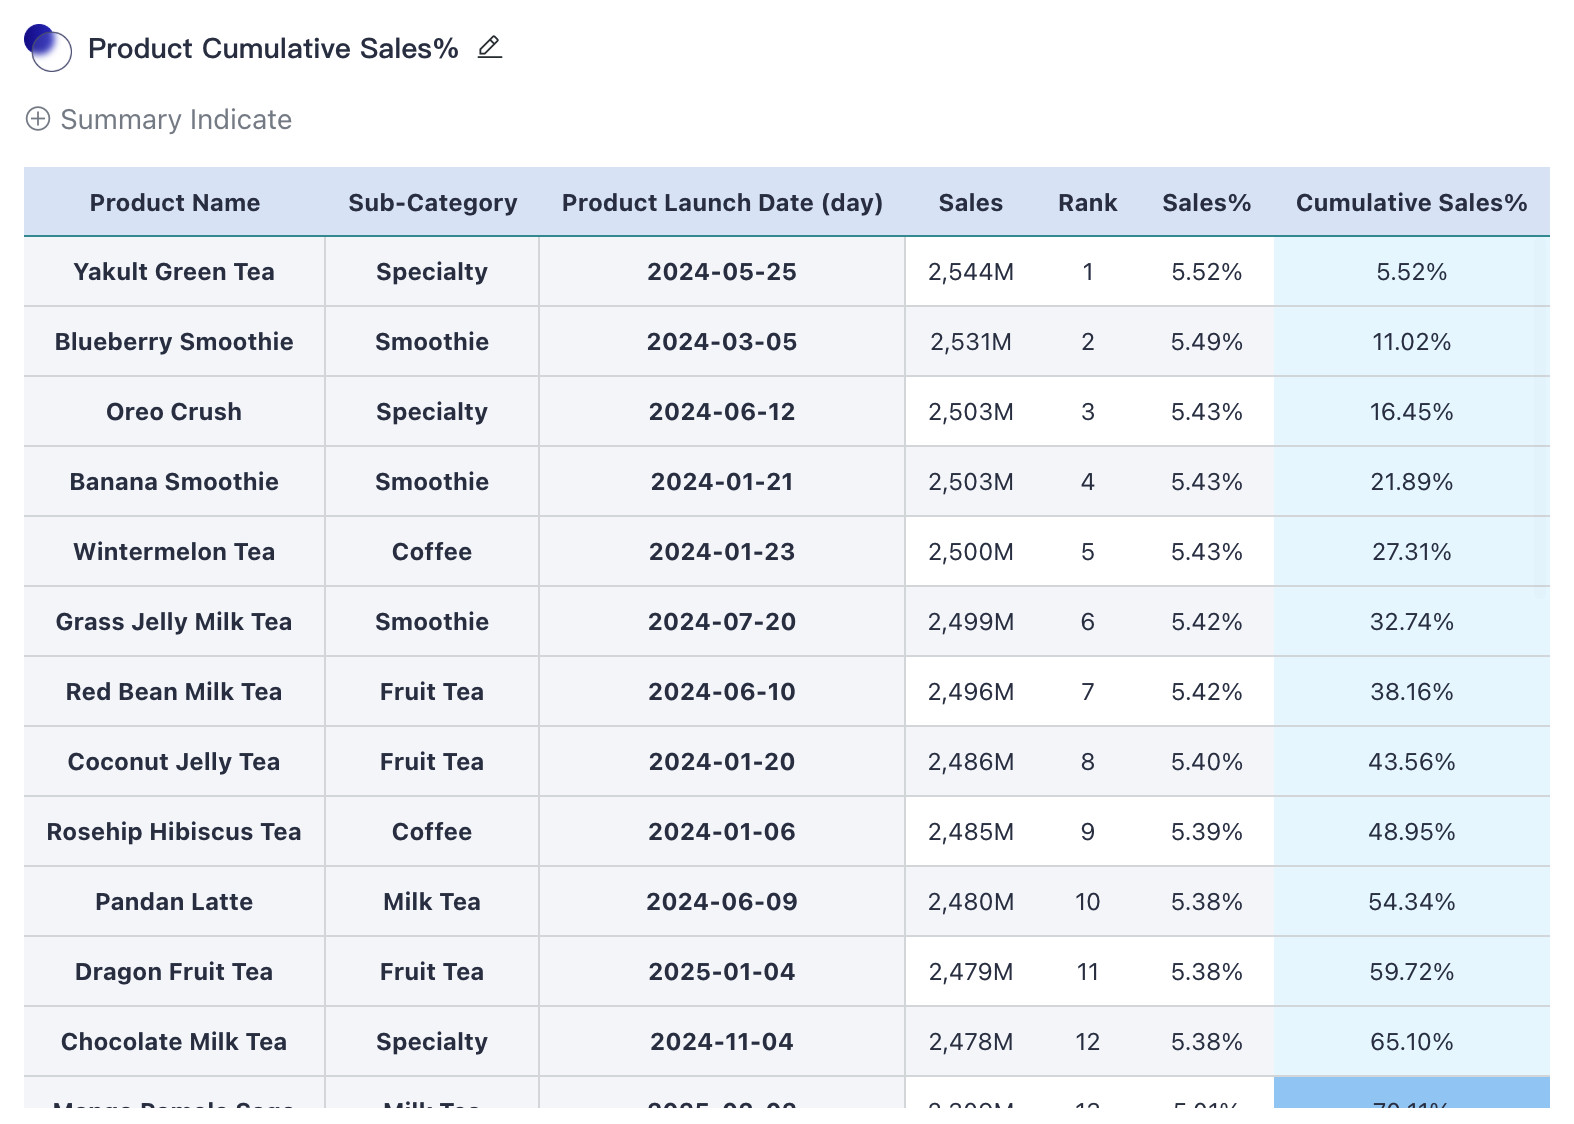
A standard table consists of Dimension, Comparison, and Measure fields. Dimension values are displayed vertically, comparison values are displayed horizontally, and data values appear at the intersection of rows and columns. You can apply multiple calculations to the data, including Sum, Average, Count, Max, Min, and No Aggregation.
For example, in a product sales scenario, you can use a table to display each product's name, sub-category, launch date, sales amount, rank, sales percentage, and cumulative sales percentage, enabling a comprehensive view of product performance.
Note: When too many dimensions are added to a standard table (>= 10), the system automatically recommends converting it to a detail table for better stability. In this case, a prompt appears asking whether to convert the table. Click
Convertto switch with one click.
Chart properties: supports Theme & Style, Basic Format, Header, Table Data, Subtotal & Total, Special Values, Summary Metric Style, Card Background, and Card Title. For details, see Chart - Chart Properties.
This chart type also supports Knowledge Feedback and Analysis Result Storage.
Grouped Table
A grouped table groups data by dimension and summarizes the data by category. It provides a clearer and more intuitive view by showing aggregated metrics within each category.
For example, when analyzing sales by region, product category, or time period, you can use a grouped table to summarize sales by region or category and show the sales amount for each group.
Chart properties: supports Theme & Style, Basic Format, Header, Table Data, Subtotal & Total, Special Values, Summary Metric Style, Card Background, and Card Title. For details, see Table - Chart Properties.
This chart type also supports Knowledge Feedback.
Layer Tree Table
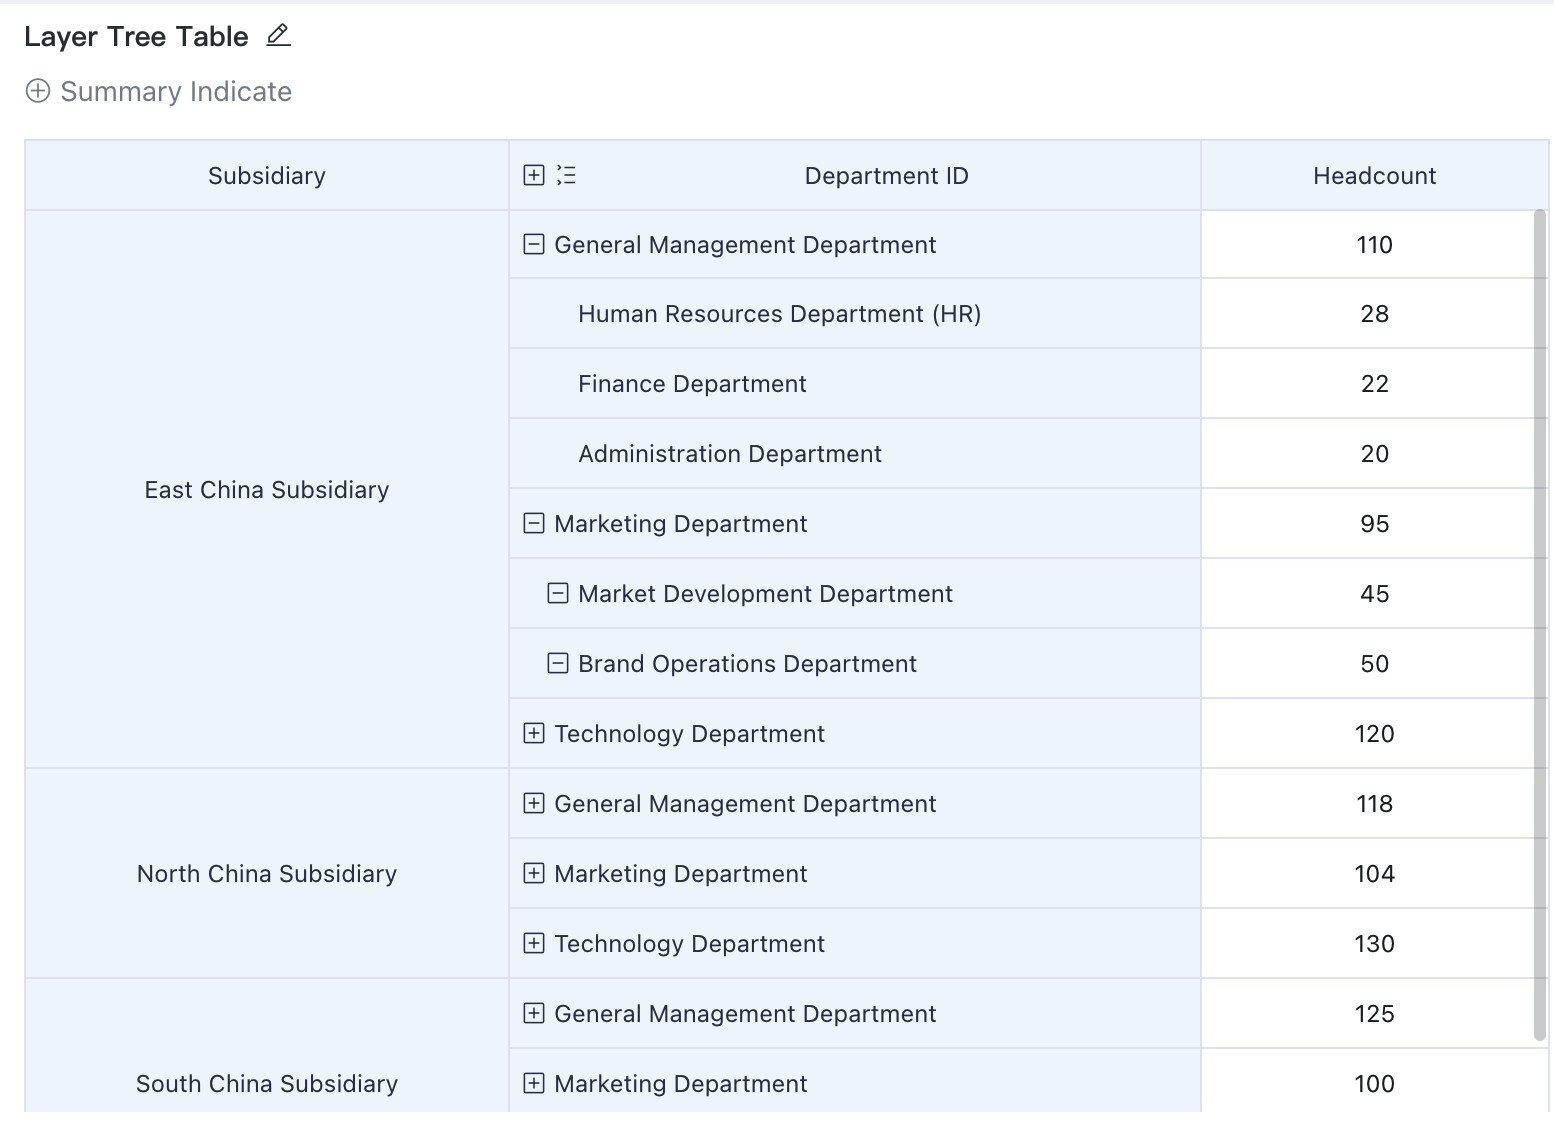
When dimension items have a hierarchical relationship and you want to display them in a collapsible or indented structure, use a Layer Tree Table.
For example, financial statements often contain multi-level account subjects. Users may want to compare values at the same level while collapsing lower-level nodes. In this case, a Layer Tree Table presents the hierarchy more clearly.
The following example shows how to create the Layer Tree Table illustrated below. The sample dataset used in this example is Layer Tree Table Demo Dataset.
Create a Tree Field
Before creating a Layer Tree Table, create a tree field in Management Center for centralized maintenance.
For the detailed procedure, see Tree Field Management.
Create a Layer Tree Table
-
Go to
Data Analysis > New Page > Dashboard, create a new card, and selectVisualization Charts. In the chart type panel on the right, chooseTable > Layer Tree Table. -
Drag the field associated in Linked Dataset Fields into the
Tree Fieldarea. In this example, that field isDepartment ID. Then drag the required dimensions and metrics into the other display areas to complete the Layer Tree Table, as shown below.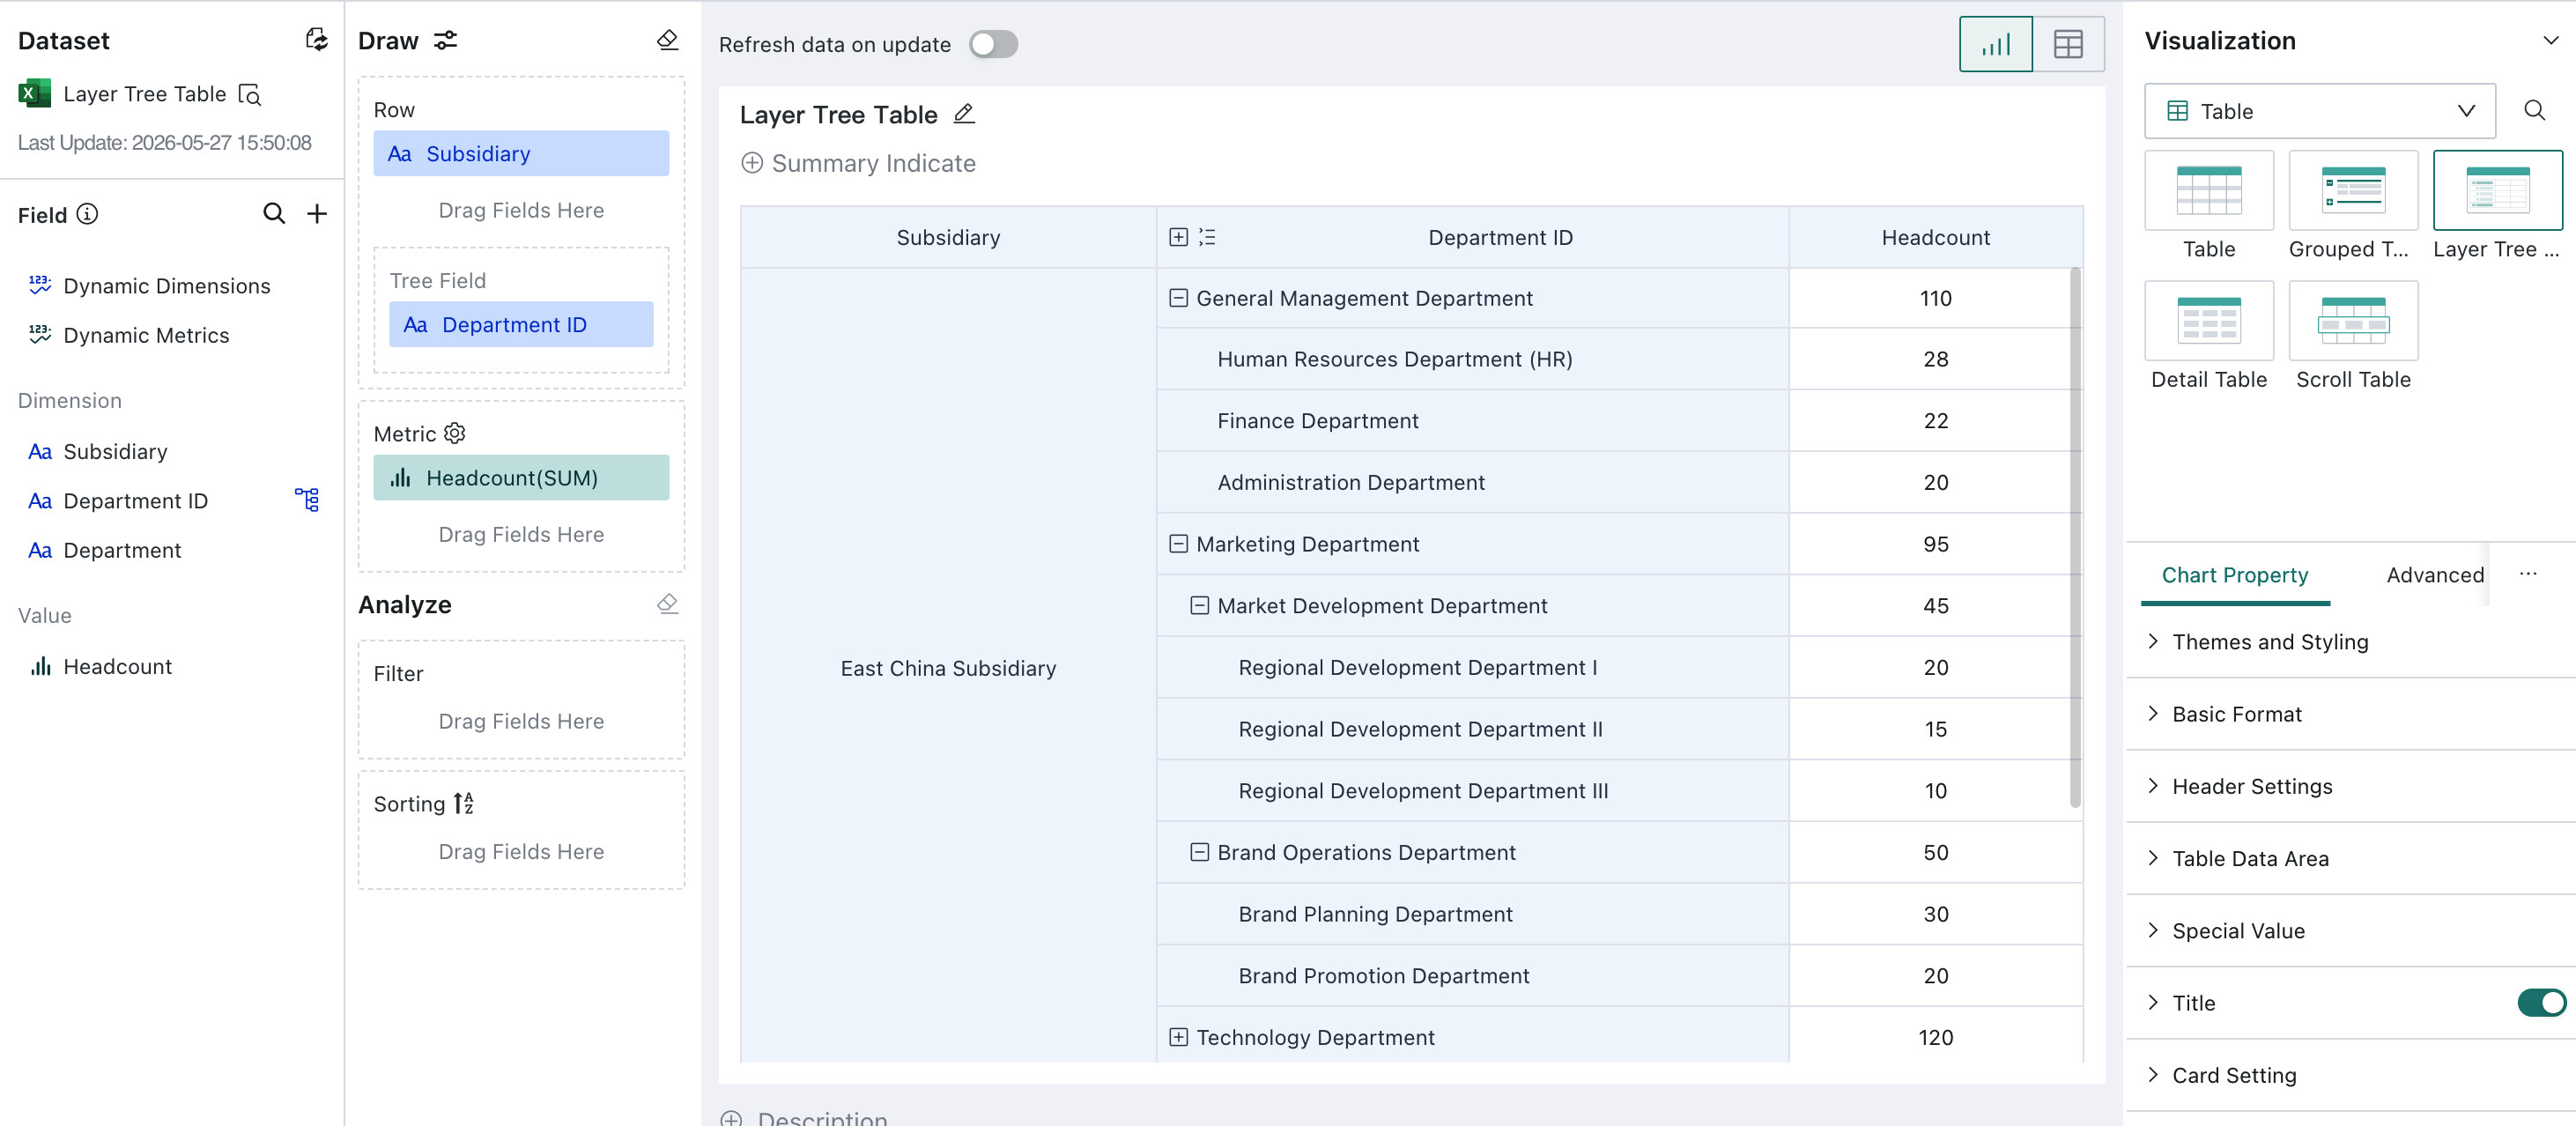
Configure a Tree Filter
After creating the tree field and Layer Tree Table, you can configure a tree filter to drive interactive filtering for the Layer Tree Table.
-
Go to the
Data Analysispage and selectNew Card > Filter > Tree Filter.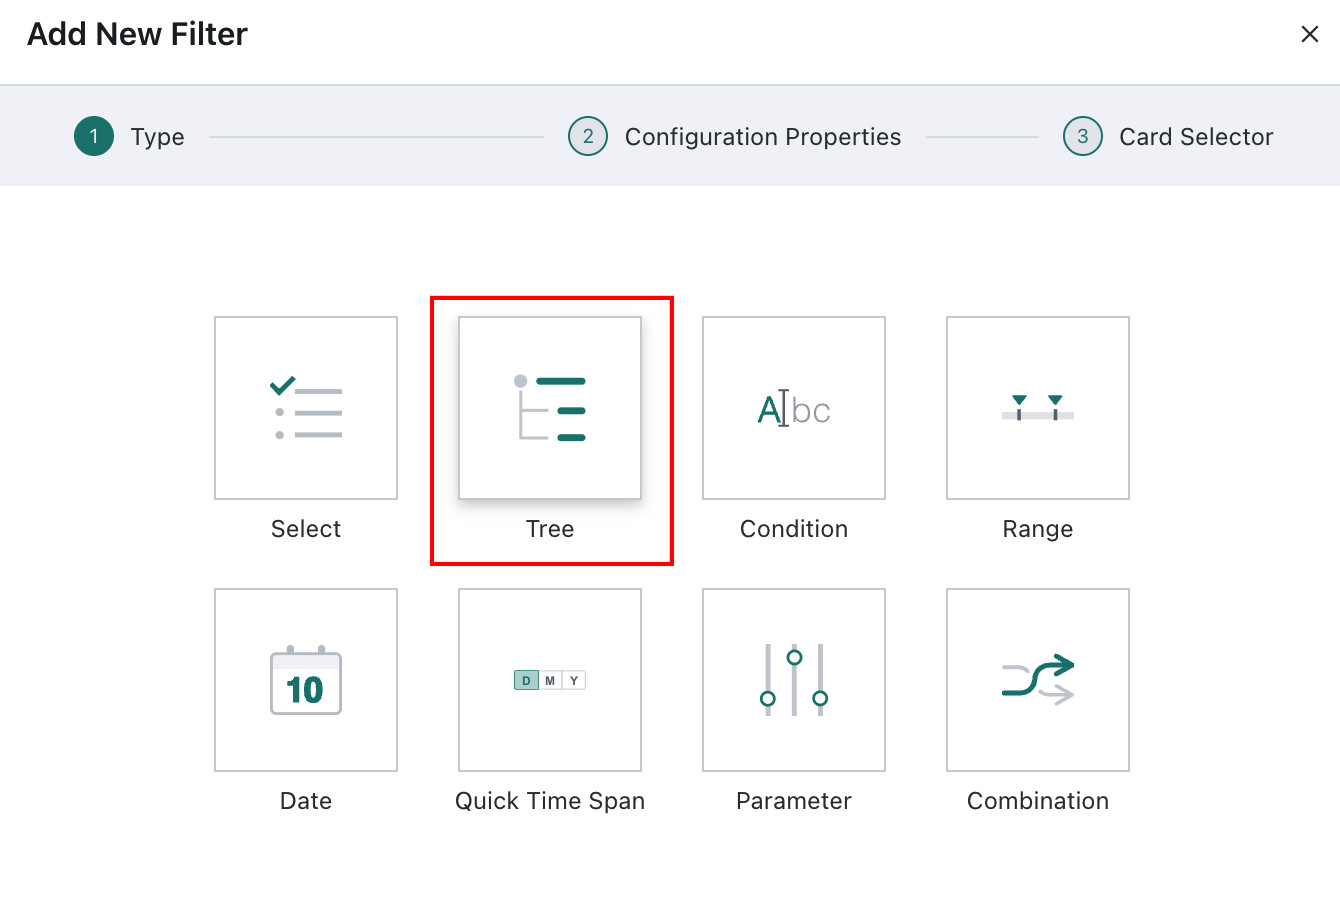
-
On the tree filter configuration page, select the data source that contains the related tree field, choose
Dynamic Hierarchy, and bind the related field,Department IDin this example. Configure the remaining options as needed. Multi-select is used in this example.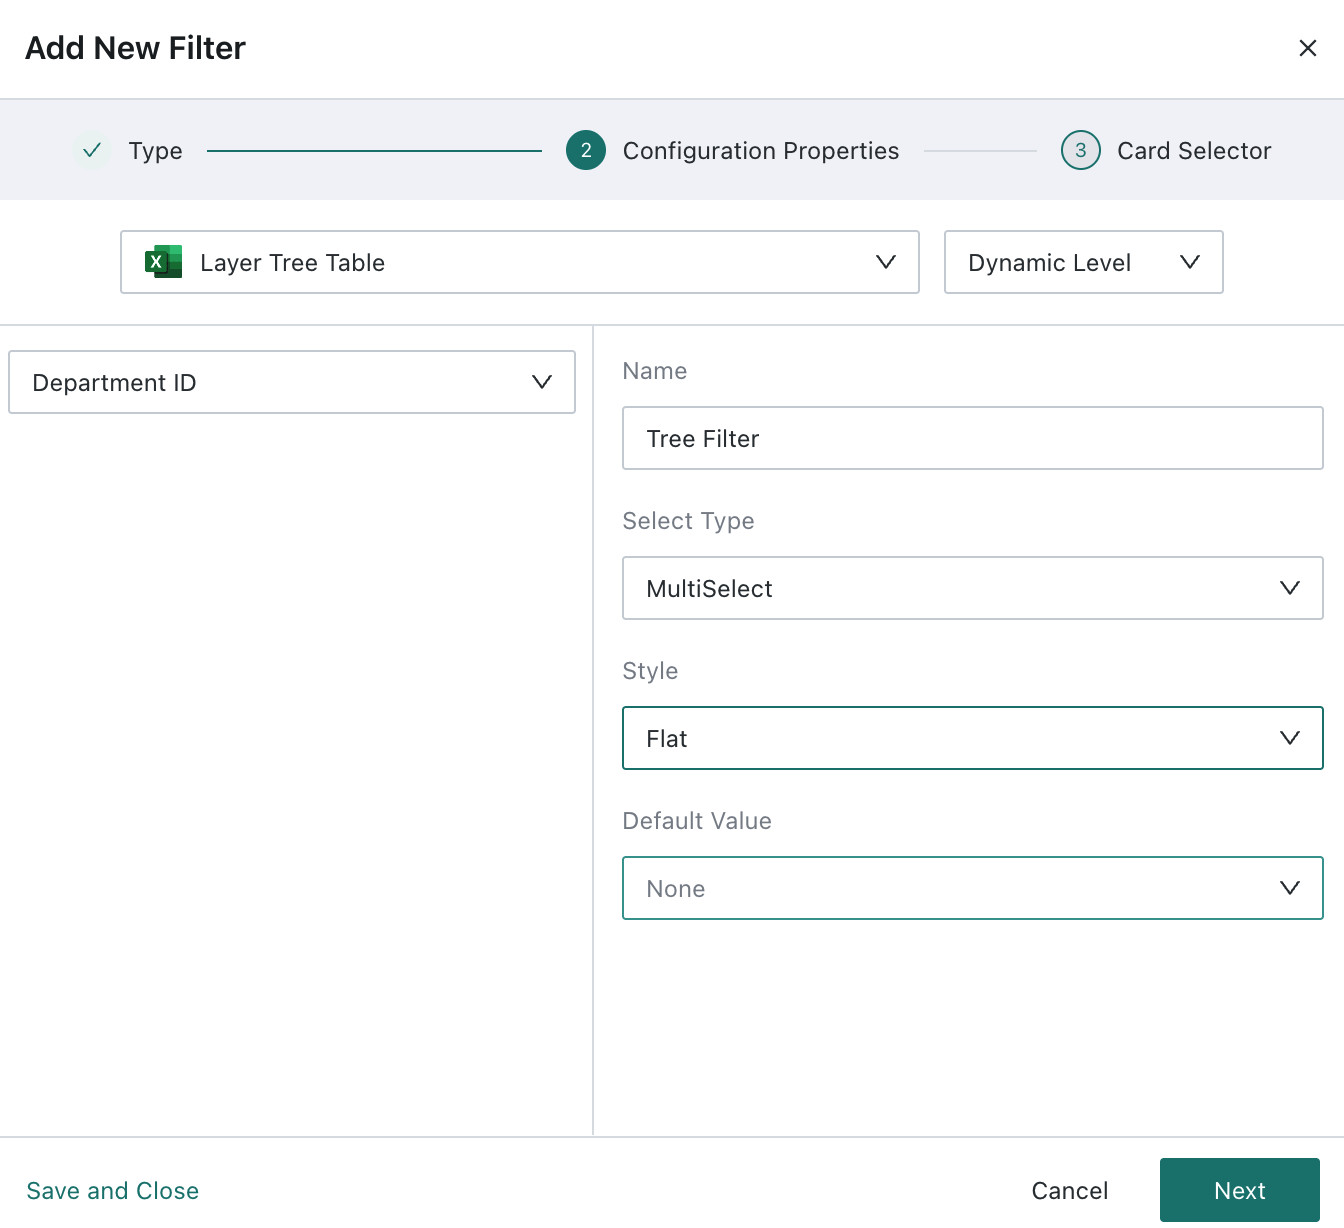
-
Associate the filter with the Layer Tree Table you created and bind the tree field in the associated dataset,
Department IDin this example. The tree filter is then created successfully.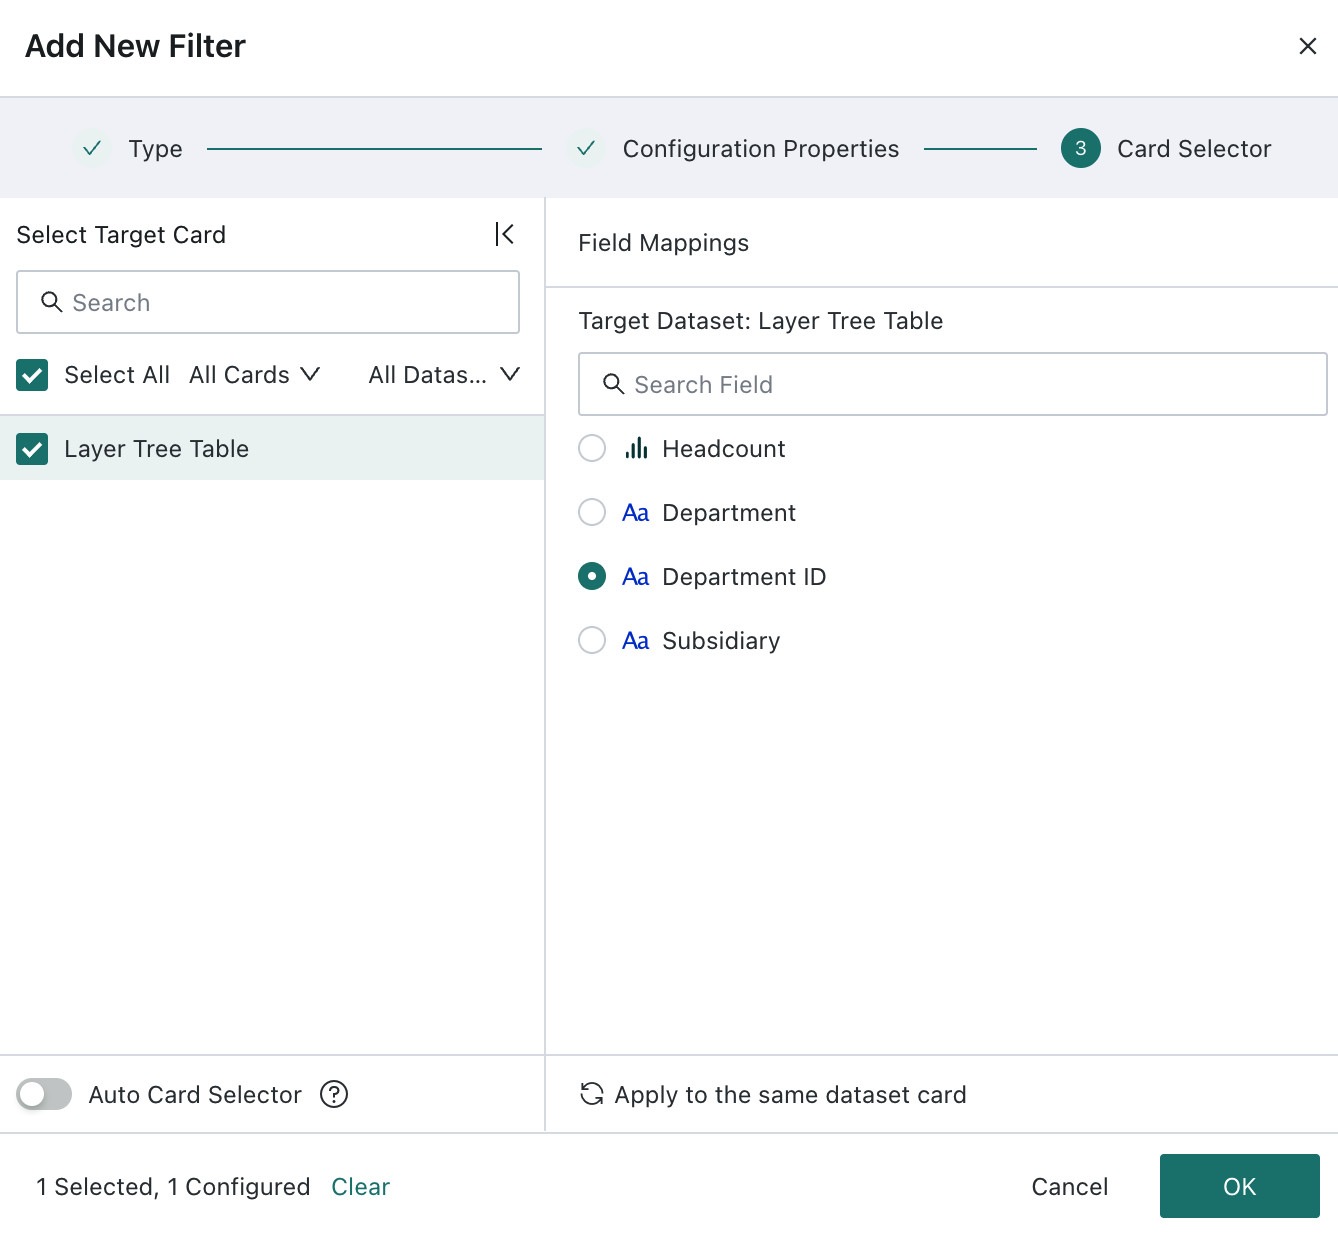
-
Apply filtering in the tree filter and review the filtering result in the Layer Tree Table.
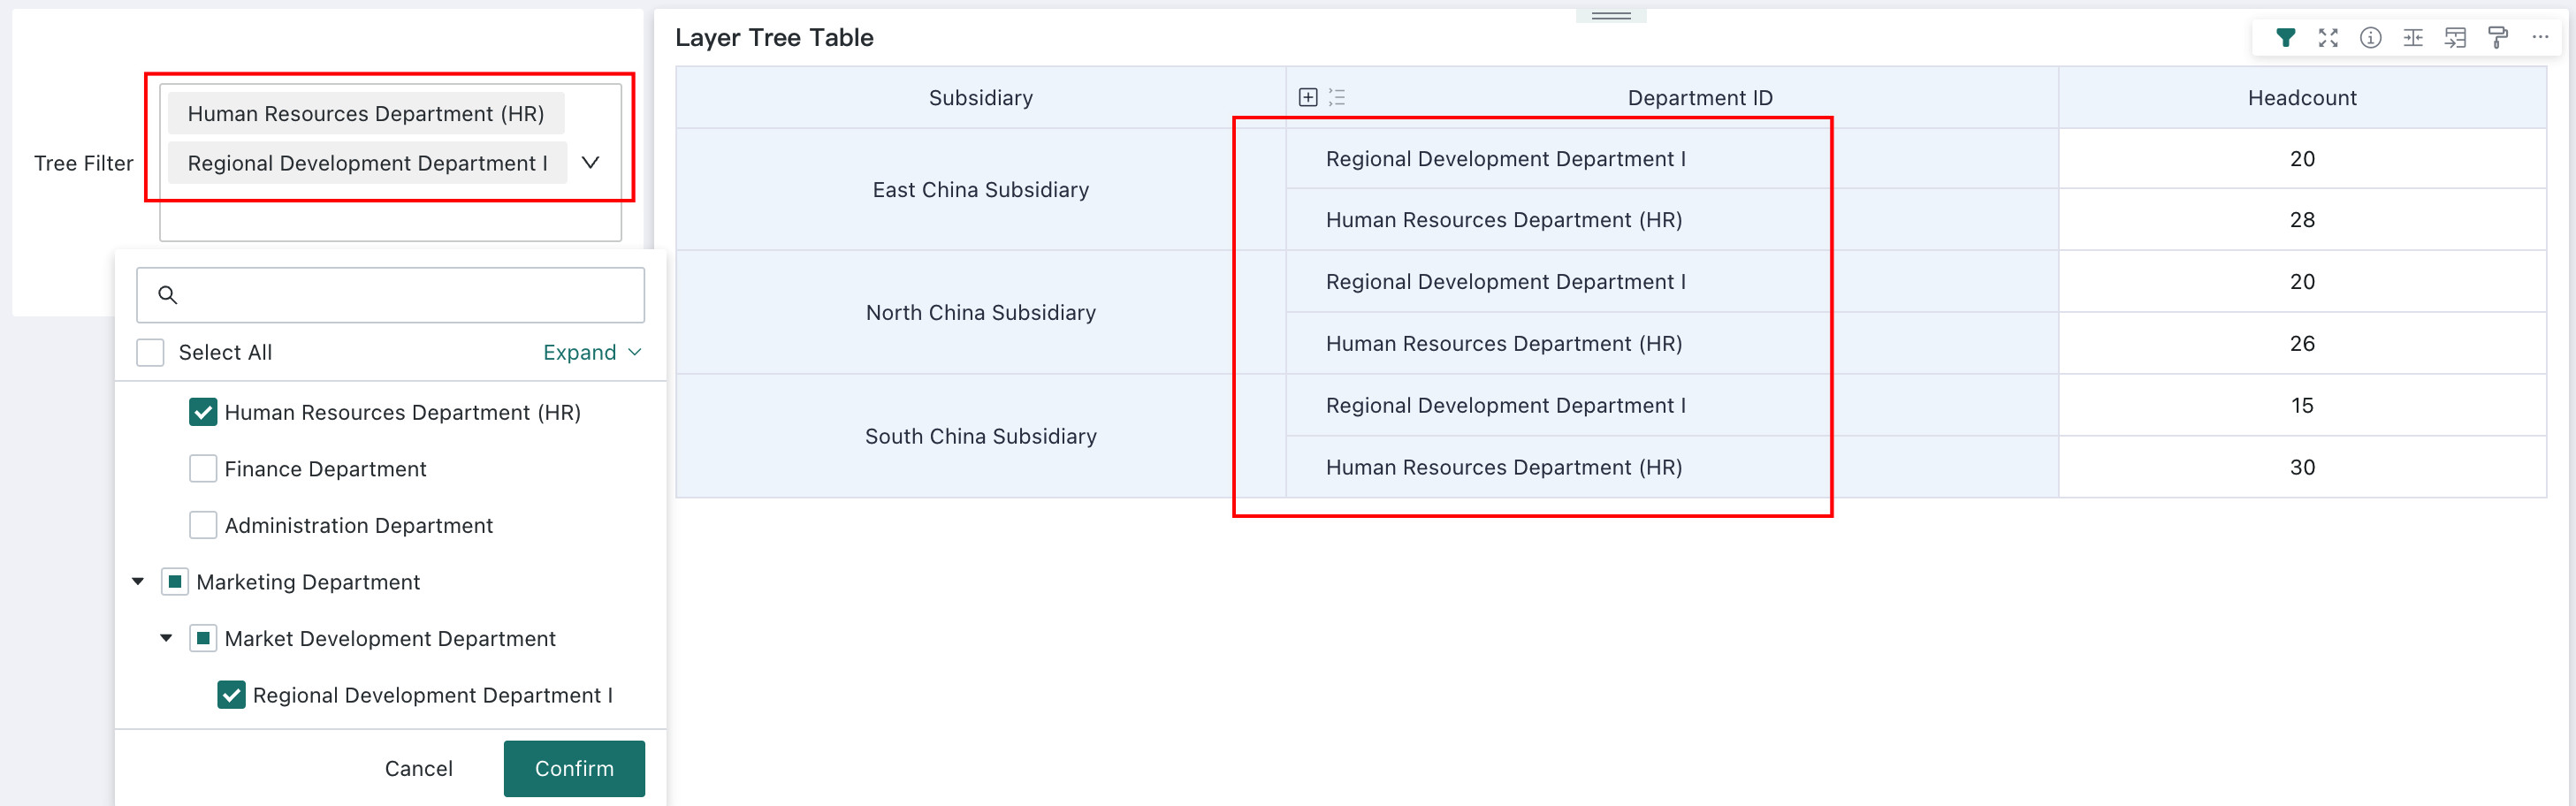
Other Related Operations
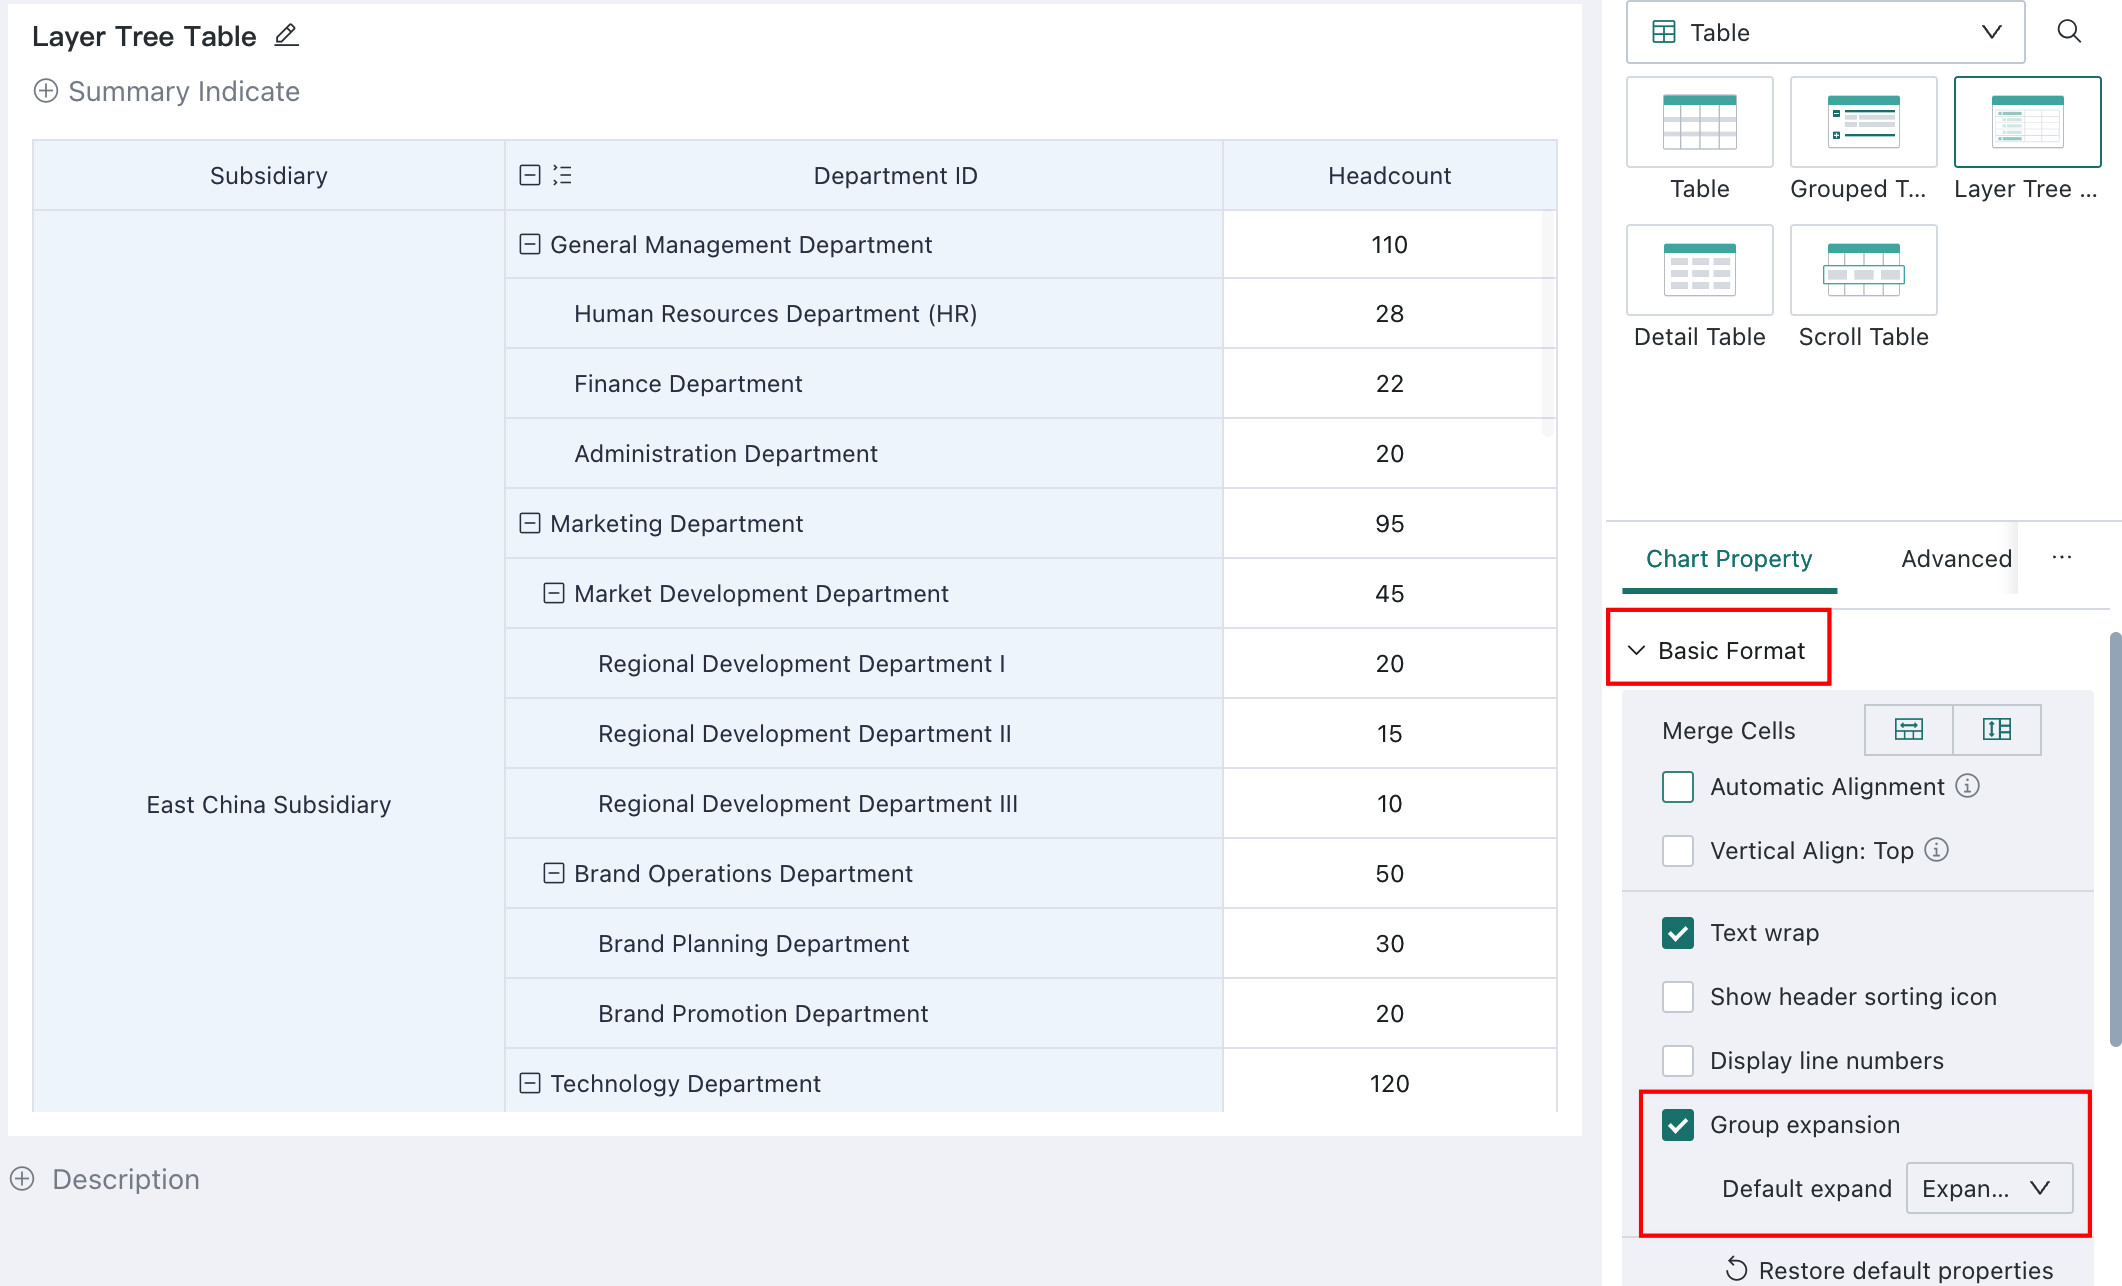
Configure the default expanded level: go to Chart Properties > Basic Format > Group Expand to set the default expansion level. This setting applies to all users.
Ad hoc hierarchy viewing: viewers can click the icon in front of the header field name, as shown below, to expand all, collapse all, or expand a specified level. This is a one-time action. It is not saved, does not affect other users, and does not affect the next viewing session.
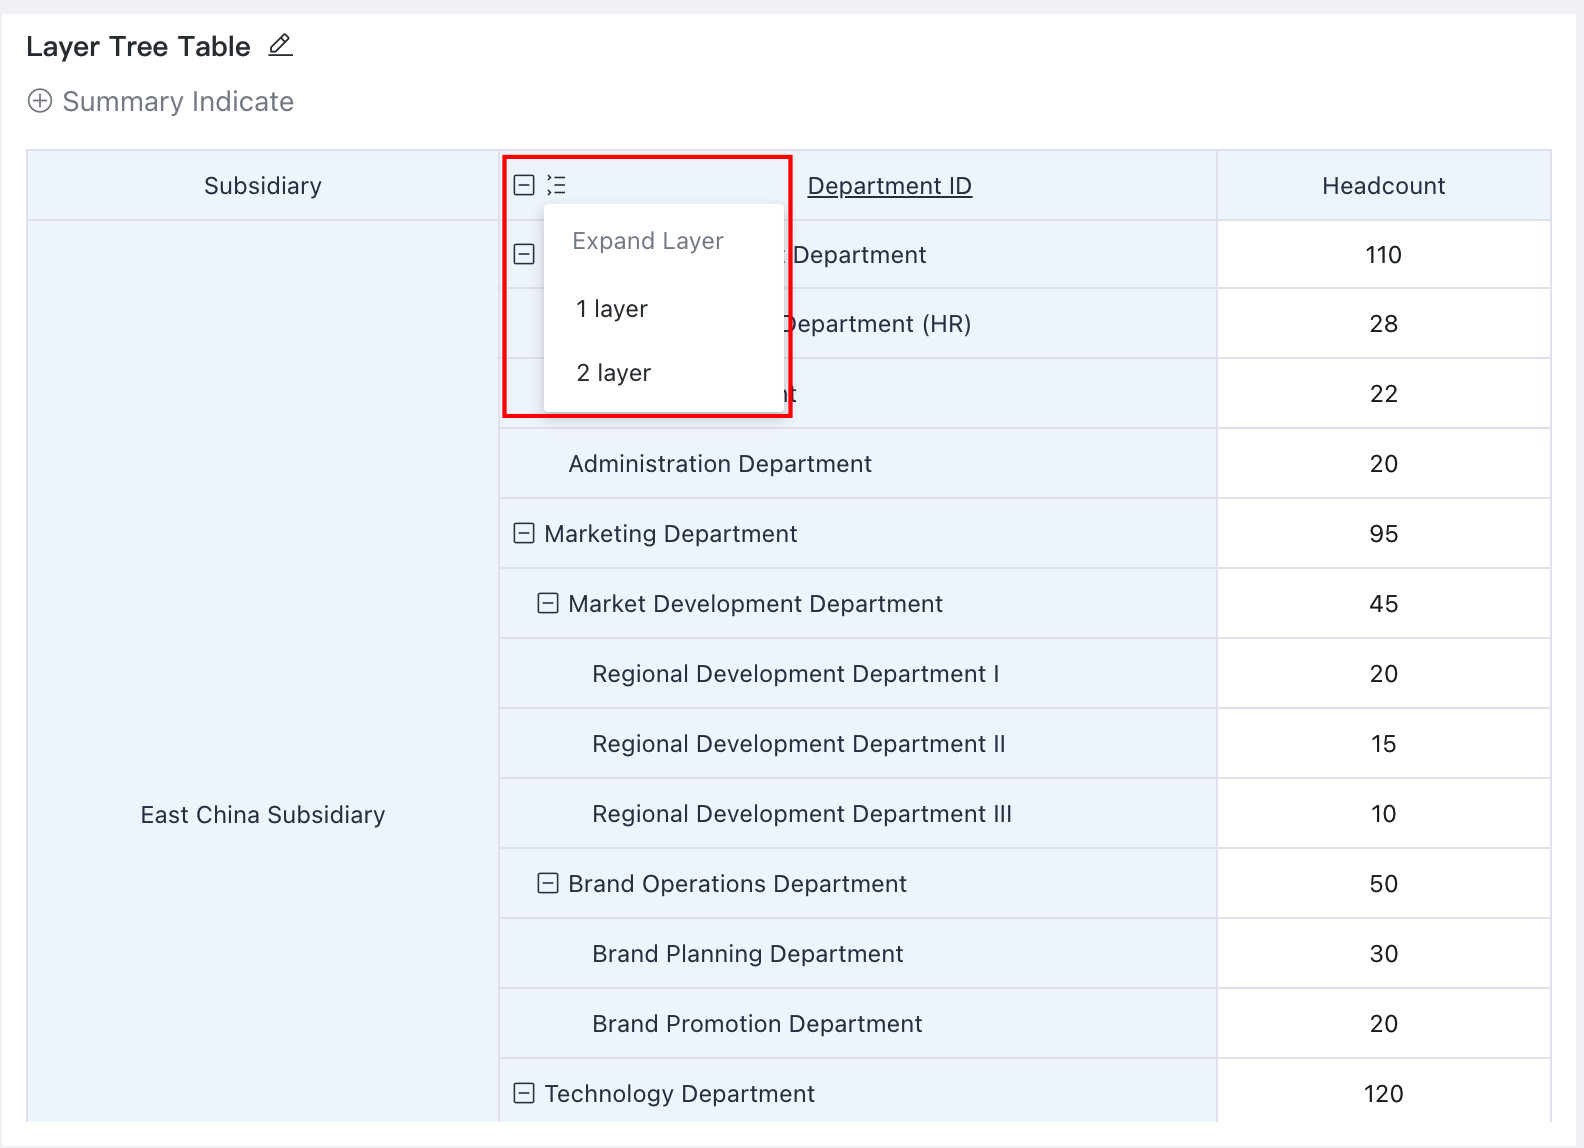
Chart properties: Layer Tree Tables support Theme & Style, Basic Format, Header, Table Data, Special Values, Summary Metric Style, Card Background, and Card Title. For details, see Table - Chart Properties.
Scroll Table
A Scroll Table displays data in list form. You need to configure an aggregated primary key and the additional fields to display.
Only Scroll Tables on a Data Visualization Wall support auto-scrolling. On a regular dashboard, the data is displayed statically.
For example, on a financial large screen, financial institutions can use a Scroll Table to dynamically display stock prices, exchange rates, trading volume, and price changes so users can quickly track the latest market activity.
Key characteristic: automatically scrolls through data and is suitable for use on a Data Visualization Wall.
Chart properties: supports Theme & Style, Basic Format, Header, Table Data, Special Values, Summary Metric Style, Card Background, and Card Title. For details, see Table - Chart Properties.
This chart type also supports Knowledge Feedback and Analysis Result Storage.
Detail Table
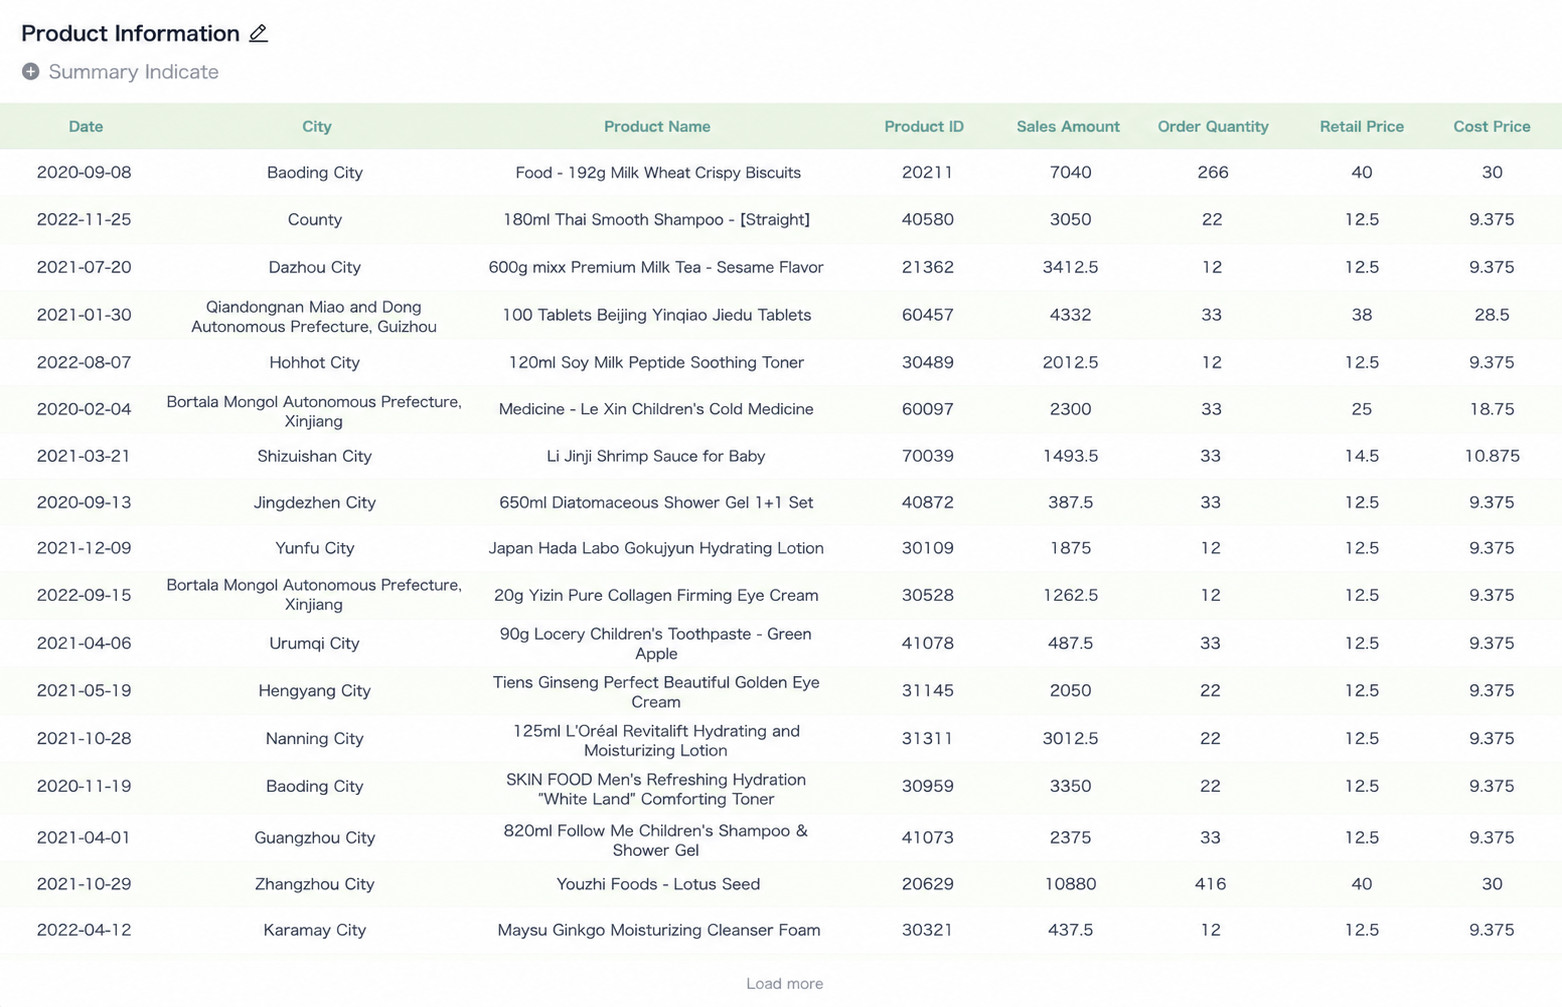
A detail table is used to display and query raw detail-level data. It usually contains a large number of records and does not support advanced metric calculations, aggregation, or summarization.
For example, in a financial record scenario, an enterprise can use a detail table to display all transaction records, including the date, amount, transaction type, and account, to support auditing and reconciliation.
Characteristics of a detail table:
- It contains only detail fields. There is no distinction between
Dimension,Comparison, andMeasure. - It does not support aggregation or summary calculations and is therefore suitable for displaying detailed data.
When the chart type of a card based on a direct-query dataset is set to Detail Table, the card can display the full dataset without the 20,000-row limit.
This capability is supported only for cards based on direct-query datasets. When using it, enable card caching. Otherwise, loading may take a long time. Front-end timeout: 10 minutes. Back-end timeout: 3 minutes.
Chart properties: supports Theme & Style, Basic Format, Header, Table Data, Special Values, Summary Metric Style, Card Background, and Card Title. For details, see Table - Chart Properties.
This chart type also supports Analysis Result Storage.