Du Pont Analysis Chart
Overview
Feature Description
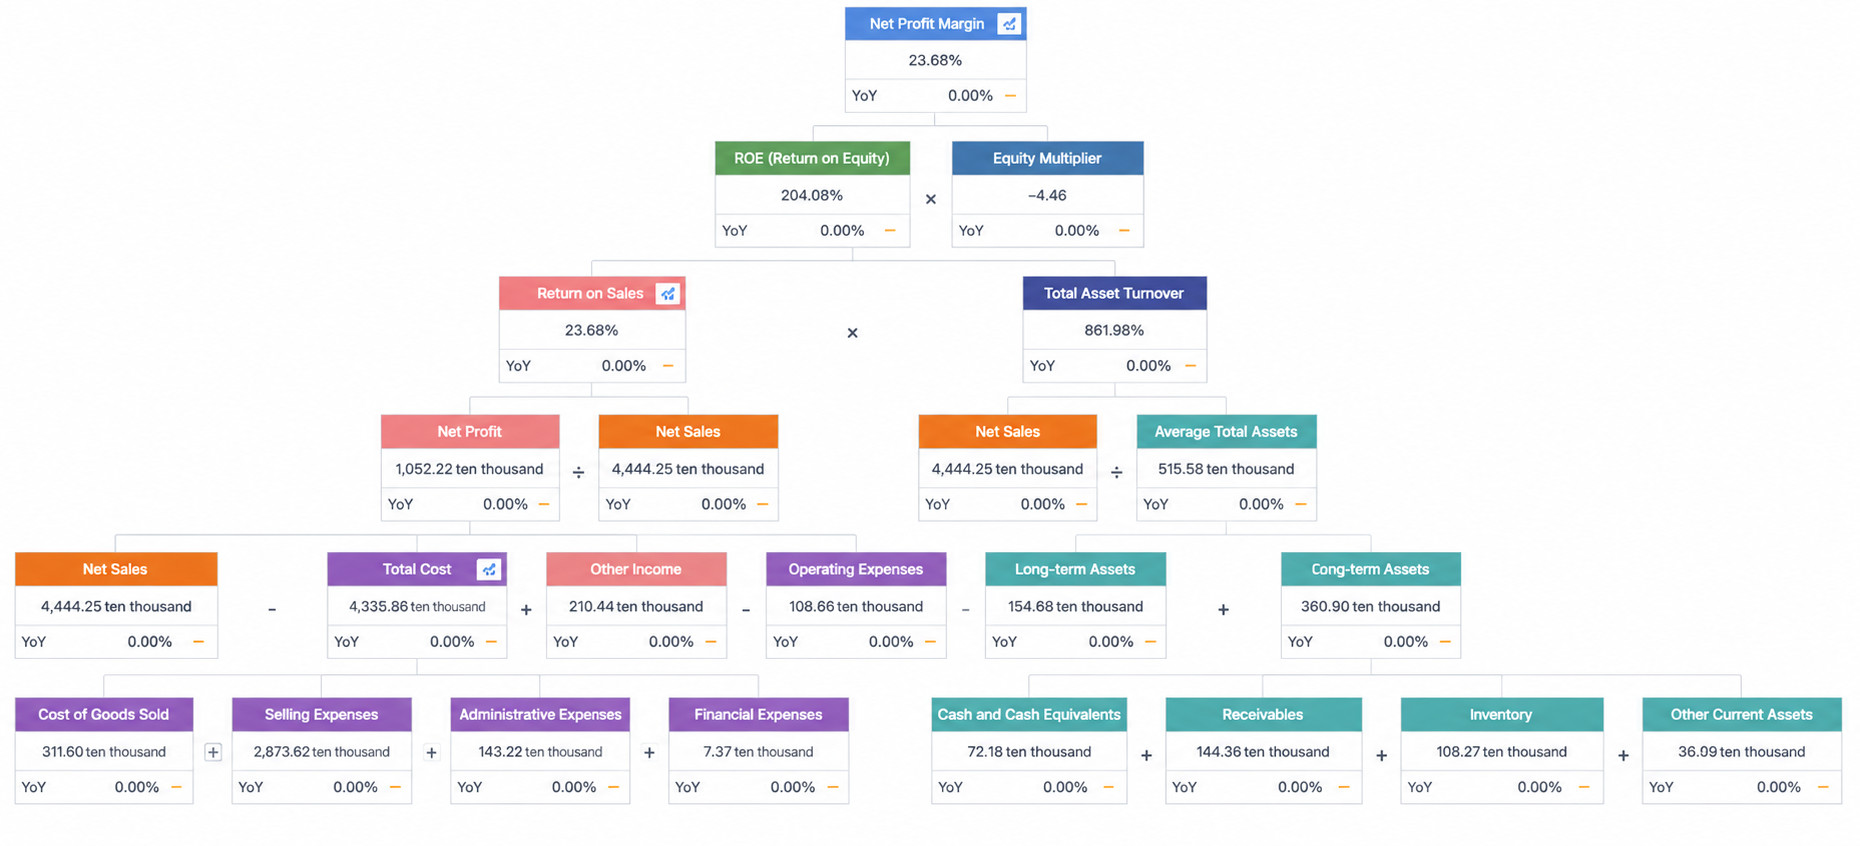
The core idea of the DuPont Analysis Chart is to organically combine several ratios used to evaluate business efficiency and financial status according to their internal connections, forming a complete indicator system, and ultimately reflecting it comprehensively through return on equity. This method was first used by the American DuPont Company, hence the name DuPont Analysis. Through the DuPont Analysis Chart, the hierarchy of indicators within the indicator system and the relationships between indicators can be clearly described.
Application Scenarios
In practical application scenarios, we often need to combine various business indicators to build a model structure that reflects the relationships between these indicators, thereby quickly and clearly displaying goals and methods. At this time, we can create a new DuPont Analysis Chart in the dashboard to draw the correlation diagram between indicator cards or comparison indicator cards.
For example, in financial analysis scenarios, through the DuPont Analysis Chart, enterprises can combine financial indicators (such as net profit, asset turnover ratio, equity multiplier) to deeply analyze the enterprise's profitability and operational efficiency. In addition, DuPont Analysis is not only applicable to financial indicators, but can also be used to analyze traffic, users, transactions, and other indicators, with a wide range of application scenarios.
Usage Guide
Create Indicator Cards
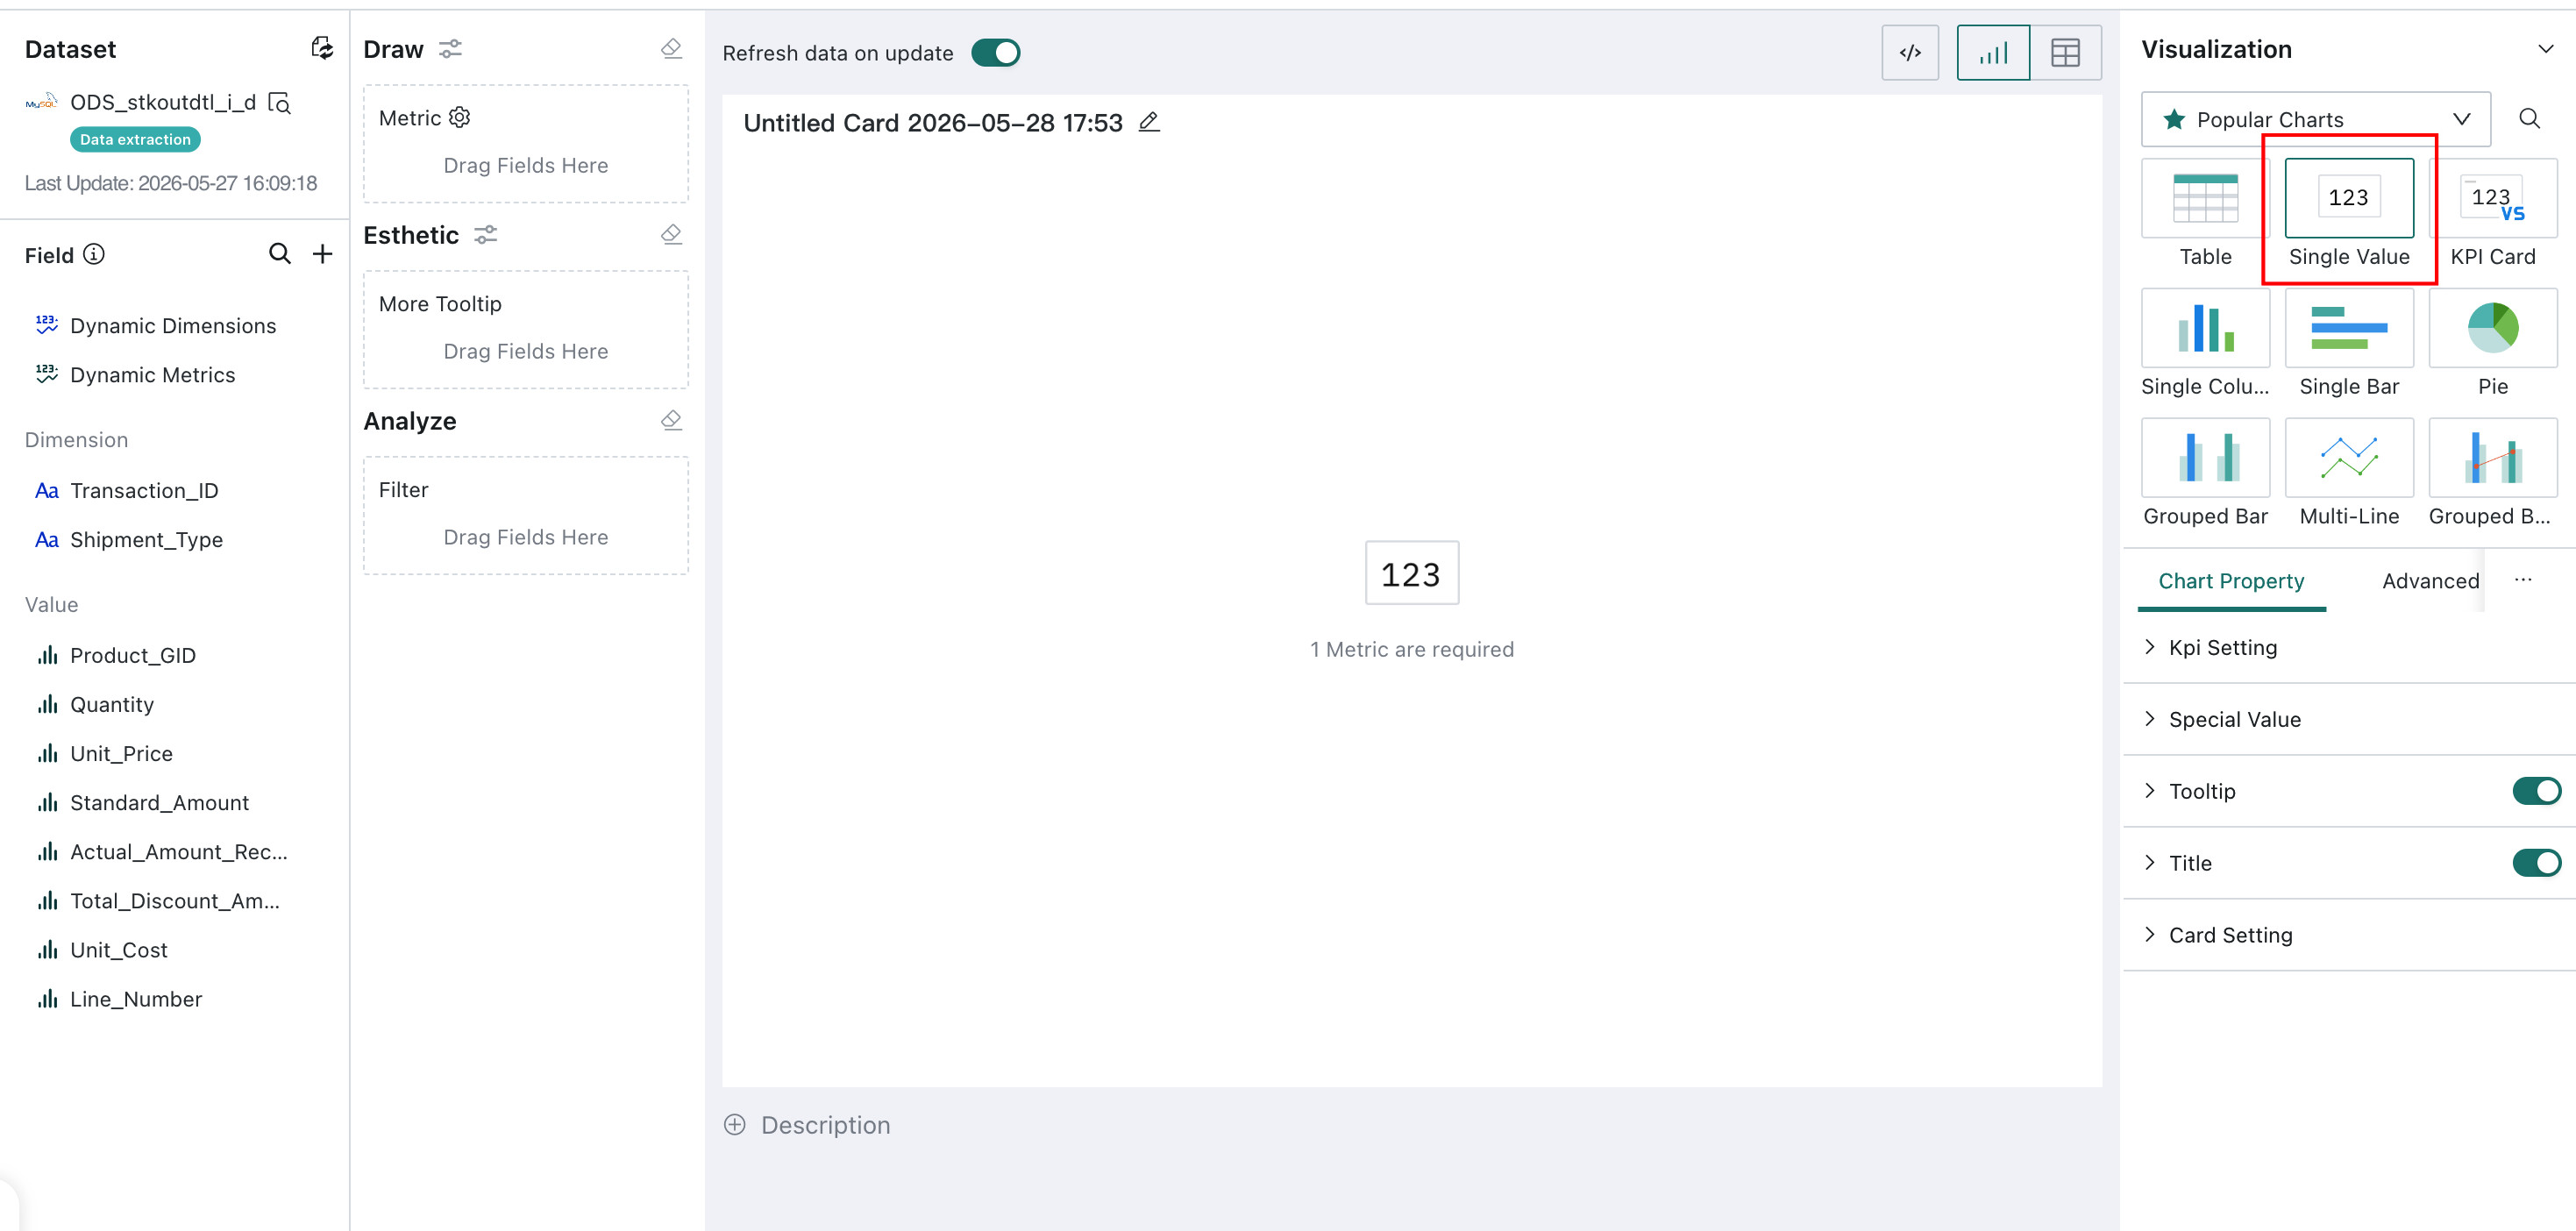
A DuPont Analysis Chart consists of multiple indicator cards, so before creating a DuPont Analysis Chart, users need to create a batch of indicator cards on the dashboard.
Create DuPont Analysis Chart
After the indicator cards are drawn, users can draw the DuPont Analysis Chart on the page.
-
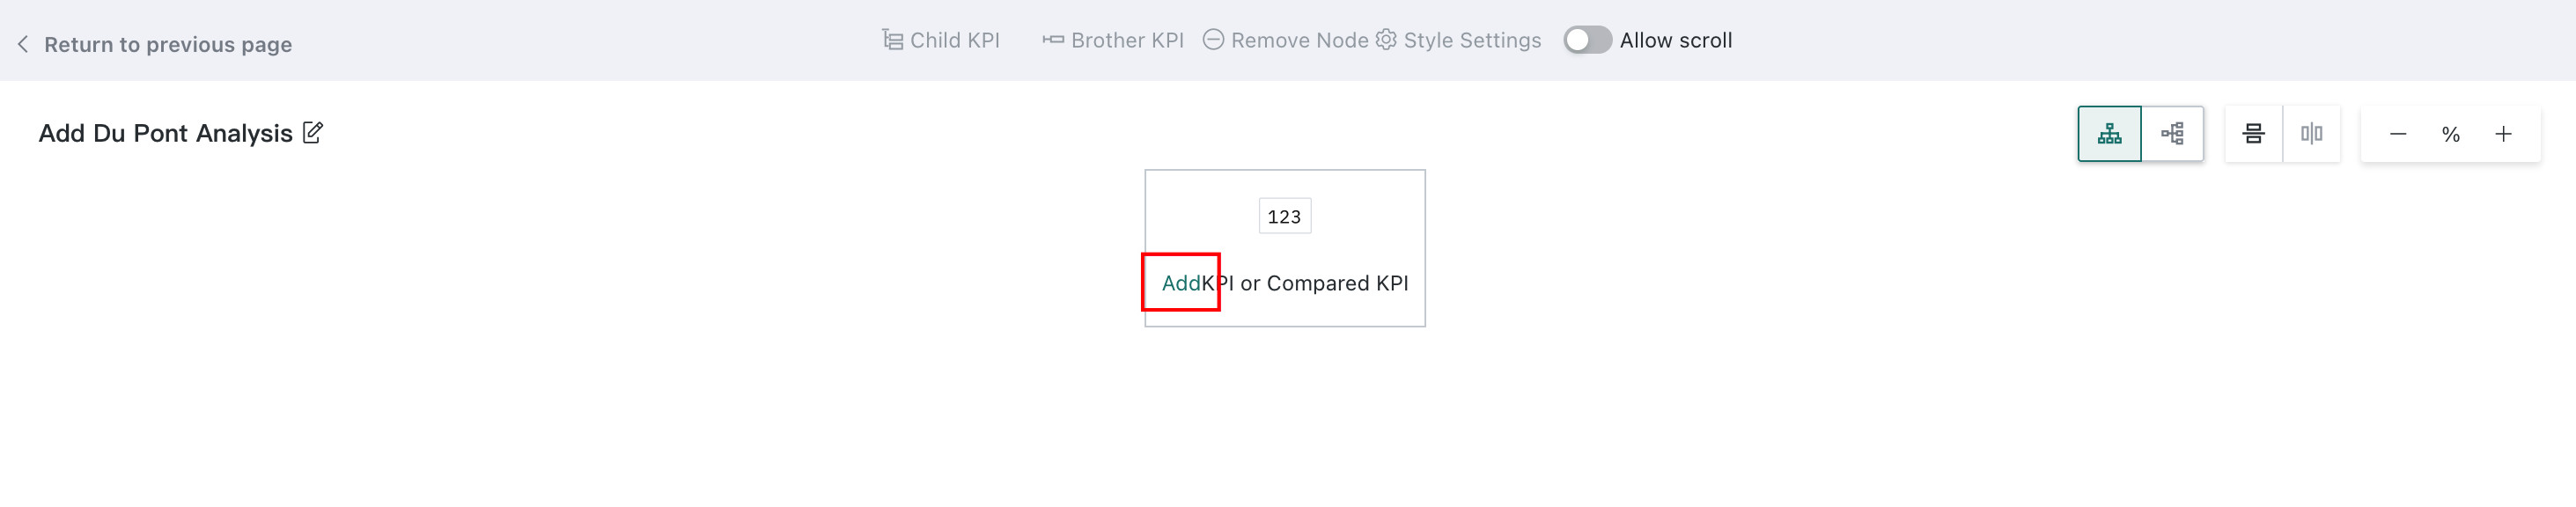
On the dashboard page, click "New Card", select "DuPont Analysis Chart", and add indicator cards to the newly created DuPont Analysis Chart. The first added indicator card will serve as the parent node of the DuPont Analysis Chart.
 Note
NoteThere is only one parent node at the top of the DuPont Analysis Chart, and there can be multiple child nodes. Except for the highest parent node which cannot add peer indicators, subsequent child nodes can all add child indicators, peer indicators, remove indicators, and set styles.
-
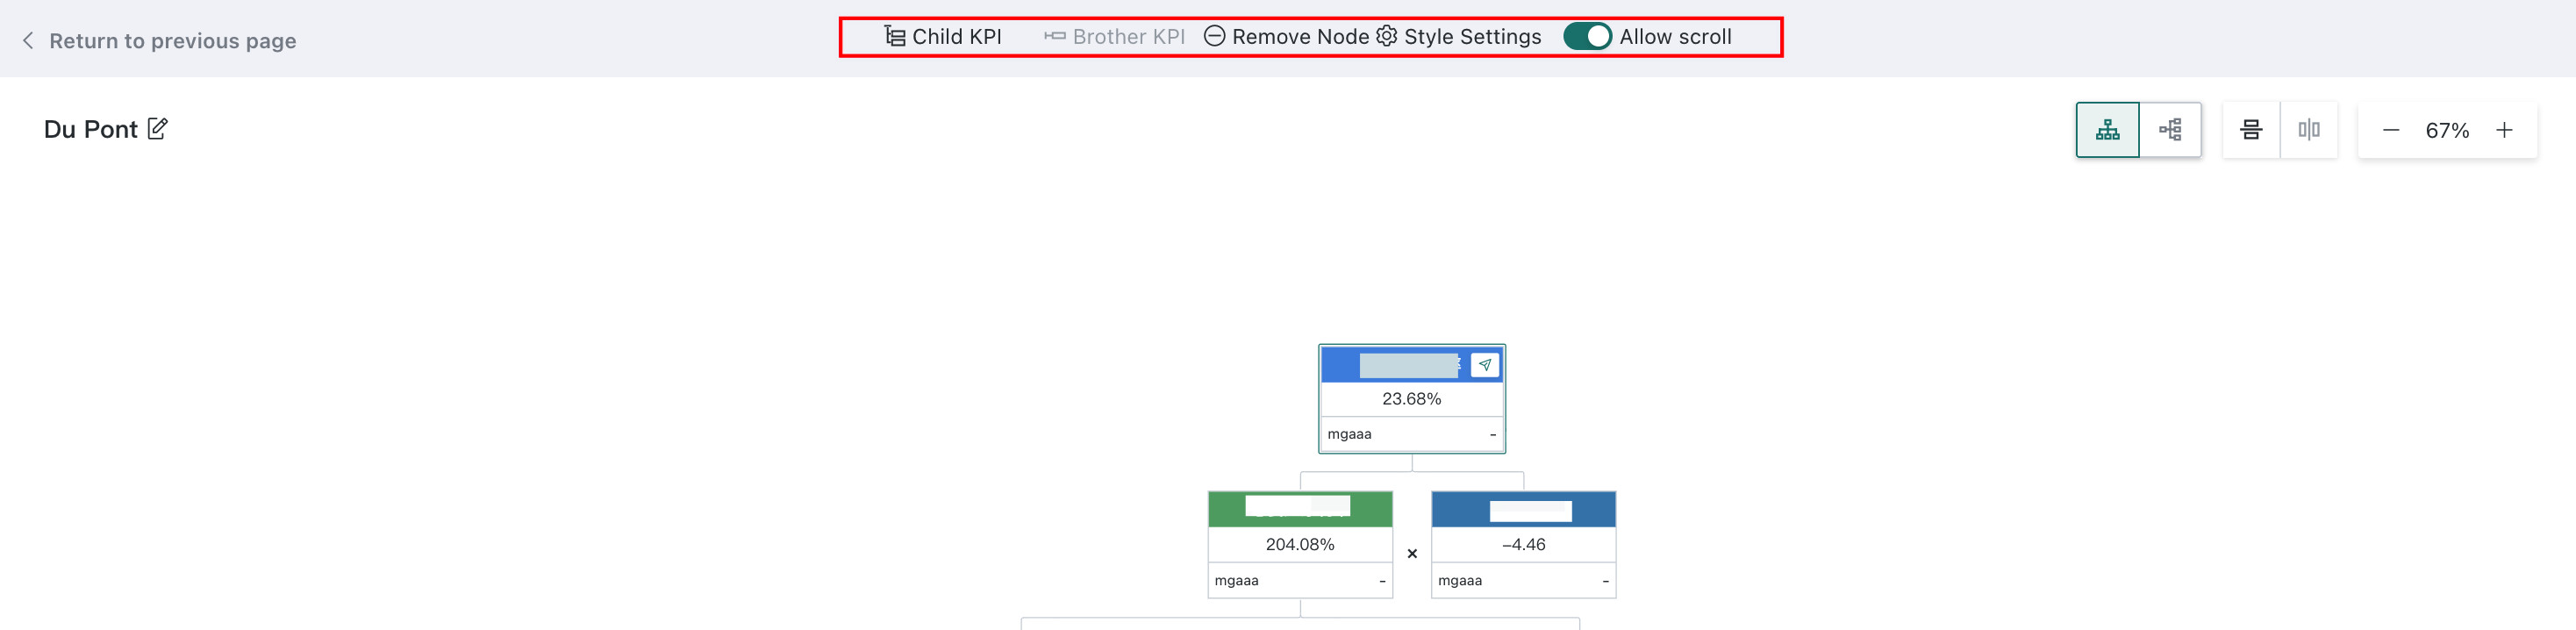
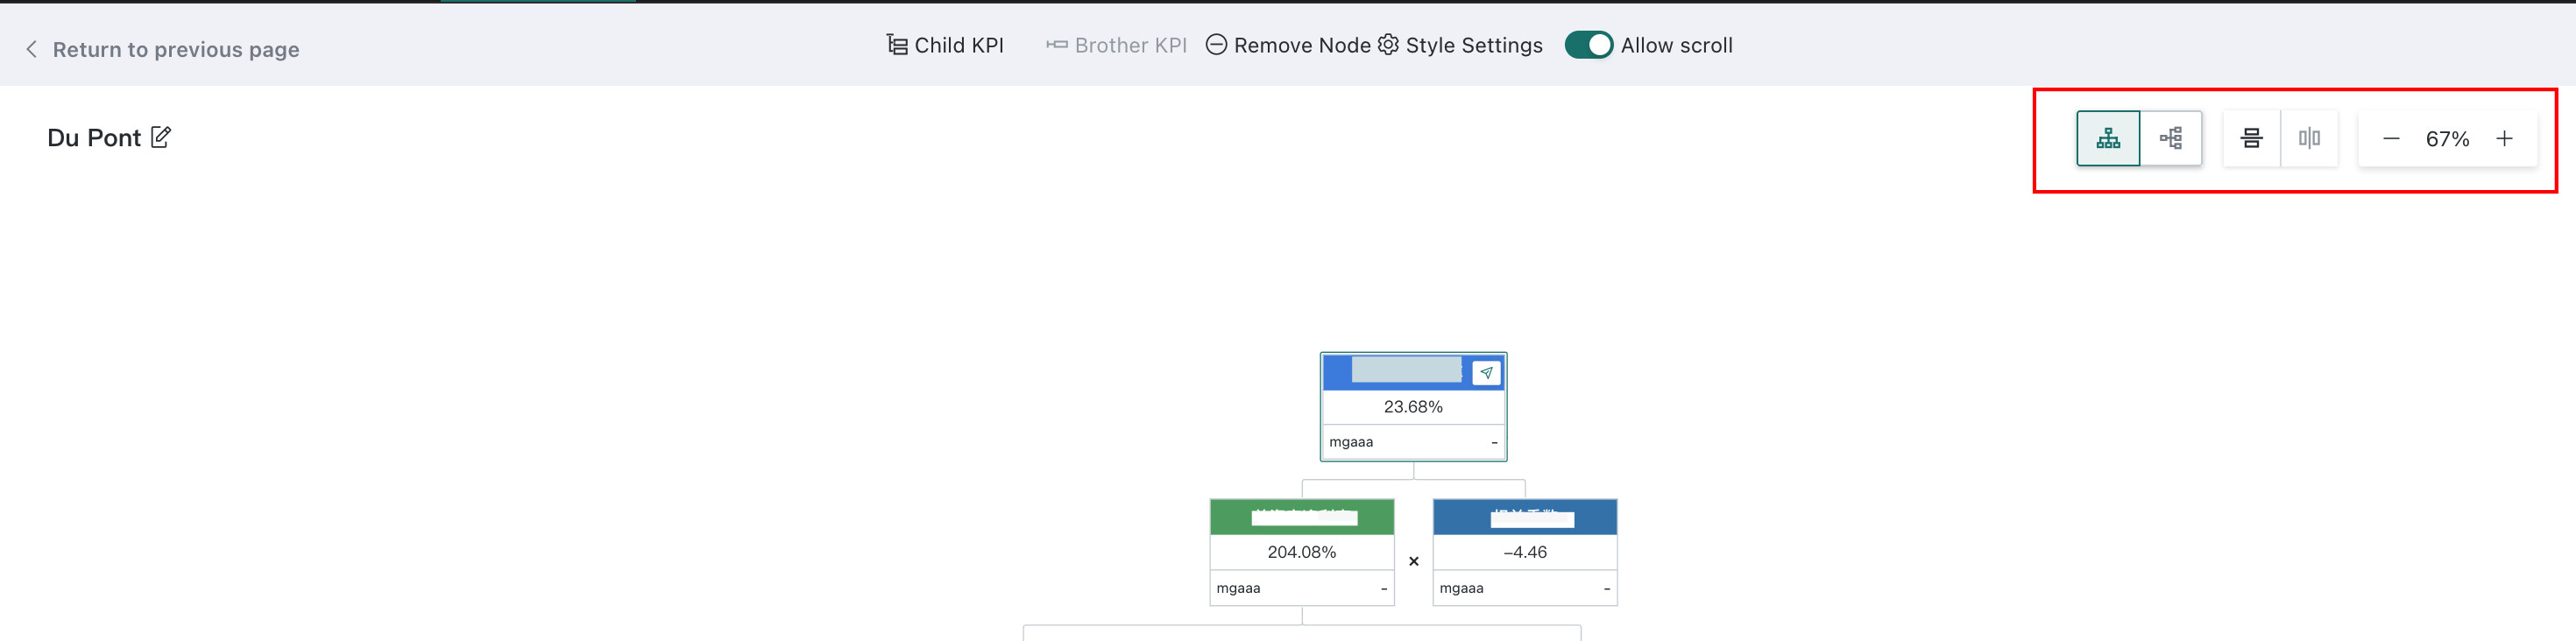
Select a node and click the operation button above. Guandata BI supports adding, removing, and style setting operations for nodes.
-
Newly created nodes will automatically inherit styles. Between peer nodes, you can choose to add +, -, *, / operation symbols to represent the relationship (these operation symbols only represent the relationship; peer and upper/lower level cards will not actually perform calculations).
-
After the DuPont Analysis Chart is completed, users can also modify the display effect of the DuPont Analysis Chart as needed. The structure of the DuPont Analysis Chart is similar to a pyramid from top to bottom. In addition to top-to-bottom, Guandata BI also supports setting from left to right, and can also perform vertical/horizontal flipping of the DuPont Analysis Chart.
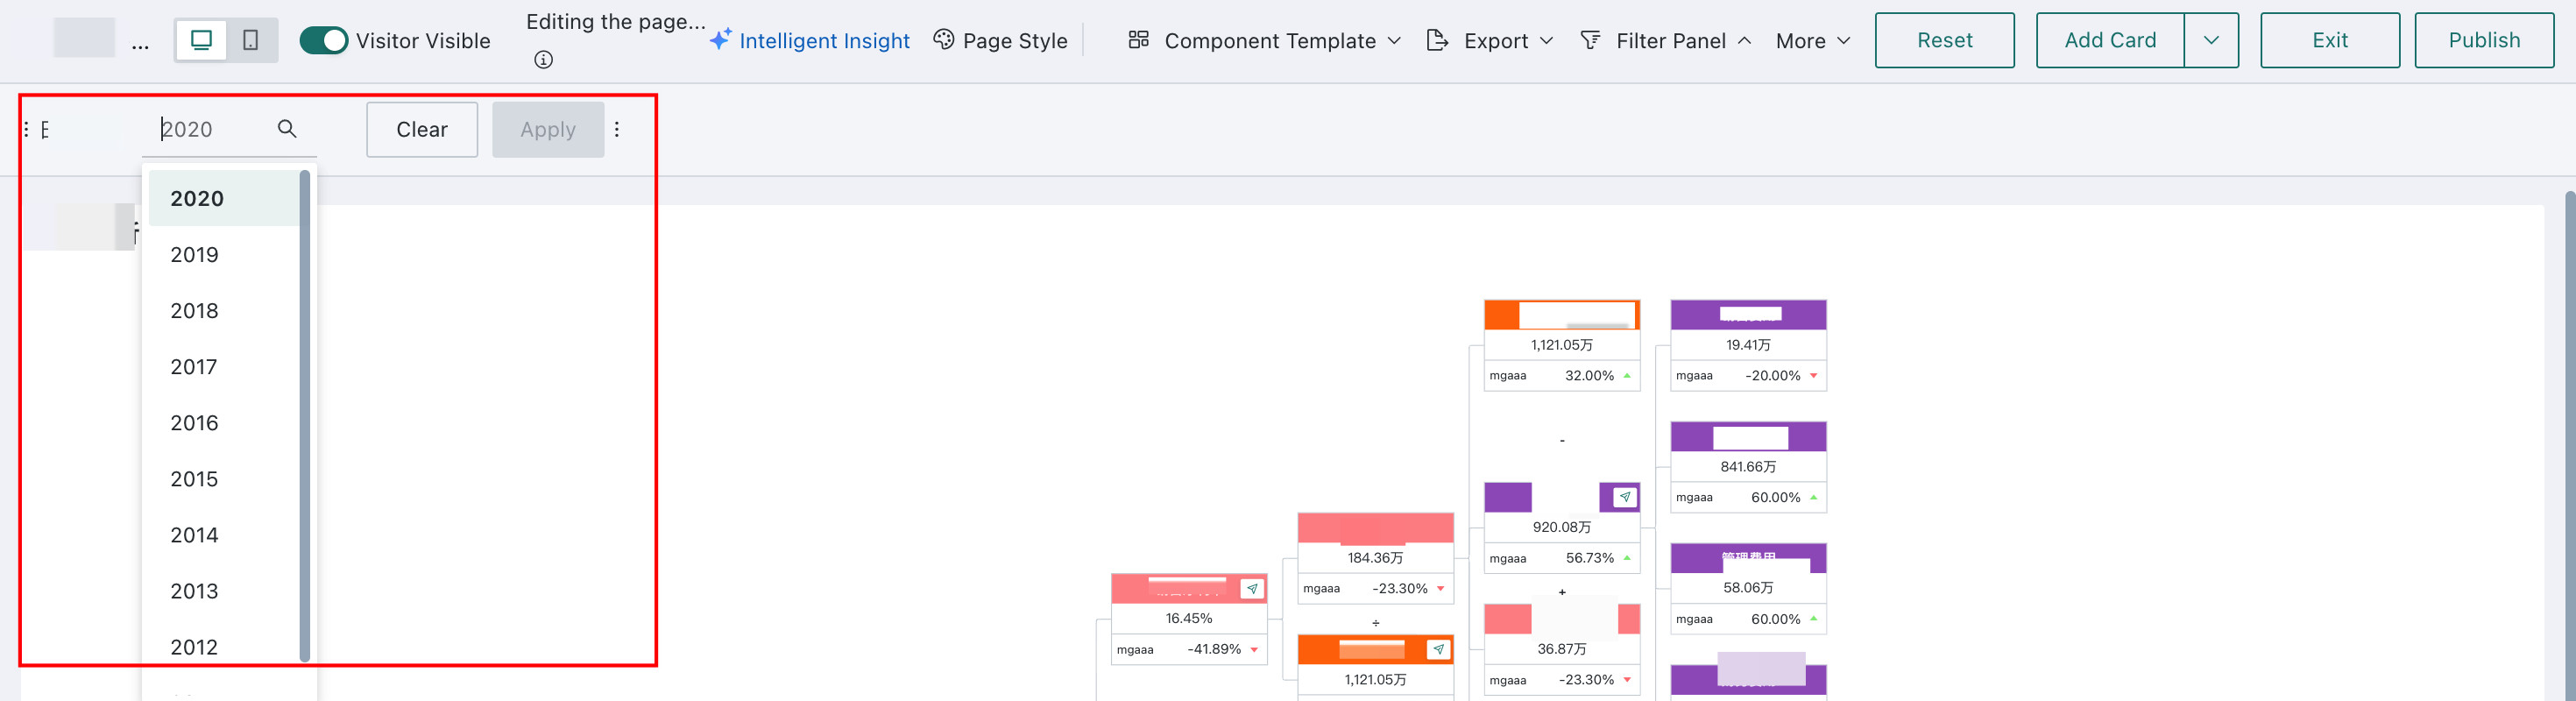
View Partial Data
If you need to view partial data, you can also create a filter on the page and set it to link with the indicator cards inside the DuPont Analysis Chart. This way, when the filter has a range selection, the indicator card data can also change accordingly. For filter configuration instructions, please refer to Page Filter.
Move DuPont Analysis Chart
Drag
The DuPont Analysis Chart allows dragging. Move the mouse into the canvas, hold down the left mouse button and drag.
Scroll
There is an "Allow Scroll" switch above the DuPont Analysis Chart, which is off by default.
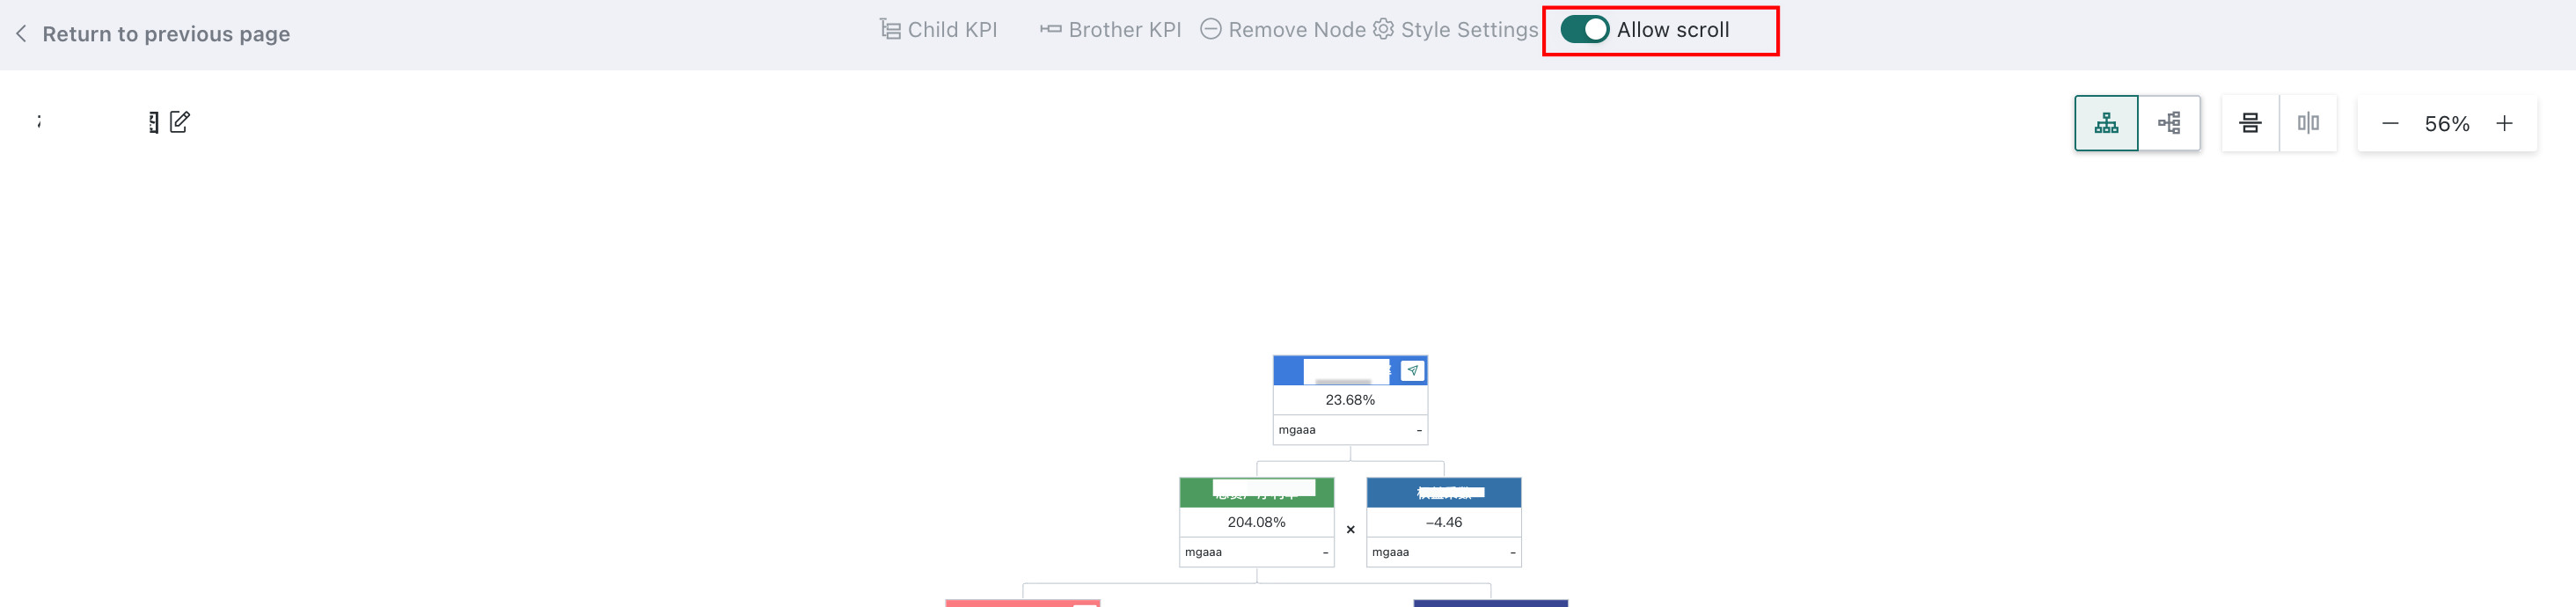
- When enabled, move the mouse into the canvas, and the DuPont Analysis Chart supports scrolling, with the scroll range not exceeding the DuPont Analysis Chart boundary.
- When disabled, manual scrolling is not supported. When the DuPont Analysis Chart content is larger than the canvas, you need to zoom in/out and drag cards to view the complete content.
Node Collapse/Expand Feature Description
Editor Operation Rules
- Default Expand State: In the card editing page of the DuPont Analysis Chart, all nodes are expanded by default, no manual adjustment needed.
- Interaction Trigger Logic: When the mouse moves to the node area, the collapse icon is displayed. Click the icon to manually collapse the corresponding node. No need to reset the canvas after adjustment.
- Collapse Icon Display Rules: When collapsing a node, the icon displays the total number of child nodes under that node (including collapsed child nodes). Click the number to expand the collapse.
- State Independent Save: The collapse/expand state of each node is saved independently, and the state after the last operation is maintained when entering the editing page next time.
- Preview Effect: The preview defaults to displaying the collapse/expand state set in the editing page, consistent with the editing configuration. Manual collapse/expand of nodes is a one-time interaction.
Viewer Viewing Rules
When viewing, nodes can be manually collapsed/expanded, but this operation is only a one-time interaction; after refreshing the page, the node state returns to the default state set during editing.