Other Basic Cards
Overview
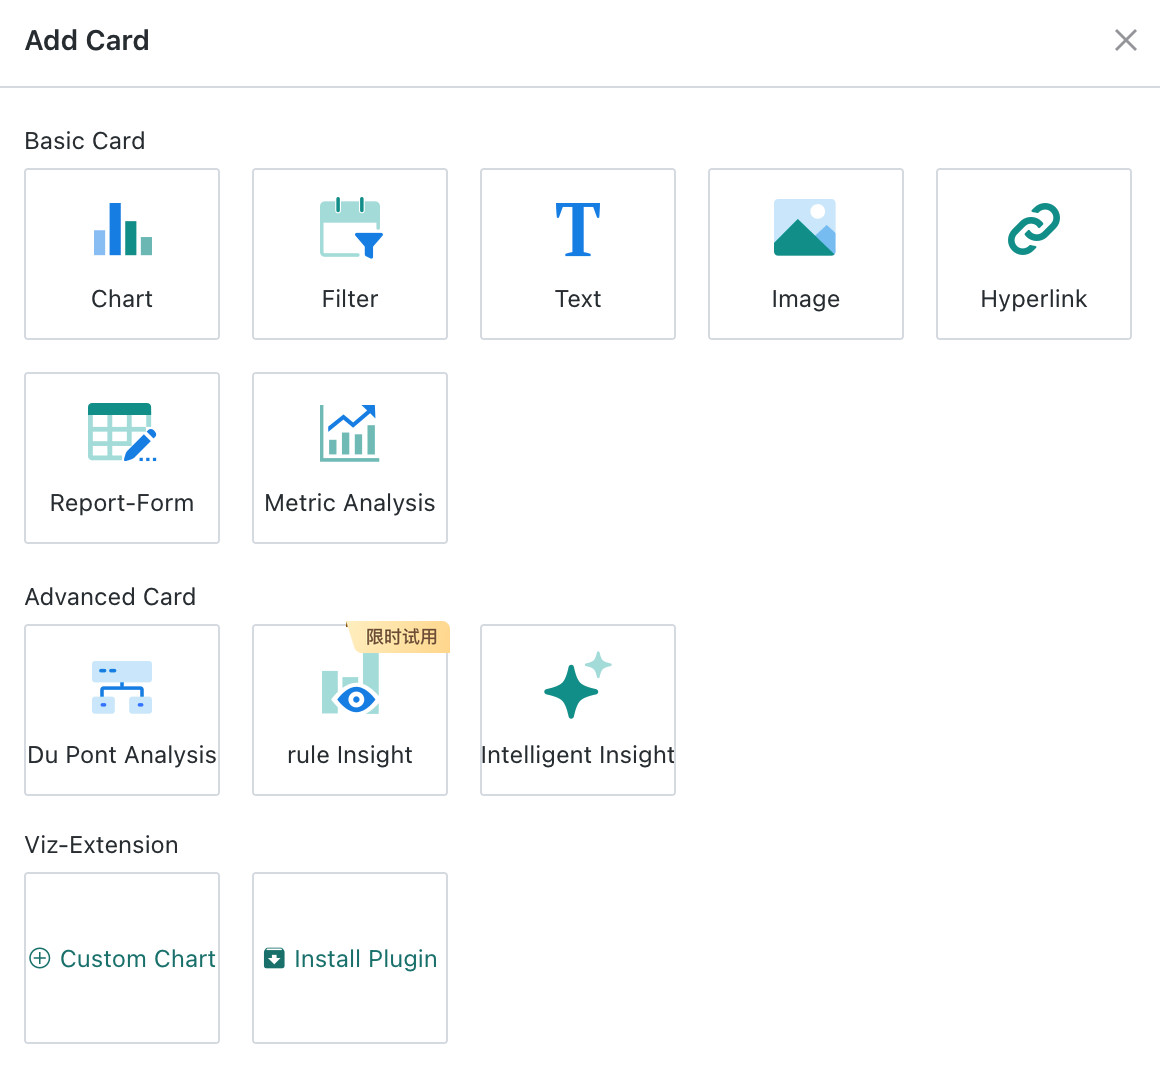
In addition to visualization charts, Guandata BI also supports drawing other types of basic cards, including: Filter cards, Text cards, Image cards, External Link cards, China-style Reports, and Table Data Entry. This article will detail the creation process of various basic cards.
After creating various cards, management operations such as modifying, deleting, and moving cards are needed to make the overall dashboard page reasonable and aesthetically pleasing. For details, see Card Management.
Card Types
Filter Card
The filter function of Guandata BI allows users to flexibly adjust filtering conditions when viewing the dashboard, achieving simultaneous filtering of multiple components.
For example, users can simultaneously filter and control the data of the "Sales Monthly Trend" chart and the "Customer Satisfaction" indicator card to precisely analyze sales situations. This feature enables users to customize data views according to their needs, improving the efficiency and accuracy of data analysis, helping to discover and understand key information in data faster, thereby supporting effective decision-making.
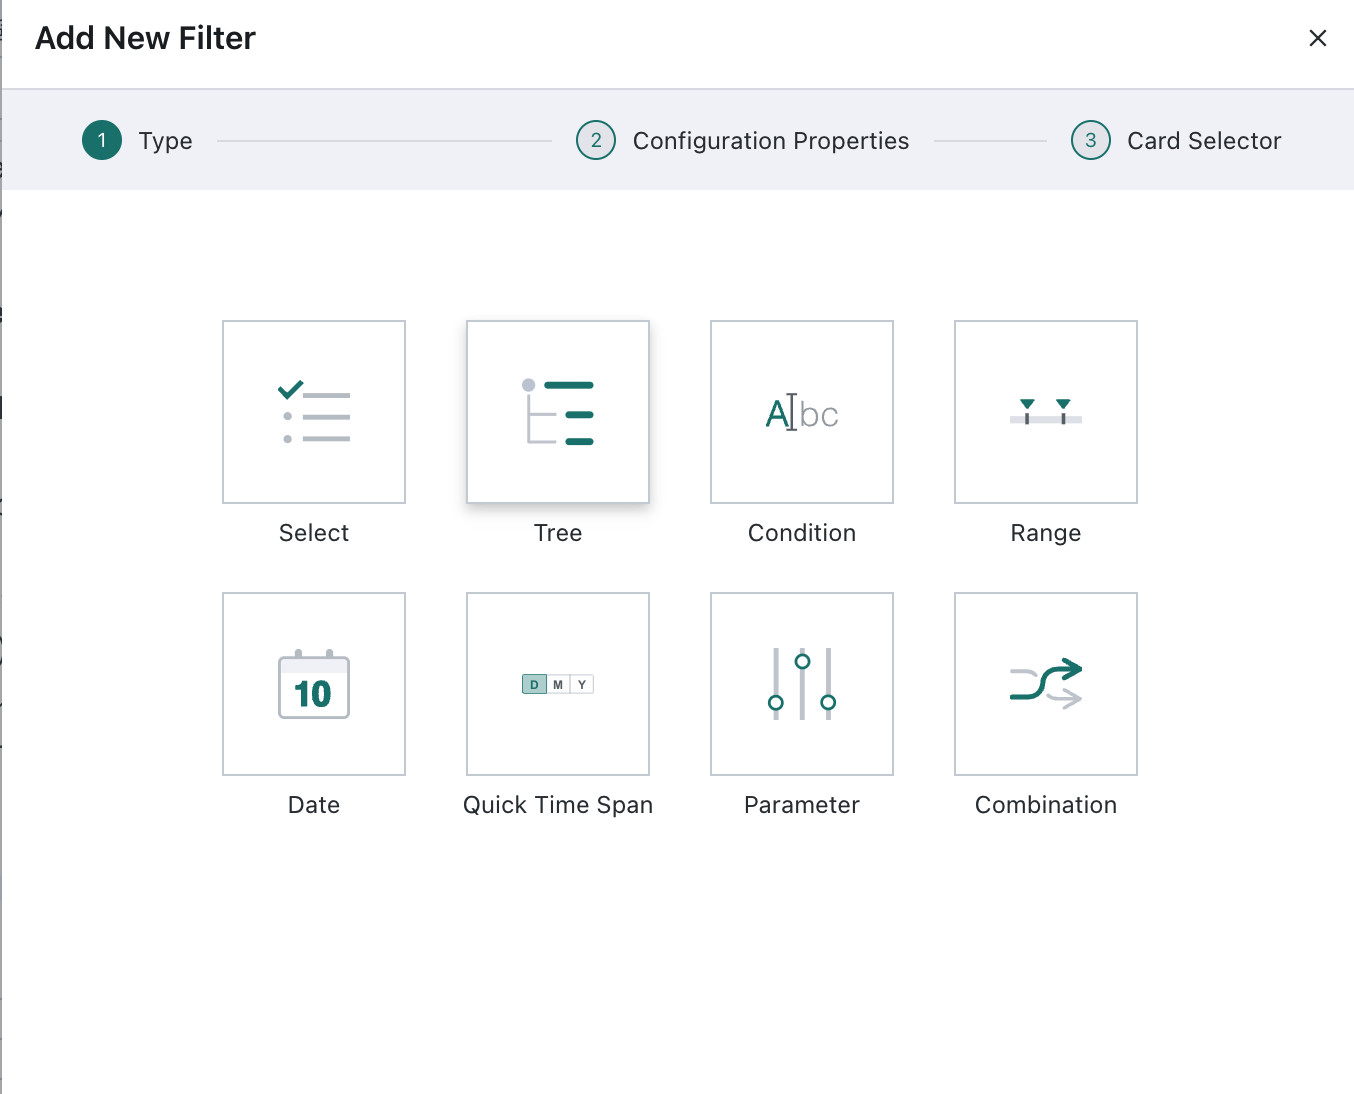
The flexibility and convenience of filters provide users with deeper and more comprehensive data insights, helping them make wiser decisions in different scenarios. Guandata BI has 8 types of built-in filter components, including selection filters, condition filters, date filters, and range filters. For detailed configuration procedures, please refer to Page Filter.
Text Card
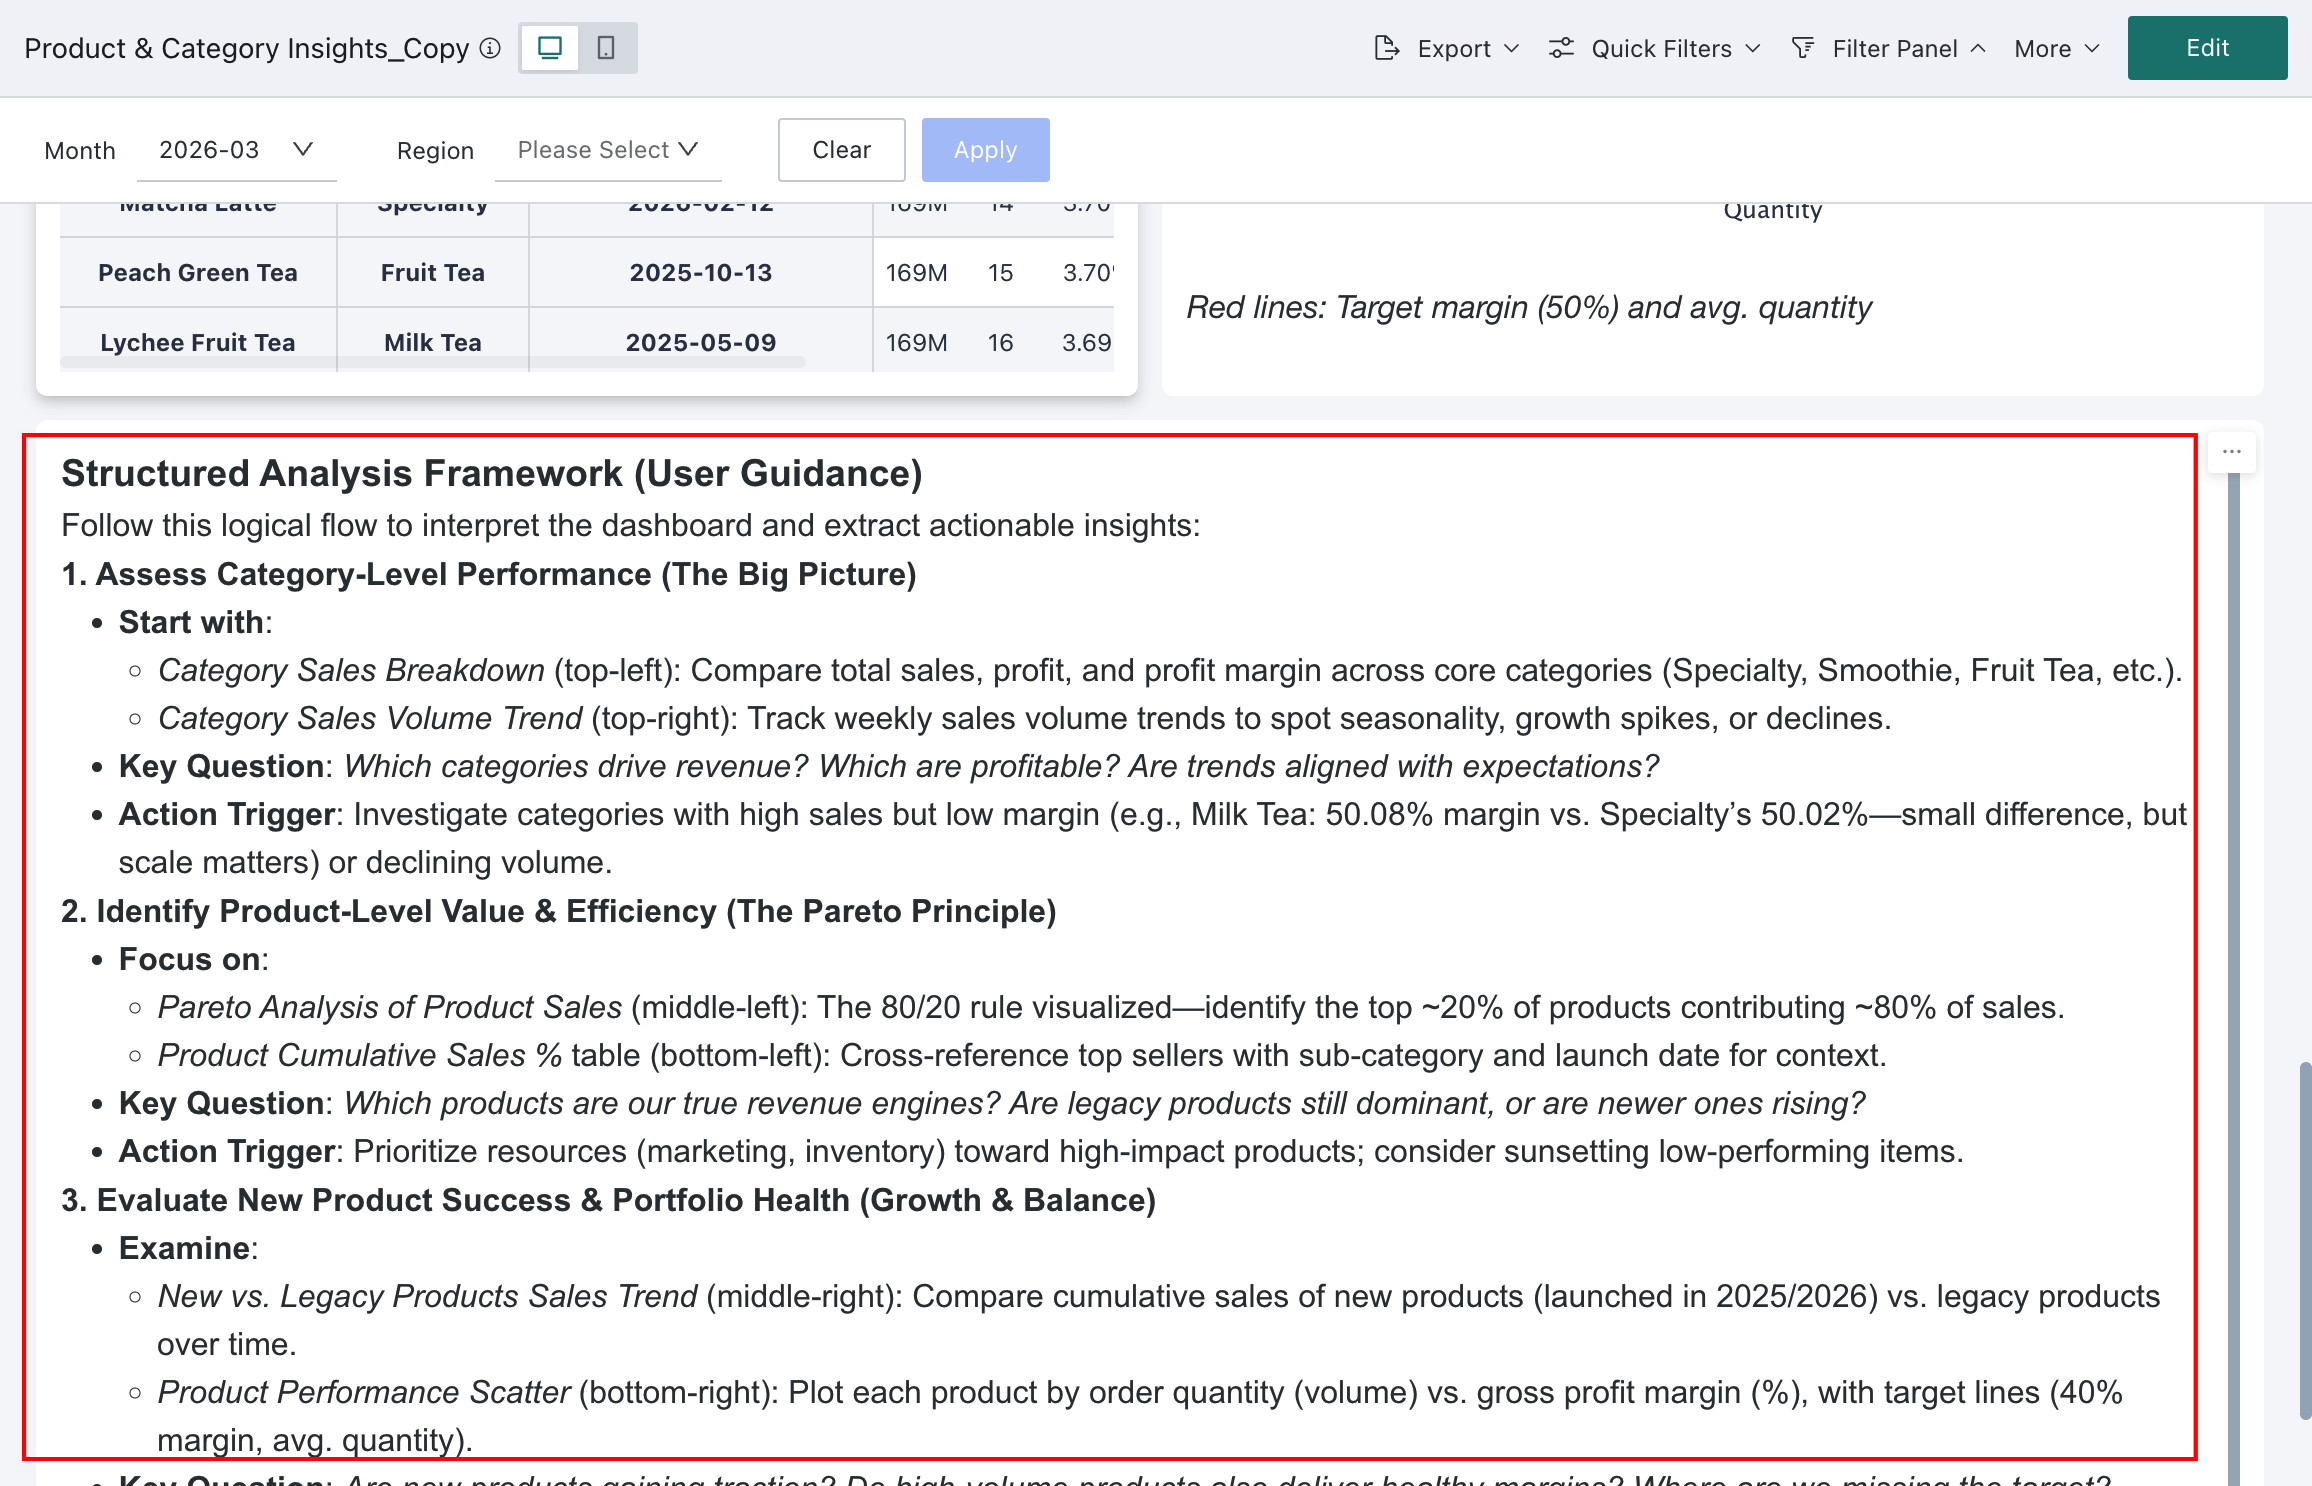
Text cards are mainly used to display text content in analysis dashboards. They not only support pure text writing, but can also reference indicator cards, insert dataset creation/update times, and insert specific user attributes. Reasonable use of text cards can display data dashboards more flexibly.
For example, when the logic in the page is relatively complex or difficult to understand, text cards can be used to explain and describe the data.
- Click New Card > Basic Card > Text to create a new text card on the page. Click the pen-shaped button in the upper right corner of the text card, and enter the content to be annotated in the text card.
- Text cards support referencing indicator cards. When the data of the indicator card changes, the referenced data in the text card will also be automatically updated. Indicator cards can be created through text cards, or directly reference existing indicator cards on the dashboard.
(1) Create Indicator Card through Text Card
a. Click the "Reference Card Data" button in the editing bar, select "Create Indicator Card through Text Card", click the "Add" button, select the data table, modify the card name, drag the data to be displayed to the measure, and save (same operation as creating chart or table cards).
b. Double-click the text card to enter the text card editing state, click the "Reference Card Data" button in the editing bar, select the saved card name, and reference this data.
c. Click the X in the upper right corner to save the text card editing, and the referenced data will be dynamically displayed on the text card.
(2) Existing Indicator Card
When creating text cards, users can also directly reference existing indicator cards on the page.
- Supports creating new indicator cards and referencing existing indicator cards on the current page, including indicator cards in the card pool.
- Supports repeatedly referencing the same indicator card
Image Card
Image cards allow users to directly upload, display, and manage images in analysis dashboards, conveying more information and background, making data dashboards more vivid and intuitive.
For example, in brand promotion or product promotion dashboards, image cards can be used to display company logos, product images, advertising posters, etc., to intuitively convey brand information and deepen the audience's impression.
- Click New Card > Basic Card > Image to create a new image card on the dashboard. Images can be uploaded in two ways:
-
Image Link: Fill in the image link in the image card editing box. The image link needs to start with https.
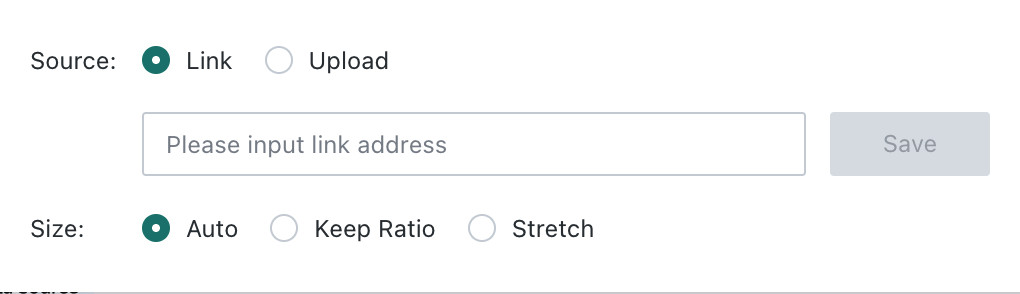
-
Local Upload: Directly upload local images to the image card. Image cards only support local upload of jpg, png, and gif formats, and the image size must be less than 5M.
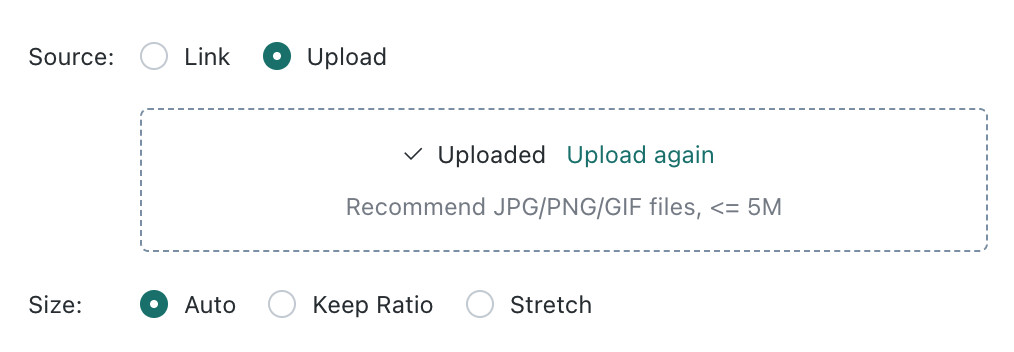
- After uploading the image, you can set the image size, supporting the following three image adaptation methods:
- Adaptive, that is, scale according to the editing box size;
- Original Ratio, that is, scale according to the original image size;
- Full Cover, that is, scale according to the card size.
External Link Card
External link cards can be used to store a webpage link, and the system will automatically display the specified page in the card. External link cards not only provide users with a quick channel to directly jump to the specified external page, but also enrich the content display form of BI pages, enabling seamless connection between data analysis and external resource access.
For example, in the figure below, when introducing a certain feature, in addition to using text descriptions, external link cards can also be used to display the feature page for auxiliary viewing.
-
Click New Card > Basic Card > External Link, name the external link card, then enter the corresponding external link address, click "Save", and an external link card is created. As shown in the figure, the card name is: "Guandata Official Website", and the corresponding external link address is https://www.guandata.com.
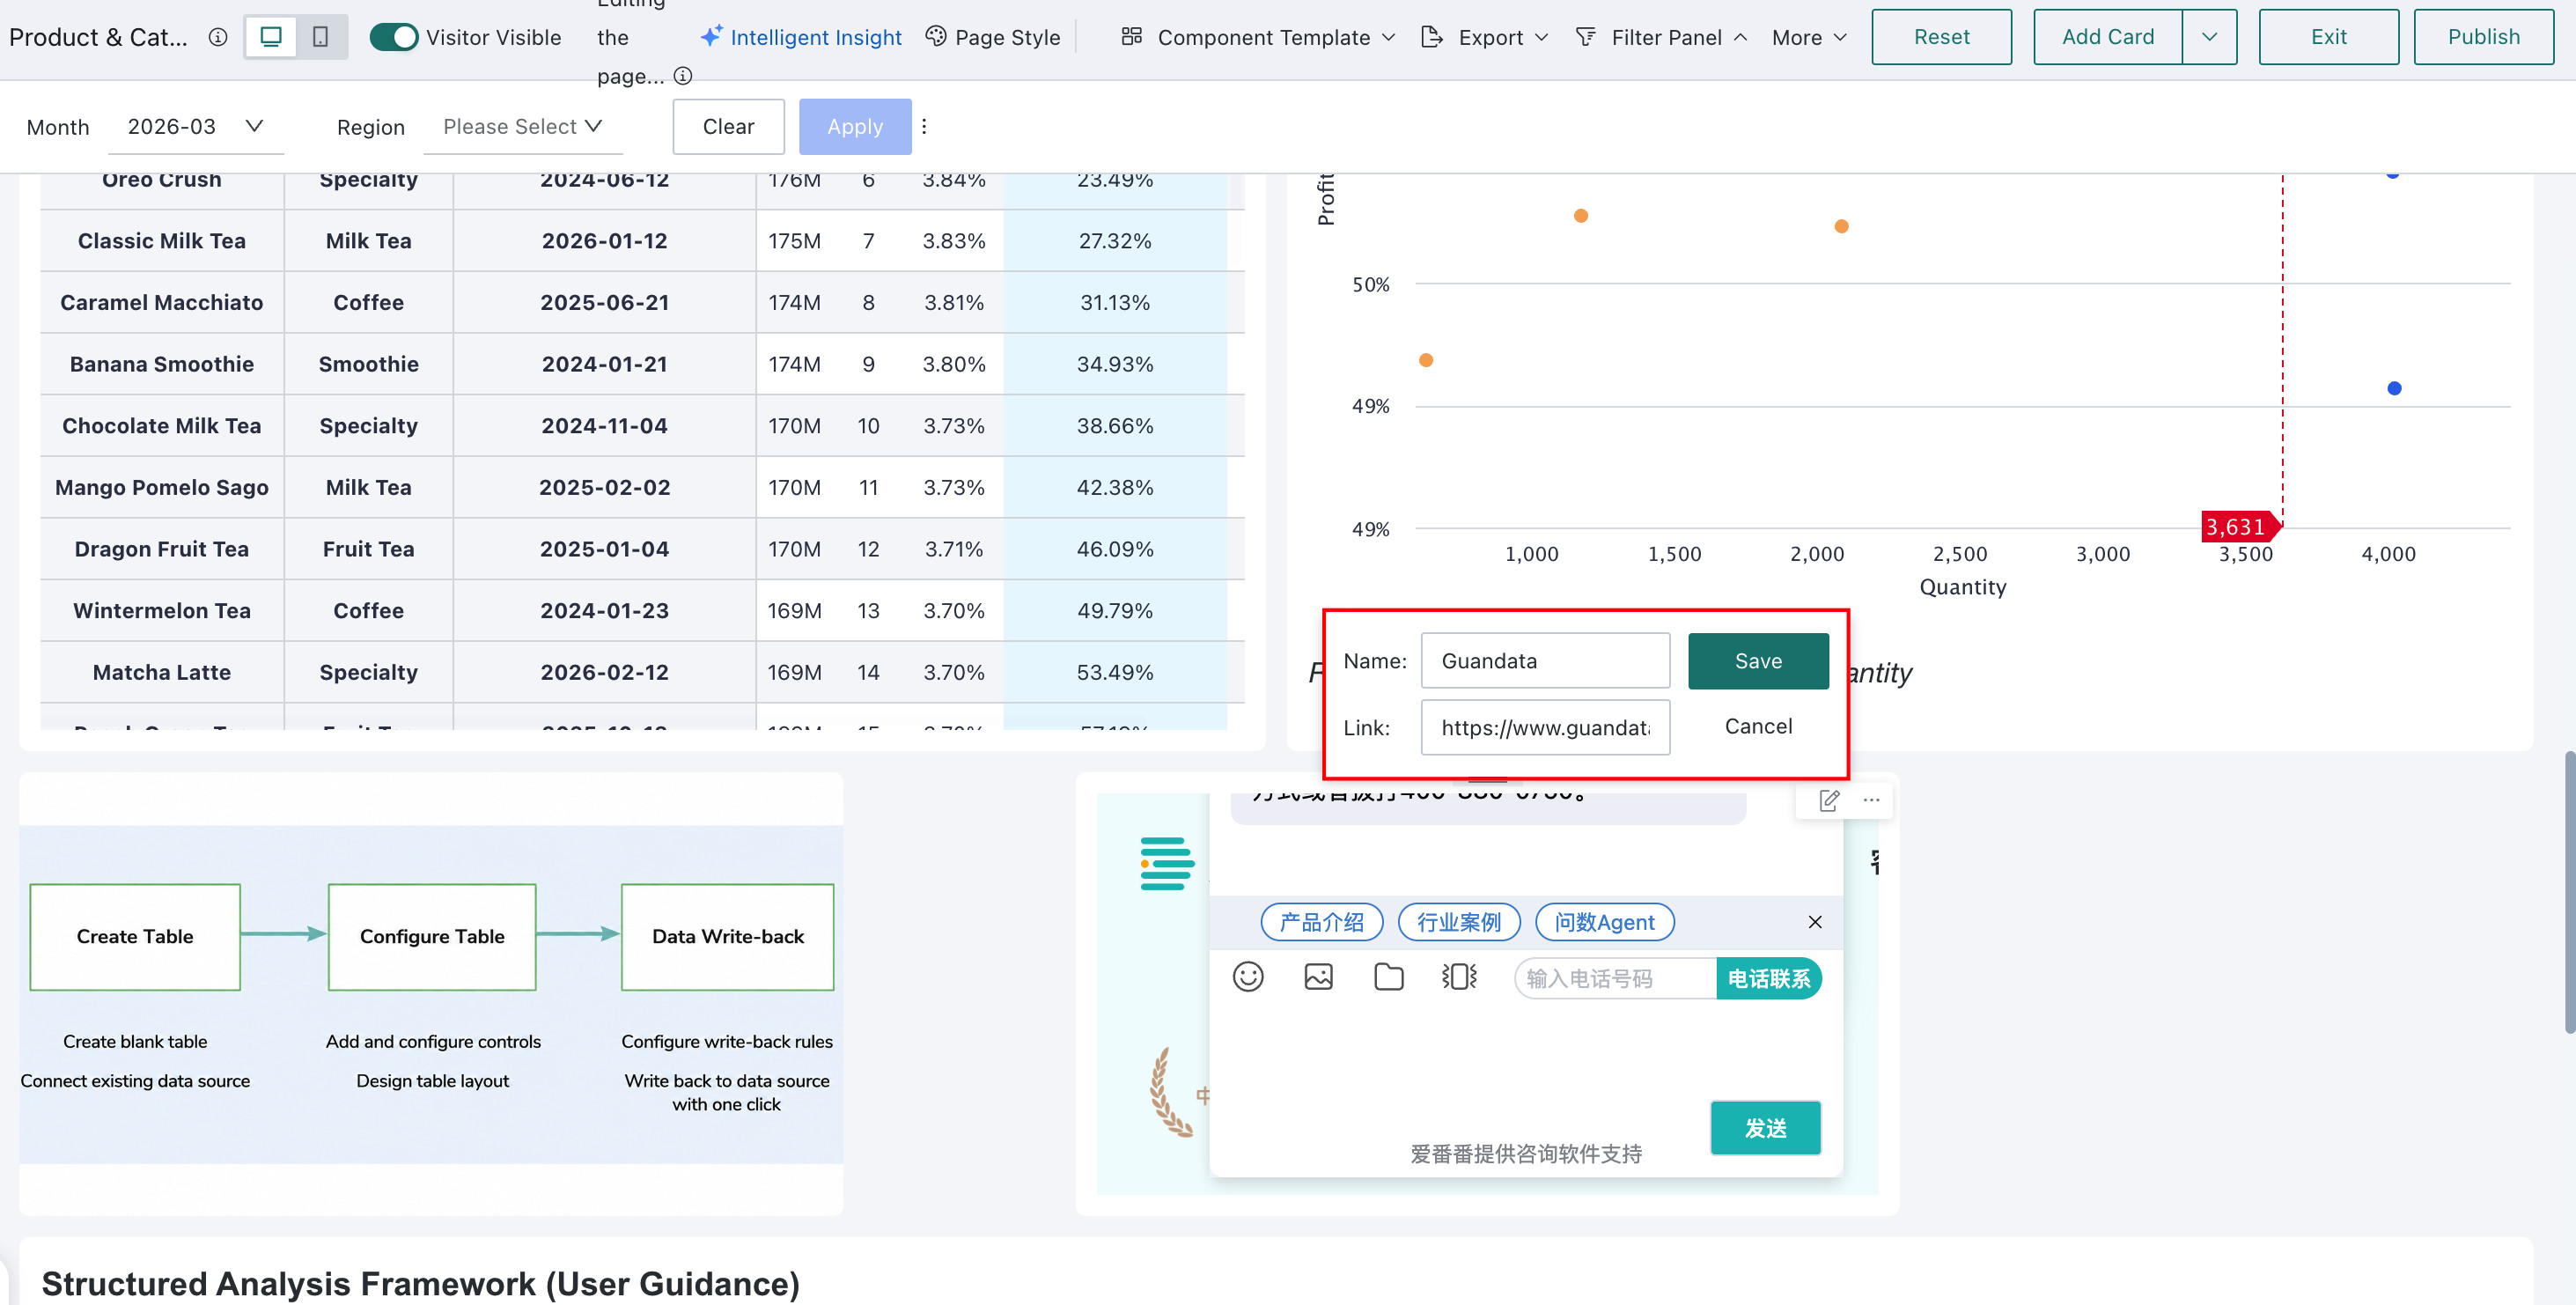
- The external link address here must start with https. If it starts with http, the link cannot be displayed.
- If the website is set to not be referenced or opened by third-party websites, the setting will fail, such as https://www.baidu.com.
China-style Report
Data analysts inevitably have to deal with various reports in their daily work, and China-style reports are undoubtedly one of the most challenging. Such reports usually have multi-level headers, complex formats, large data volumes, complex reference relationships, and diverse conditional formats, greatly limiting analysts' work efficiency and further affecting the timeliness and analysis effectiveness of enterprise reports.
Based on the above challenges, Guandata provides the "China-style Report" feature. It is a low-threshold, one-stop report product that is "highly compatible with Excel user habits". Deeply integrated with the Guandata intelligent data analysis platform, it has the platform's built-in intelligent data preparation, permission control, linkage filtering, and other capabilities, while providing low-threshold report building capabilities, agilely achieving Excel report online. In other words, Guandata China-style Report makes complex reports no longer "complex".
For specific configuration procedures, please refer to China-style Report.
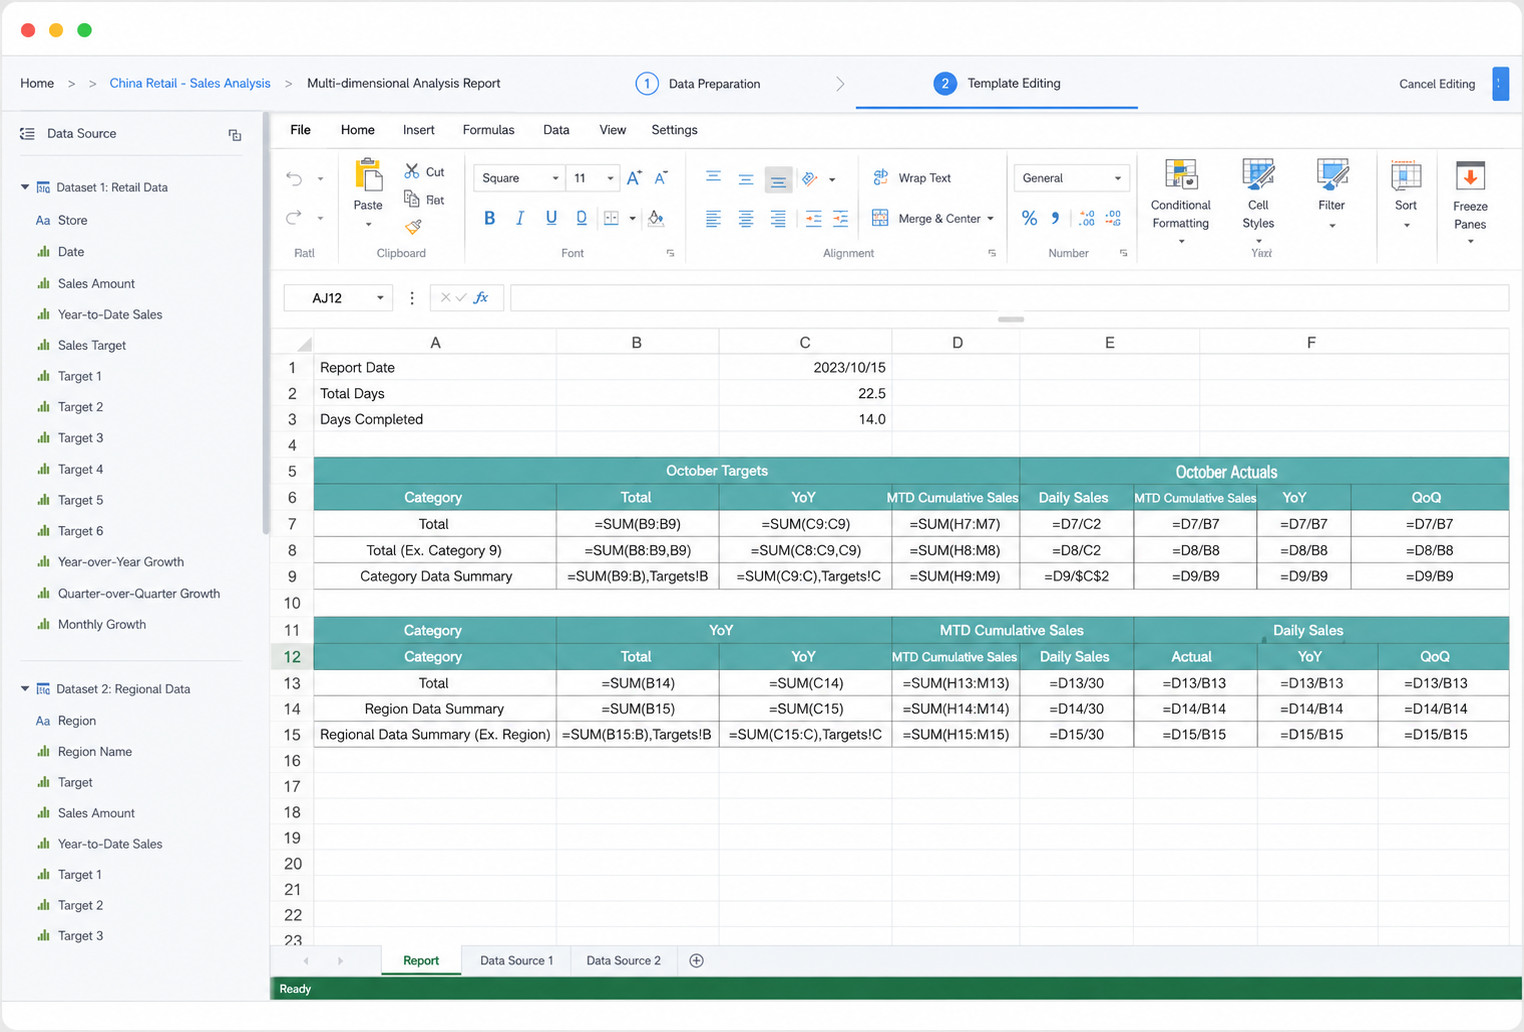
Table Data Entry
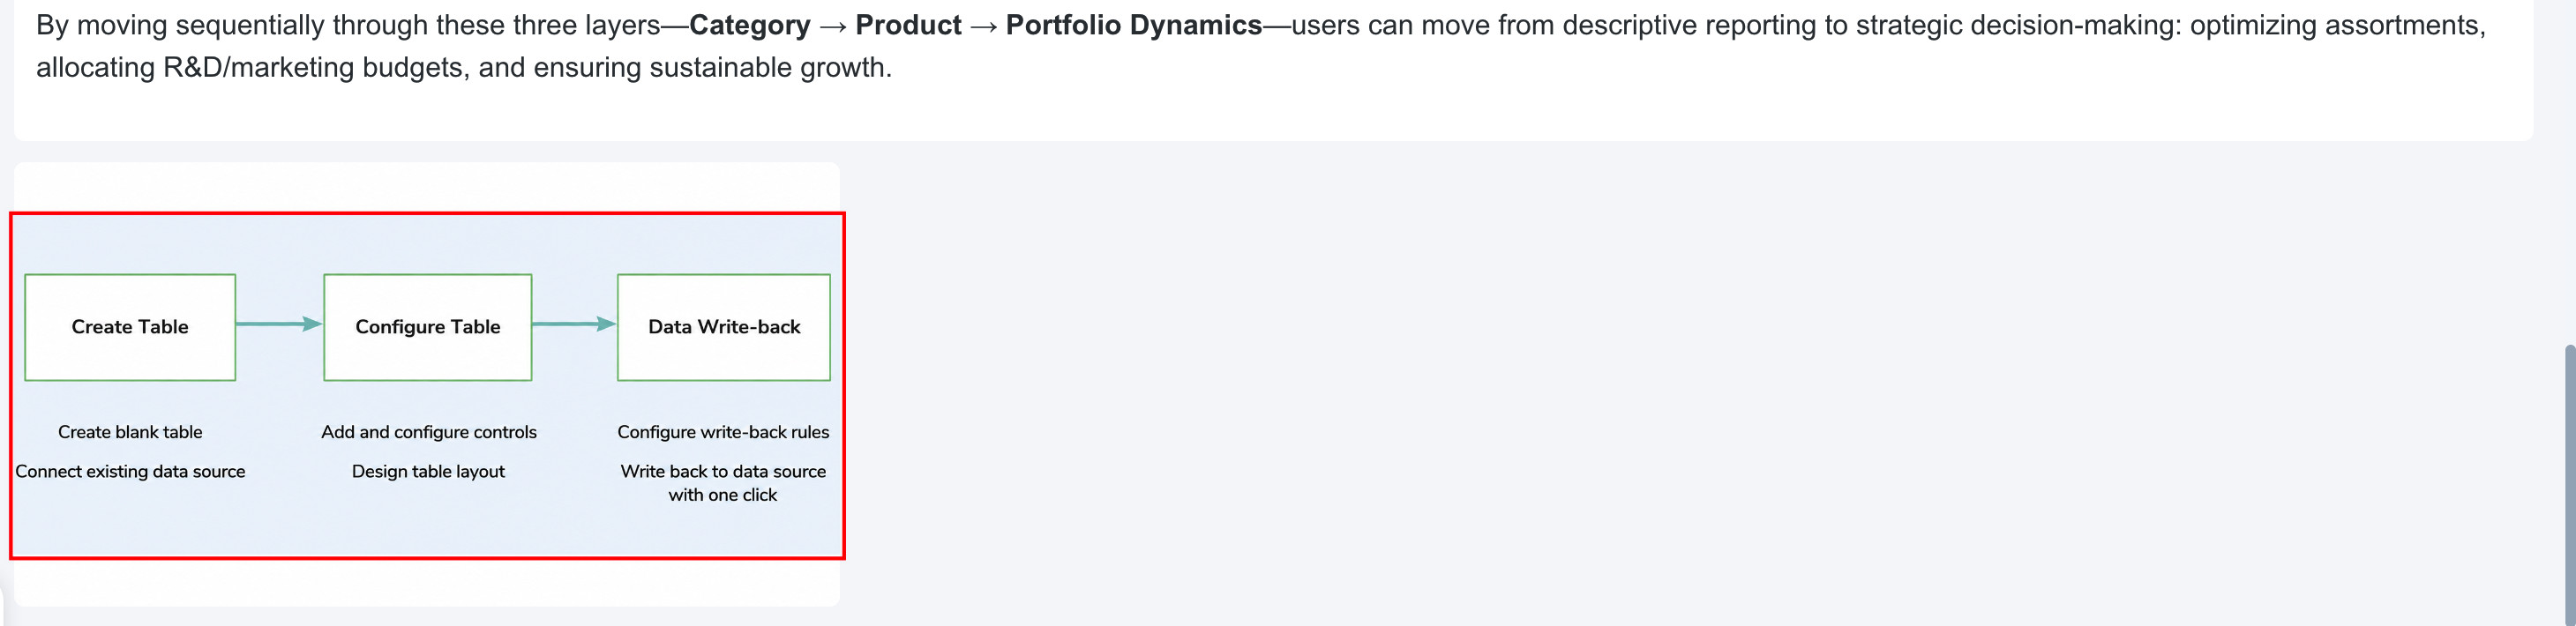
Table Data Entry is a tabular data collection and modification tool launched by Guandata, enabling users to easily achieve online data entry, with one-click data write-back to the database, ensuring data accuracy and reliability.
Table Data Entry provides an Excel-like user experience, not only fully compatible with Excel's function formulas and operation habits, but also supporting batch data import, greatly simplifying the personalized form configuration process, achieving low-code efficient operation. In addition, Table Data Entry comprehensively ensures entry accuracy, automatically summarizes and calculates reference data, achieves cell linkage calculation and real-time data validation, ensuring every step of the operation is accurate. One-click write-back to the database, intelligent update of entry templates, and flexible reset functions make the entire entry process both efficient and flexible, improving work efficiency.
For specific configuration procedures, please refer to Table Data Entry.