Visualization Extensions Overview
Overview
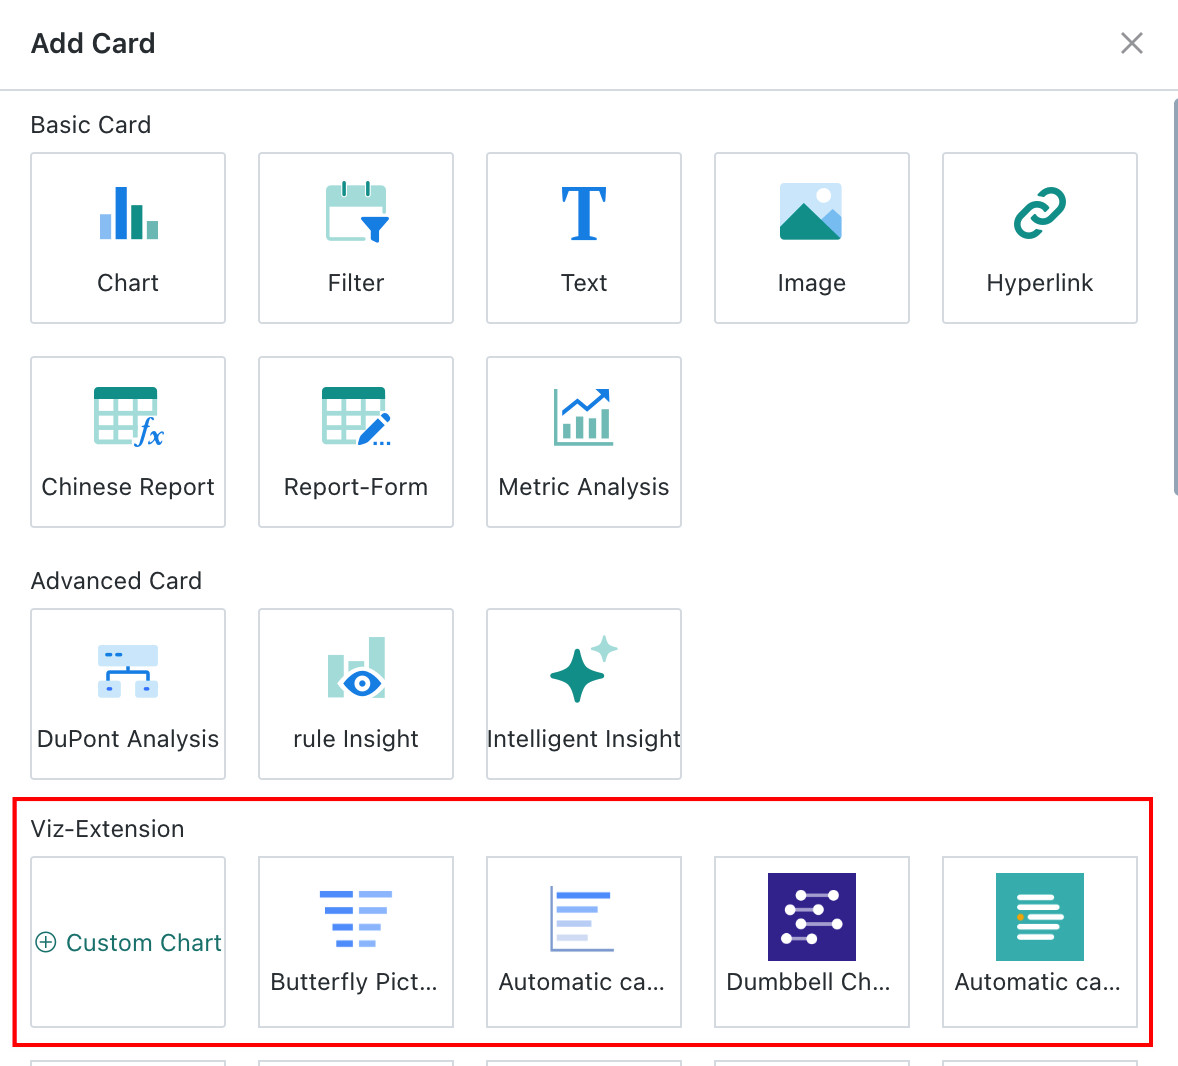
In different business scenarios, the built-in BI charts may not be enough to cover every analysis requirement. In addition to building special charts through the Custom Chart feature, Guandata BI also supports ready-to-use visualization plugins from the App Market, such as dumbbell charts, calendar charts, prediction curves, butterfly charts, and more. Users can search for the desired visualization plugin in the App Market and install it into BI with one click.
Visualization extensions give Guandata BI greater flexibility and scalability, allowing users to tailor data presentation to their needs and build more specialized analysis experiences. This section introduces the main extension paths and their usage scenarios.
Getting Started
Core Path | Operation Guide | Description |
Custom Chart | If the built-in charts in Guandata BI do not meet your business requirements, you can use Custom Chart to build your own data visualization. | |
Visualization Plugin | In addition to creating specialized charts with Custom Chart, users can also download visualization plugins from the Cloud Market. Guandata BI currently provides eight visualization plugin types. | |
If you have front-end development experience and want to extend the available visualization types, you can build custom visualization plugins in Guandata BI. | ||
| If you want to reuse a custom chart after it is created, you can package it as a visualization plugin and install it into BI. | ||
Custom Map | Custom maps can be used to display location data such as business districts and store locations. Guandata BI supports three types of custom maps: Etone Indoor Map, Fengniao Indoor Map, and Flat Map. |