Create Dashboard
Overview
Feature Introduction
Dashboard is one of the core features of the Guandata BI platform. It allows users to combine multiple visual charts, text descriptions, and other basic cards, smart insights, DuPont analysis charts, and other advanced cards, as well as custom charts and filters on a single page to form a complete data cockpit.
By creating a new dashboard, users can create personalized data display interfaces, centrally present key business metrics, and support data-driven decision-making.
Applicable Scenarios
Dashboards are suitable for a variety of data analysis and display scenarios:
- Management Reporting: Create comprehensive dashboards containing key business indicators (KPIs) for daily management monitoring and decision support.
- Business Monitoring: Real-time display of business operation data, such as sales performance, user activity, system operation status, etc.
- Data Analysis Reports: Integrate multi-dimensional analysis results to form complete data analysis reports.
- Cross-department Collaboration: Create professional dashboards for different departments to promote data sharing and collaboration.
Core Features
- Flexible Layout: Supports drag-and-drop layout design, allowing free adjustment of chart size and position.
- Multiple Components: Integrates rich visualization charts, text, images, filters, and other components.
- Interactive Linkage: Supports data linkage between charts, enabling interactive analysis such as drill-down and filtering.
- Permission Control: Provides fine-grained permission management to ensure data security.
- Multi-terminal Adaptation: Supports viewing on PC and mobile terminals to meet different scenario needs.
Create Dashboard
-
After entering the Guandata BI platform, click
Add Pageon theData Analysispage and selectDashboard.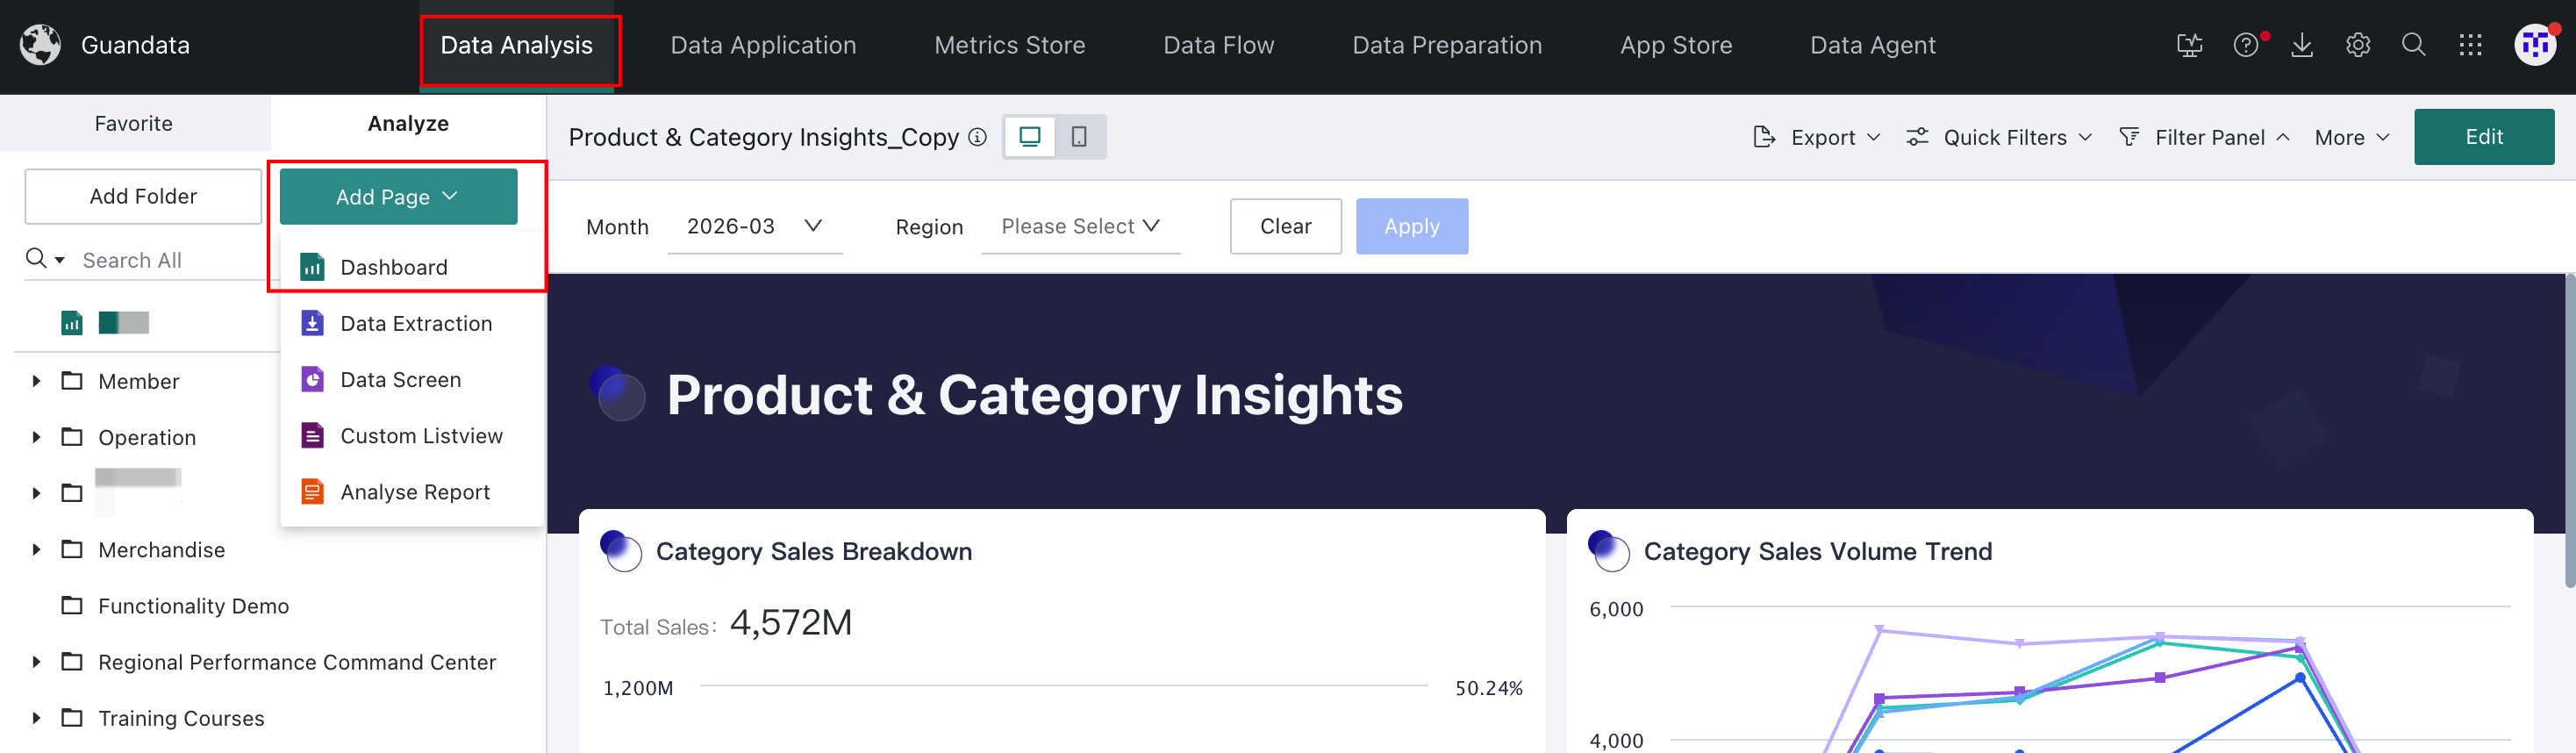
-
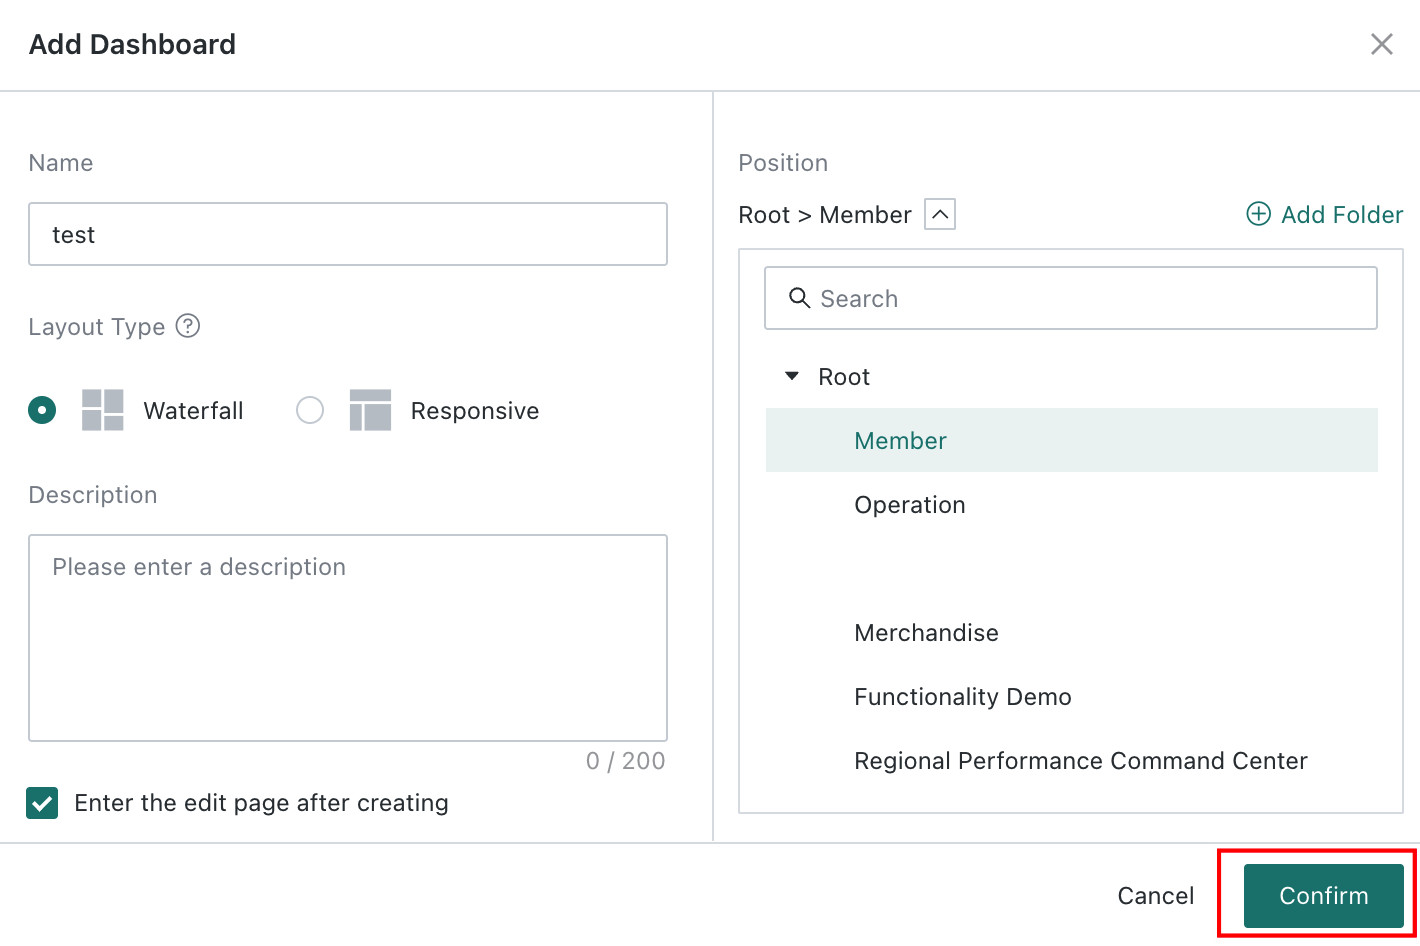
In the
Add Dashboarddialog, fill in the following information:- Dashboard Name: Set a clear, descriptive name.
- Folder: Select the location where the dashboard will be saved. If the desired folder is not in the directory, click
Add Folderon the right to create a subfolder in the current folder. (Can be moved after creation.) - Layout Type: Supports two layout modes:
WaterfallandResponsive. - Waterfall: Traditional page layout, suitable for pages with more vertically extended content.
- Responsive: Dashboard content can adapt to the browser window size, suitable for single-page displays that are complete and compact.
- Description: Optional, add a brief description of the dashboard.
-
Select
Enter the edit page after creating, then clickConfirmto enter the dashboard editing interface.If not checked, the new page will be automatically generated in the folder.
Add Components
Add Cards
-
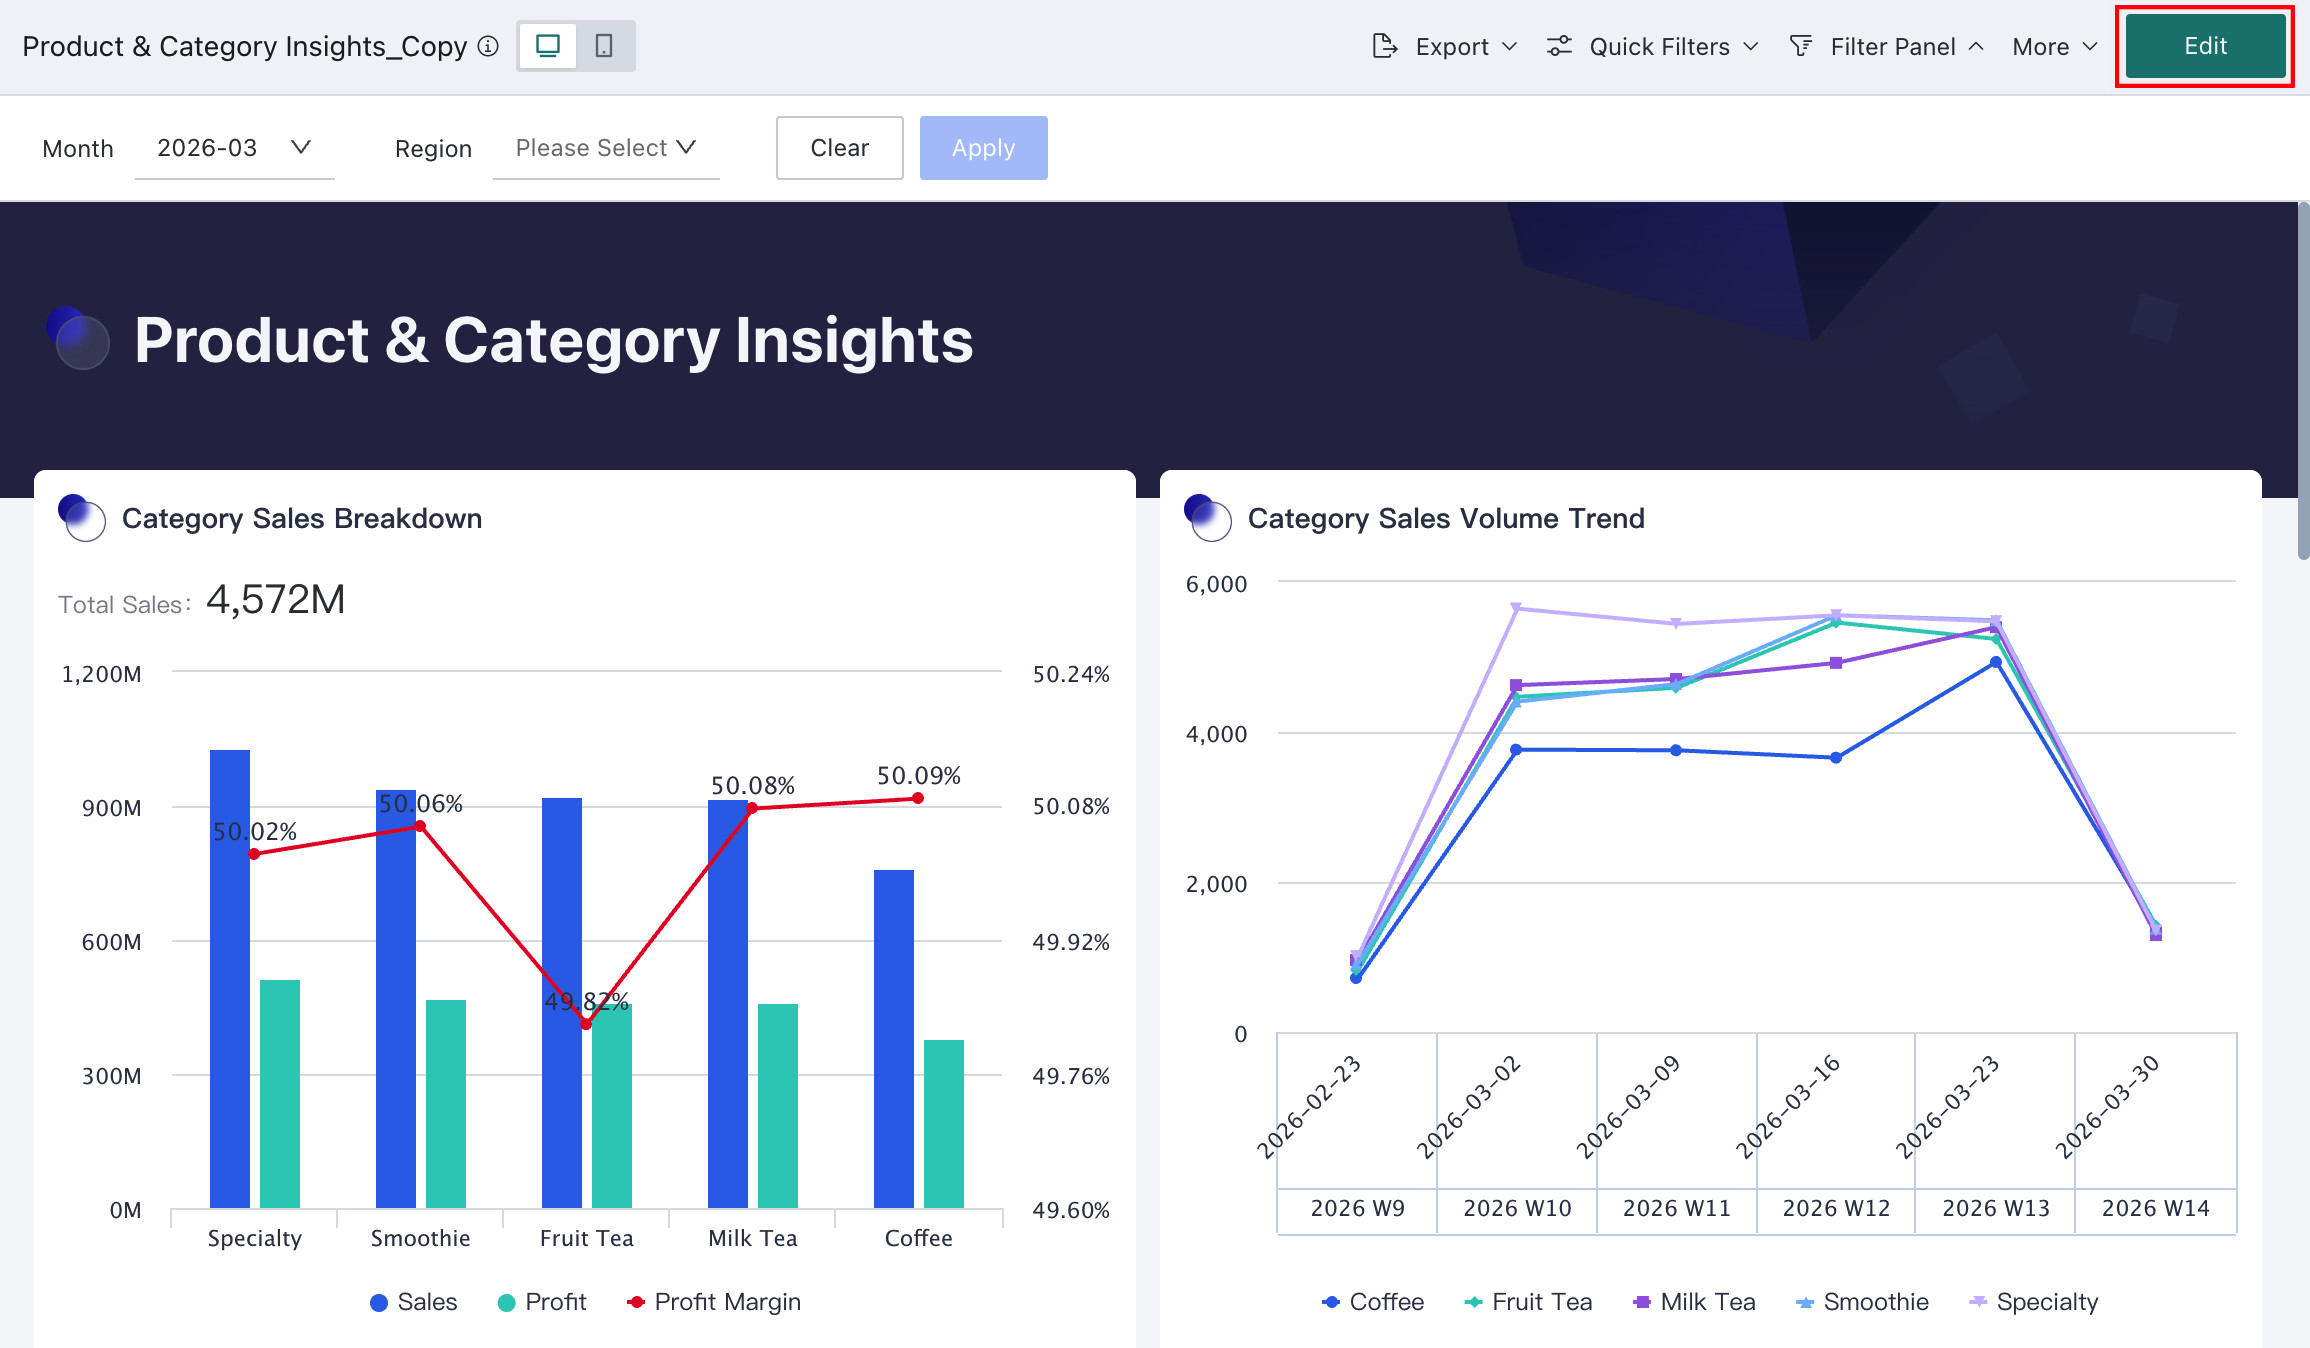
Click "Edit" in the upper right corner of the dashboard to enter the editing interface.
-
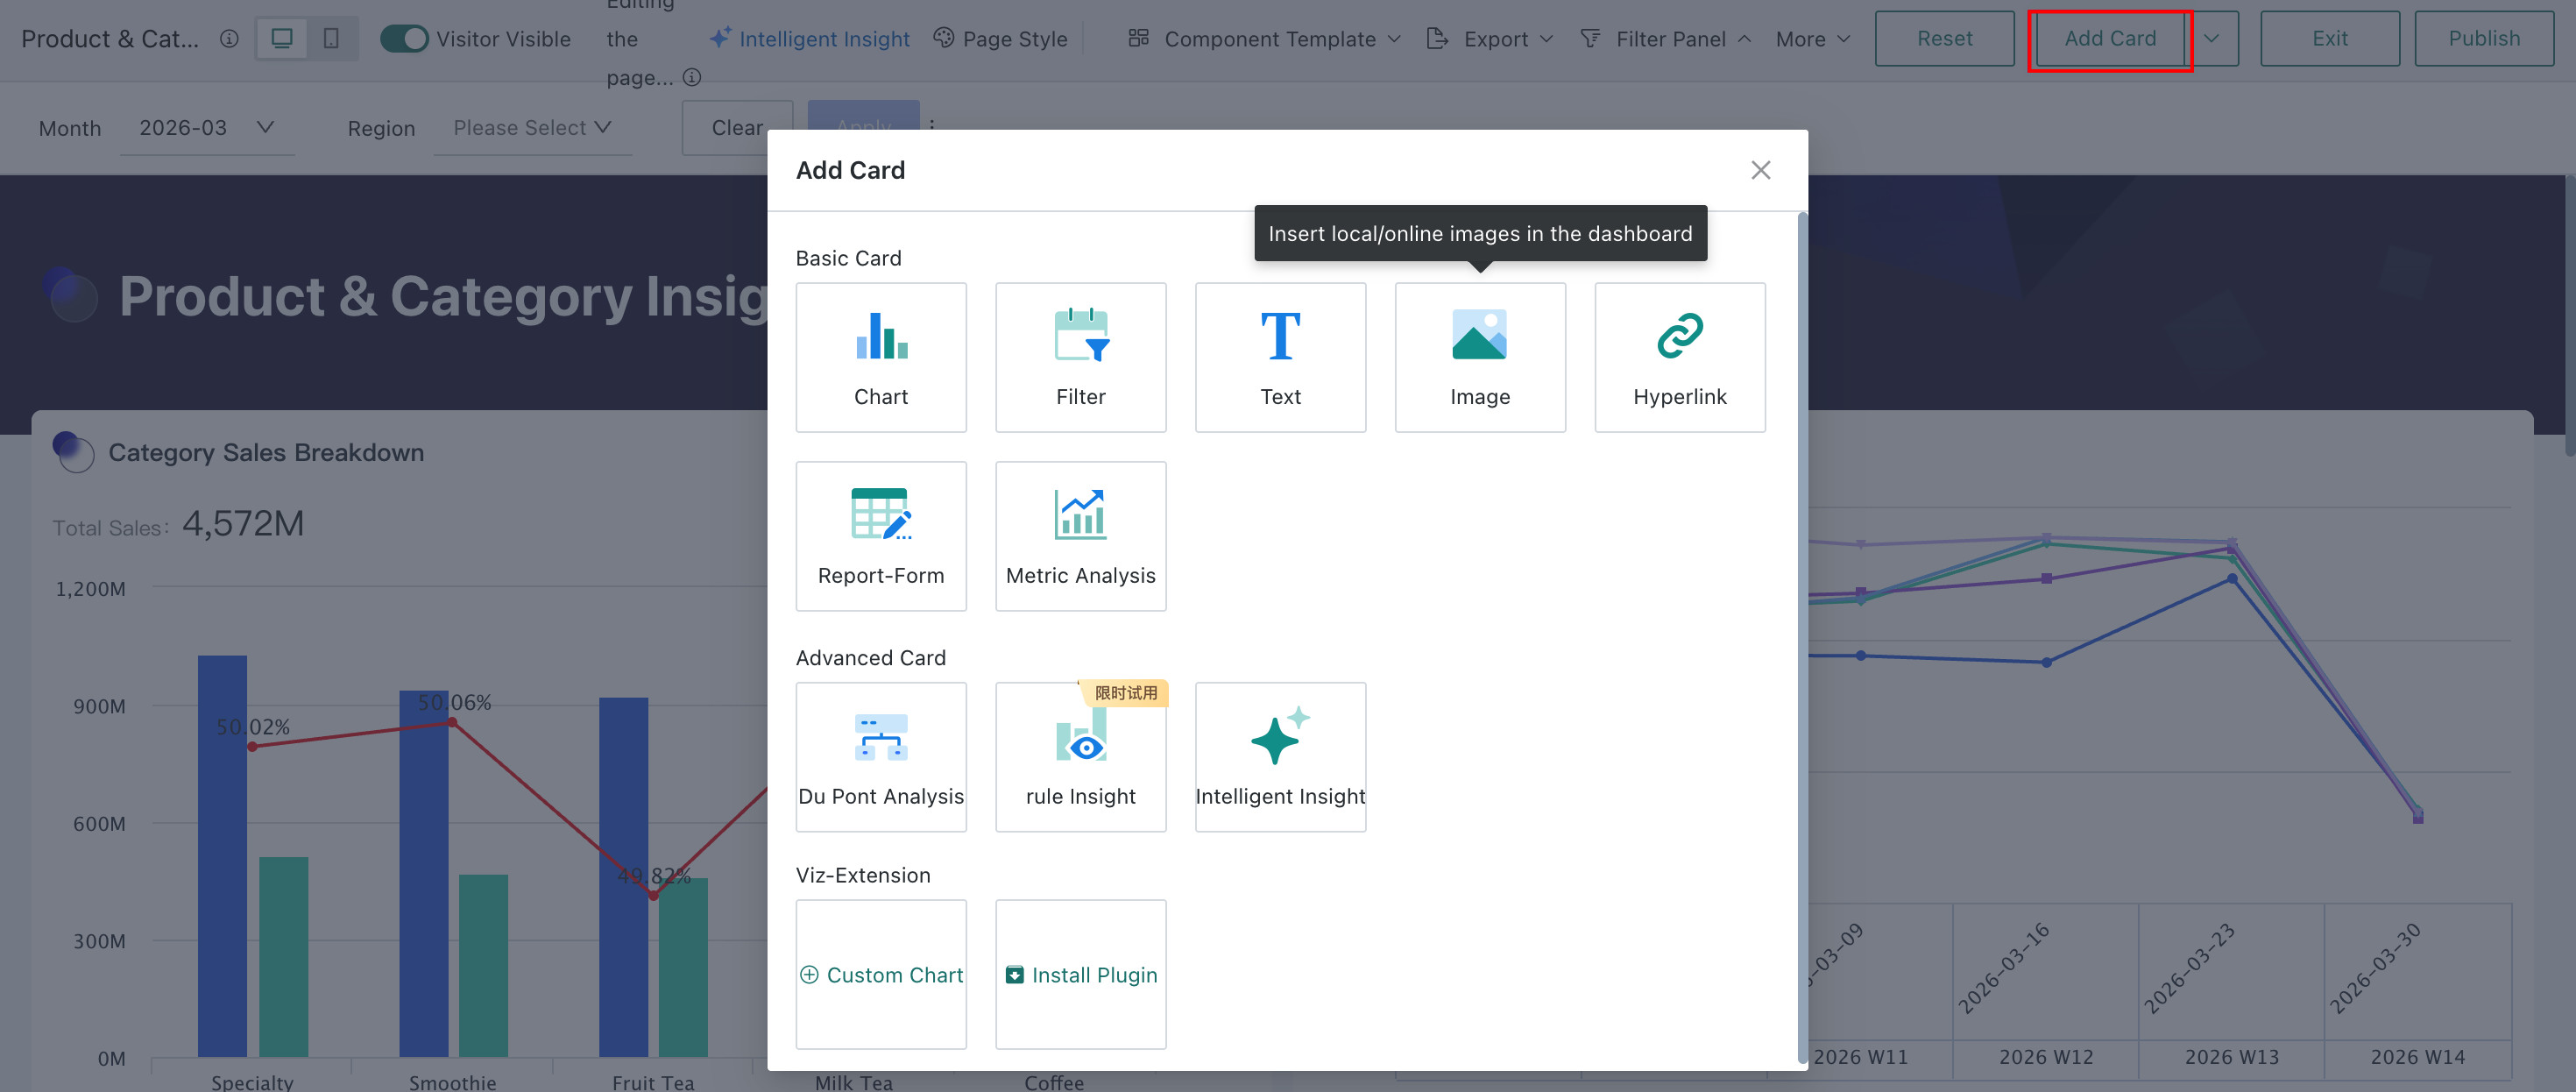
Click "New Card > Visualization Chart or Other Cards" to create the required card, and click "Publish" to publish.
-
Content will be displayed in the dashboard in card form, and position and size can be adjusted by dragging.
Add Filters
The filter function of Guandata BI allows users to flexibly adjust filtering conditions when viewing the dashboard, achieving simultaneous filtering of multiple components.
-
Method 1: Enter the dashboard editing interface, select "Filter Panel" in the upper navigation bar, and click "Tap to create" or "Add".

-
Method 2: Click "Add Card > Filter",
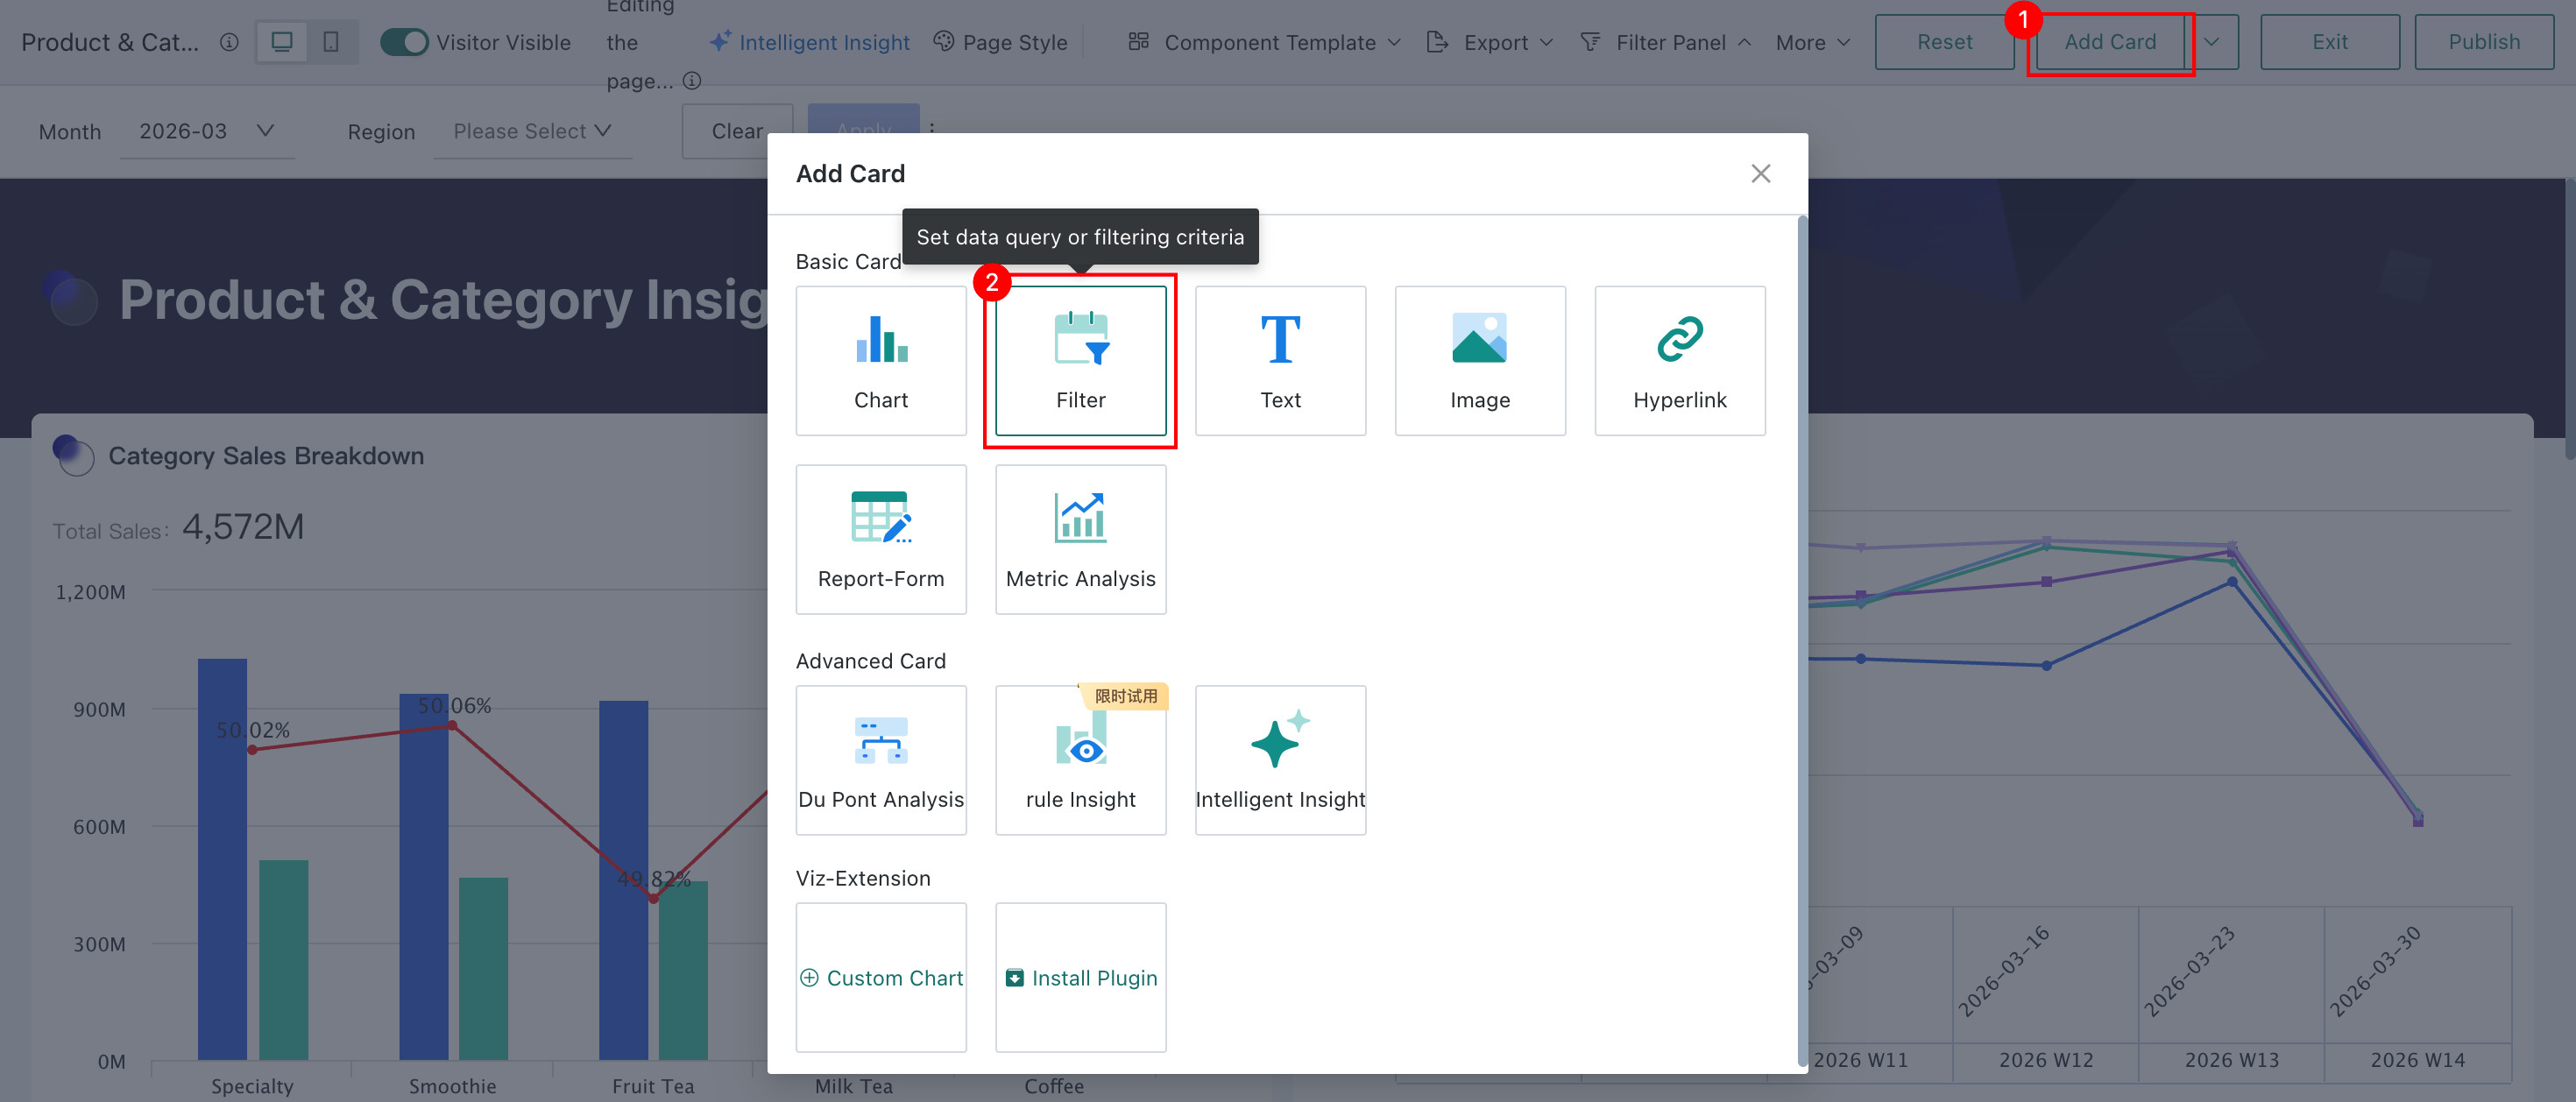
After selecting the appropriate filter, perform "Property Configuration" and "Linkage" to add the filter.
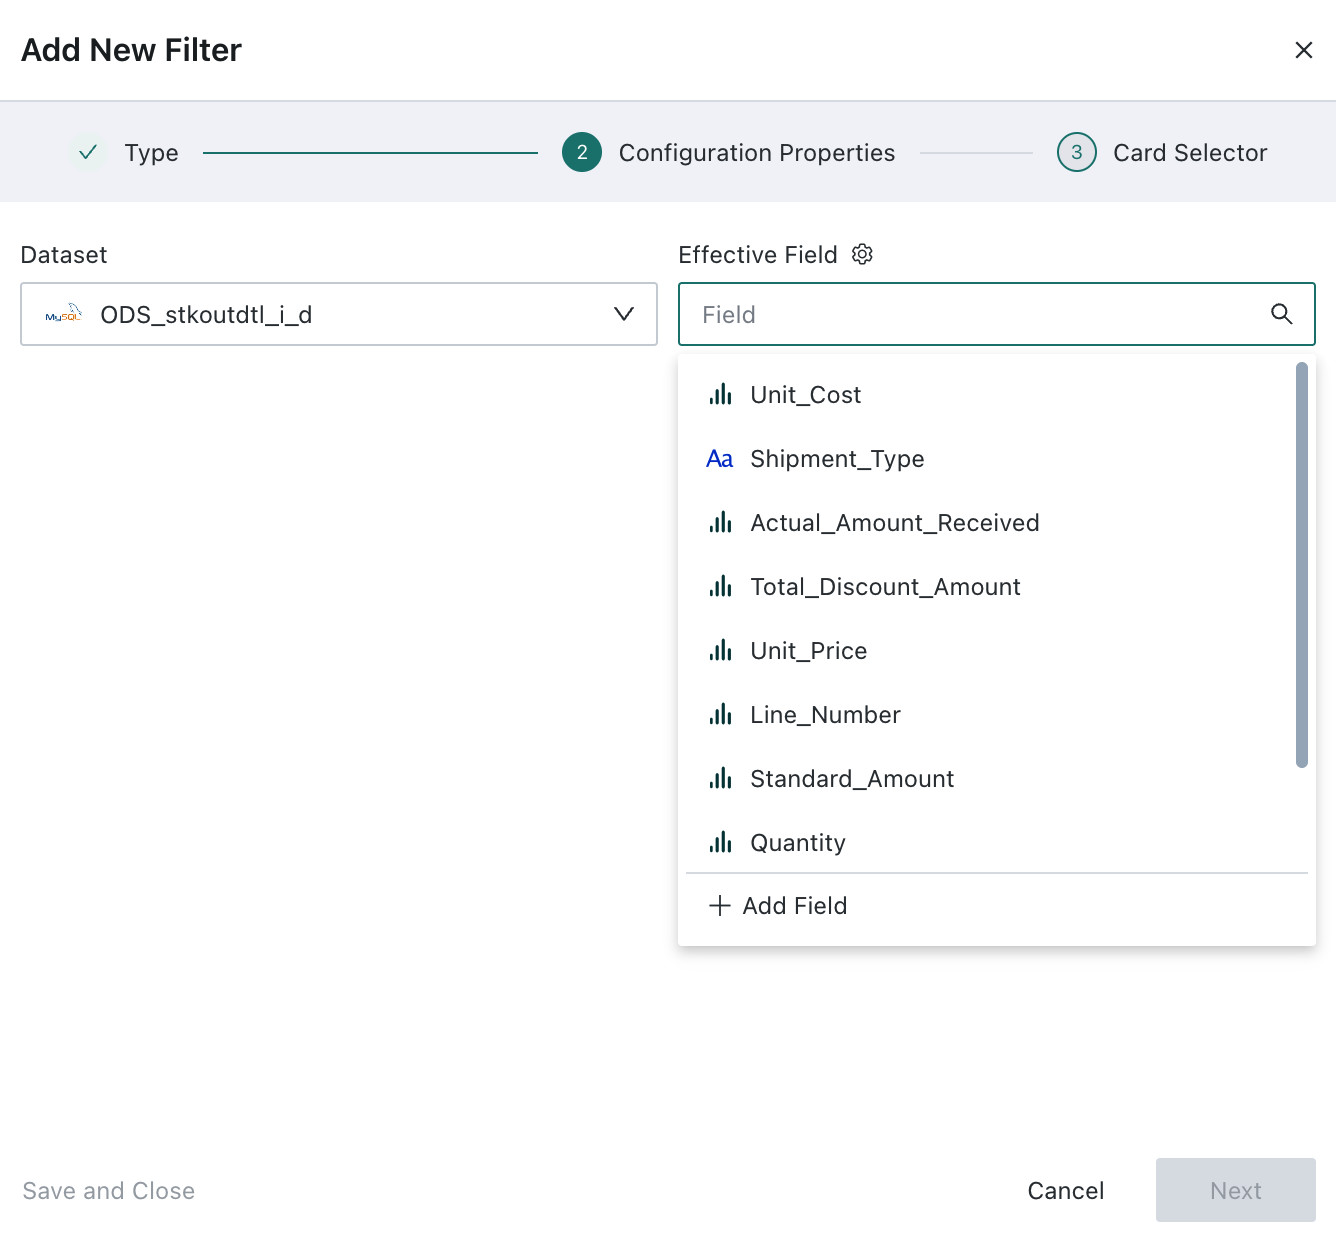
Guandata BI has 8 types of built-in filter components, including selection filters, condition filters, date filters, and range filters. For detailed configuration procedures, please refer to Page Filter.
Configure Page Style
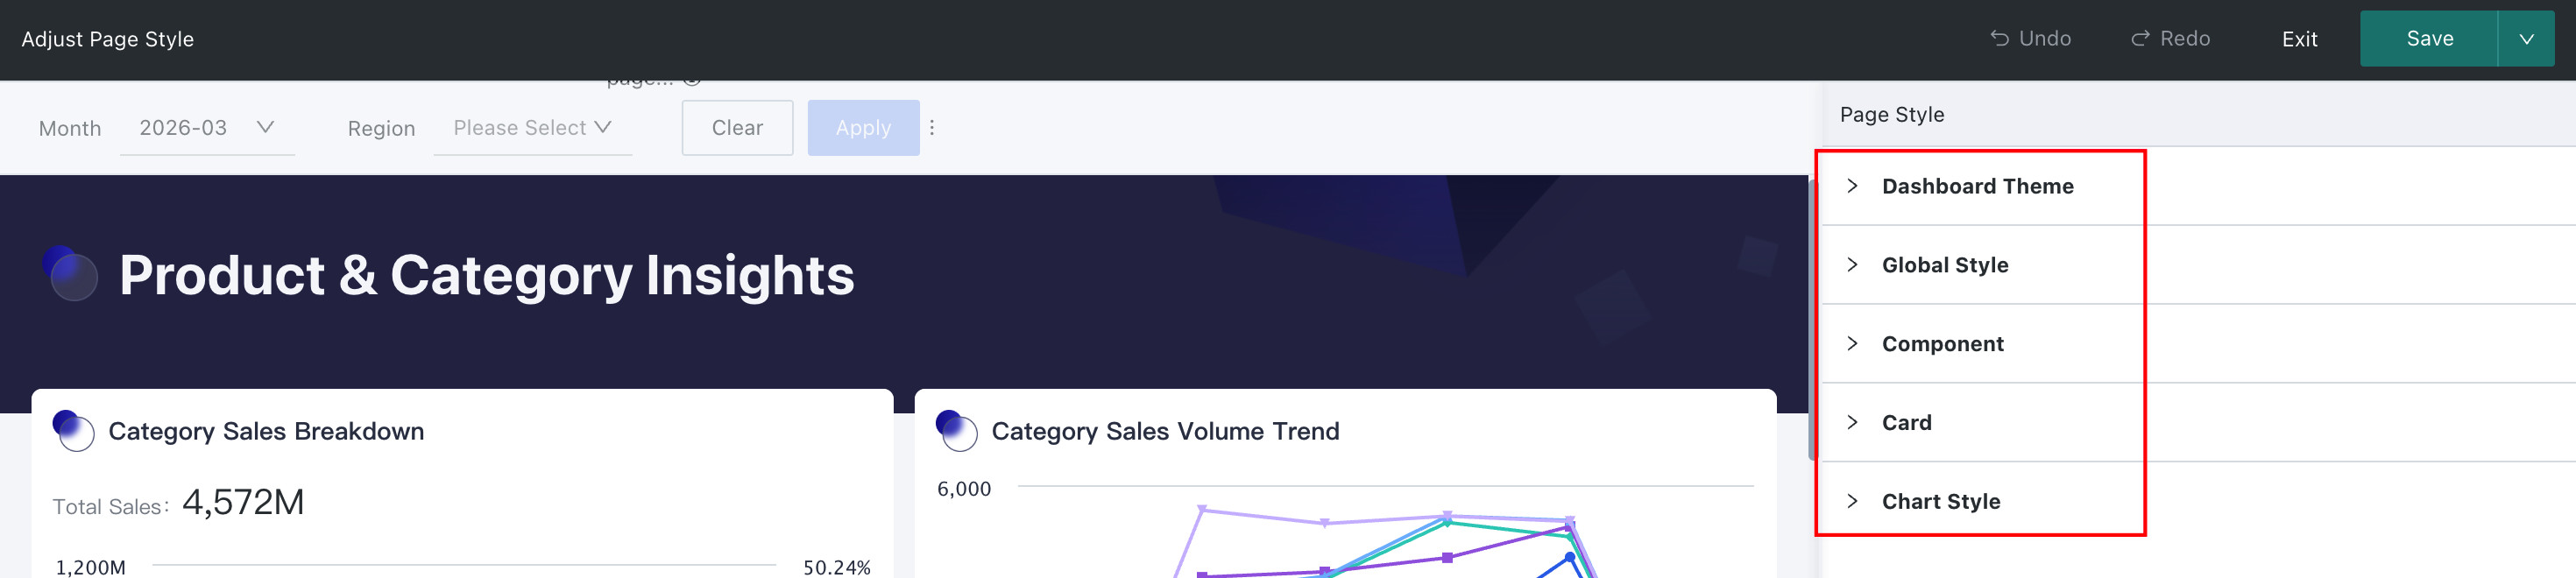
-
In the editing interface, click the "Page Style" button in the upper navigation bar.
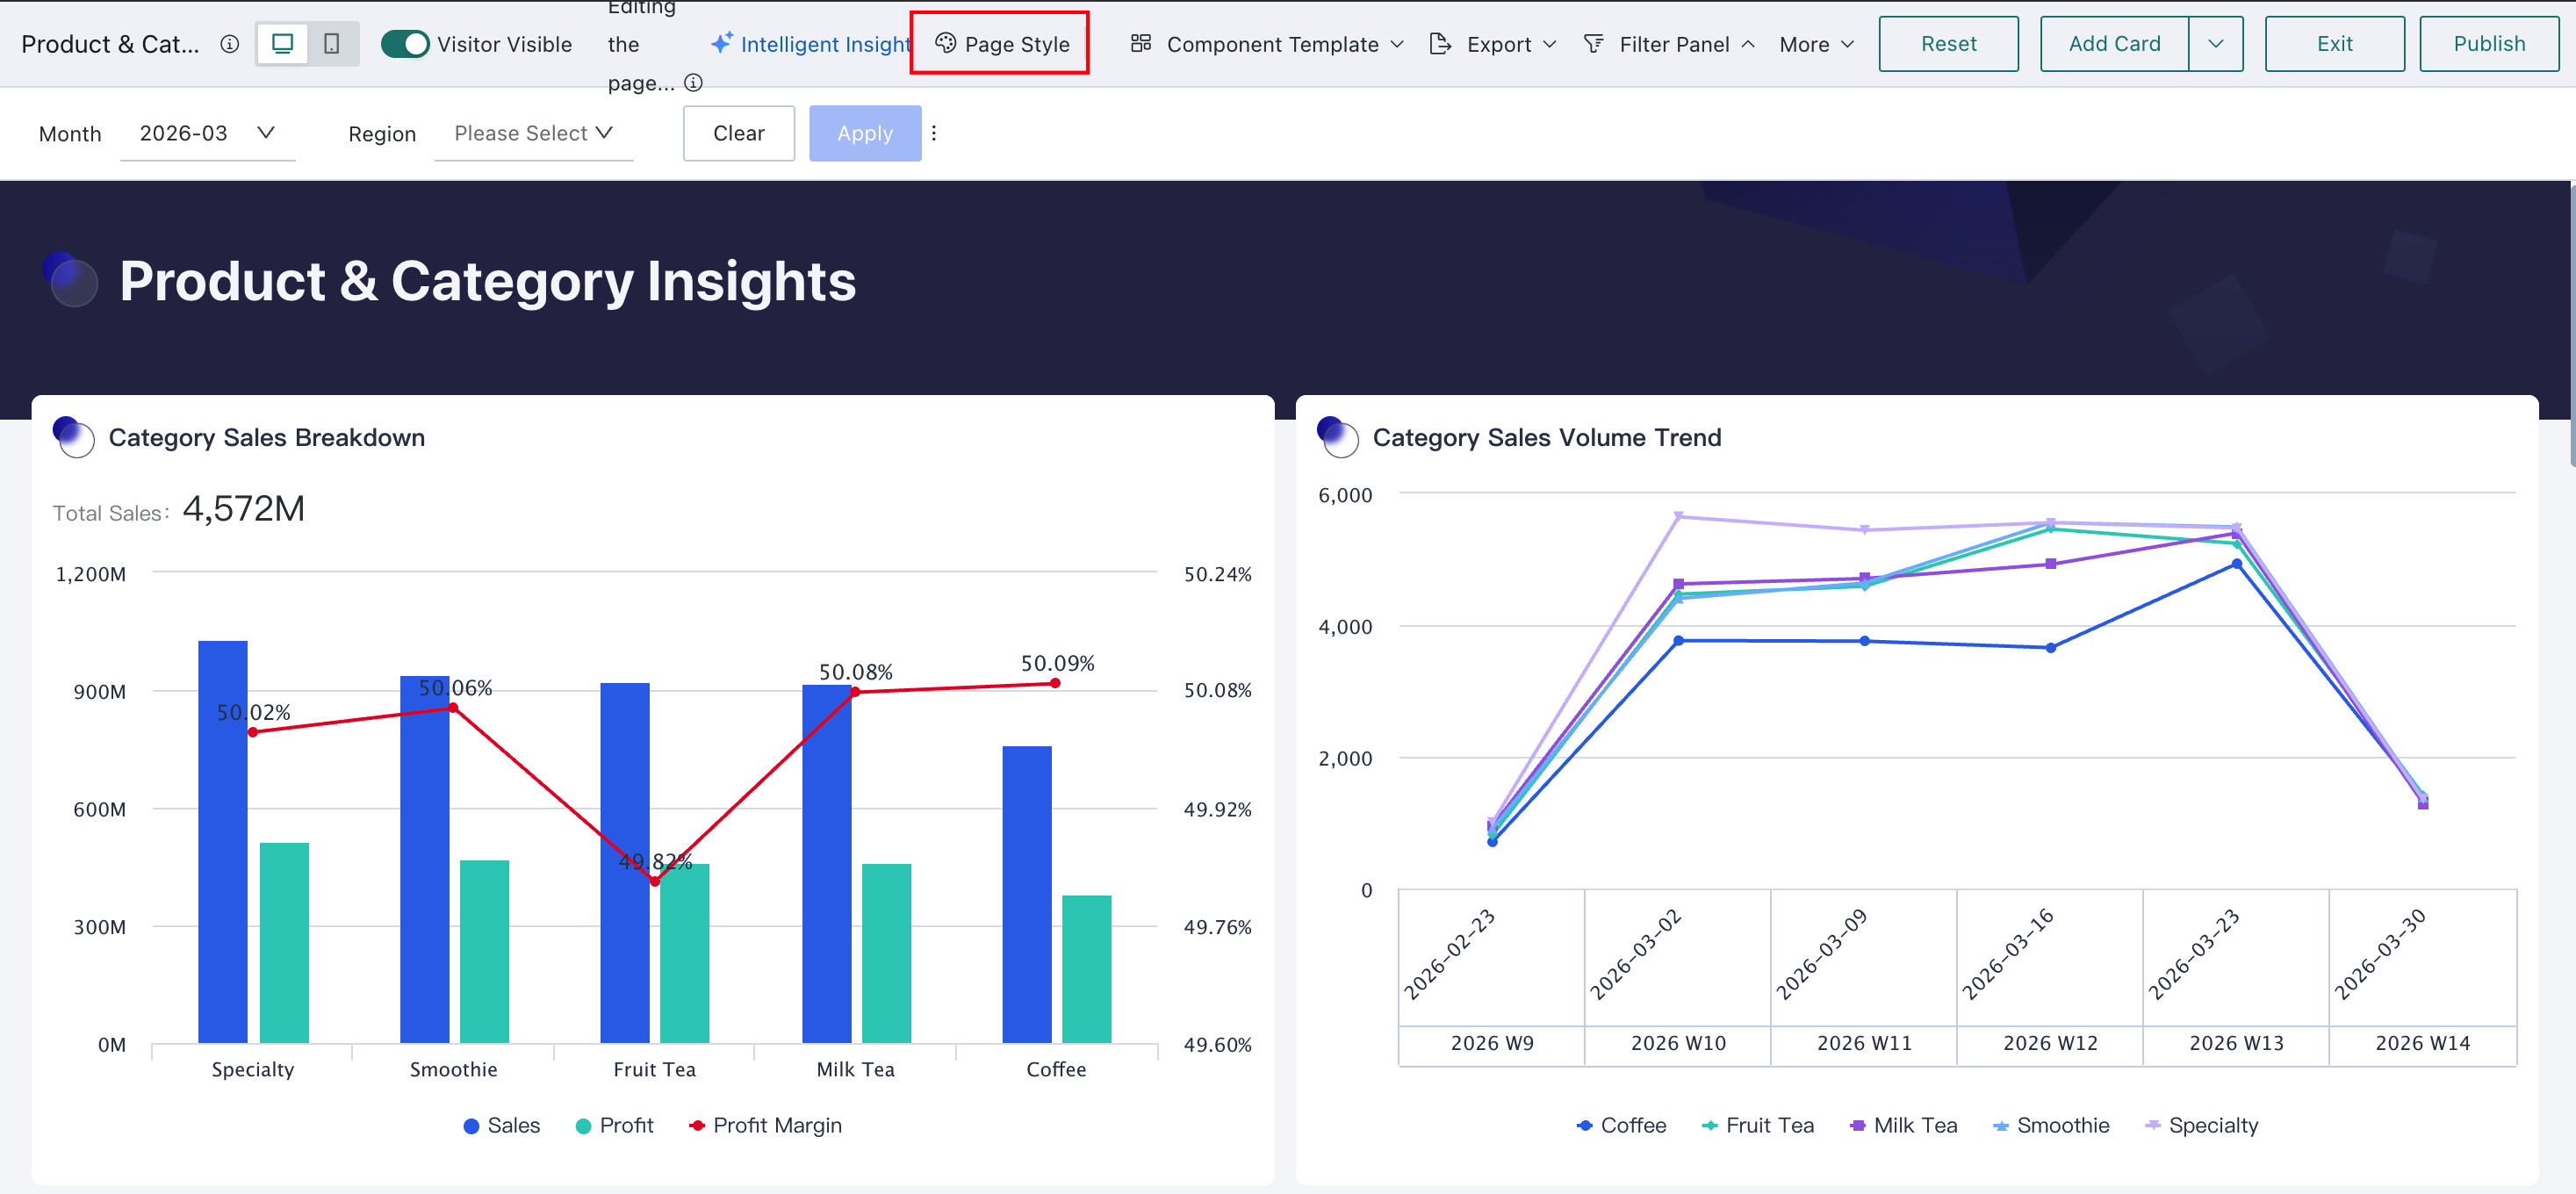
-
Select the options to be adjusted. You can adjust the dashboard theme, global style, dashboard component style, cards, icon properties, etc. For details, see Page Style.
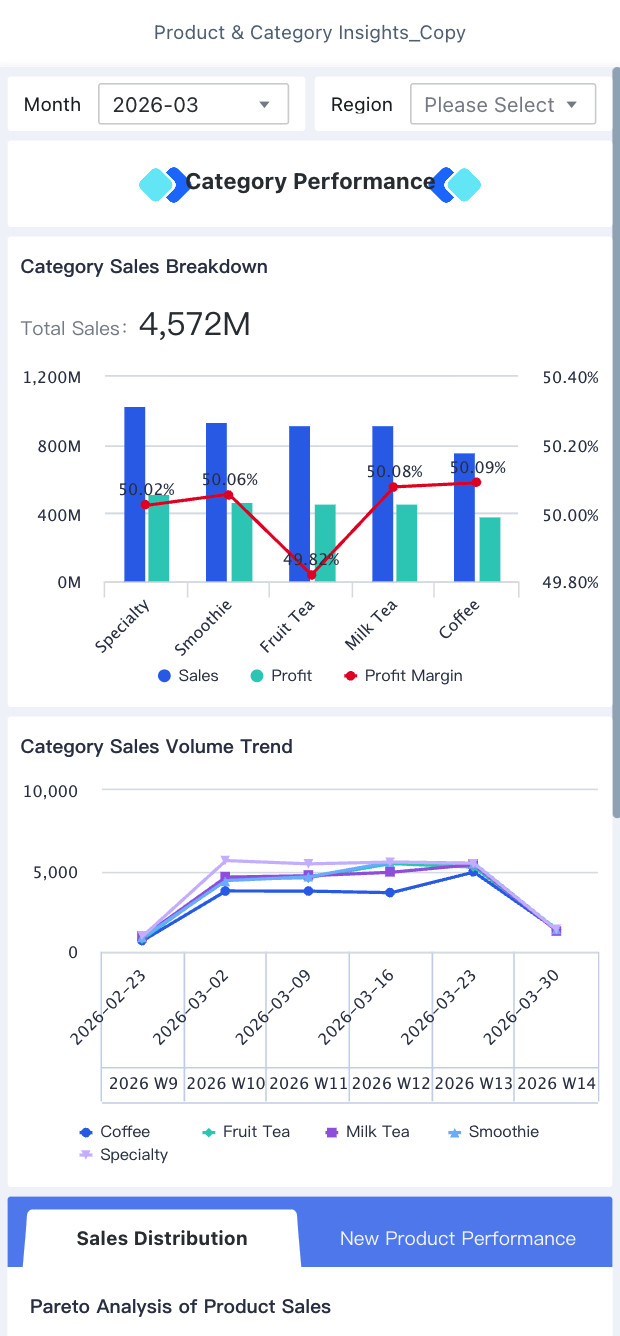
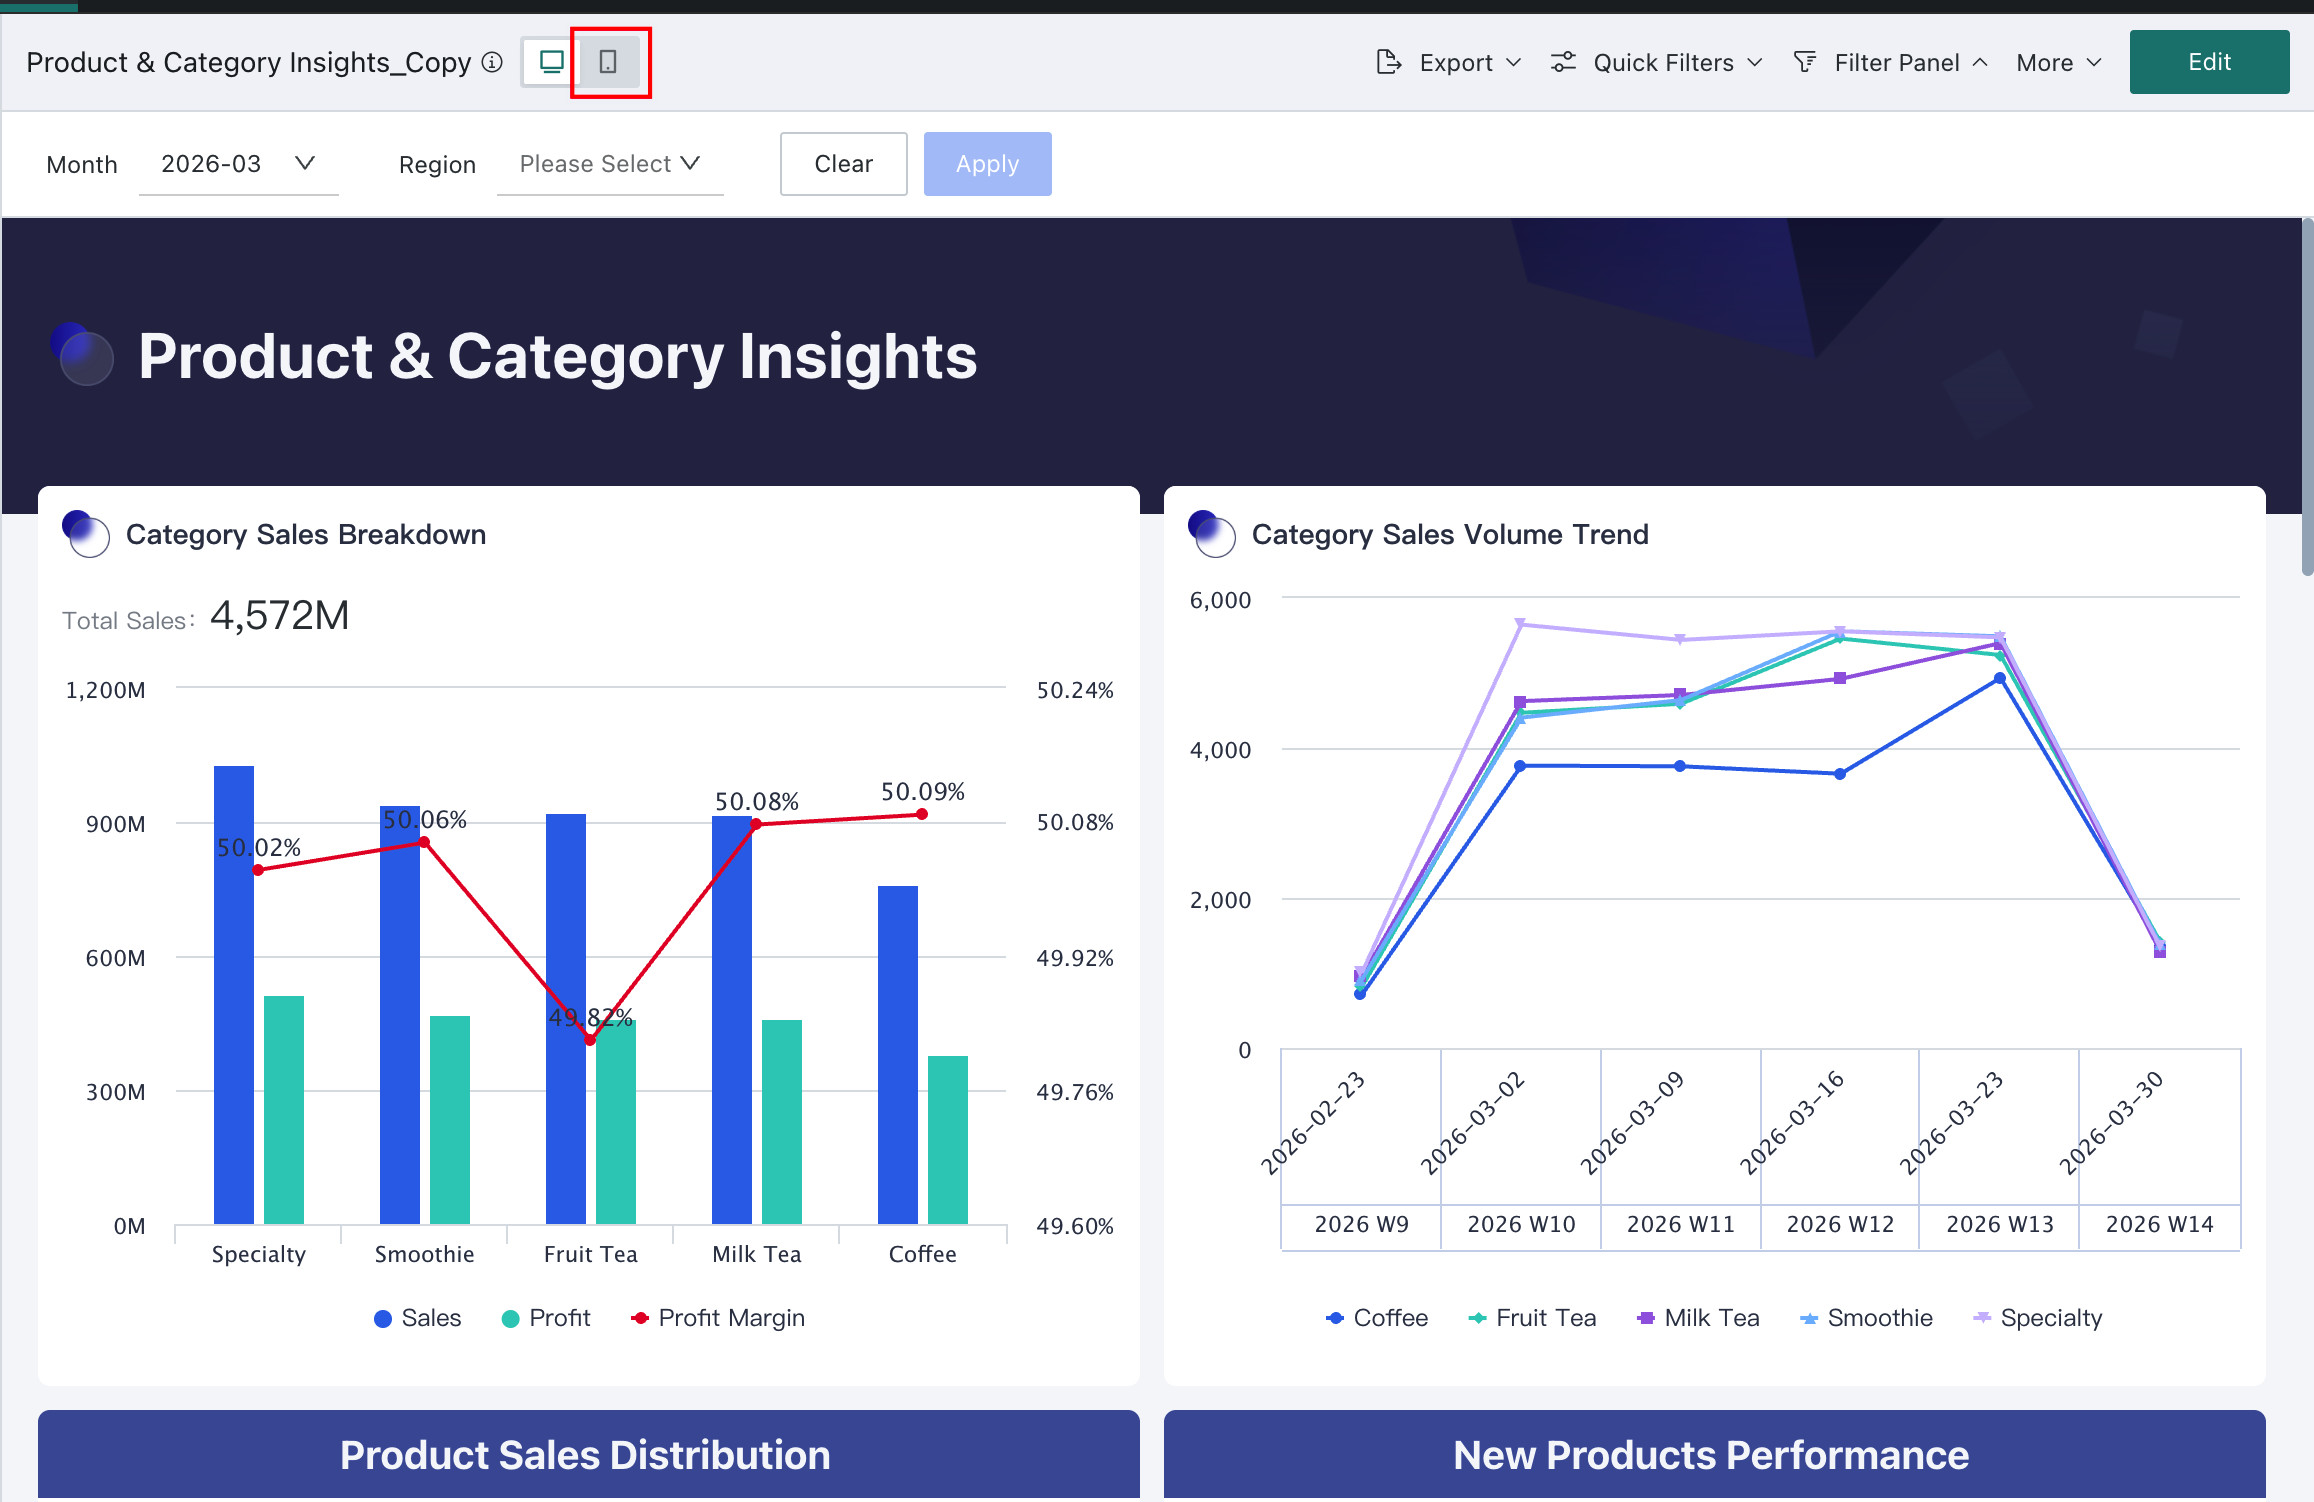
Configure Mobile
-
Enter the mobile interface: In the editing interface or published interface, click the "Mobile" button in the upper left corner to complete the mobile switch.
-
The system defaults to maintaining the historical layout. If you need to change it, click the "Edit" button to enter the mobile editing interface.
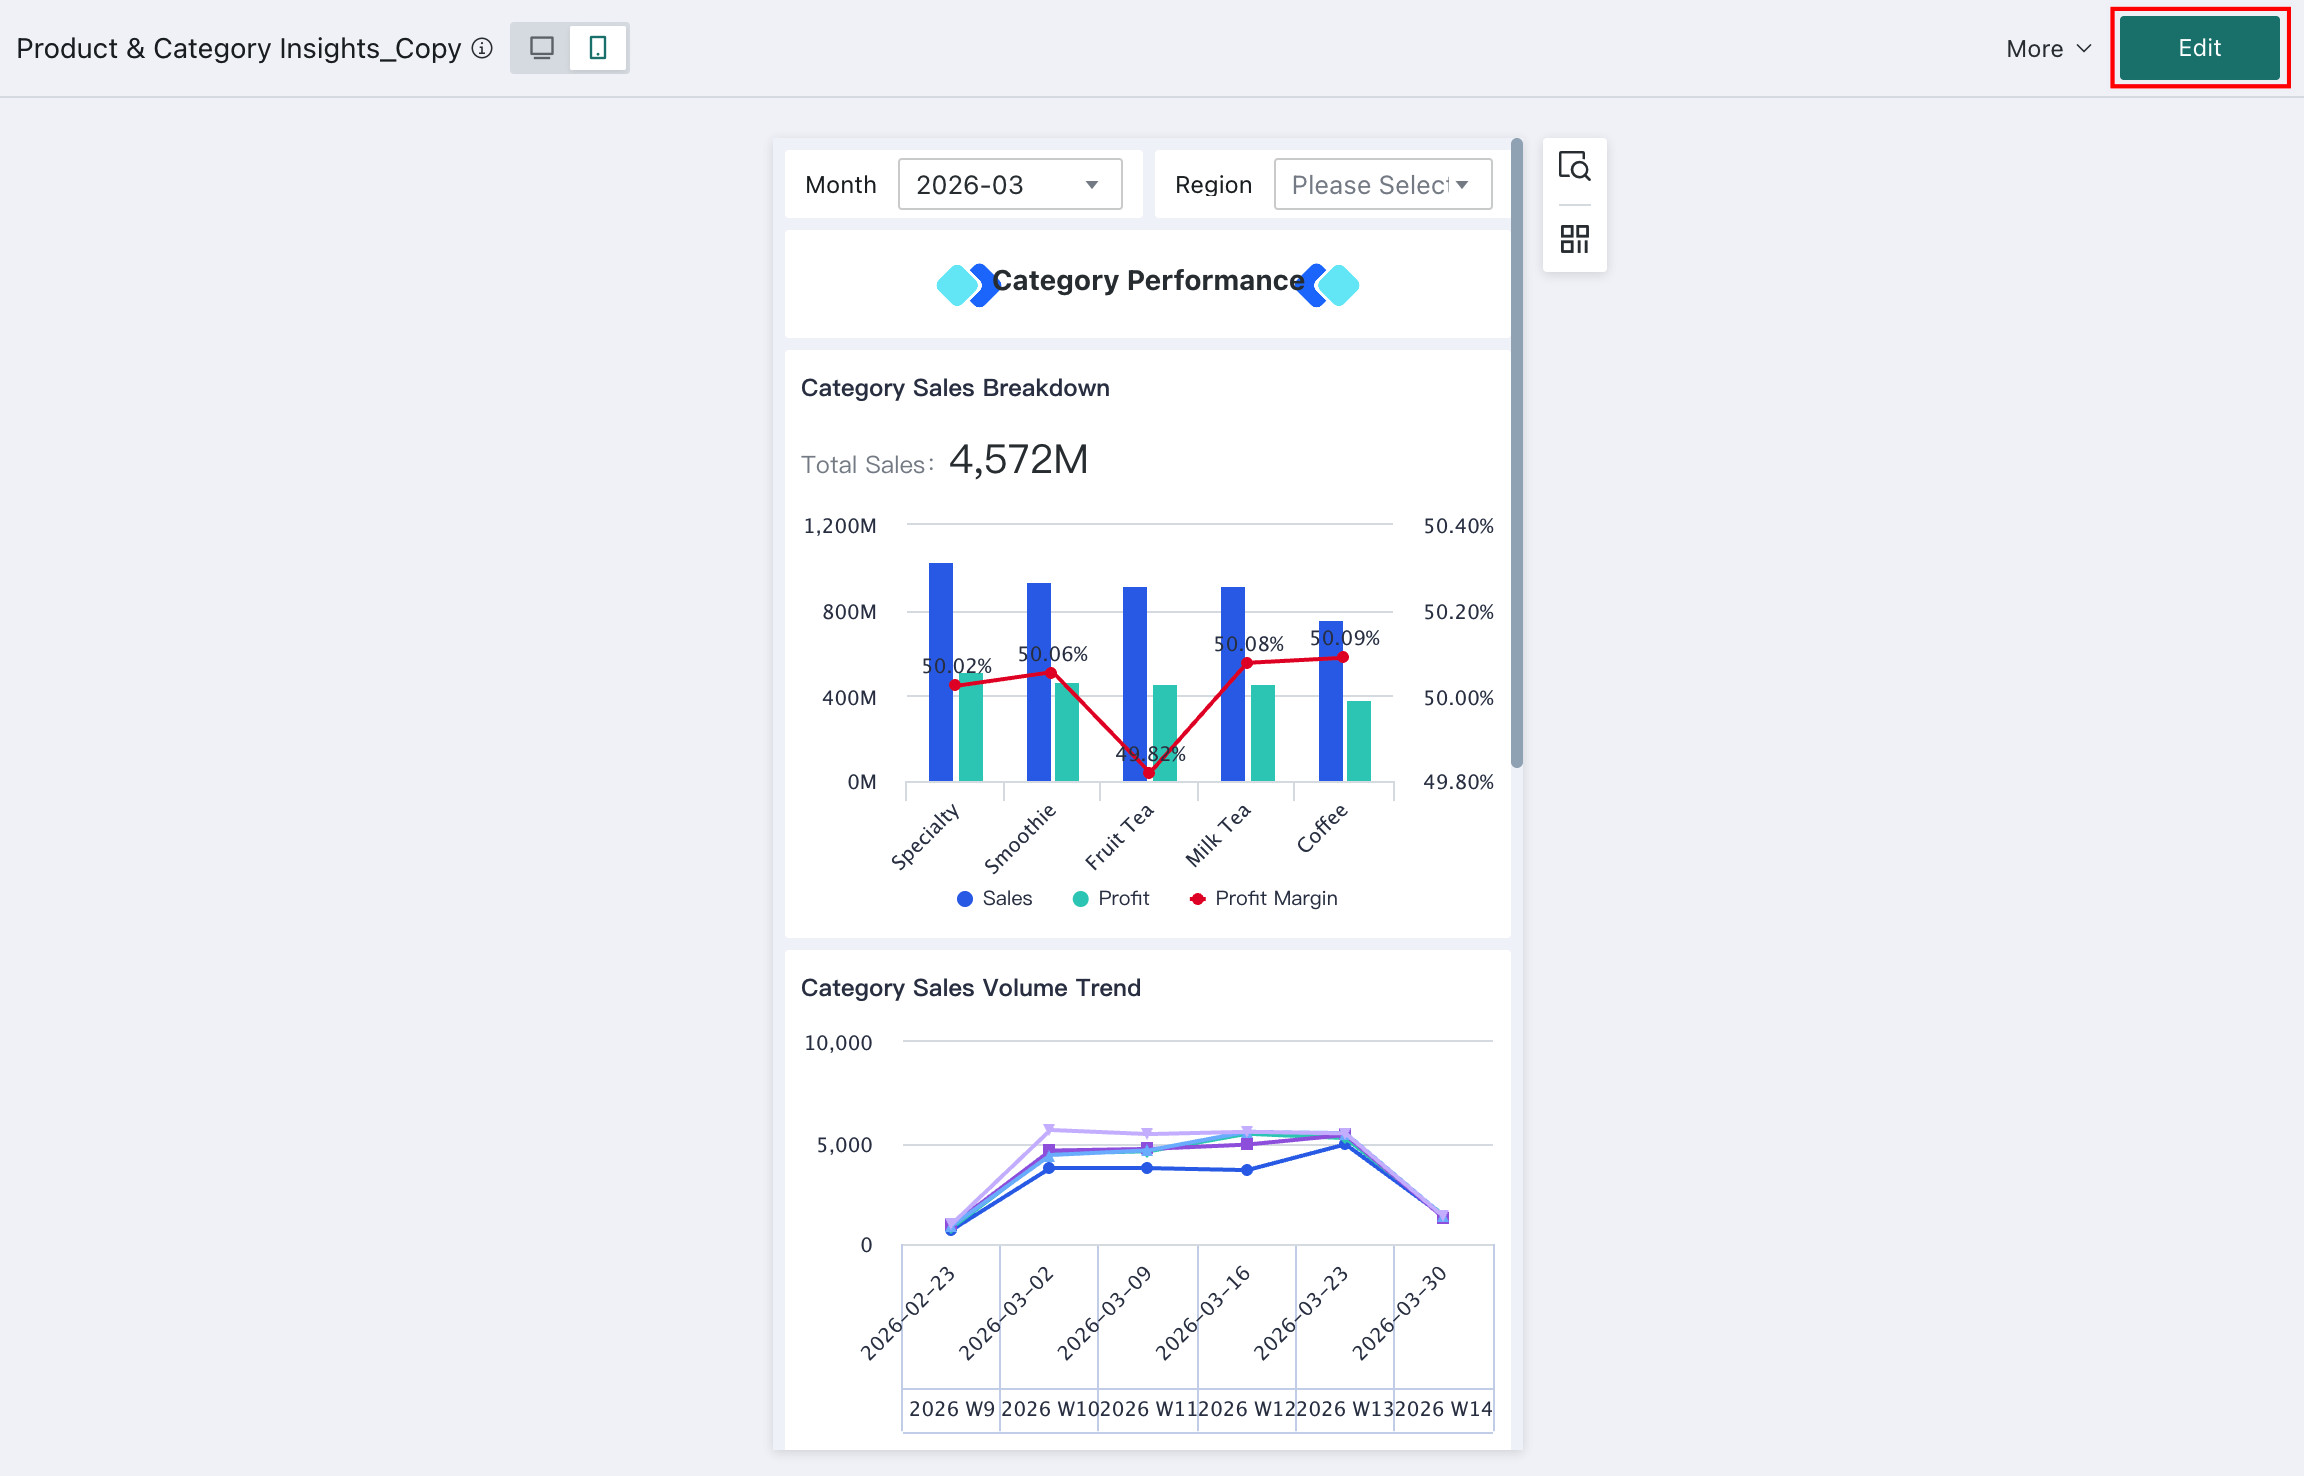
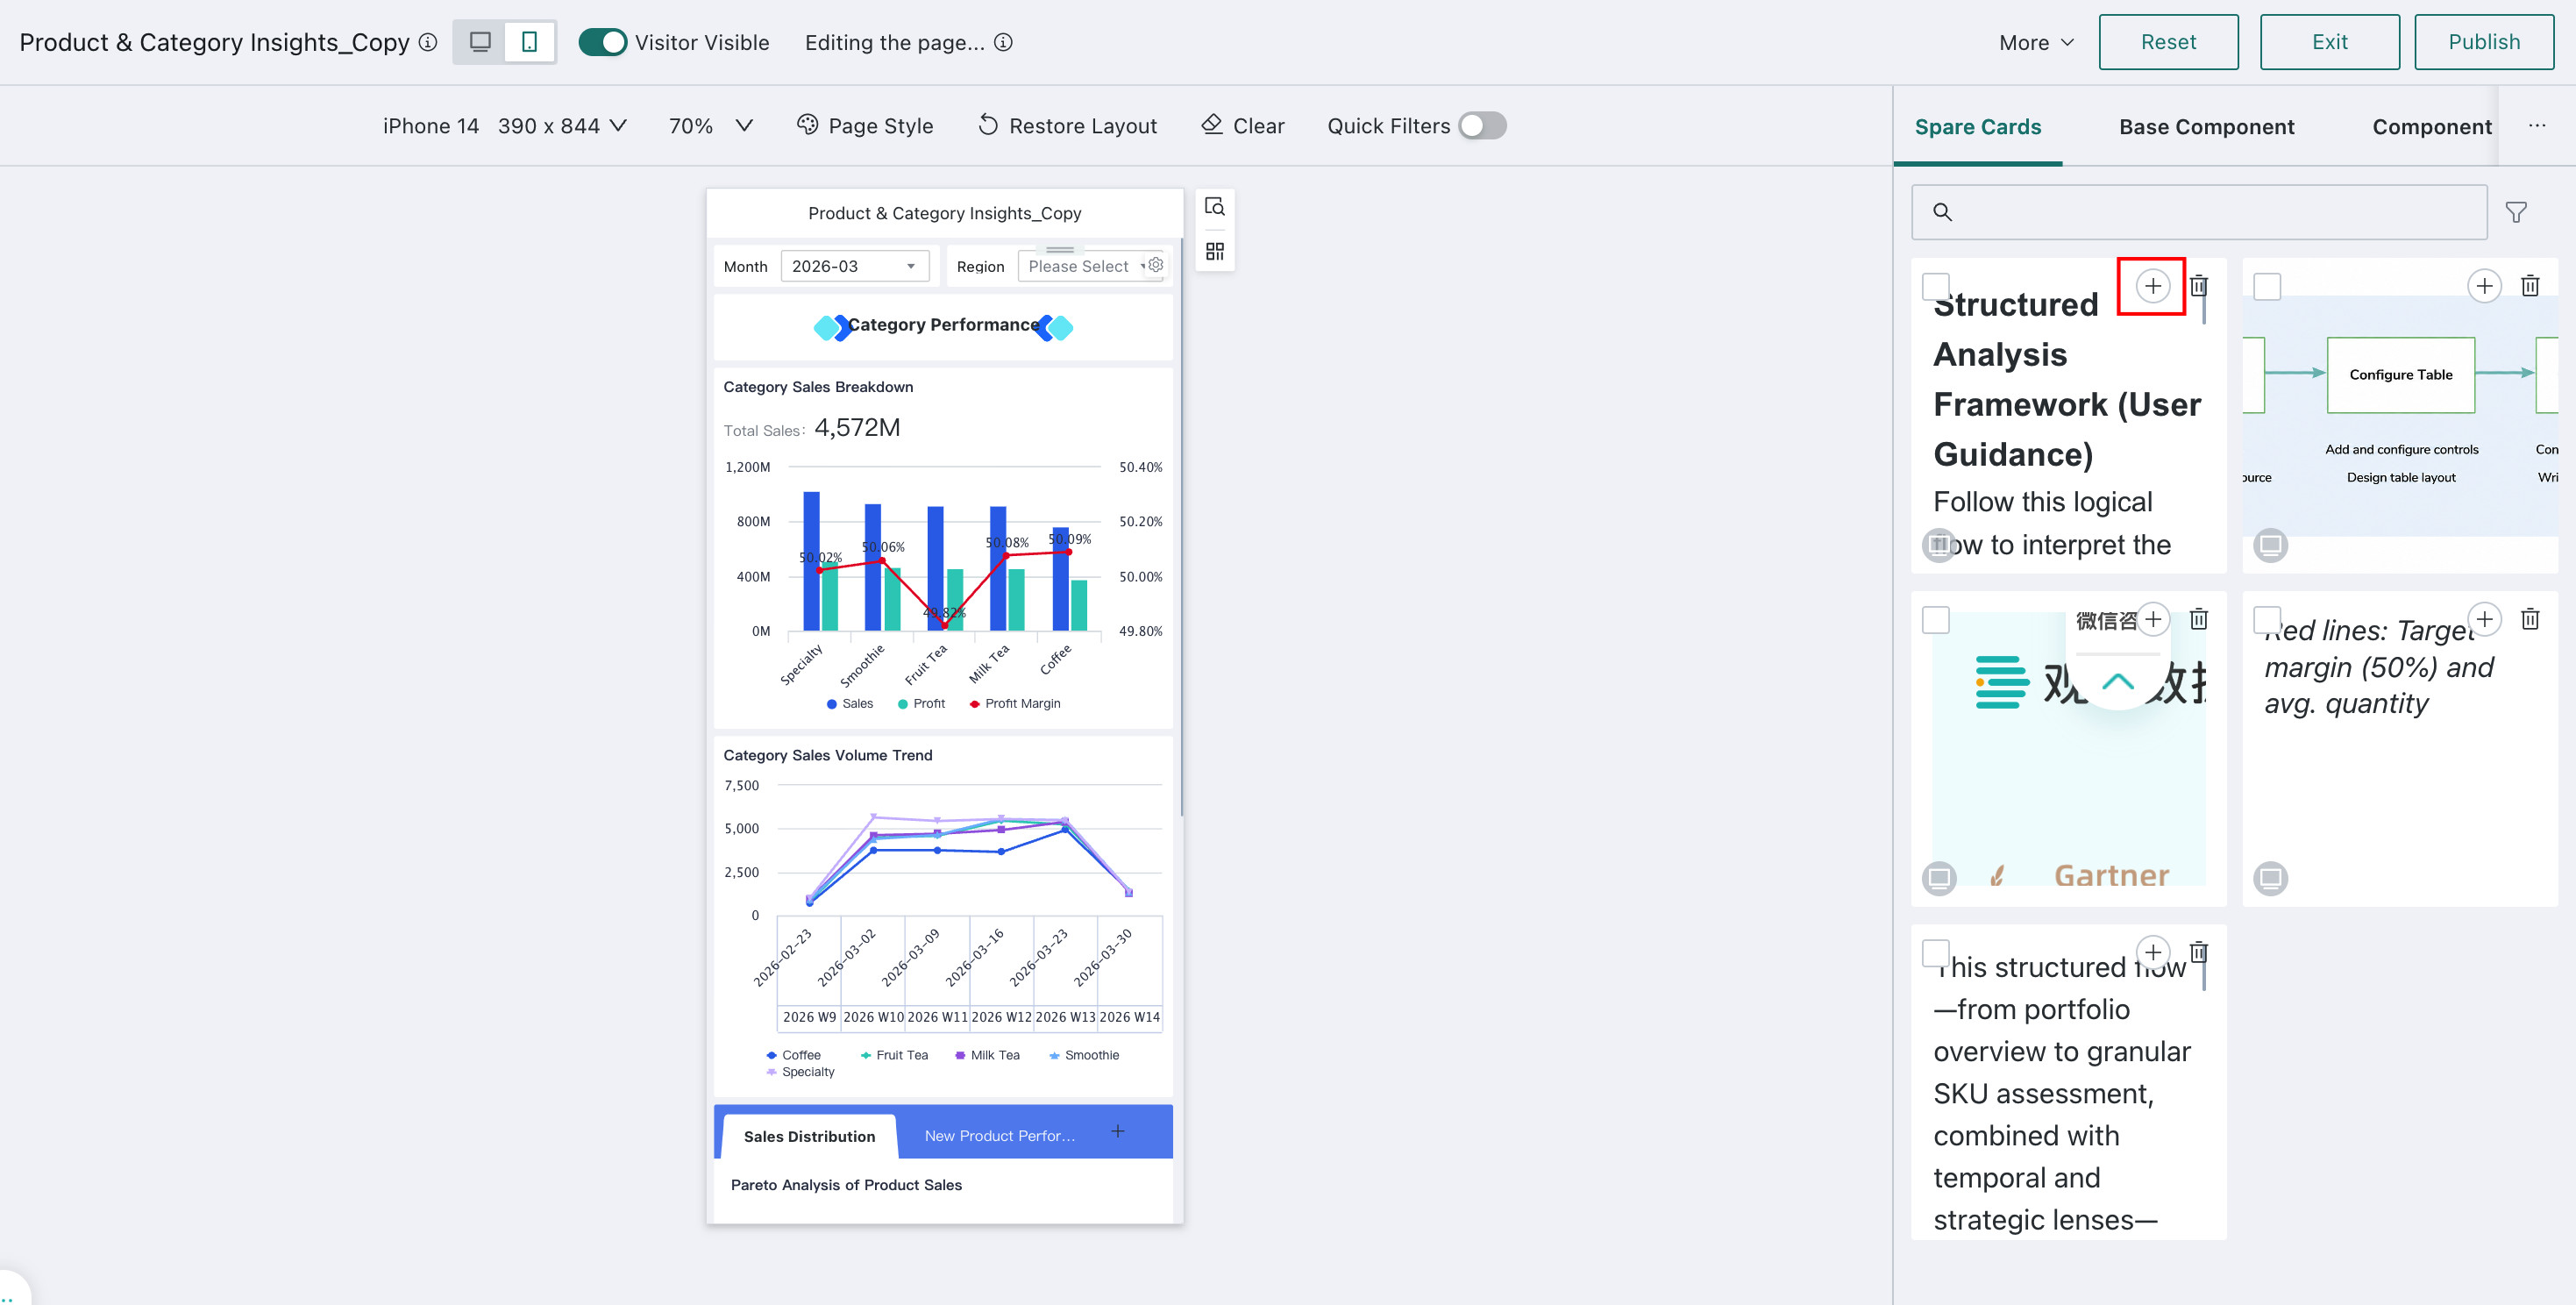
-
In the "Card Pool" on the right, click the "+" in the upper right corner of the desired card to add it to the mobile dashboard.
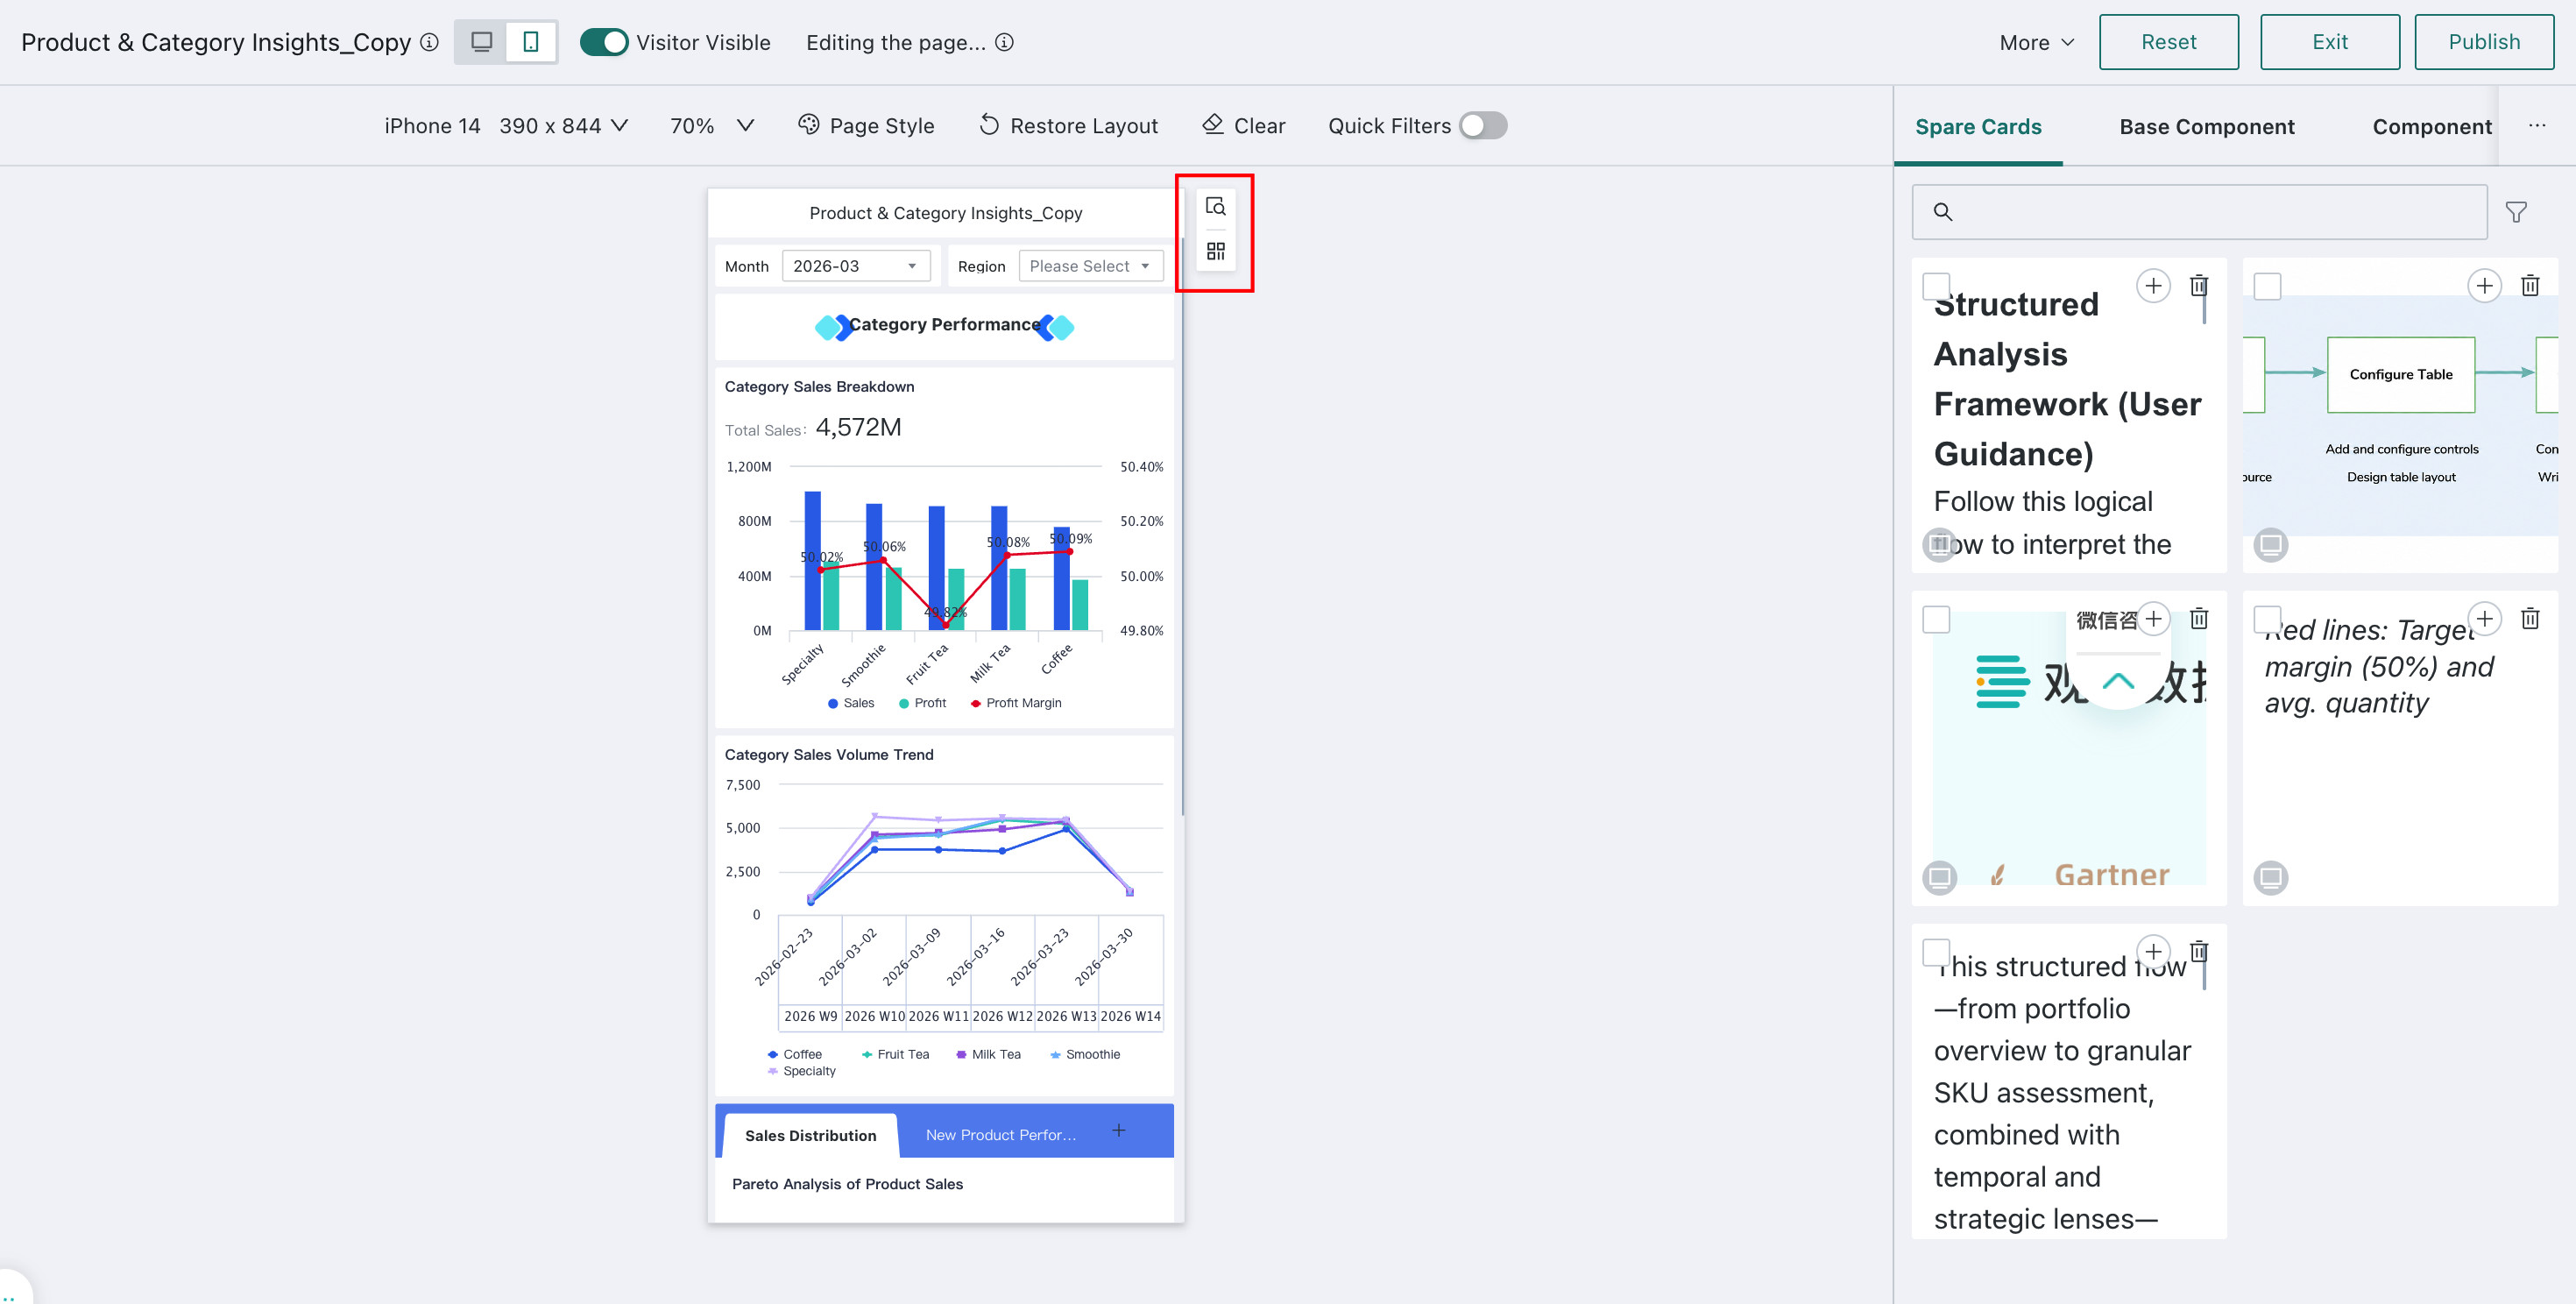
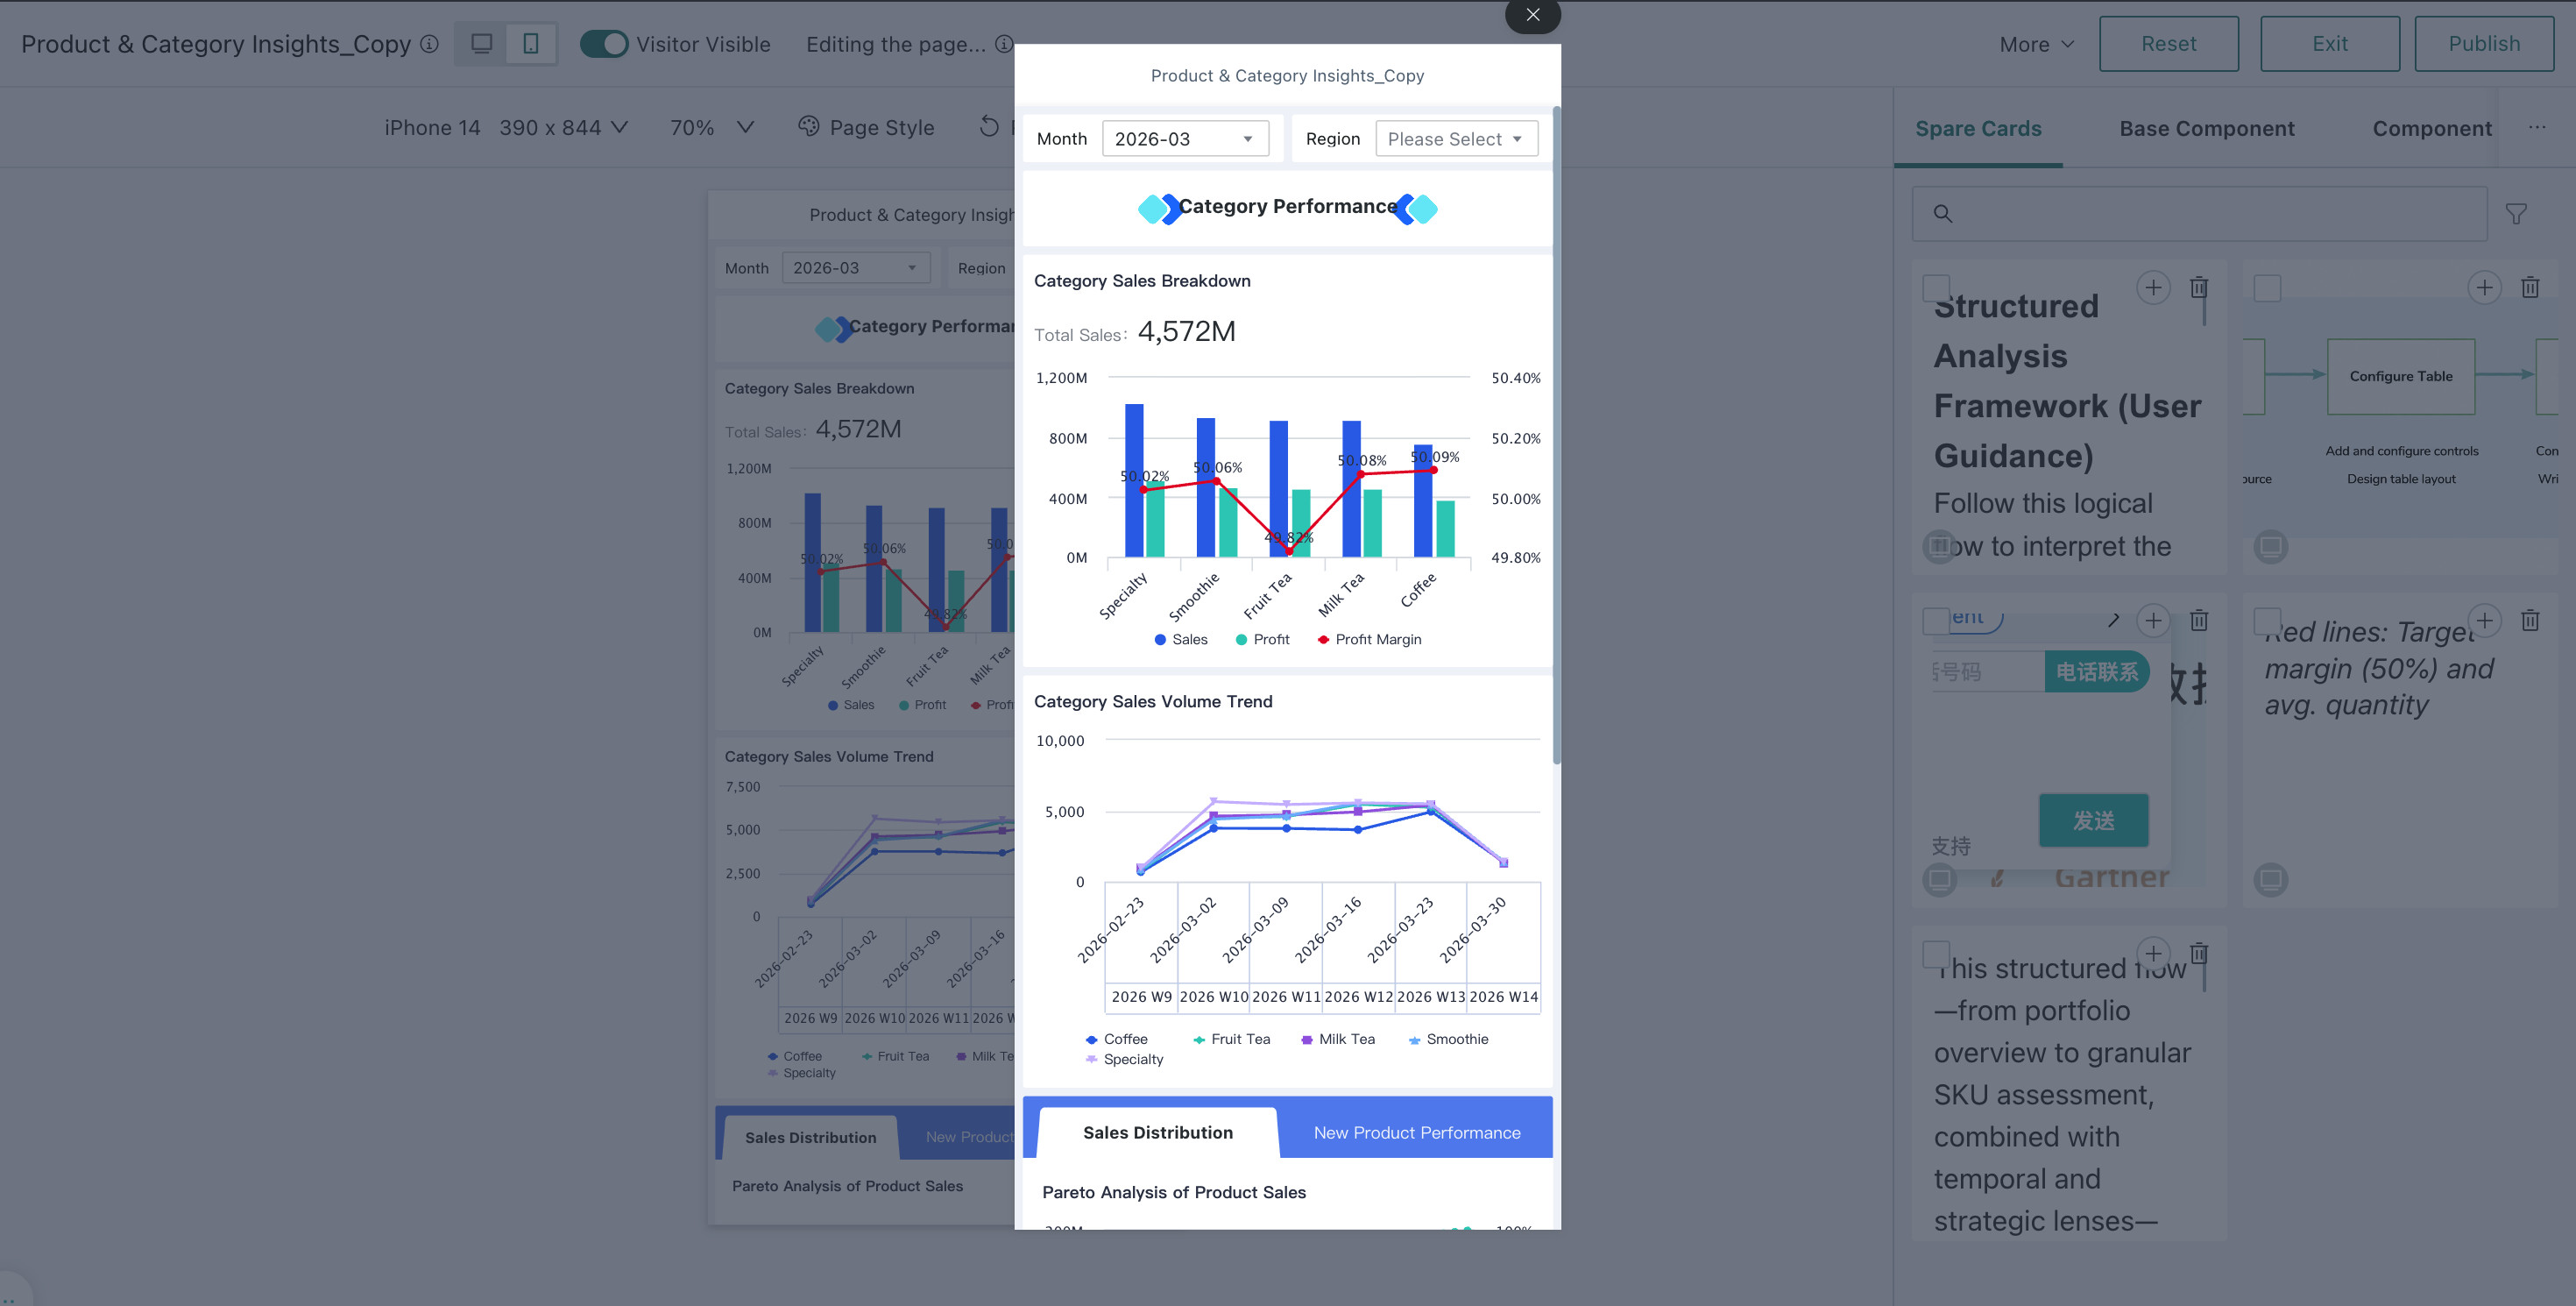
-
After configuration, click "Preview" or "Scan to Preview" in the upper right corner of the mobile interface to view the configuration effect.
-
For more details on mobile configuration, see Mobile Layout.
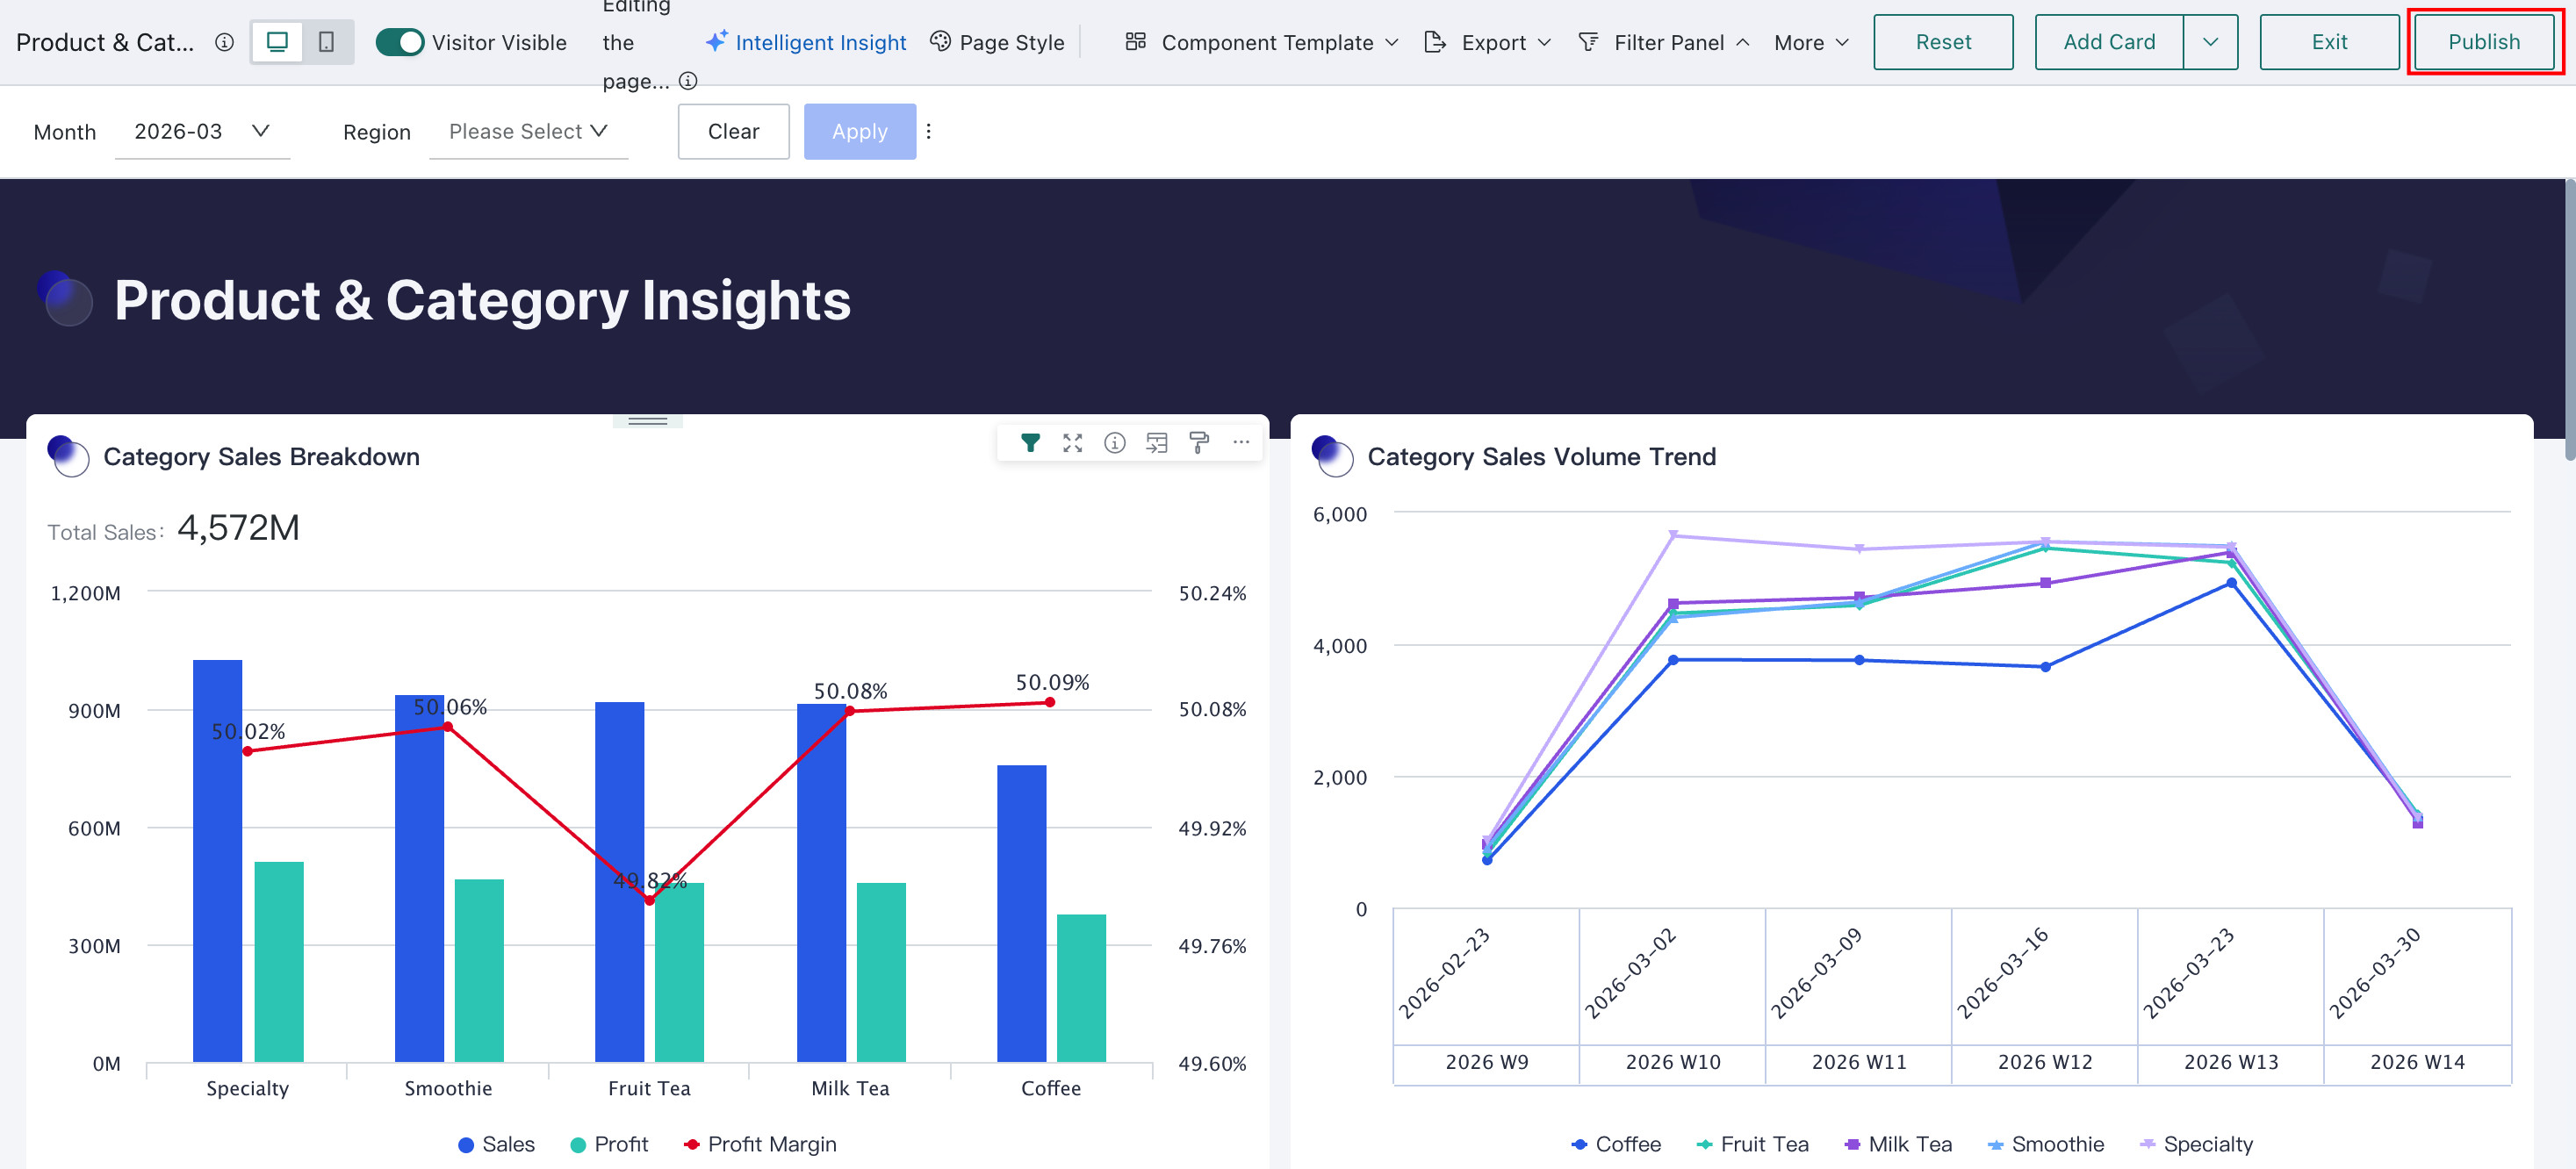
Publish Dashboard
After the dashboard configuration is complete, click the "Publish" button in the upper right corner to complete the dashboard creation.
Configure Dashboard Permissions
-
Method 1: After publishing the dashboard, click "Permission Management" in the left navigation bar to configure permissions.
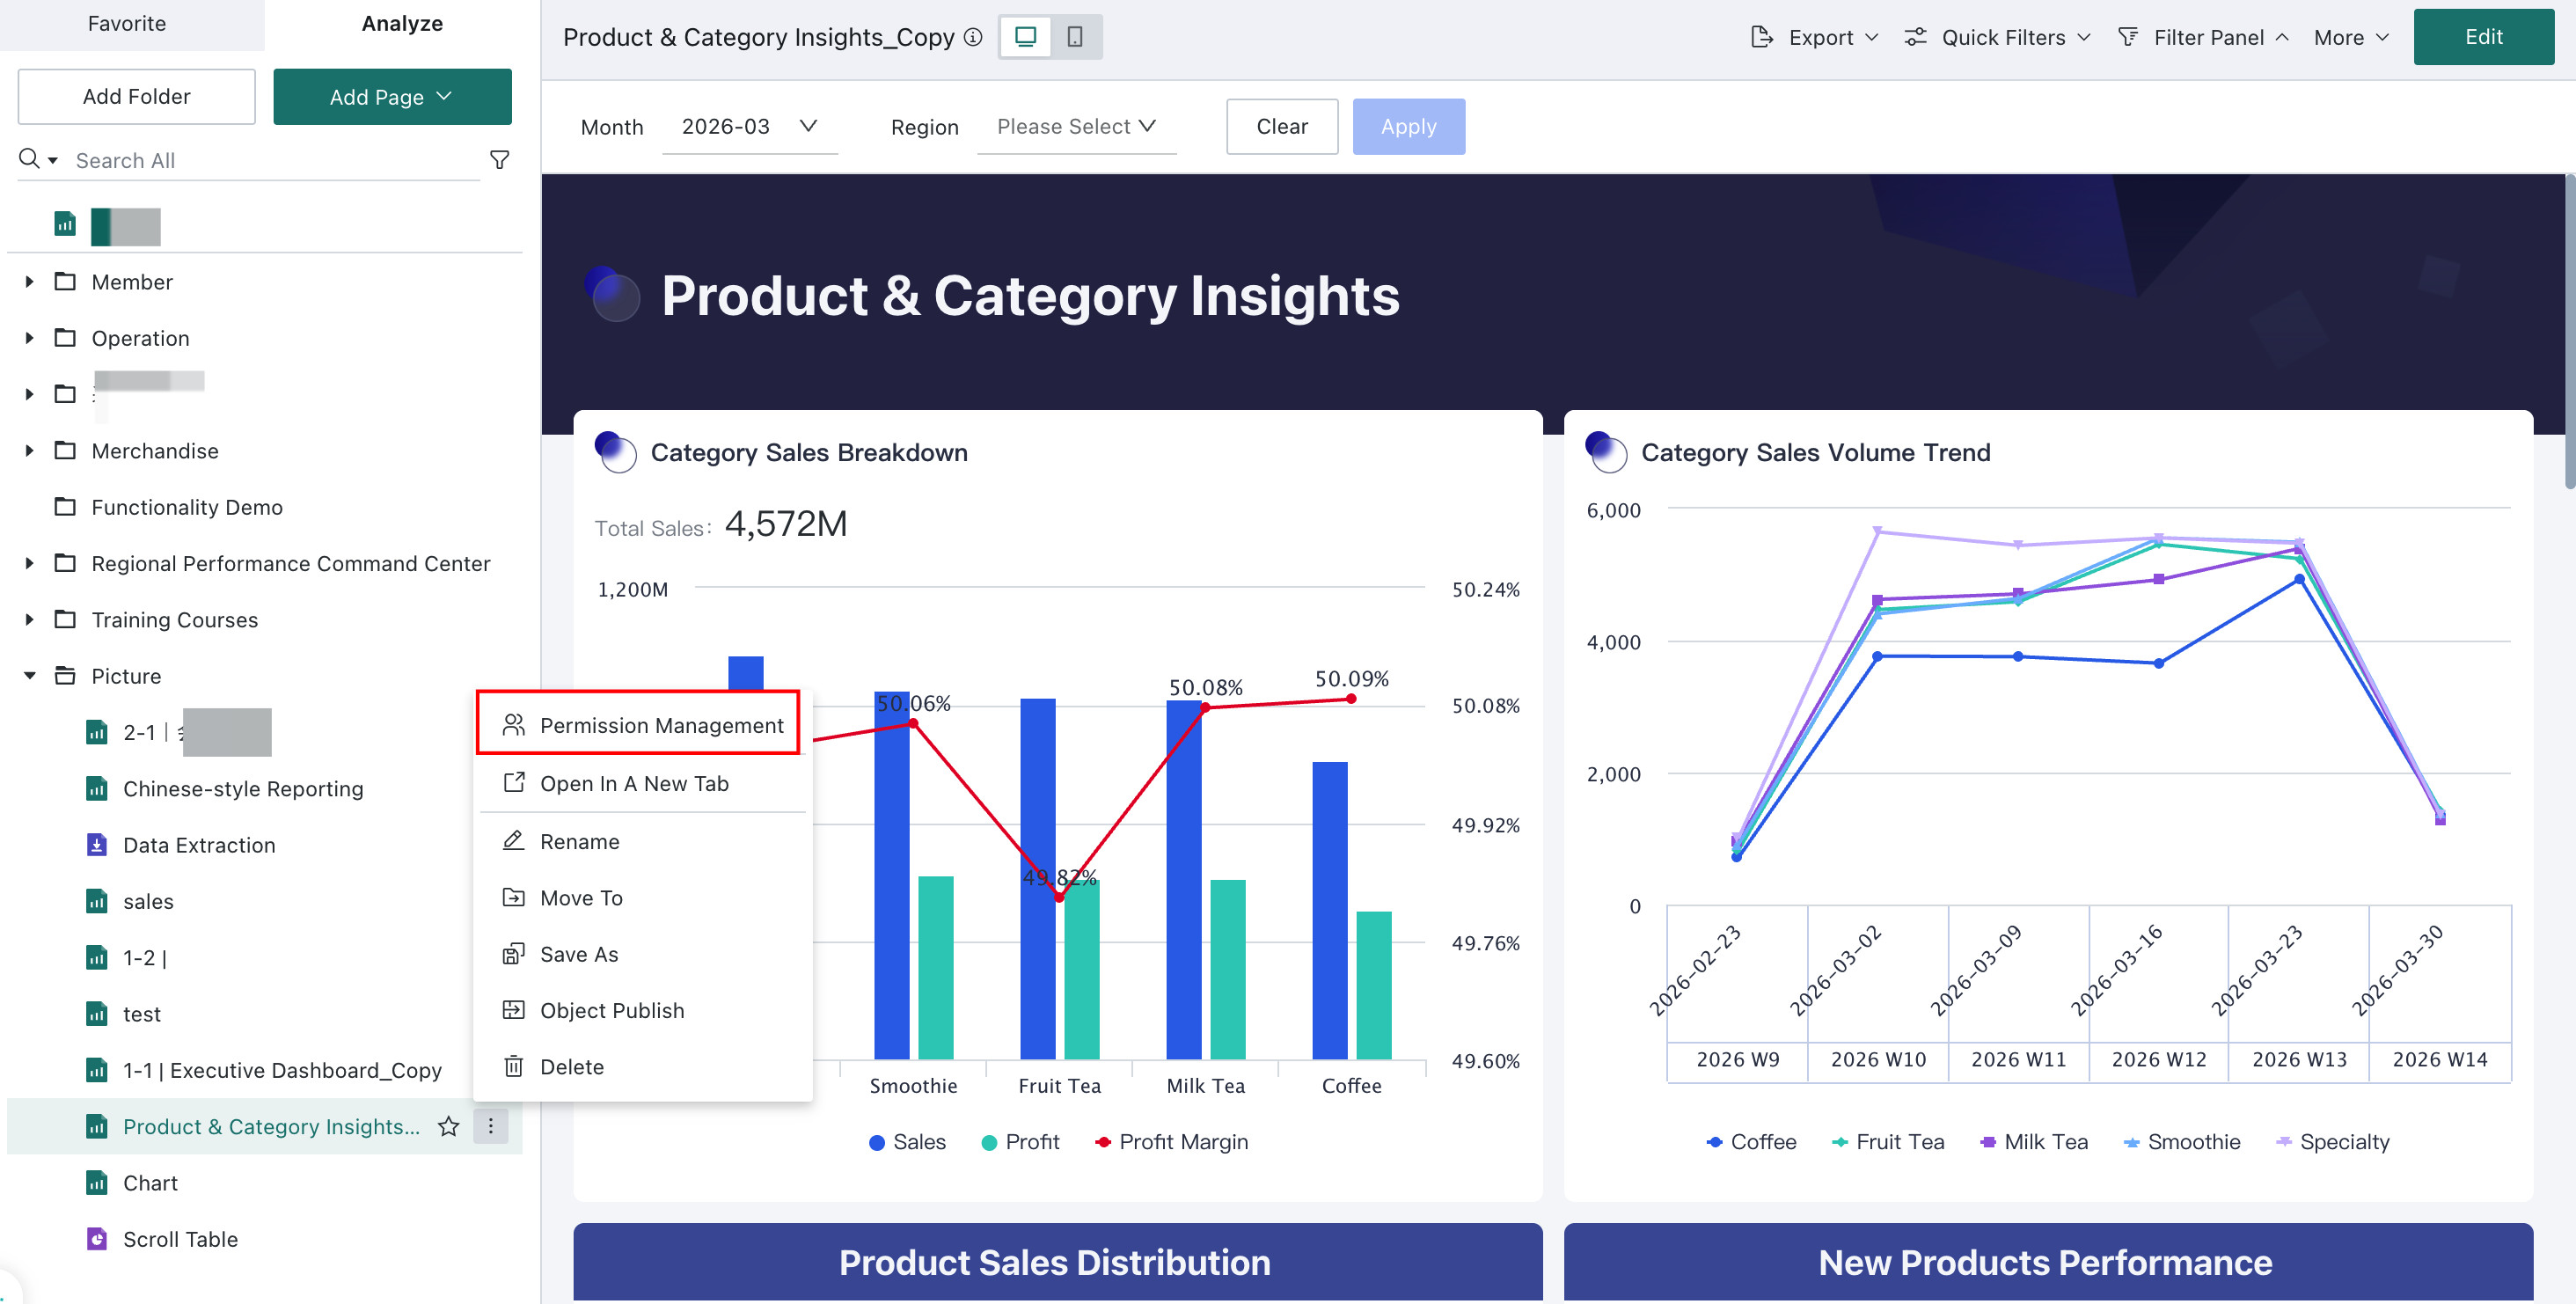
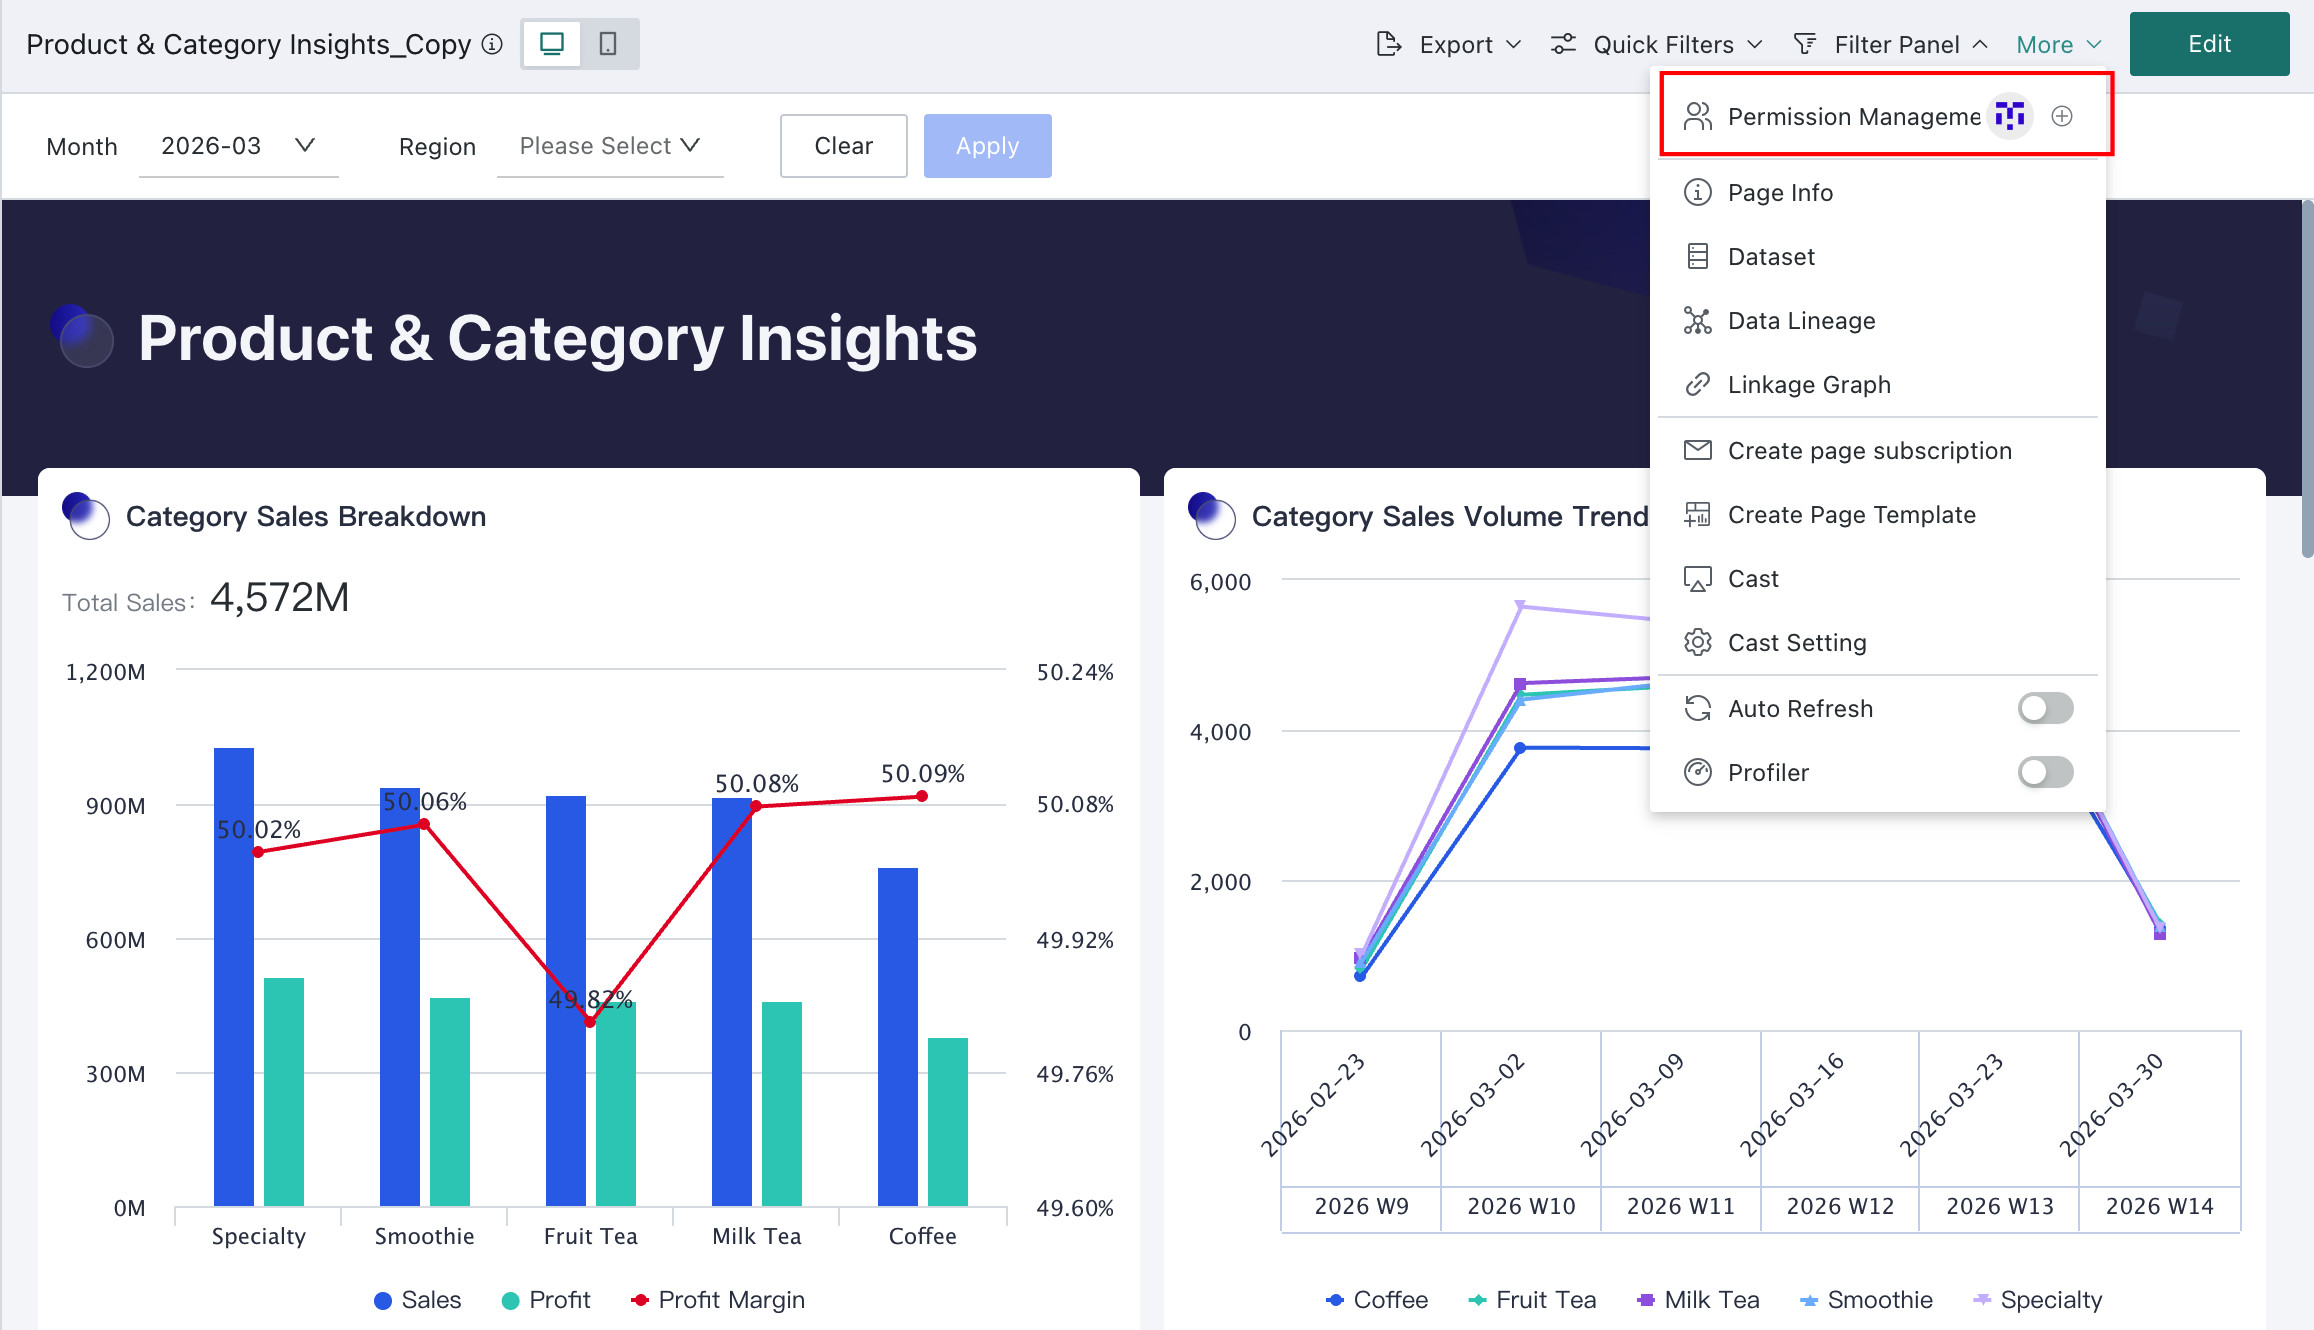
-
Method 2: After publishing the dashboard, click "More > Permission Management" in the upper right corner of the analysis page to configure permissions.
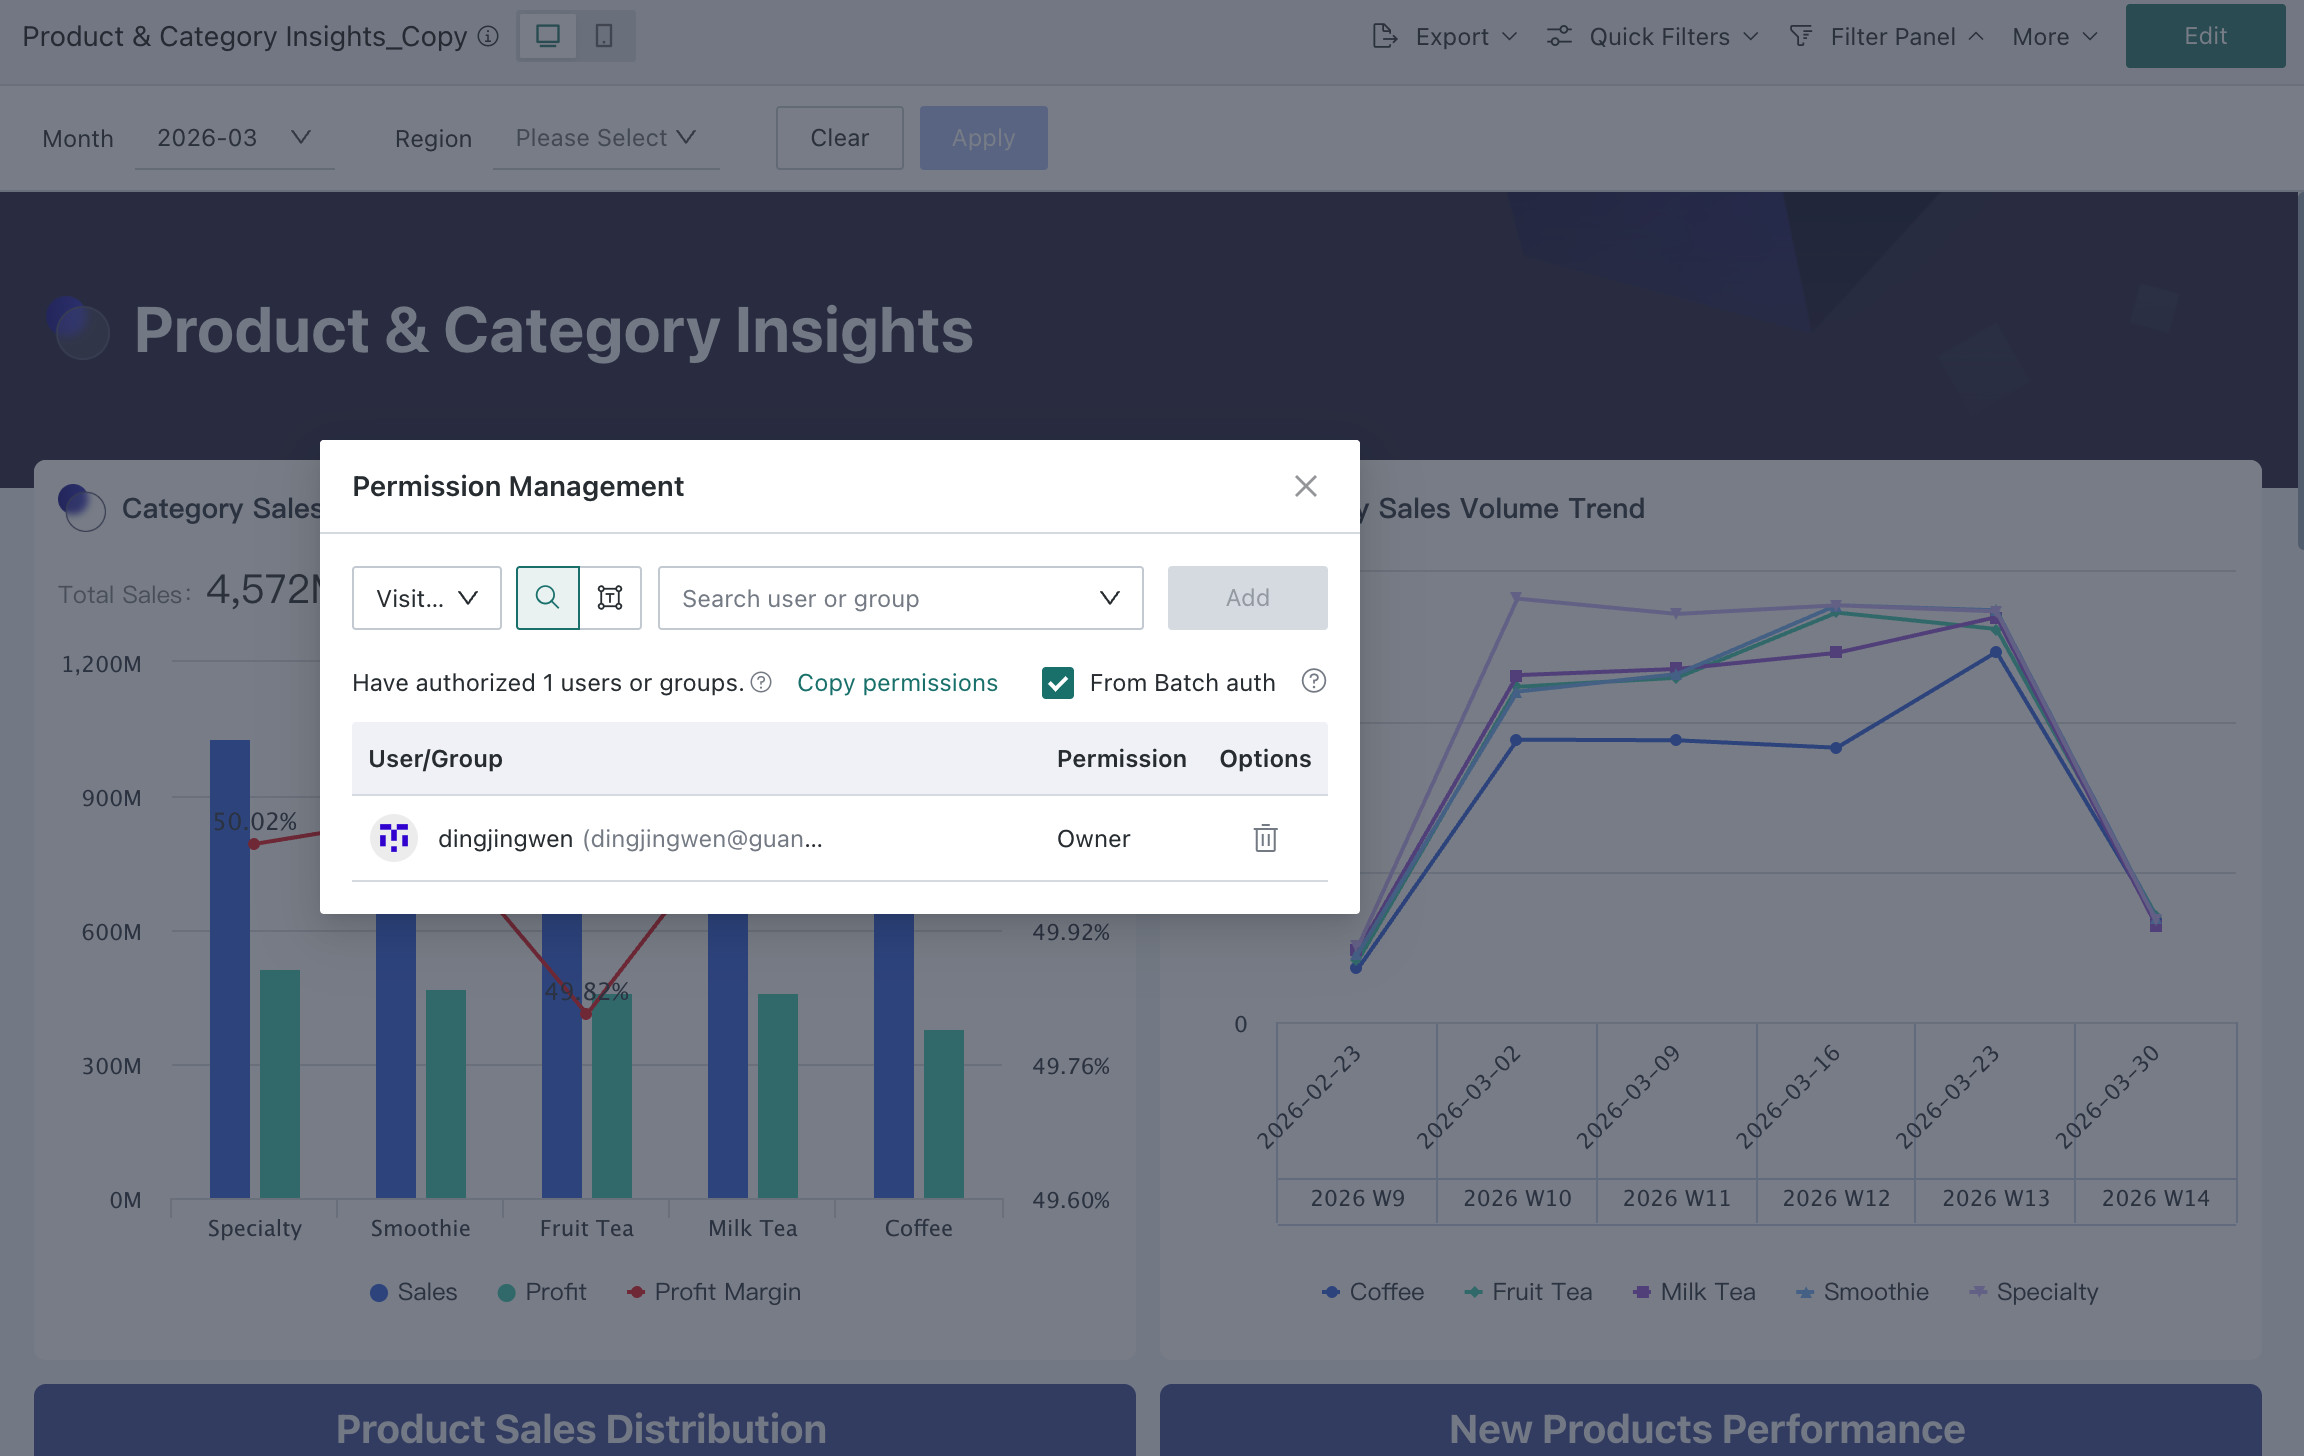
Among them, the owner has full permissions for adding, deleting, modifying, and querying the resource, as well as batch authorization, while the visitor only has viewing permissions for the resource. For more permission configuration details, see Resource Permission Management.
Other Configurations
After creating various cards, users often need to perform management operations such as modifying, deleting, and moving cards to make the overall dashboard page more reasonable and aesthetically pleasing, such as: format painter, card order adjustment, title style, default interaction, prompt information, move to, set as anchor, delete, card group management, header sorting, column width adjustment, etc. For details, see Card Management.
The dashboard supports all interactive functions, including filtering, drill-down, linkage, jump, etc. For details, see Filter, Drill-down, Linkage, Jump.
Smart Insights
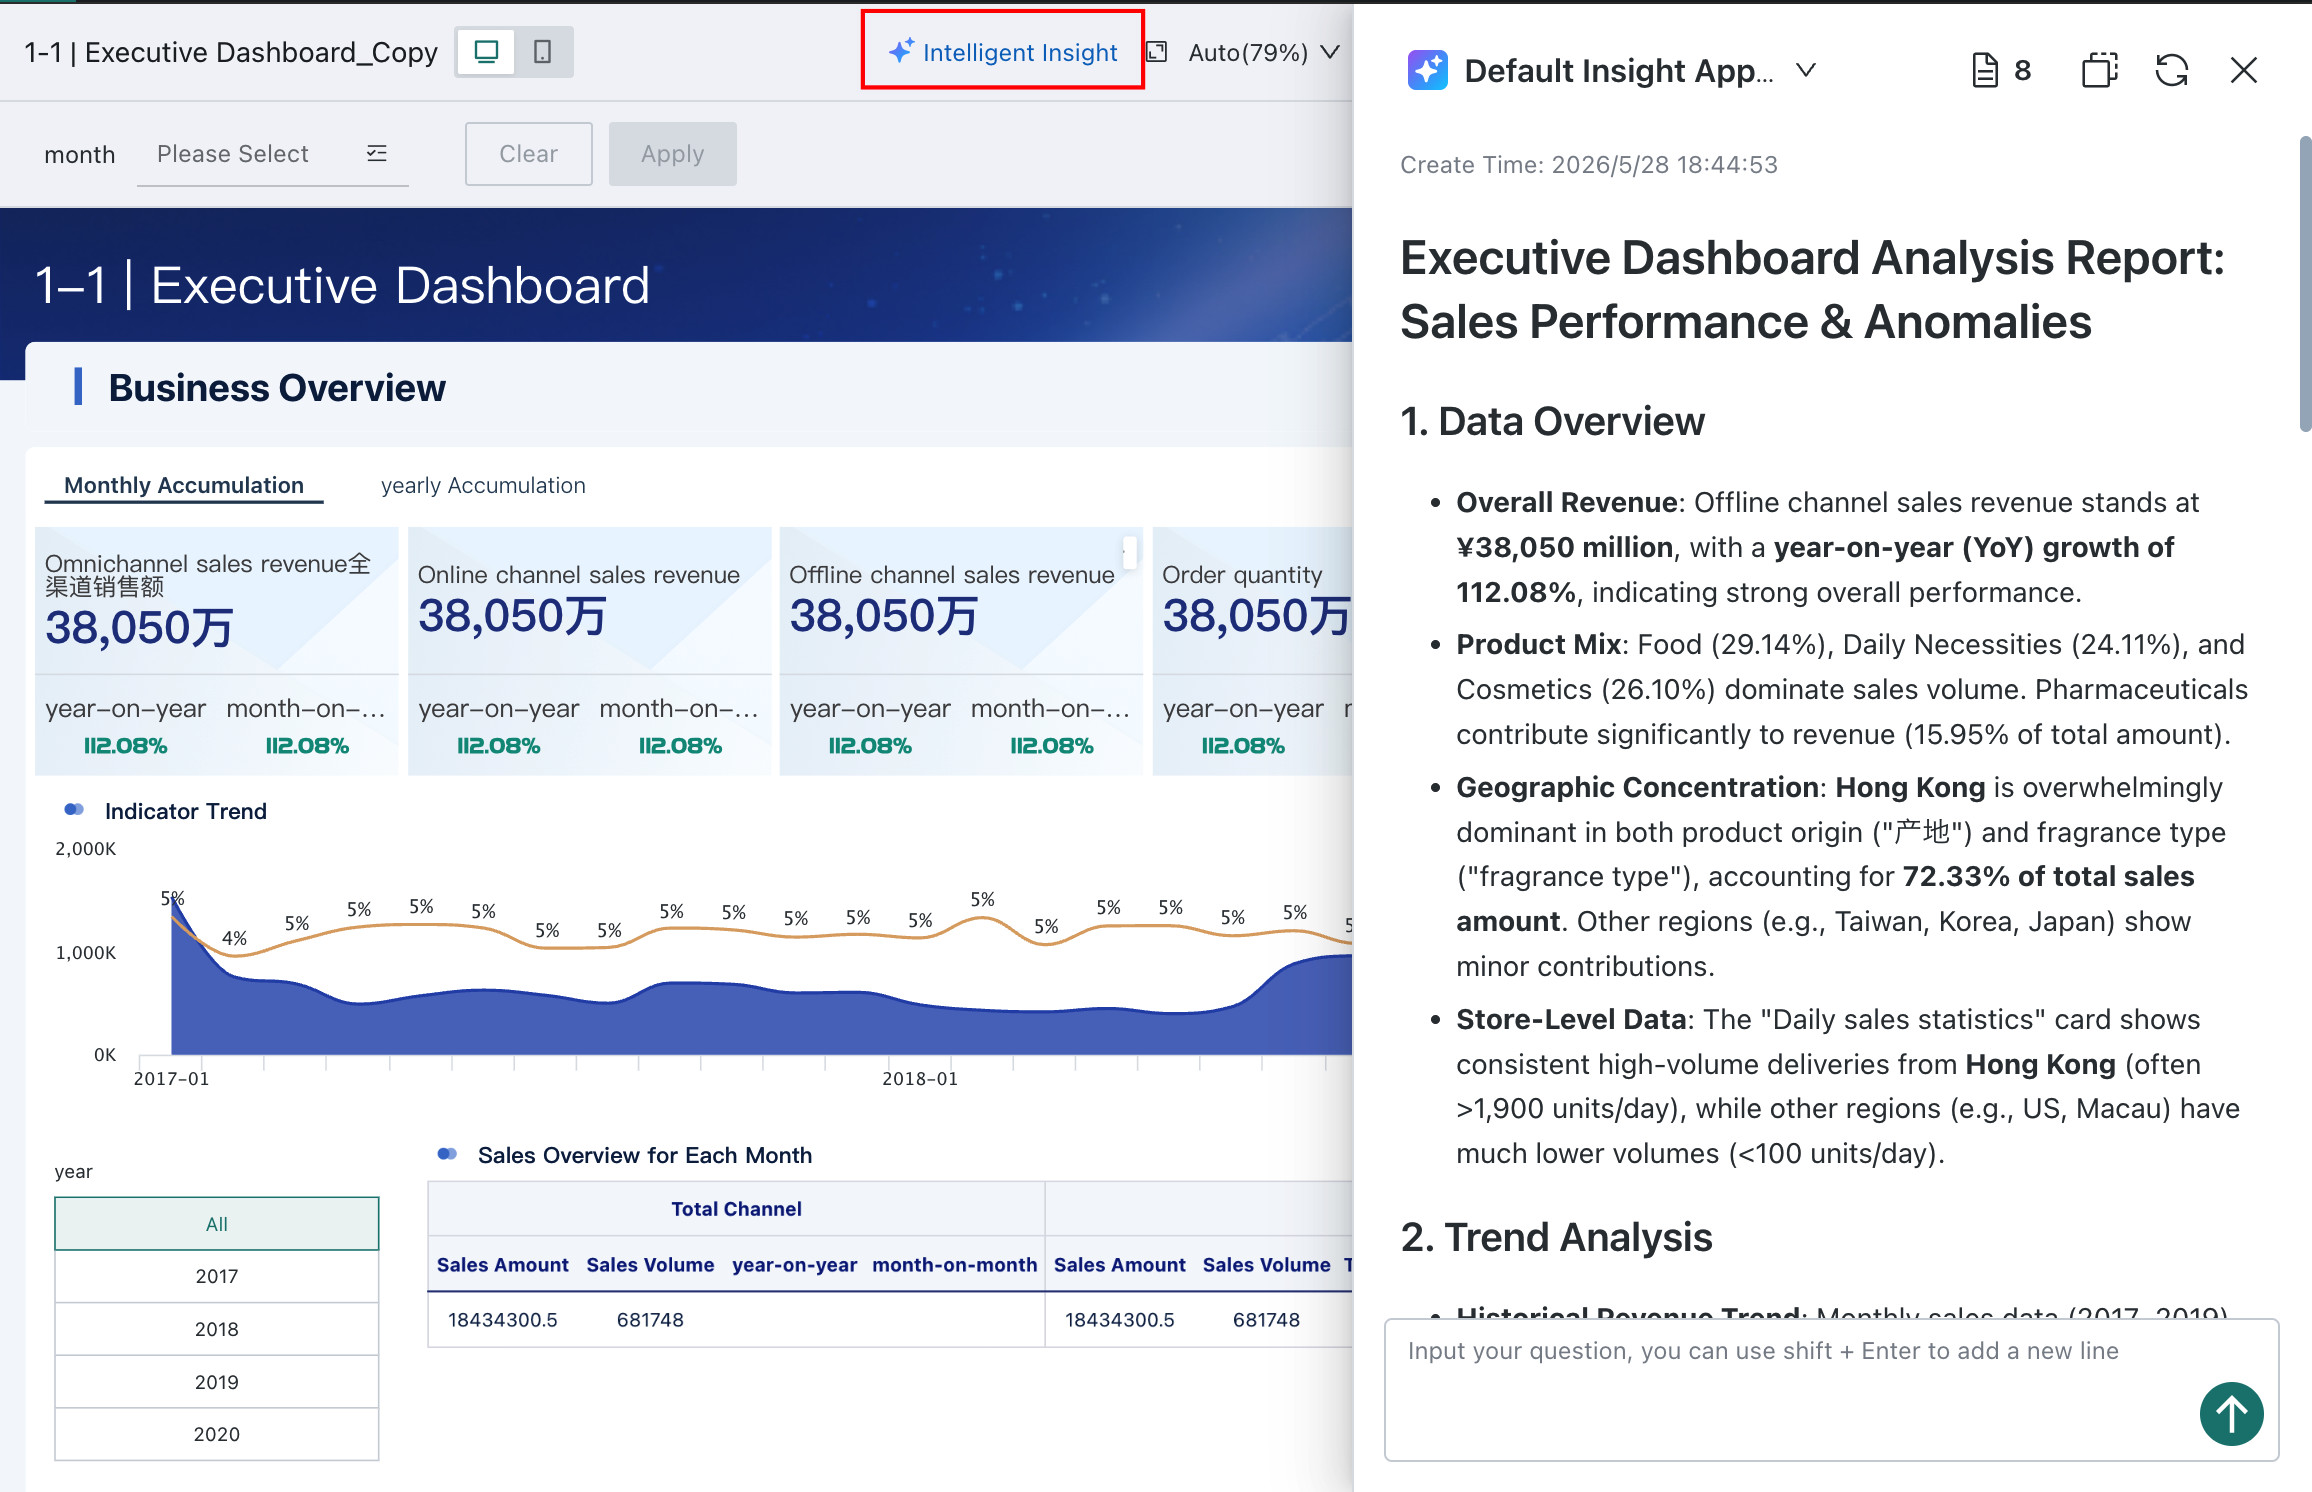
Dashboard Smart Insights automatically analyzes dashboard data through AI, identifying abnormal fluctuations, hidden correlations, and business opportunities with one click, providing users with deep insights and actionable suggestions beyond visualization. For details, see Dashboard Insights
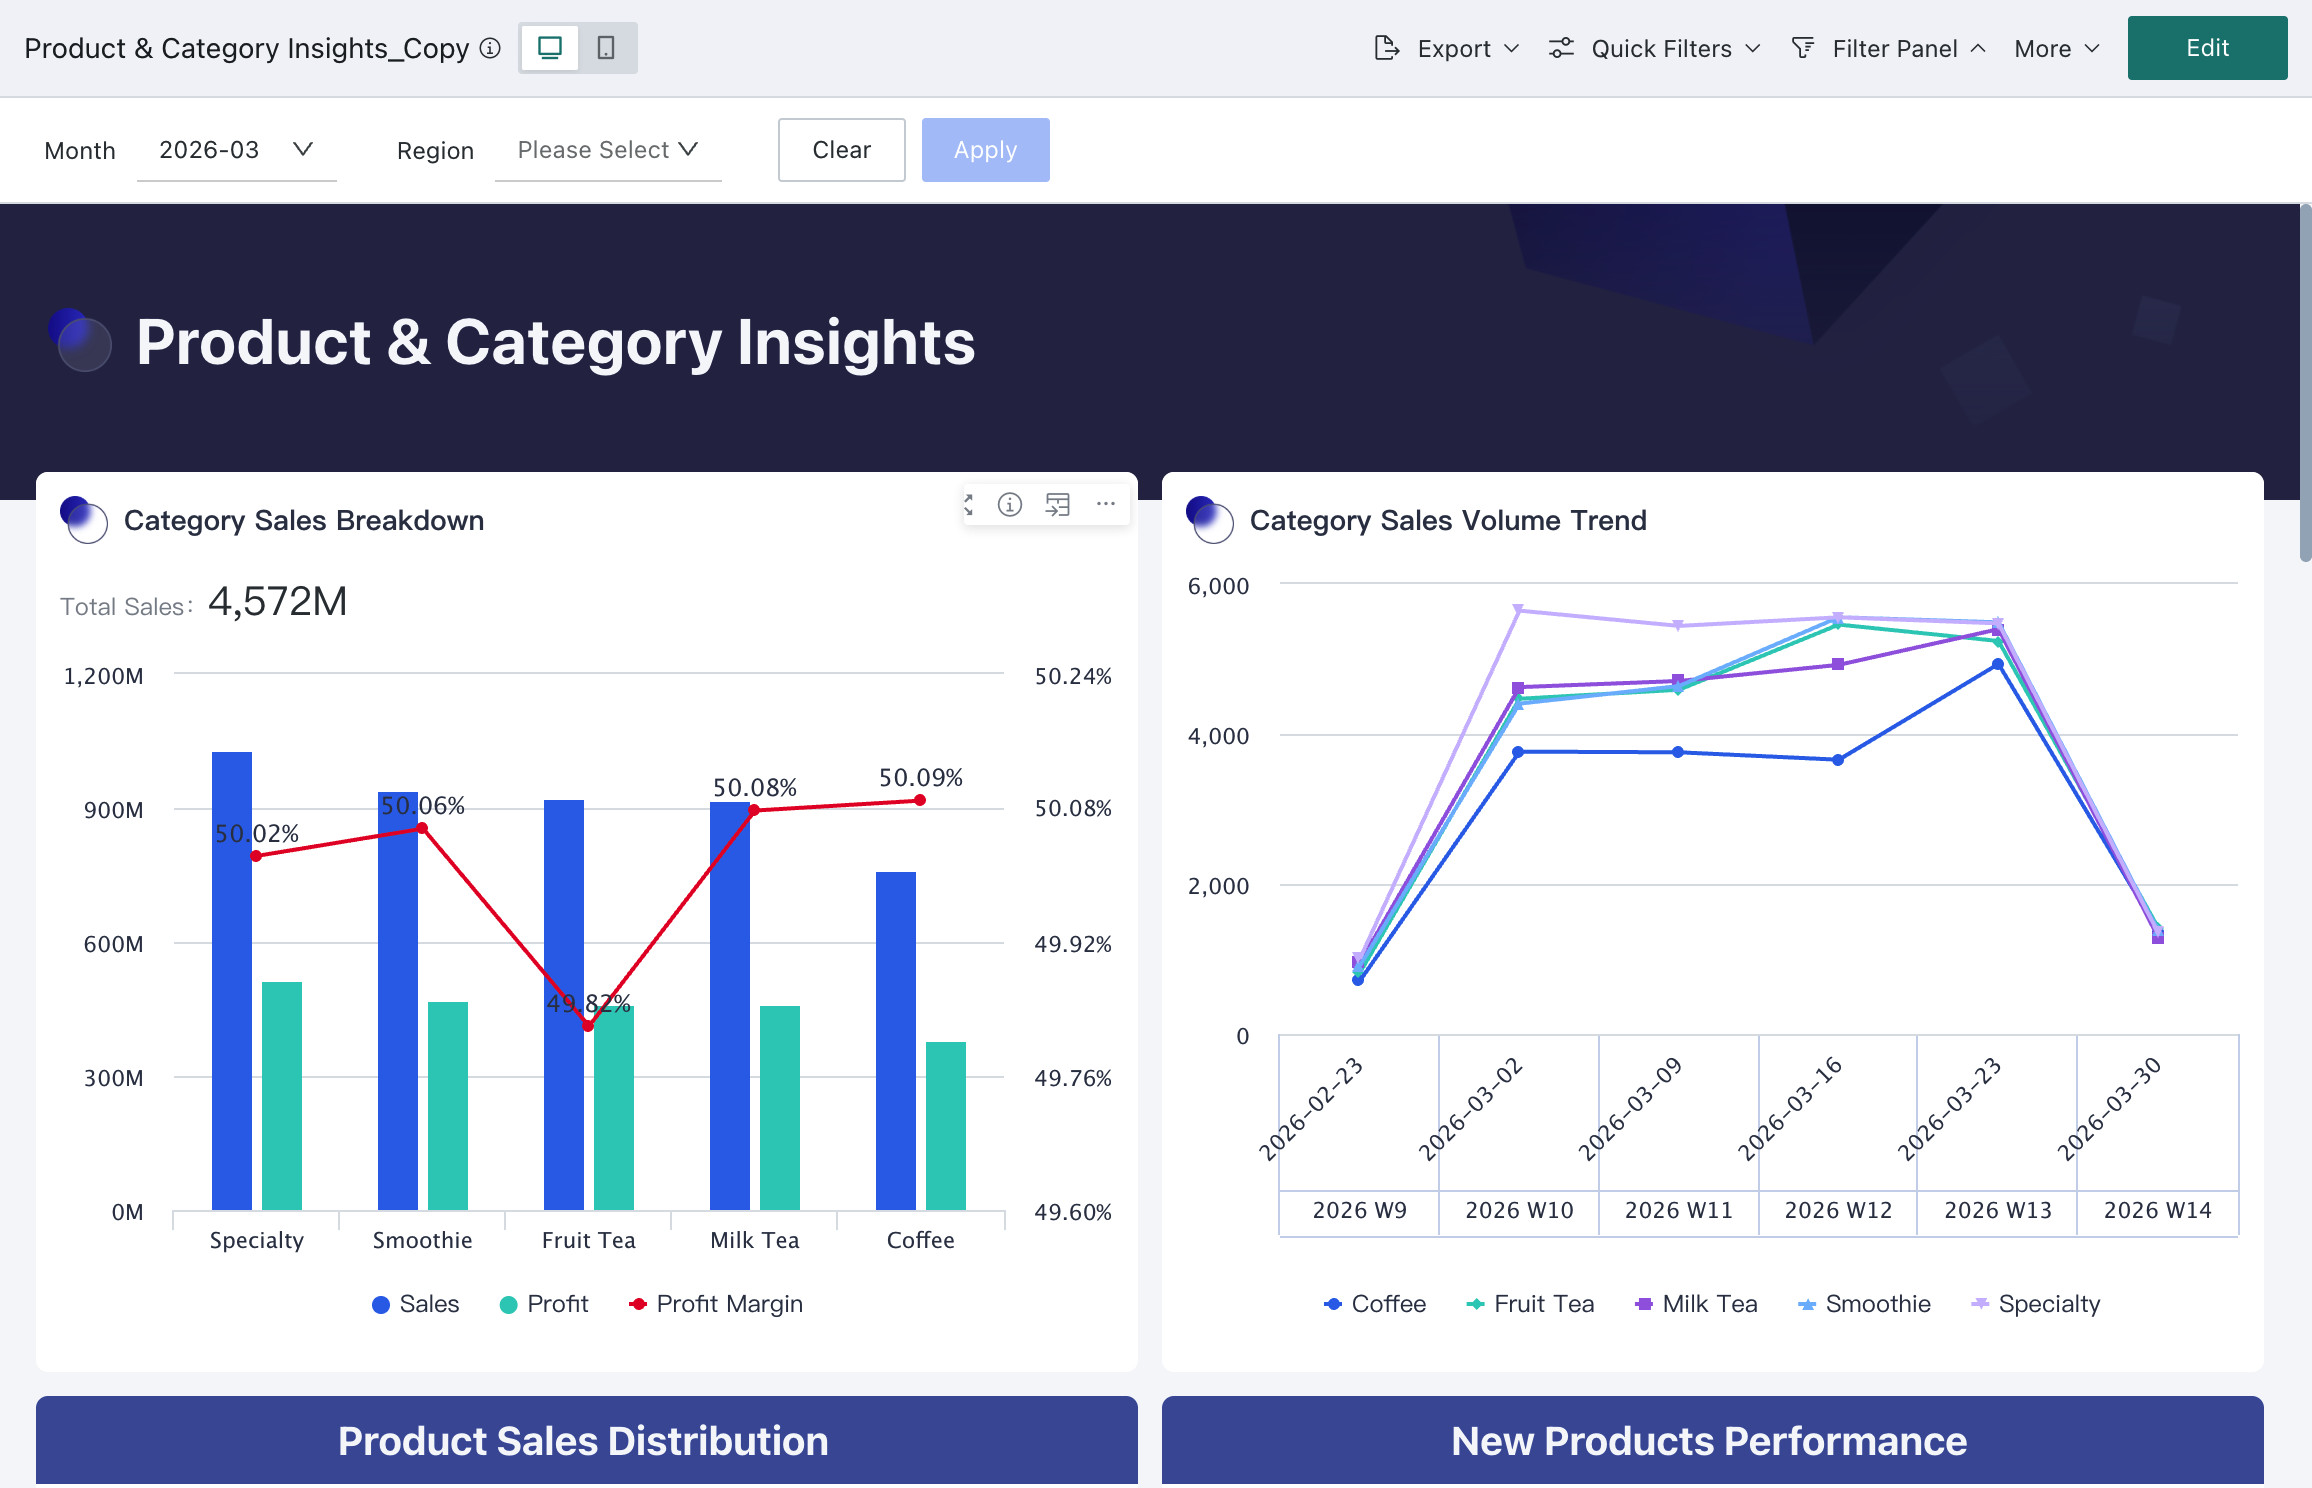
View Results
PC
On the Guandata BI platform PC side, click the "Data Analysis" module, find and click the target dashboard in the folder to view the full effect.
Mobile
Log in to the Guandata BI app on the mobile terminal, enter the "Dashboard" module, and select the target dashboard to view.