Card Selector
Overview
Feature Description
Chart Card Selector connects multiple charts so that when a user clicks on data in one chart, the linked cards will display data filtered according to the conditions corresponding to the selected data.
In the Card Selector feature, any supported chart type can serve as a linked chart. That is, users can select any chart as a starting point and use its interaction to affect the display content of other charts.
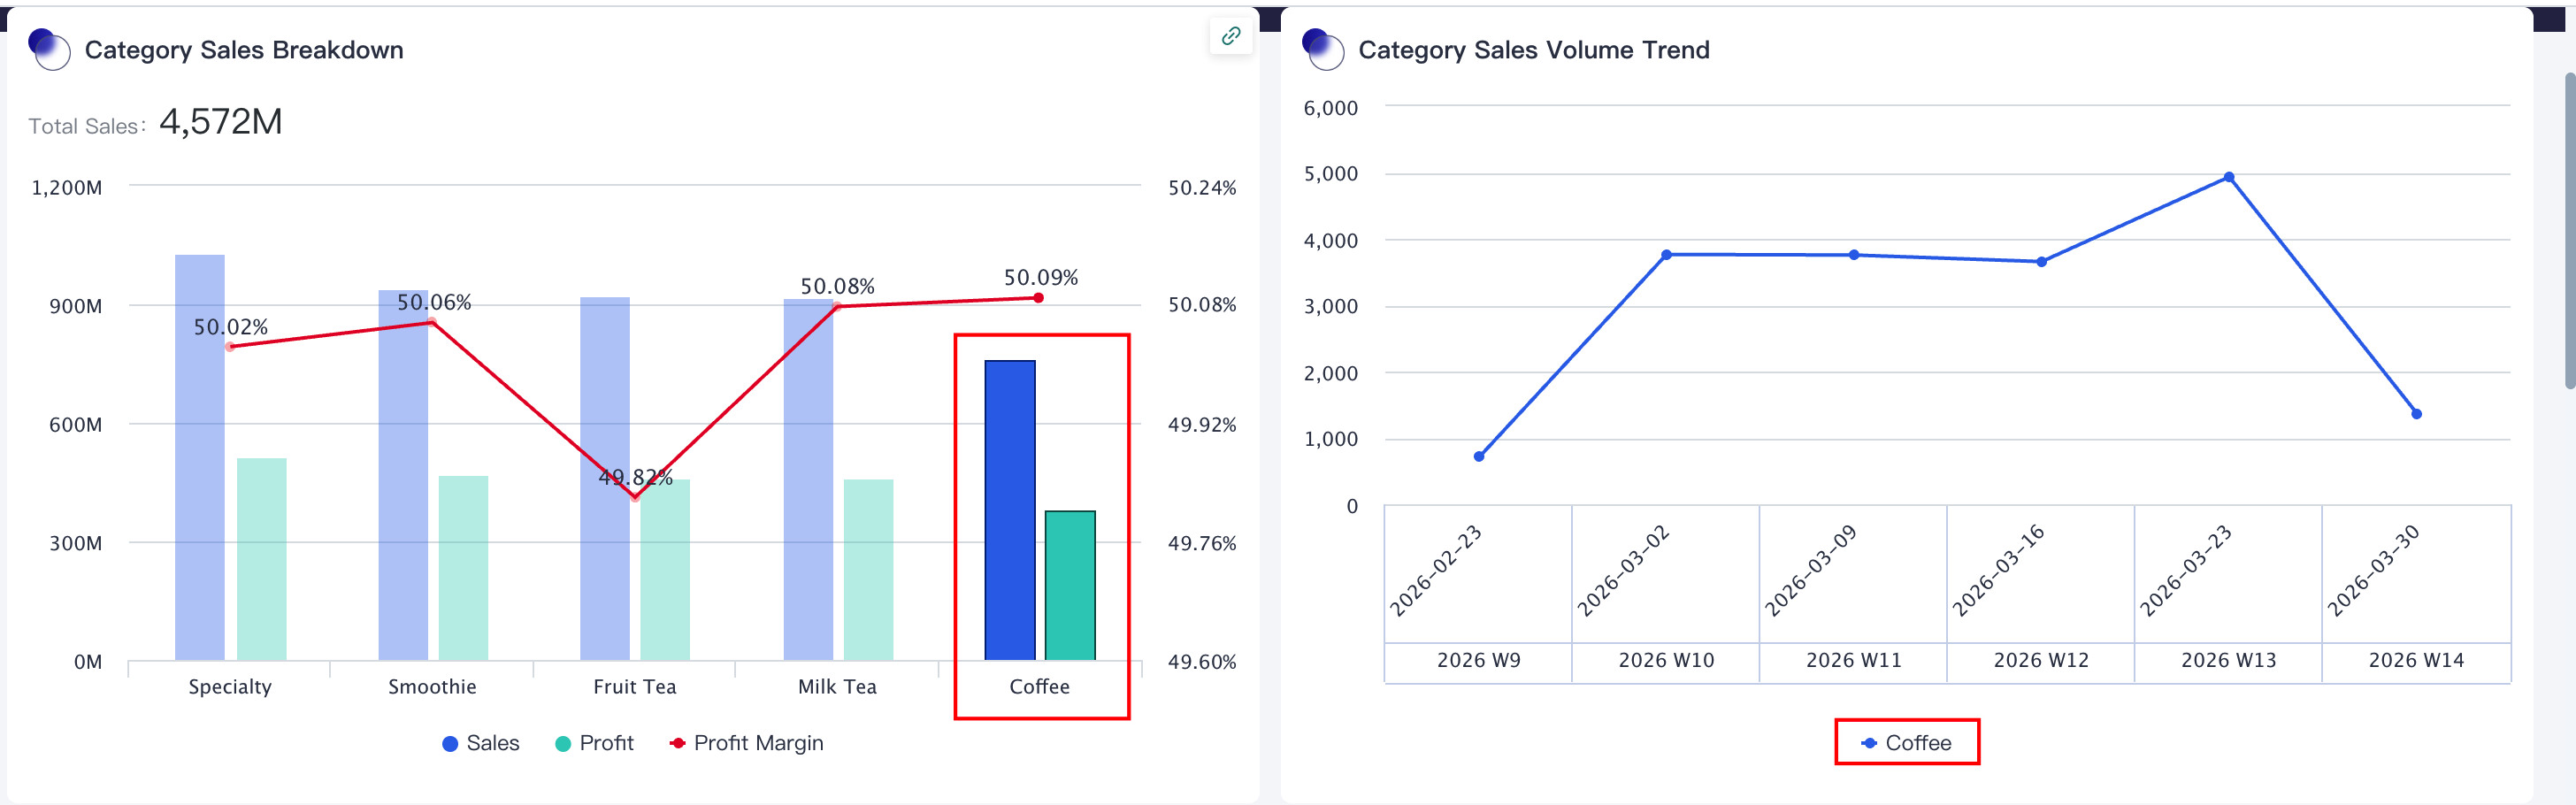
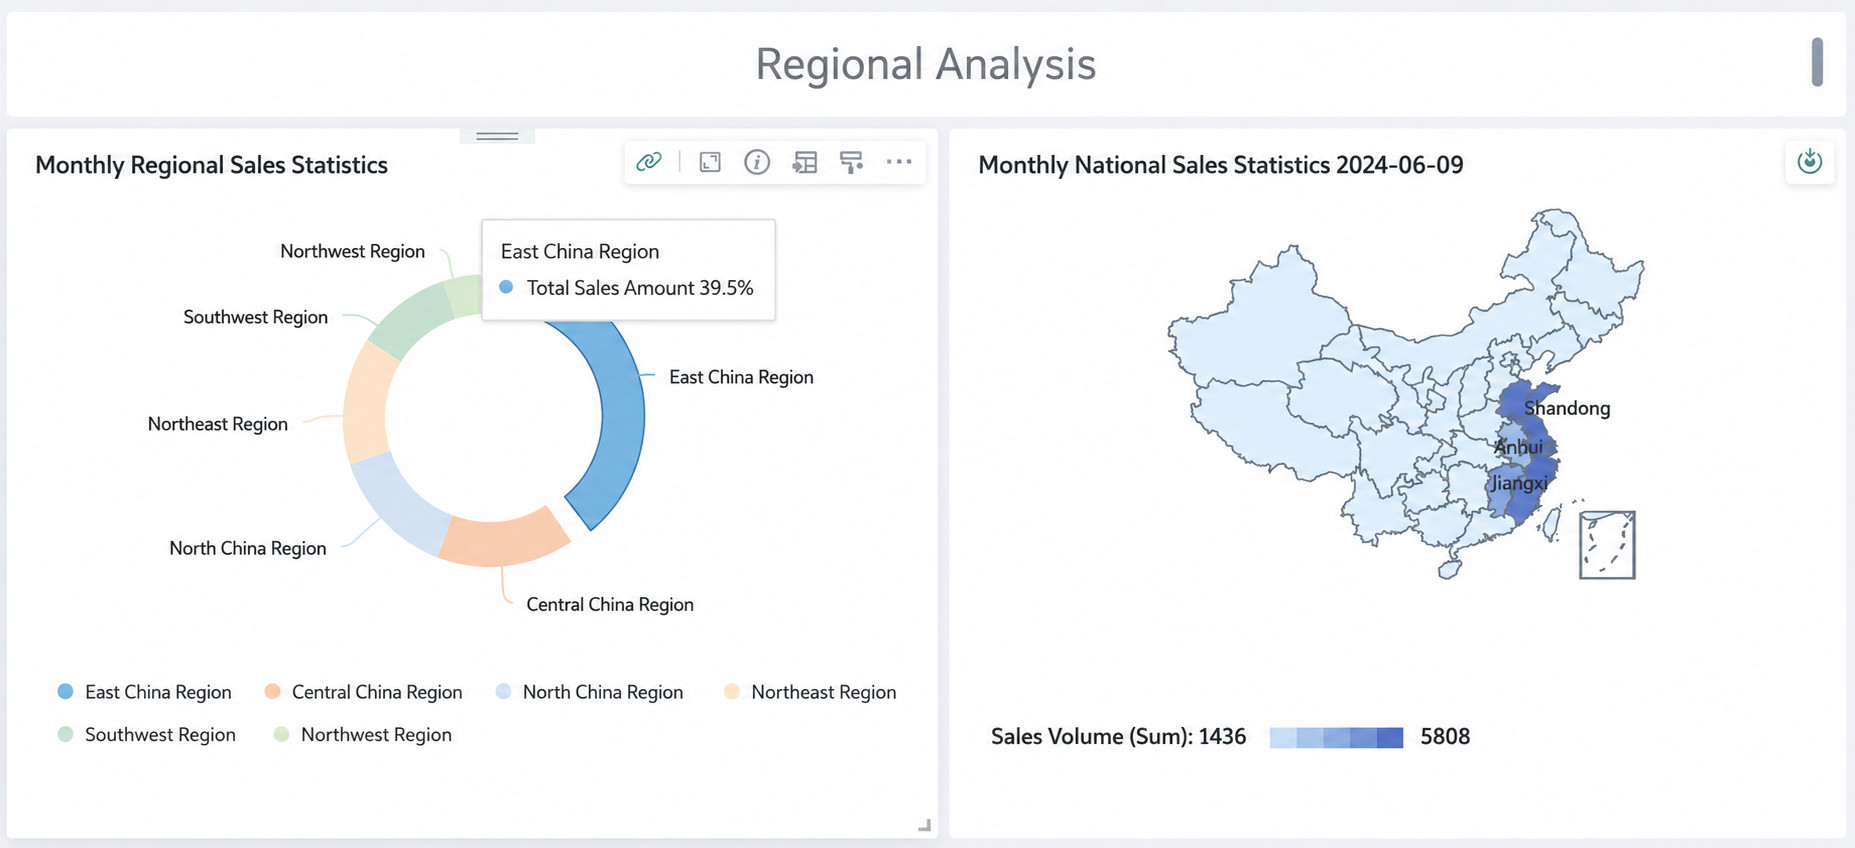
For example, in a product sales analysis chart, when you select to view the current month's sales data for the East China region, data in other chart cards (such as national sales statistics) will be automatically filtered, and the associated Card Selector will display sales data for each province within the East China region.
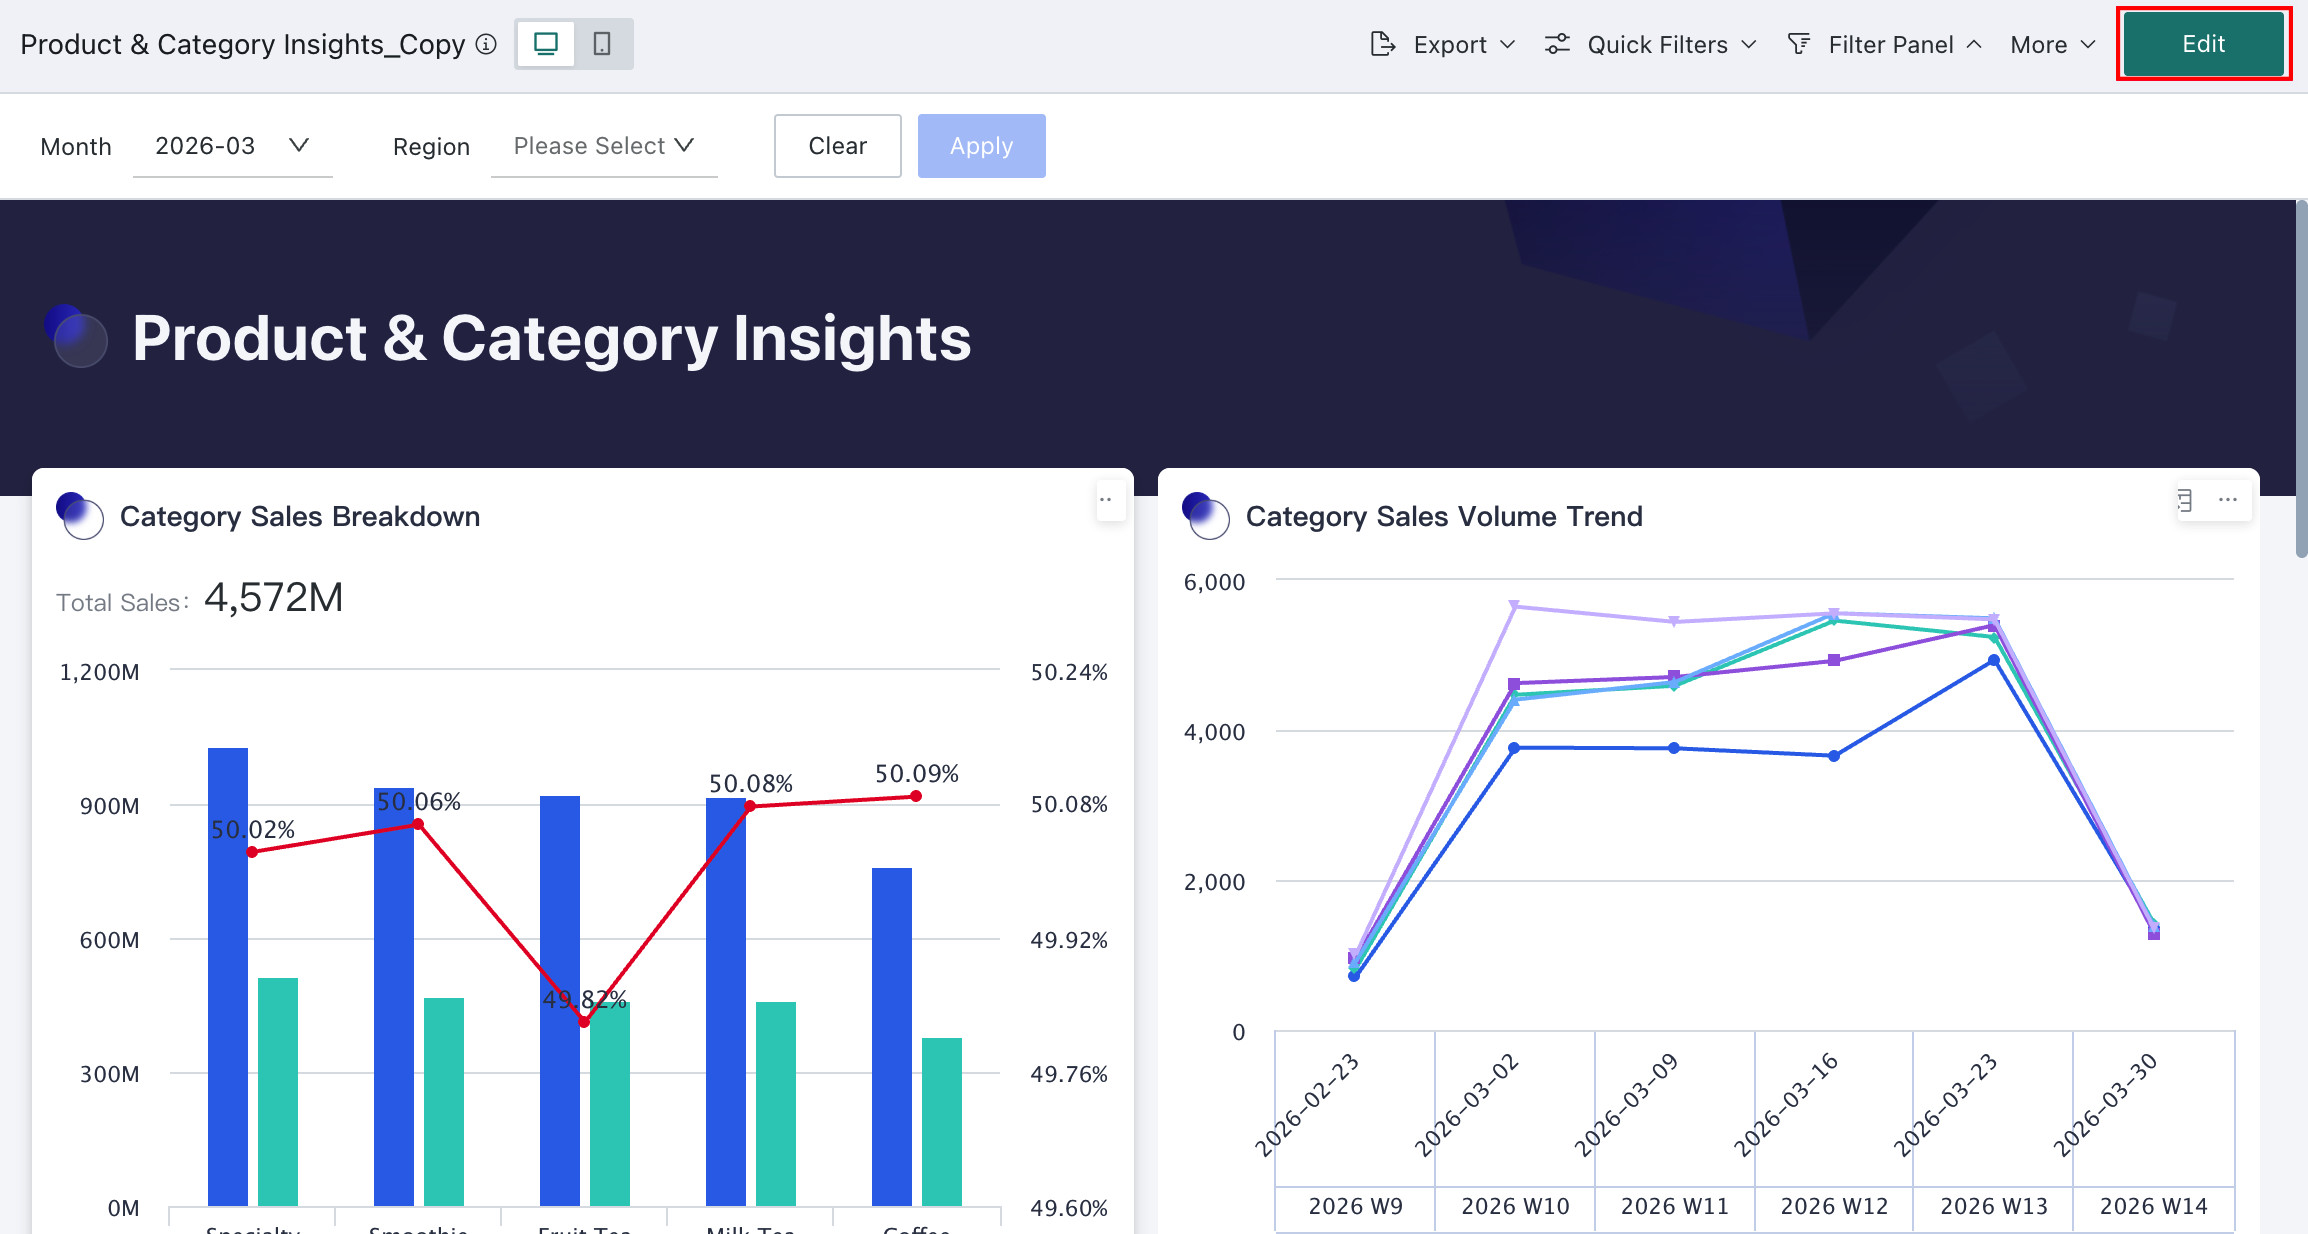
Since version 7.2 distinguishes between online and draft states of a dashboard, Card Selector needs to be configured in the dashboard edit page.
Notes
- Supported card types for Card Selector: All column charts, all bar charts, all line charts, single pie charts, tables, administrative maps, heatmaps, and Chinese-style report pro. Other chart types are being supported gradually.
- Custom charts created based on the Visualization SDK (require self-developed Card Selector interaction logic).
- In addition, if the linked card uses global parameters, Card Selector to parameters is also supported.
Usage Guide
Creating Card Selector
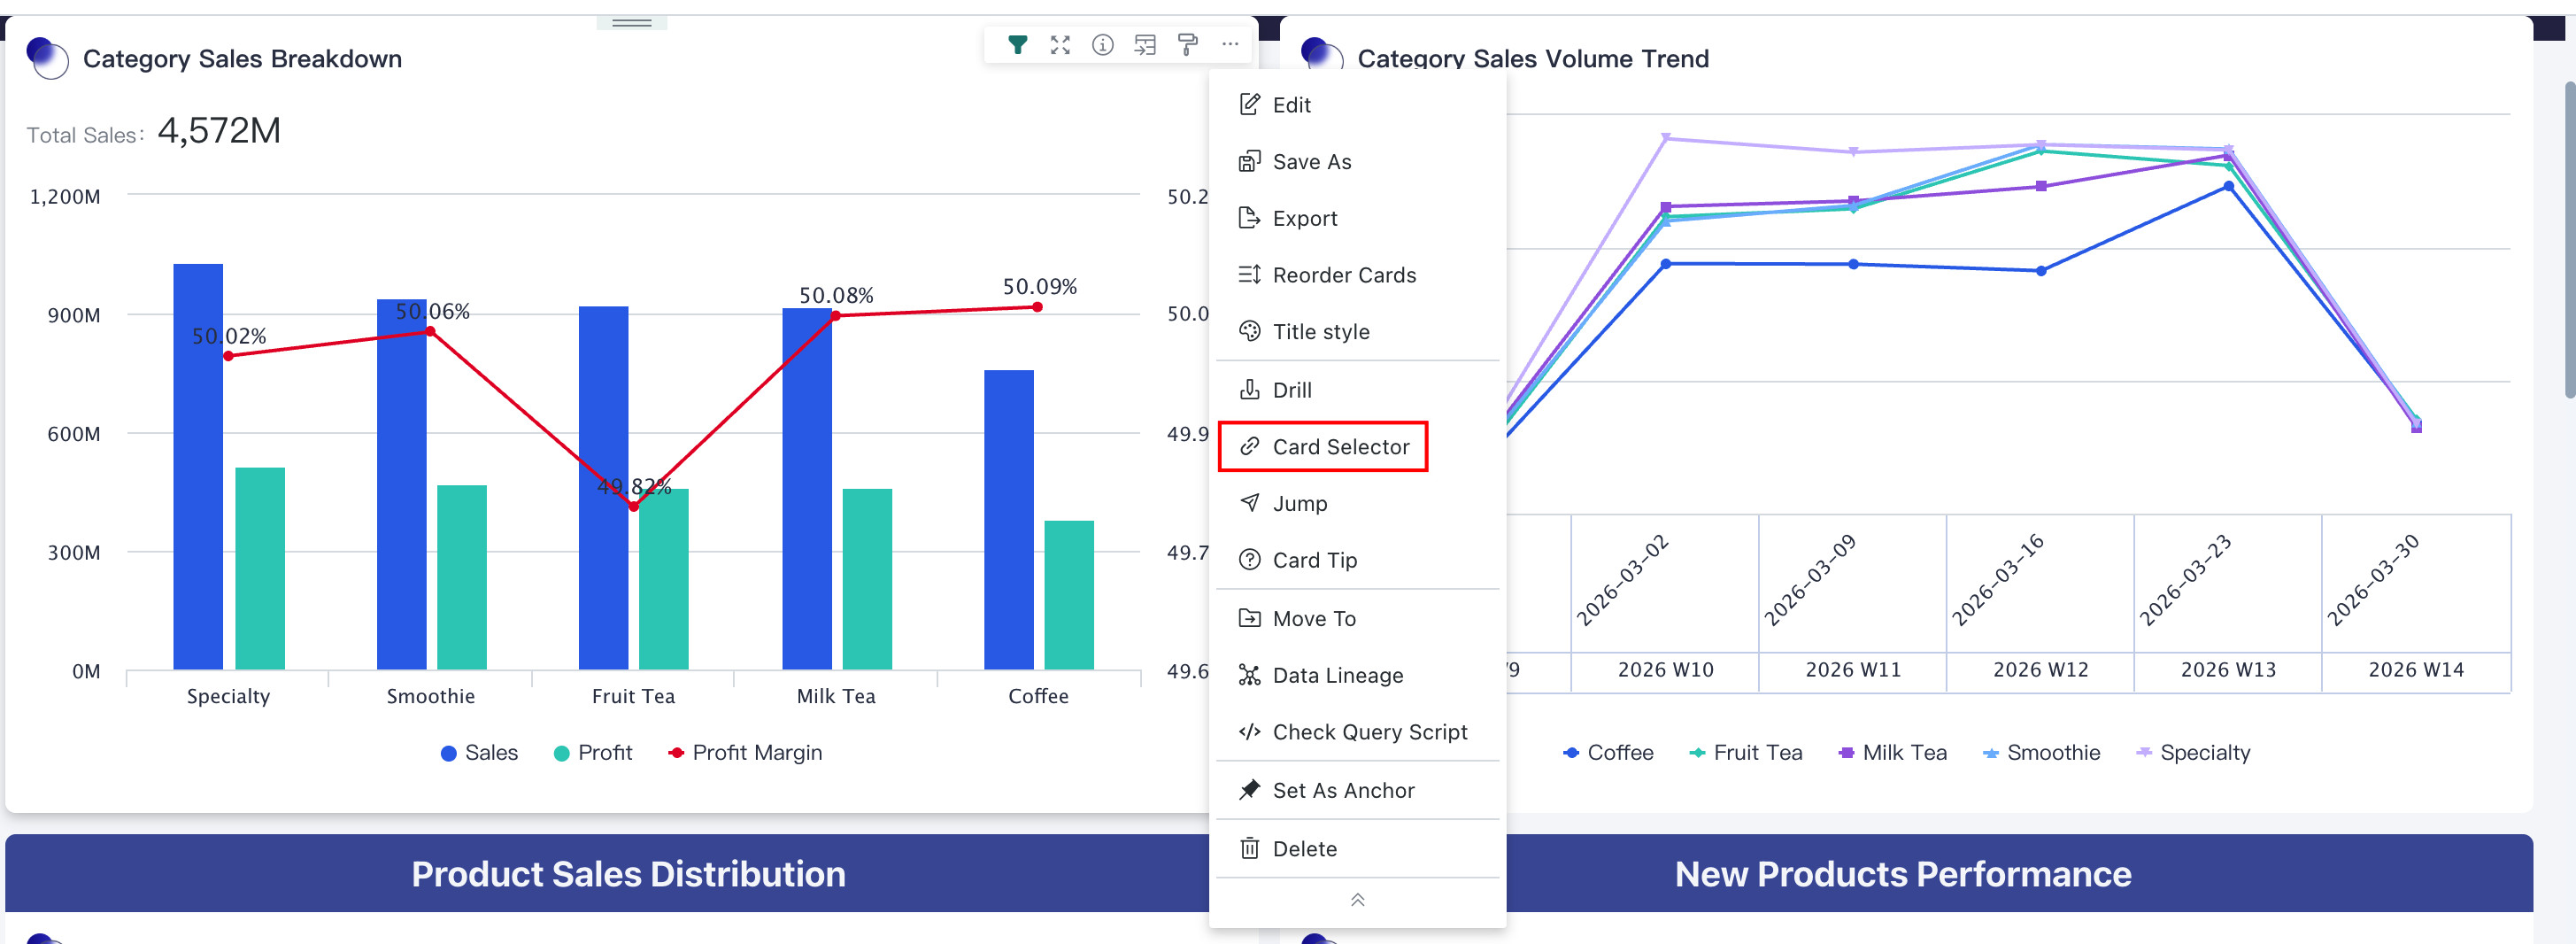
Select the card that initiates the Card Selector, click the "More > Card Selector" icon, and enter the chart Card Selector configuration interface.
Setting Card Selector Relationships
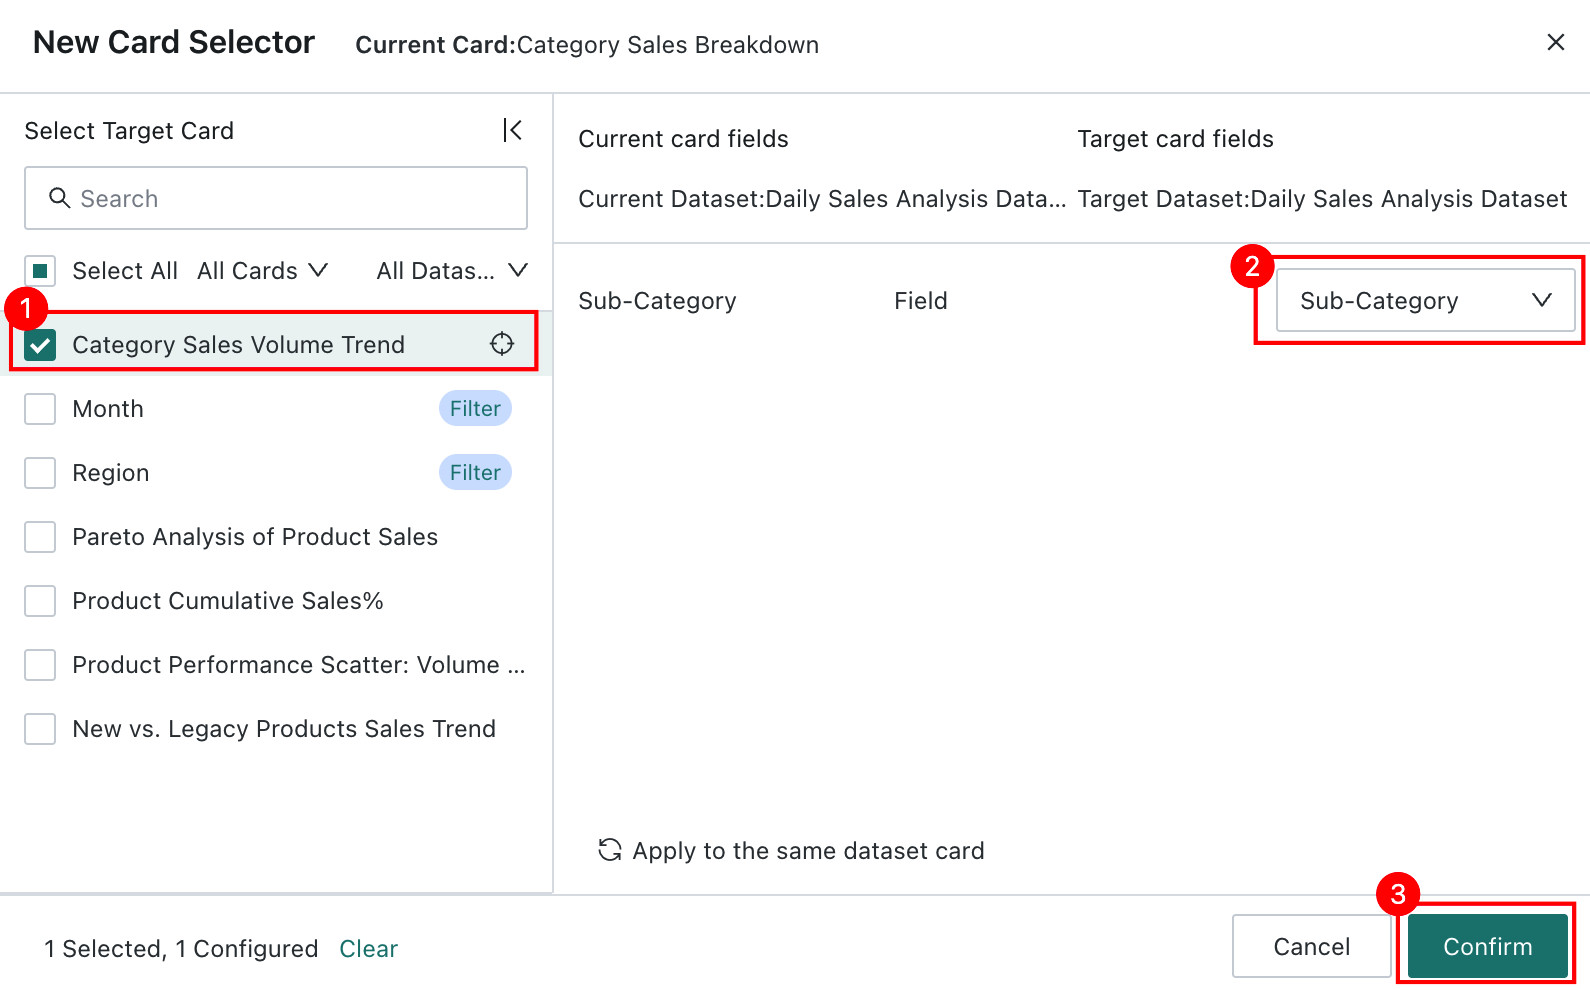
In the "Create Chart Card Selector" dialog, you can search and select target cards to link from the list on the left, and configure associated fields/parameters for each target card on the right.
-
Select one or more target chart cards as needed, adding the target charts you want to link with.
NoteWhen there are many cards, to easily locate the target Card Selector card, hover over the card name and click the locate card icon to locate and display the corresponding card.
-
Configure Card Selector conditions for each target chart—target fields (i.e., fields in the target chart that change according to the fields of the chart initiating the Card Selector). After completing all configurations, save to take effect.
Advanced Card Selector
Chart Card Selector and drill-down can be combined to enable quick switching and association between multiple charts while drilling down into data details layer by layer, allowing users to more intuitively understand data relationships and trends.