Dashboard Insights
Overview
Dashboard Insights uses AI to automatically analyze dashboard data, identify abnormal fluctuations, hidden relationships, and business opportunities with one click, and provide deep, actionable insights beyond visualization alone.
Applicable Scenarios
In enterprise analytics scenarios, Dashboard Insights uses AI to uncover and present data value more deeply, overcoming the static limitations of traditional visual dashboards and providing automated, actionable decision support. Typical use cases include the following:
| Scenario | Business Pain Point | How Dashboard Insights Helps | Business Value |
|---|---|---|---|
| More efficient operations analysis | |||
| Frontline business enablement | data summary + attribution analysis + action recommendations | ||
| Intelligent system enhancement | Outputs Smart Insights through APIs and embeds them into business systems or applications |
Prerequisites
-
Upgrade to version
7.0or later to use Dashboard Insights, and to version7.3or later to configure multiple insight logics.NoteA matching hotfix version is also required for Dashboard Insights to work properly. If you are unsure whether your current version supports it, contact your Guandata sales representative or customer success manager.
-
License activation and LLM service configuration have been completed.
Dashboard Editors
Enable Dashboard Insights
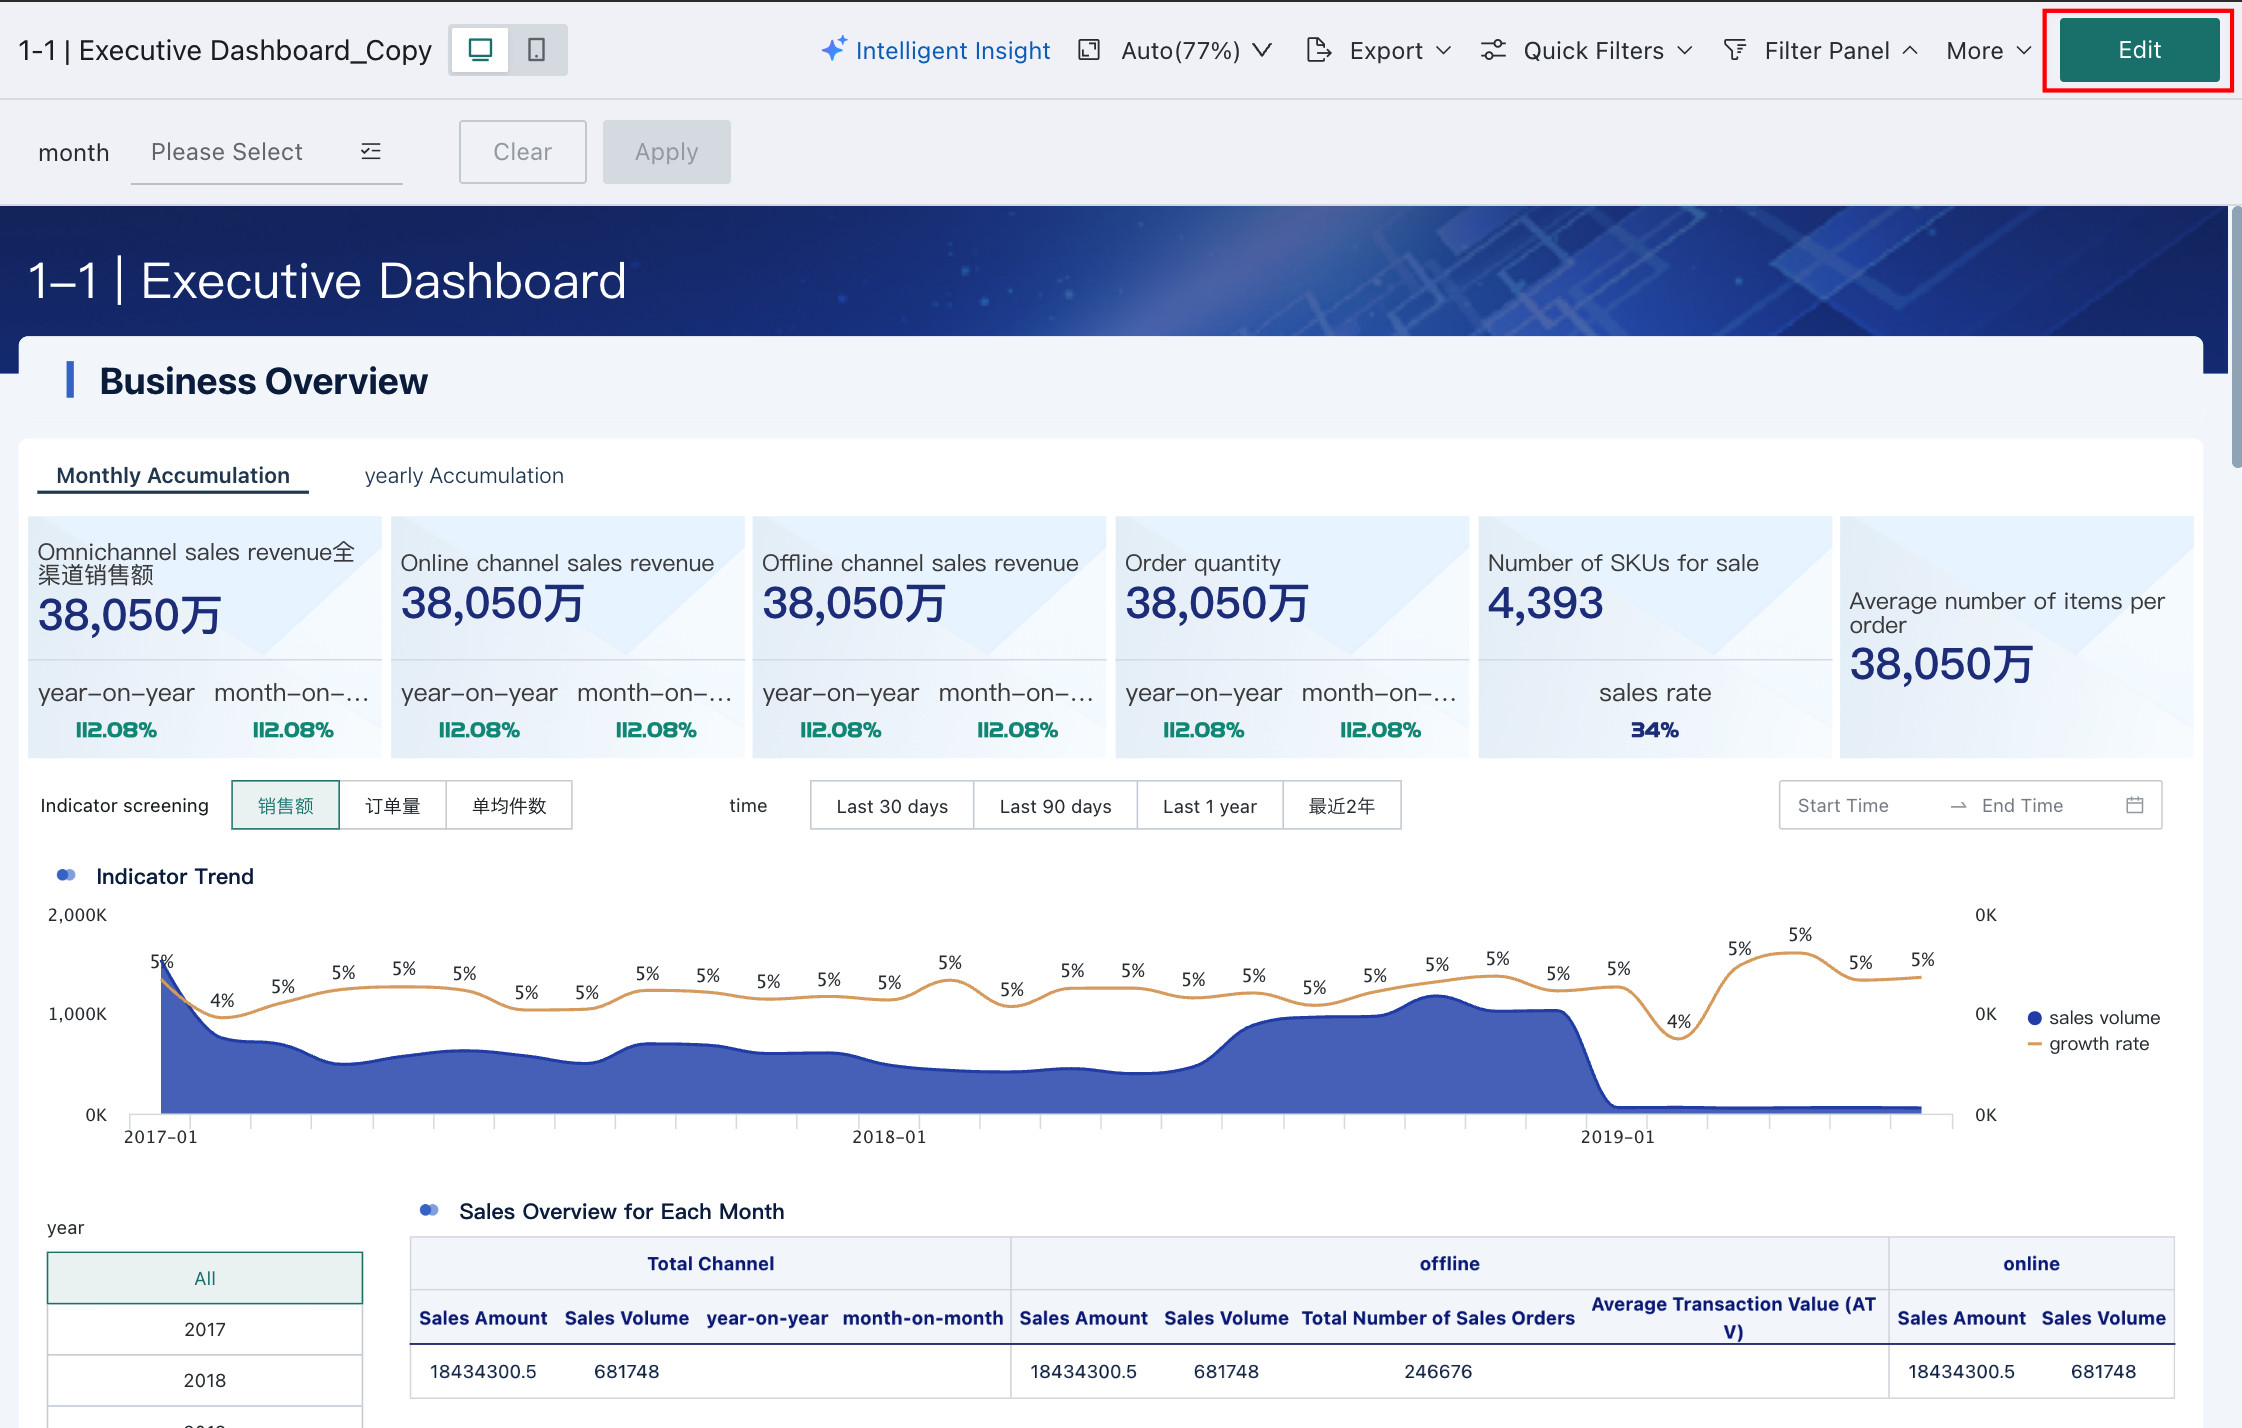
-
On the dashboard home page, click
Editto enter the dashboard editing page.
-
Click the
Smart Insightsentry. The Smart Insights panel opens on the right.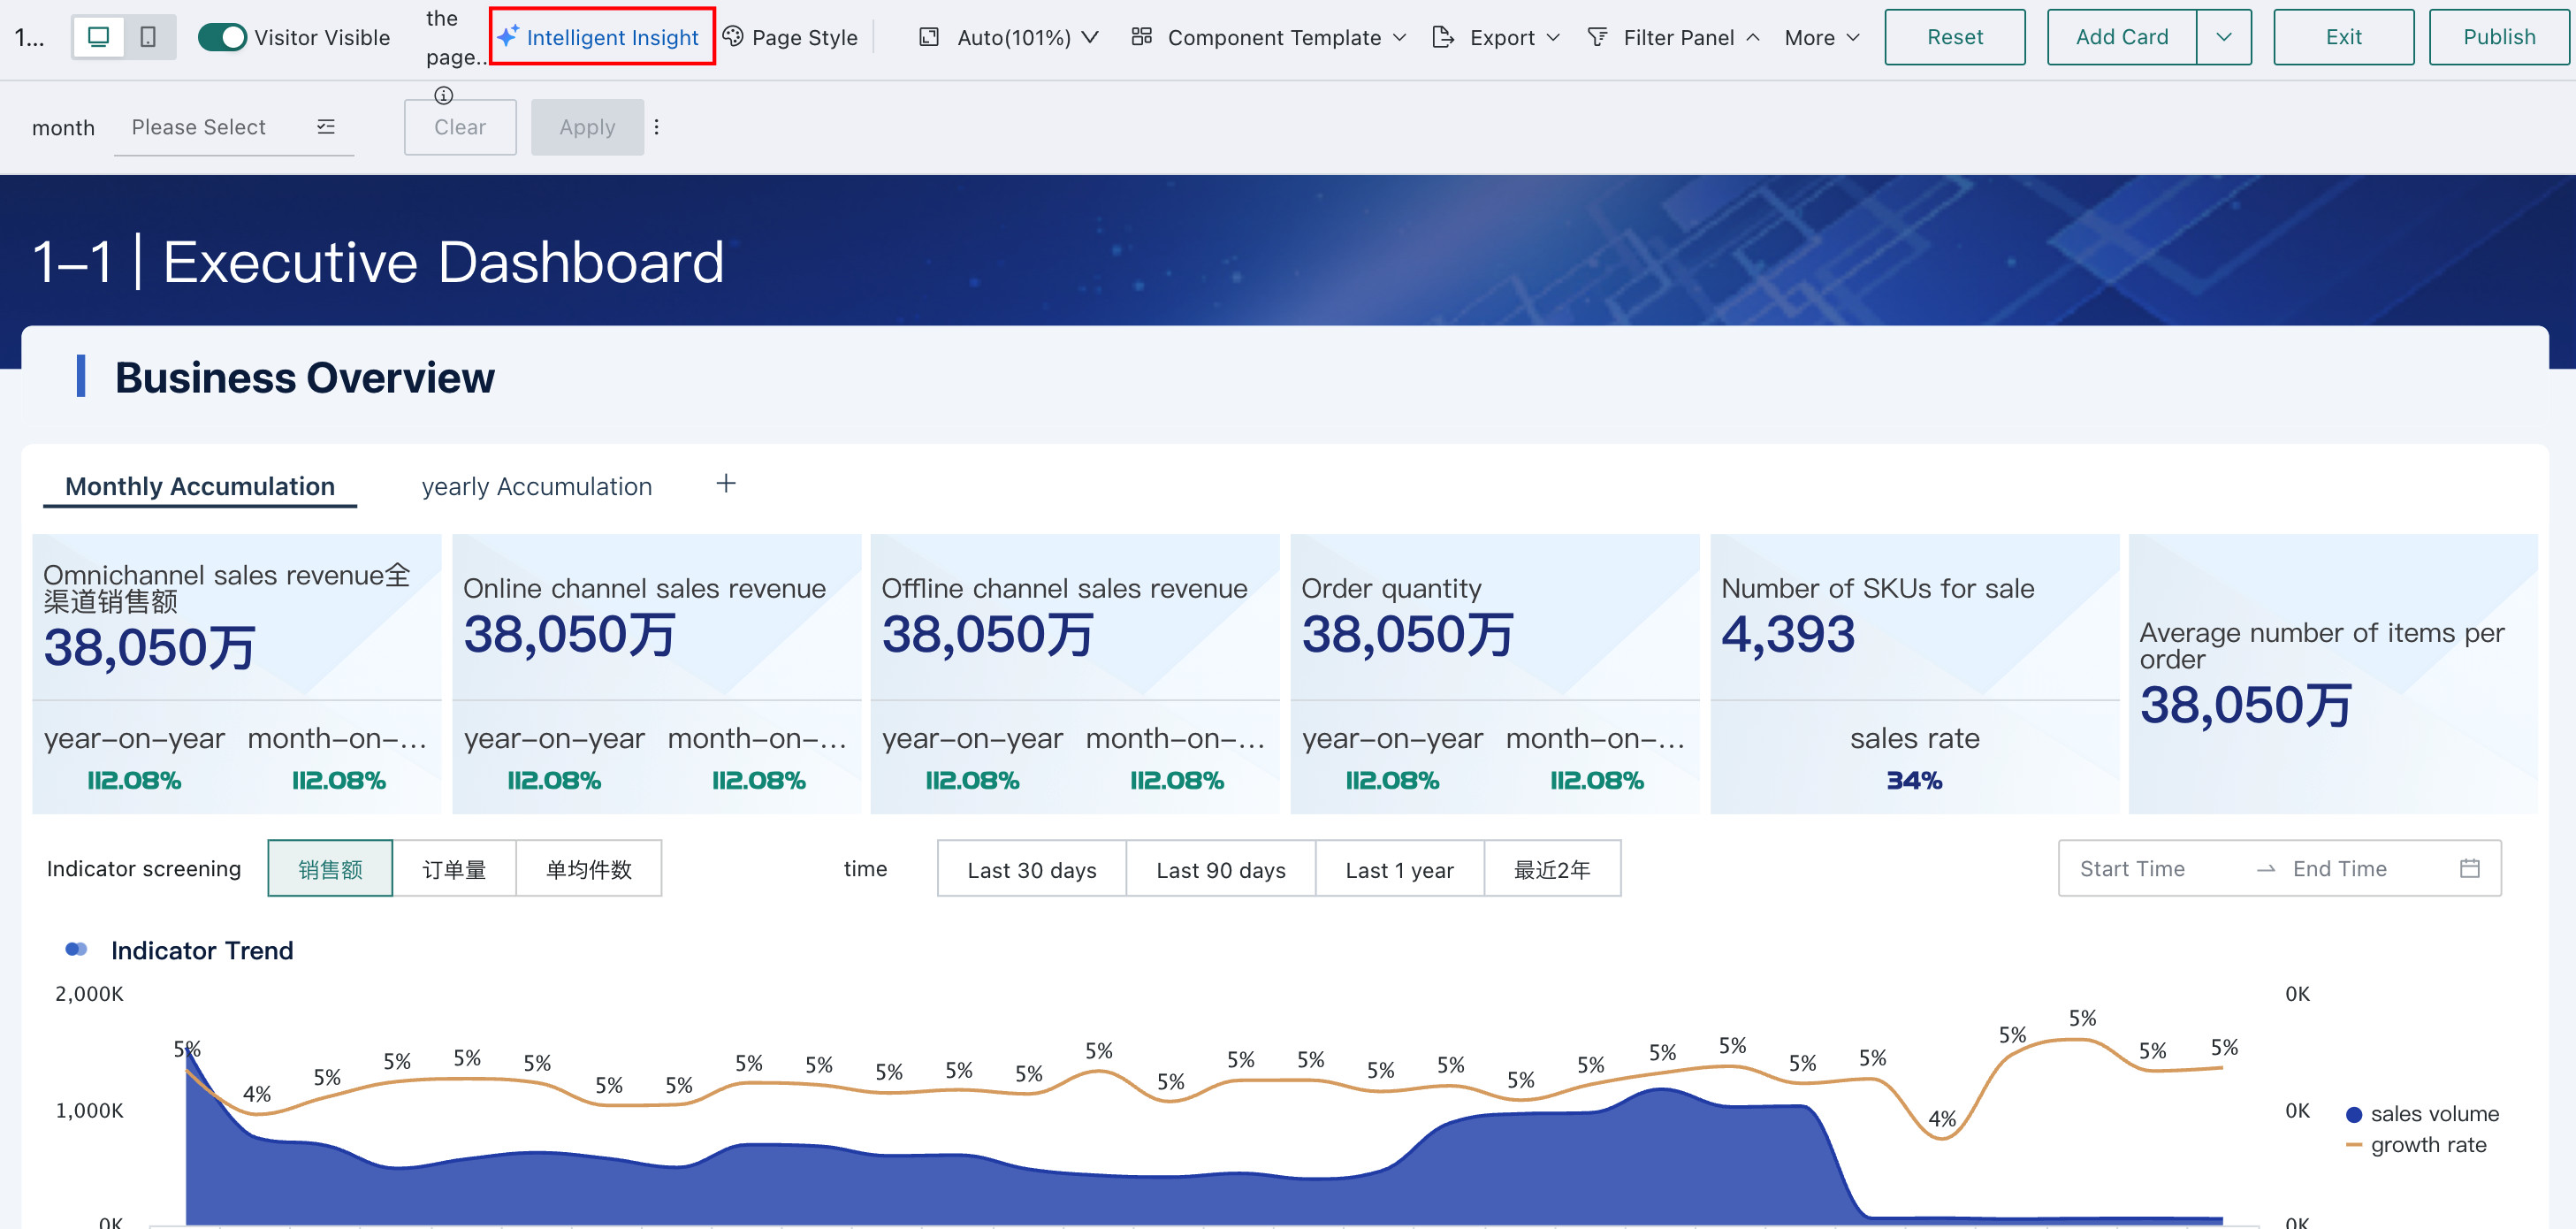
-
Click
SettingsorEnableto enter the Smart Insights configuration page.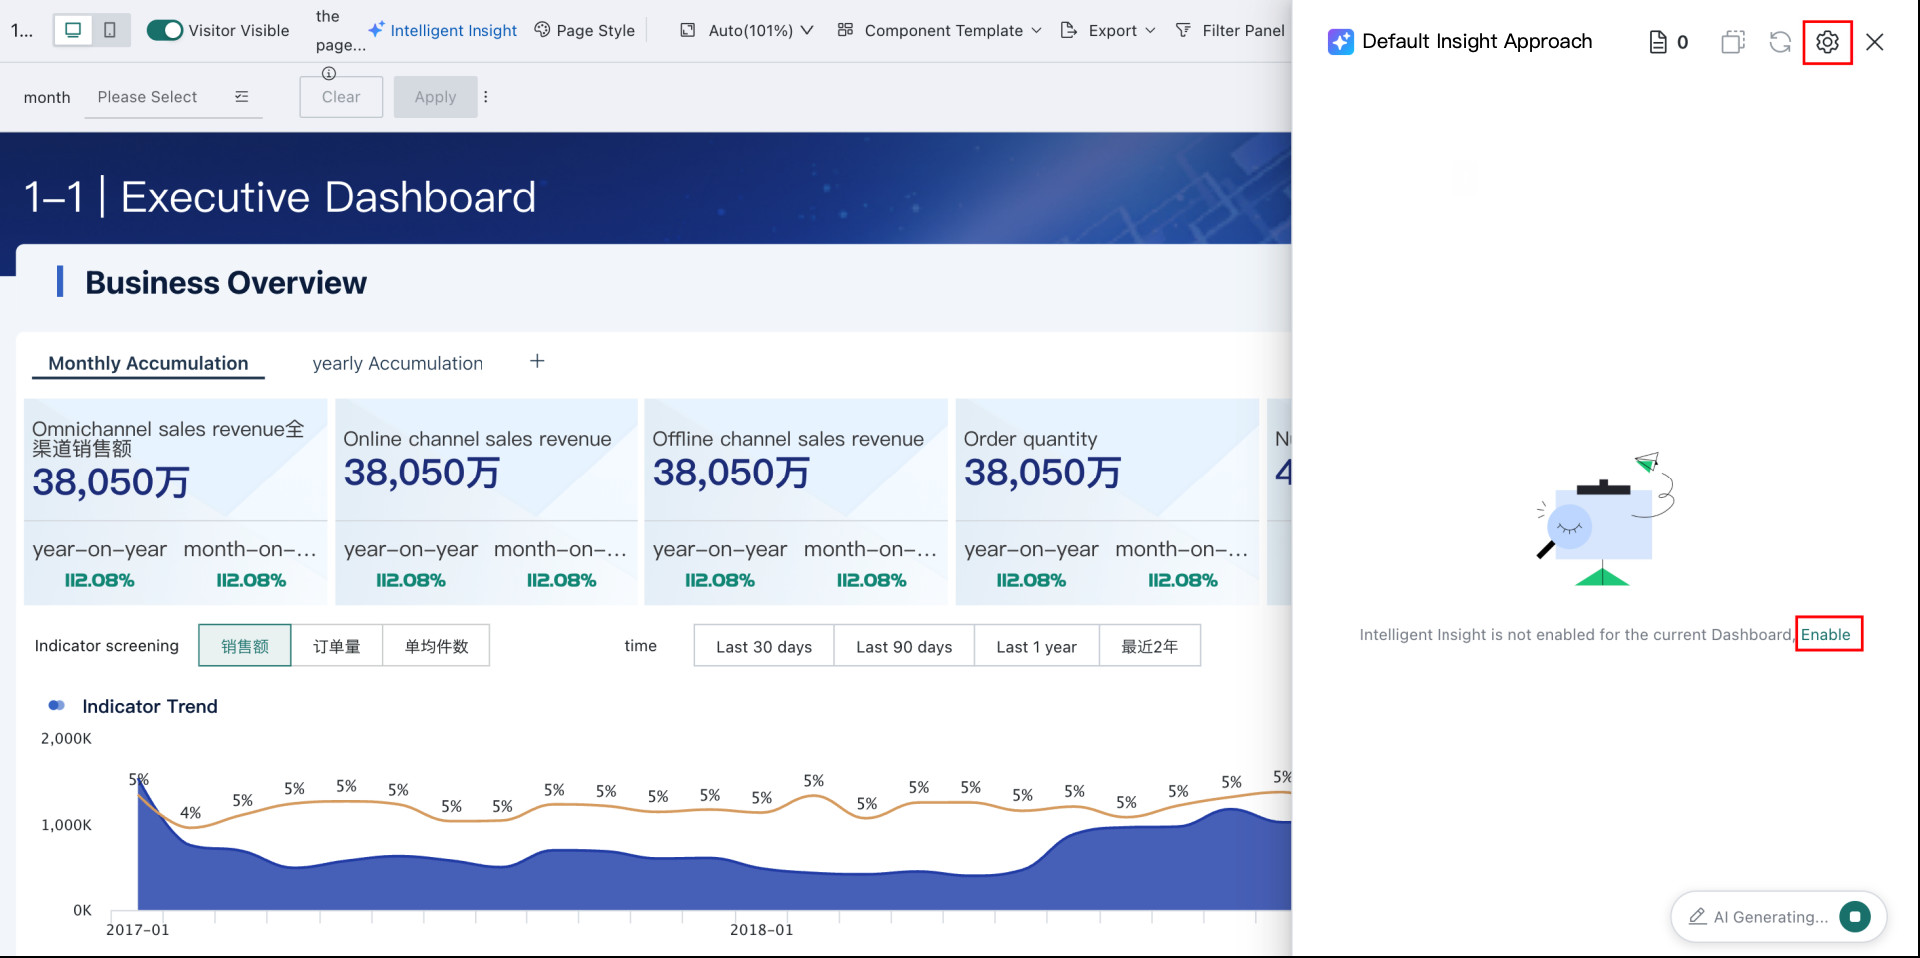
-
Configure items such as Insight Prompts and LLM Service Selection, then turn on the
Smart Insightsswitch.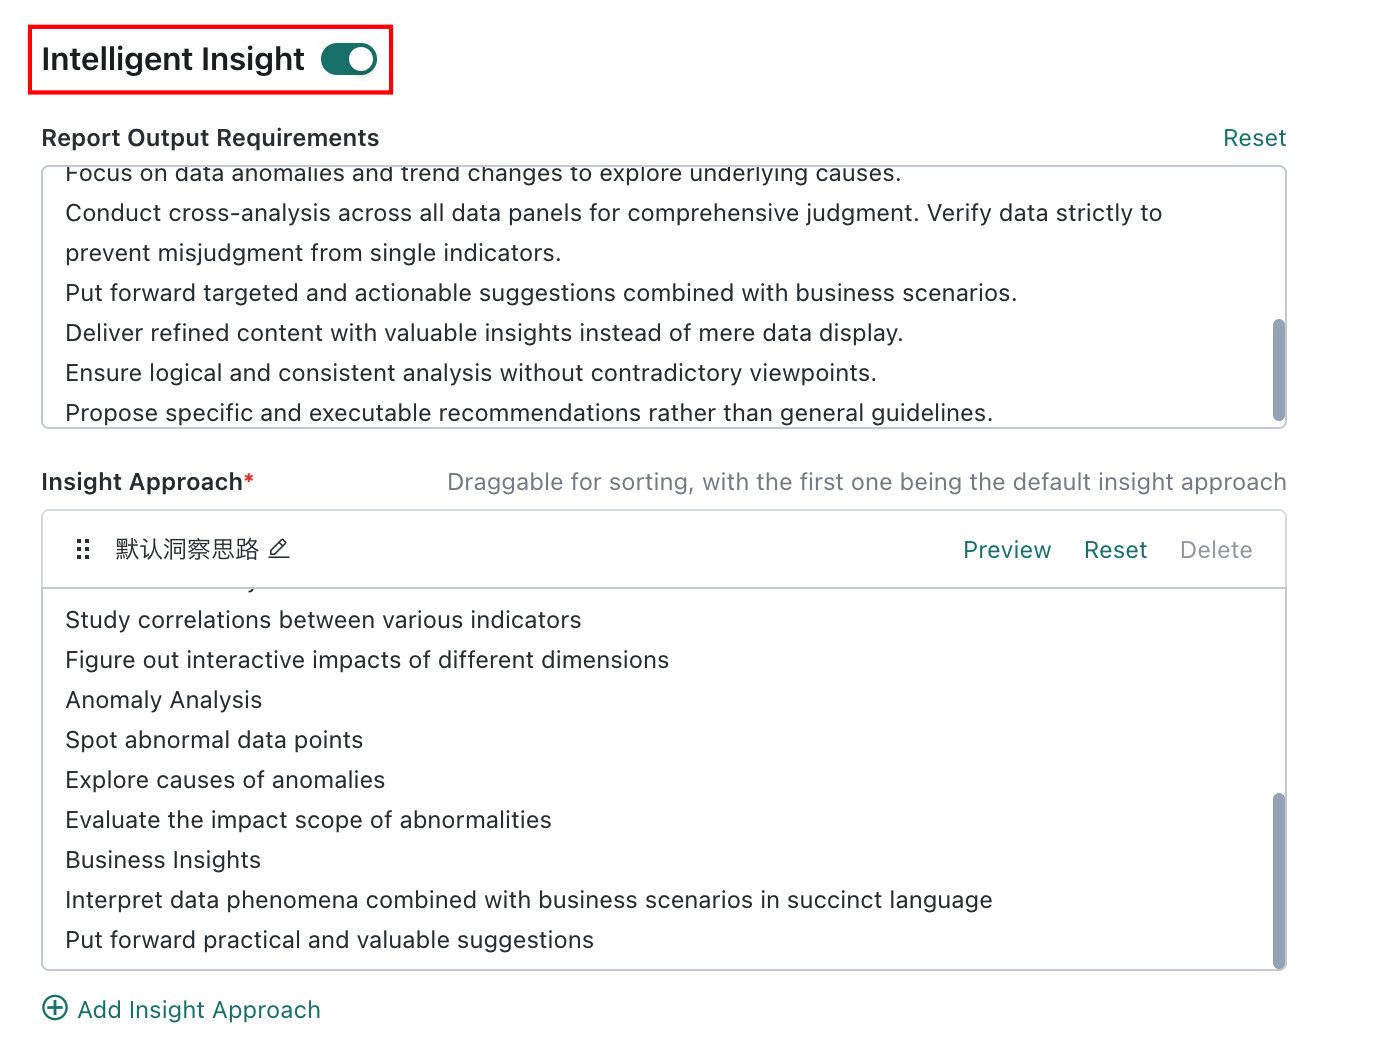
Configure Insight Prompts
Dashboard editors can provide background knowledge for the LLM to generate insights. The quality of the prompt description directly affects the accuracy and usefulness of the generated insights.
For guidance on writing better prompts, see Prompt Writing Best Practices.
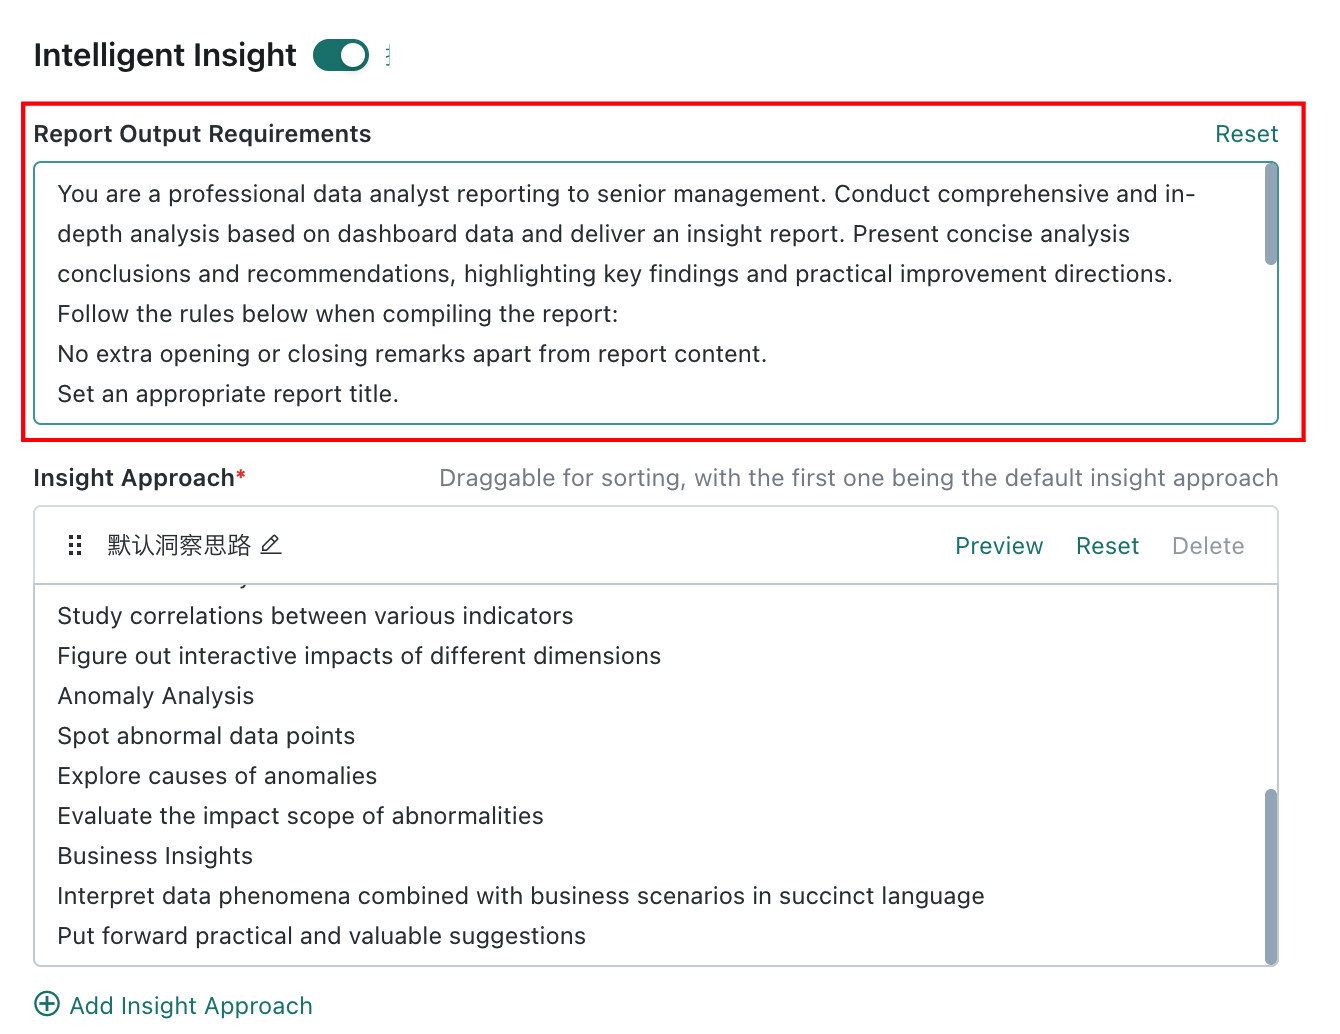
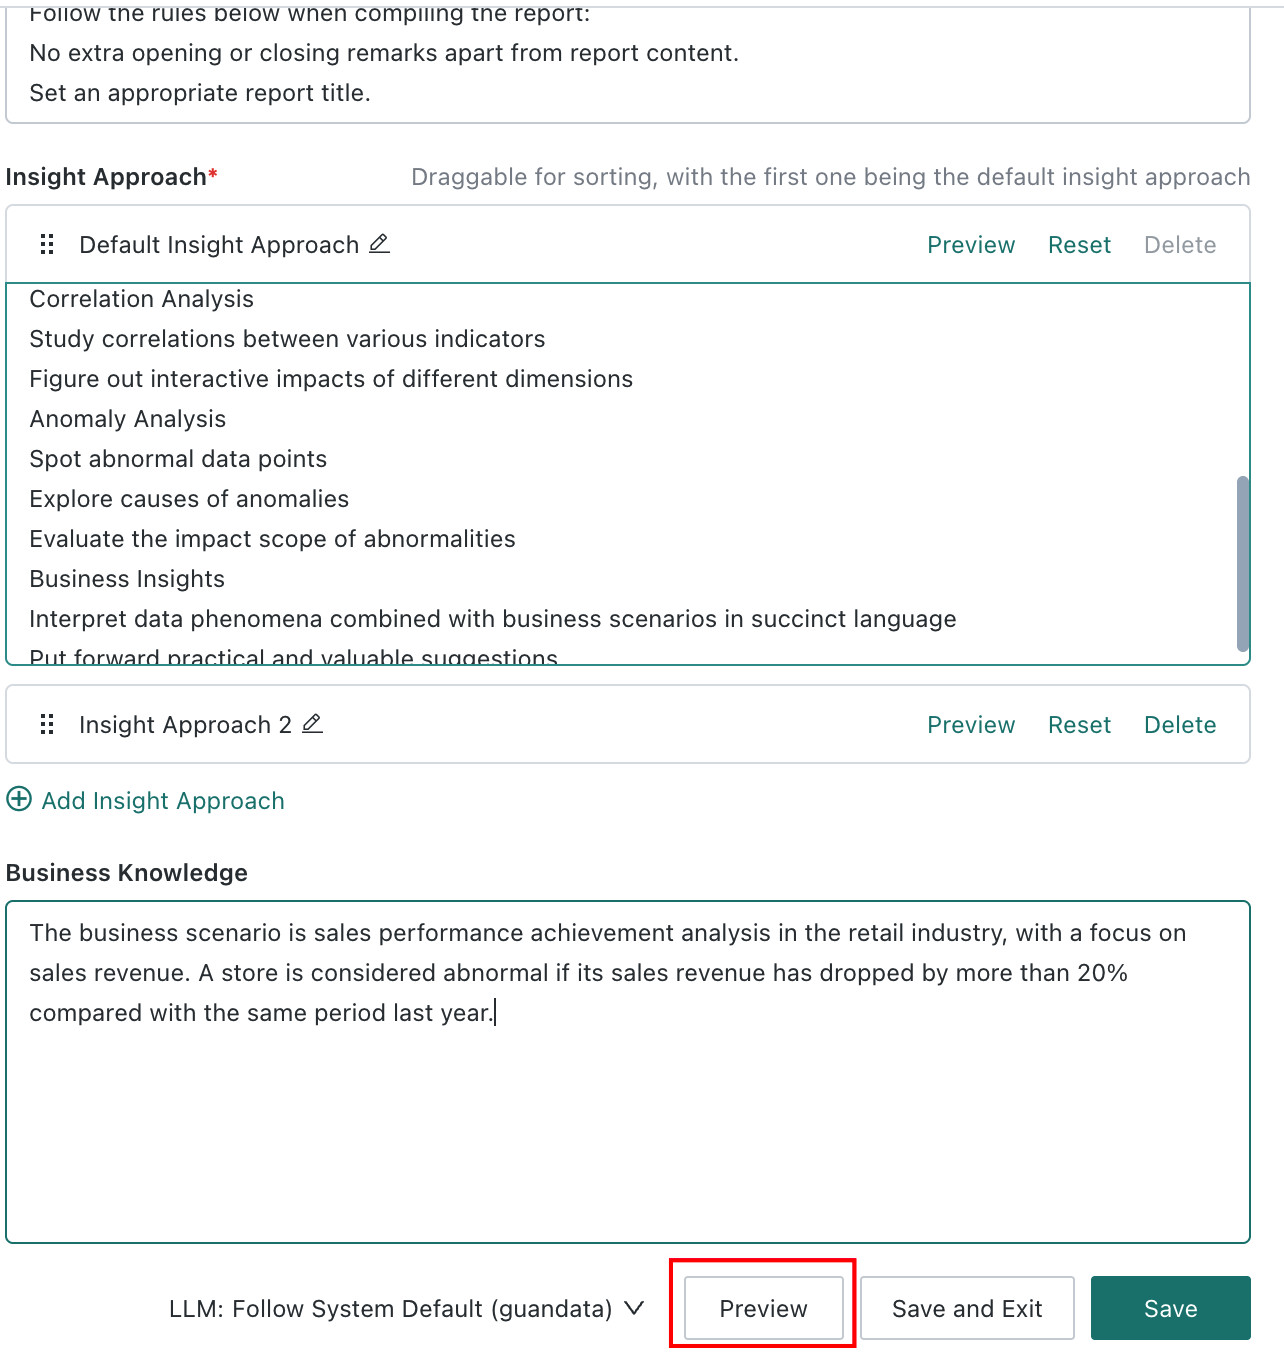
Configure Output Requirements
Define the writing rules for the insight report. The system provides a general default configuration, which can be used as-is or fine-tuned slightly.
Configure Insight Logic
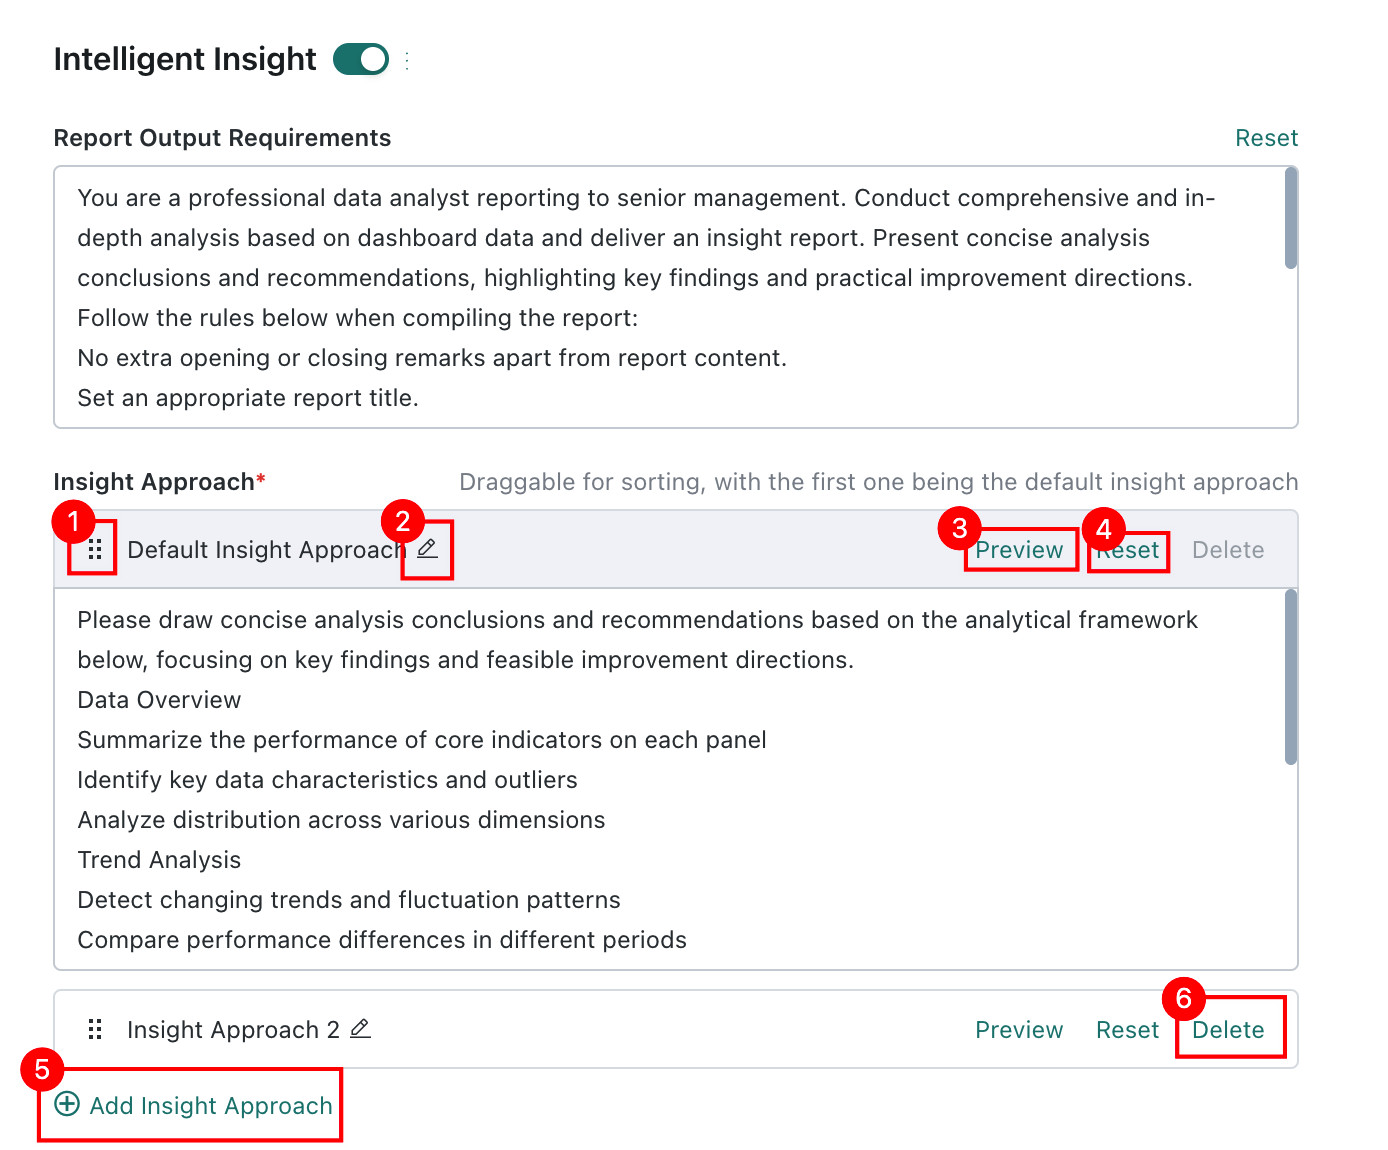
Feature description
Insight logic defines the analytical framework used by Smart Insights. It is recommended that you fine-tune it for your business needs. The system provides a default insight logic that you can edit directly.
| No. | Configuration Item | Description |
|---|---|---|
| 1 | Drag / Expand Handle | |
| 2 | Edit Button | Click to rename the insight logic so different analytical frameworks for different scenarios or roles can be distinguished, for example Frontline Insight Logic or Executive Insight Logic |
| 3 | Preview | Click to preview the result generated by the current insight logic. Each insight logic supports its own preview |
| 4 | Reset | Restores the current insight logic to the system default analytical framework |
| 5 | Add Insight Logic | If different roles or scenarios require dedicated analytical frameworks, click to add a new insight logic. Up to 5 insight logics are supported |
| 6 | Delete | Removes the currently selected insight logic. The default insight logic cannot be deleted |
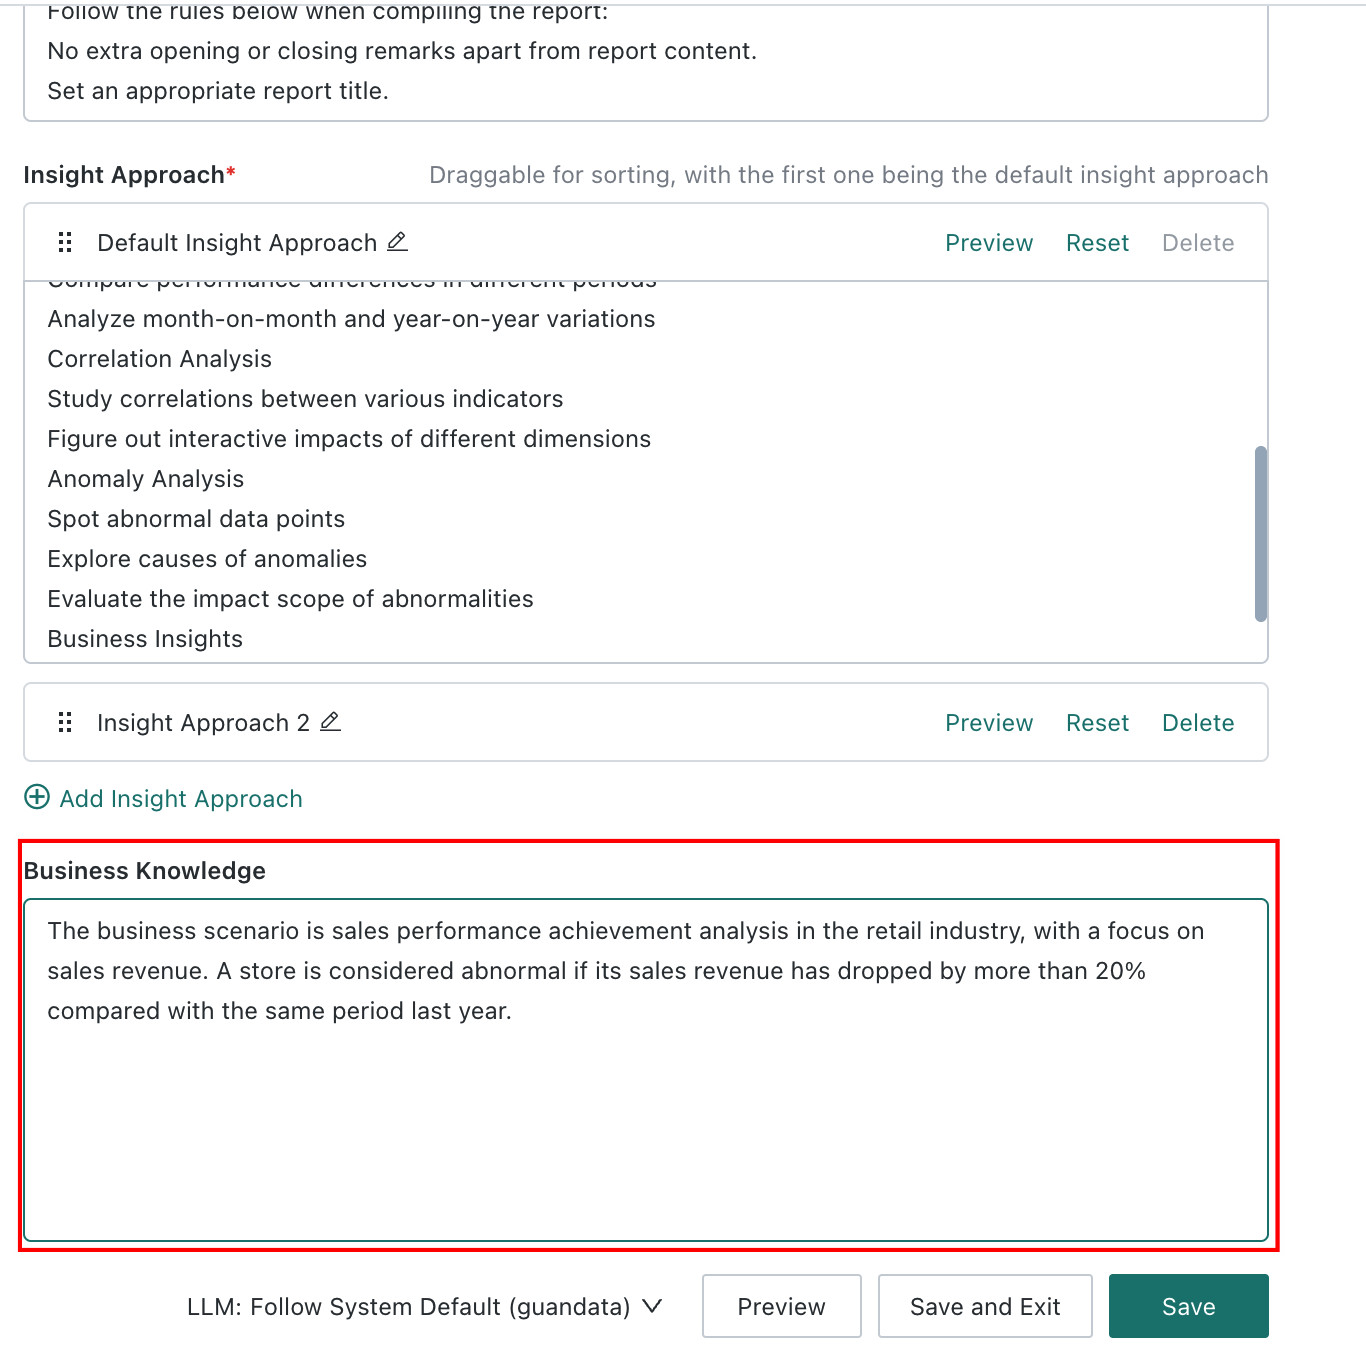
Configure Business Knowledge
Add business knowledge to make Smart Insights fit the real scenario more closely. It is recommended that you customize this carefully and enter dashboard-specific business knowledge. The more precise the background knowledge, the more aligned the generated insight result will be with the actual scenario.
Preview Insight Results
While configuring prompts, you can click Preview at any time to see the generated result.
The preview uses the default insight logic, which is the logic currently ranked first.
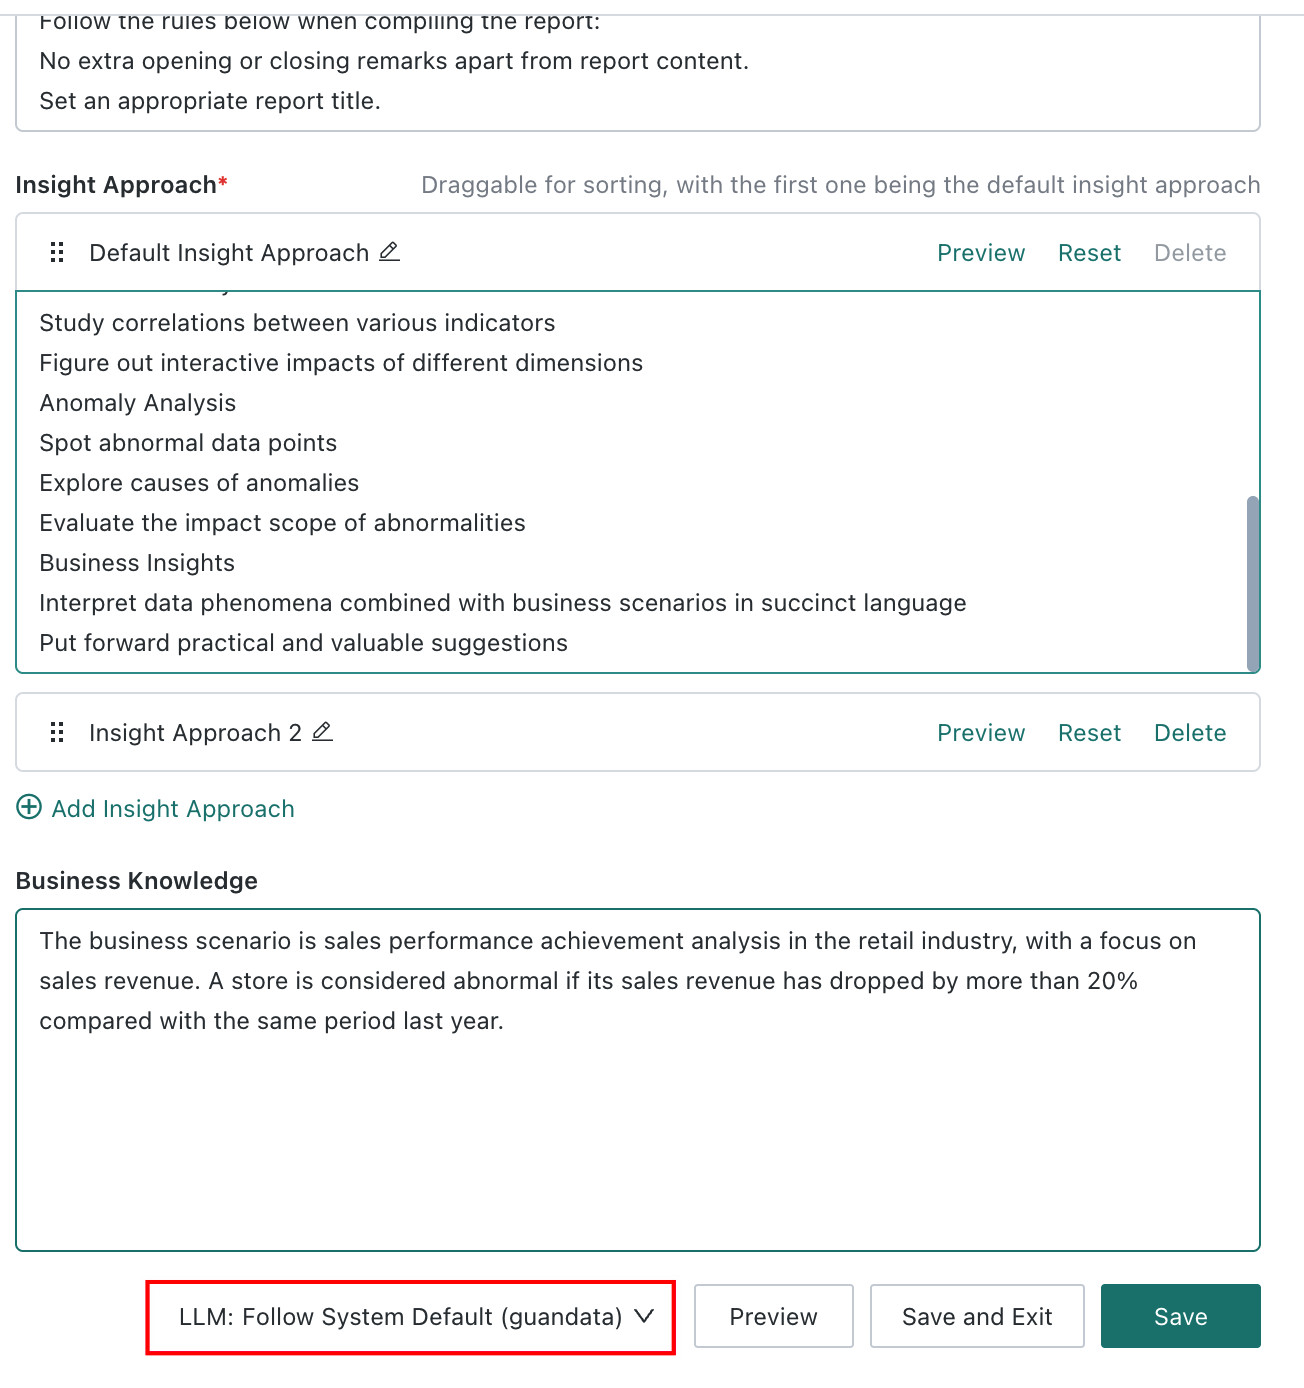
Select an LLM Service
Make sure LLM Service has already been configured in Admin Center > System Integration > LLM Service.
Select the appropriate LLM as needed. If you do not switch it manually, the system uses the default LLM.
Publish Dashboard Insights
-
After finishing prompt and LLM service configuration, turn on the Smart Insights switch and click
Save.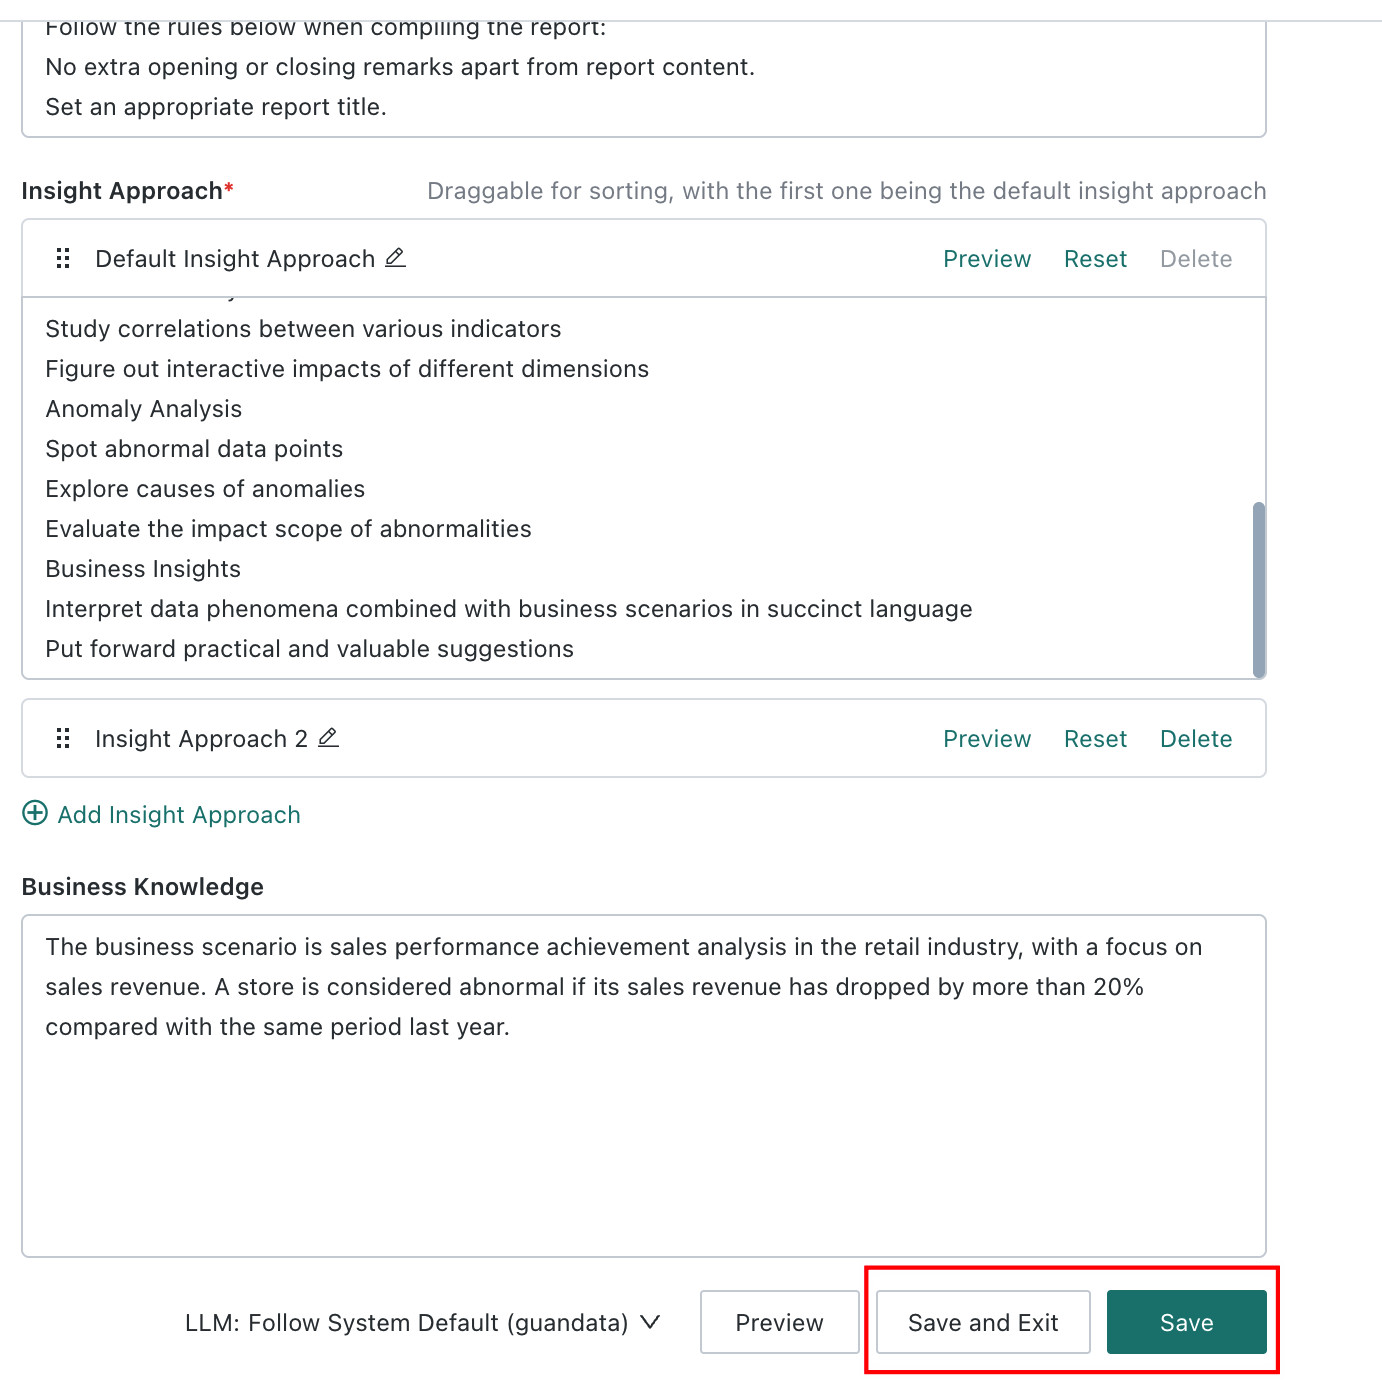
-
Click the dashboard
Publishbutton to publish the current Smart Insights configuration online for dashboard viewers.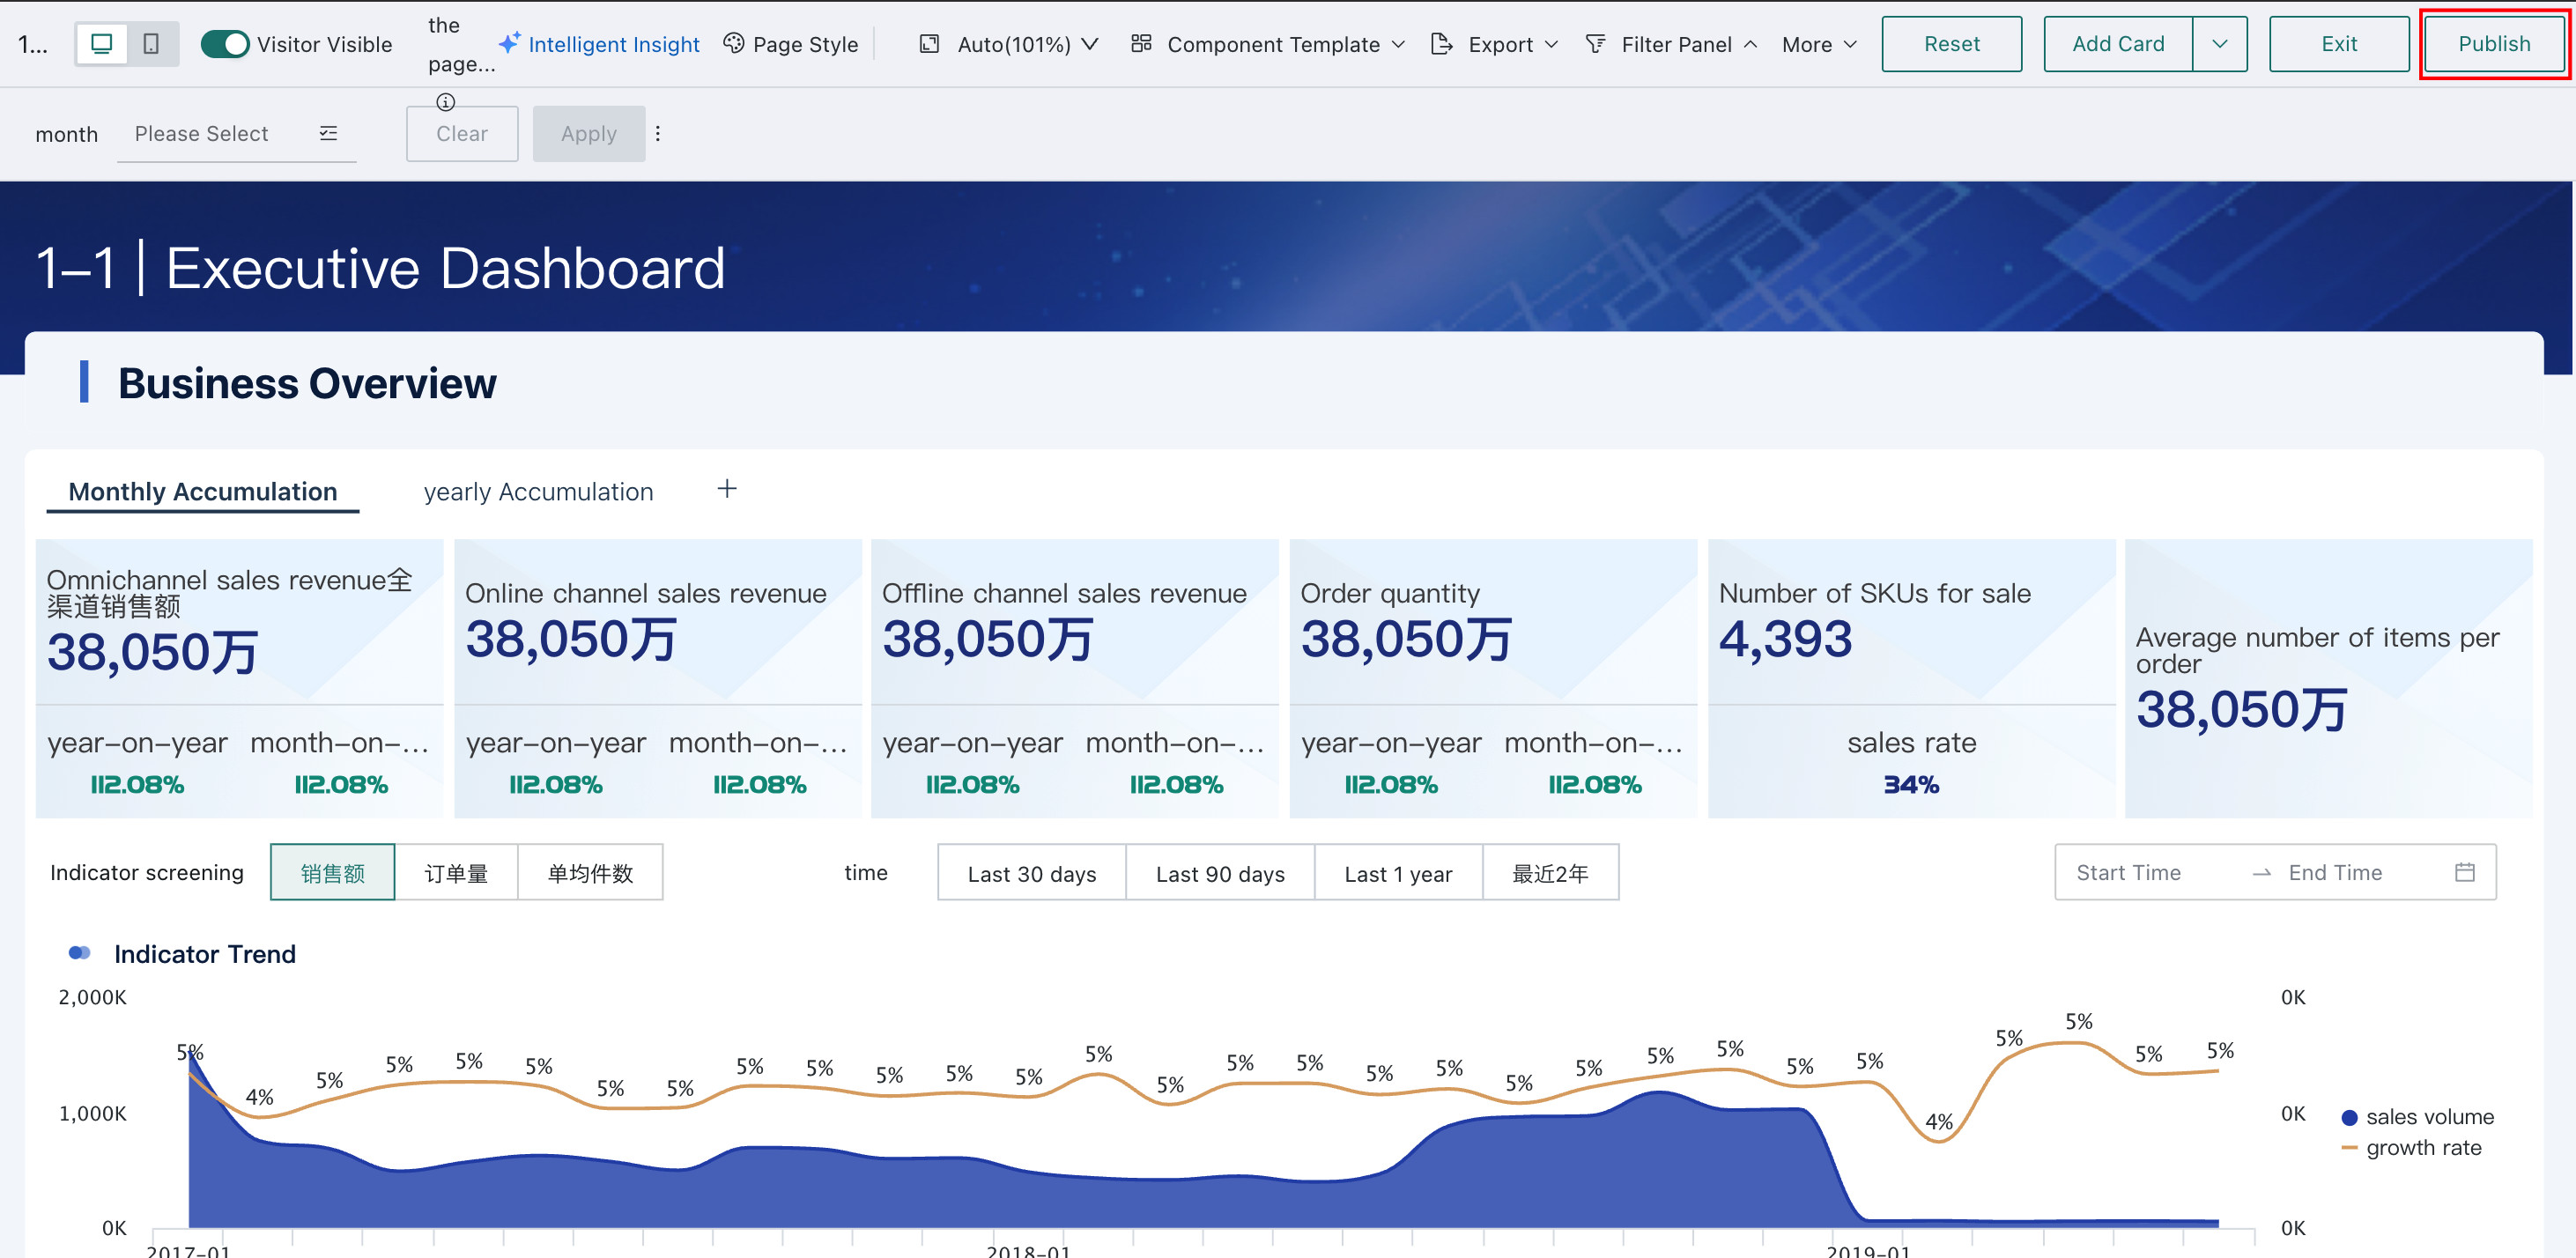
Subscribe to Dashboard Insights
For subscription details, see Dashboard Insights Subscription.
Dashboard Viewers
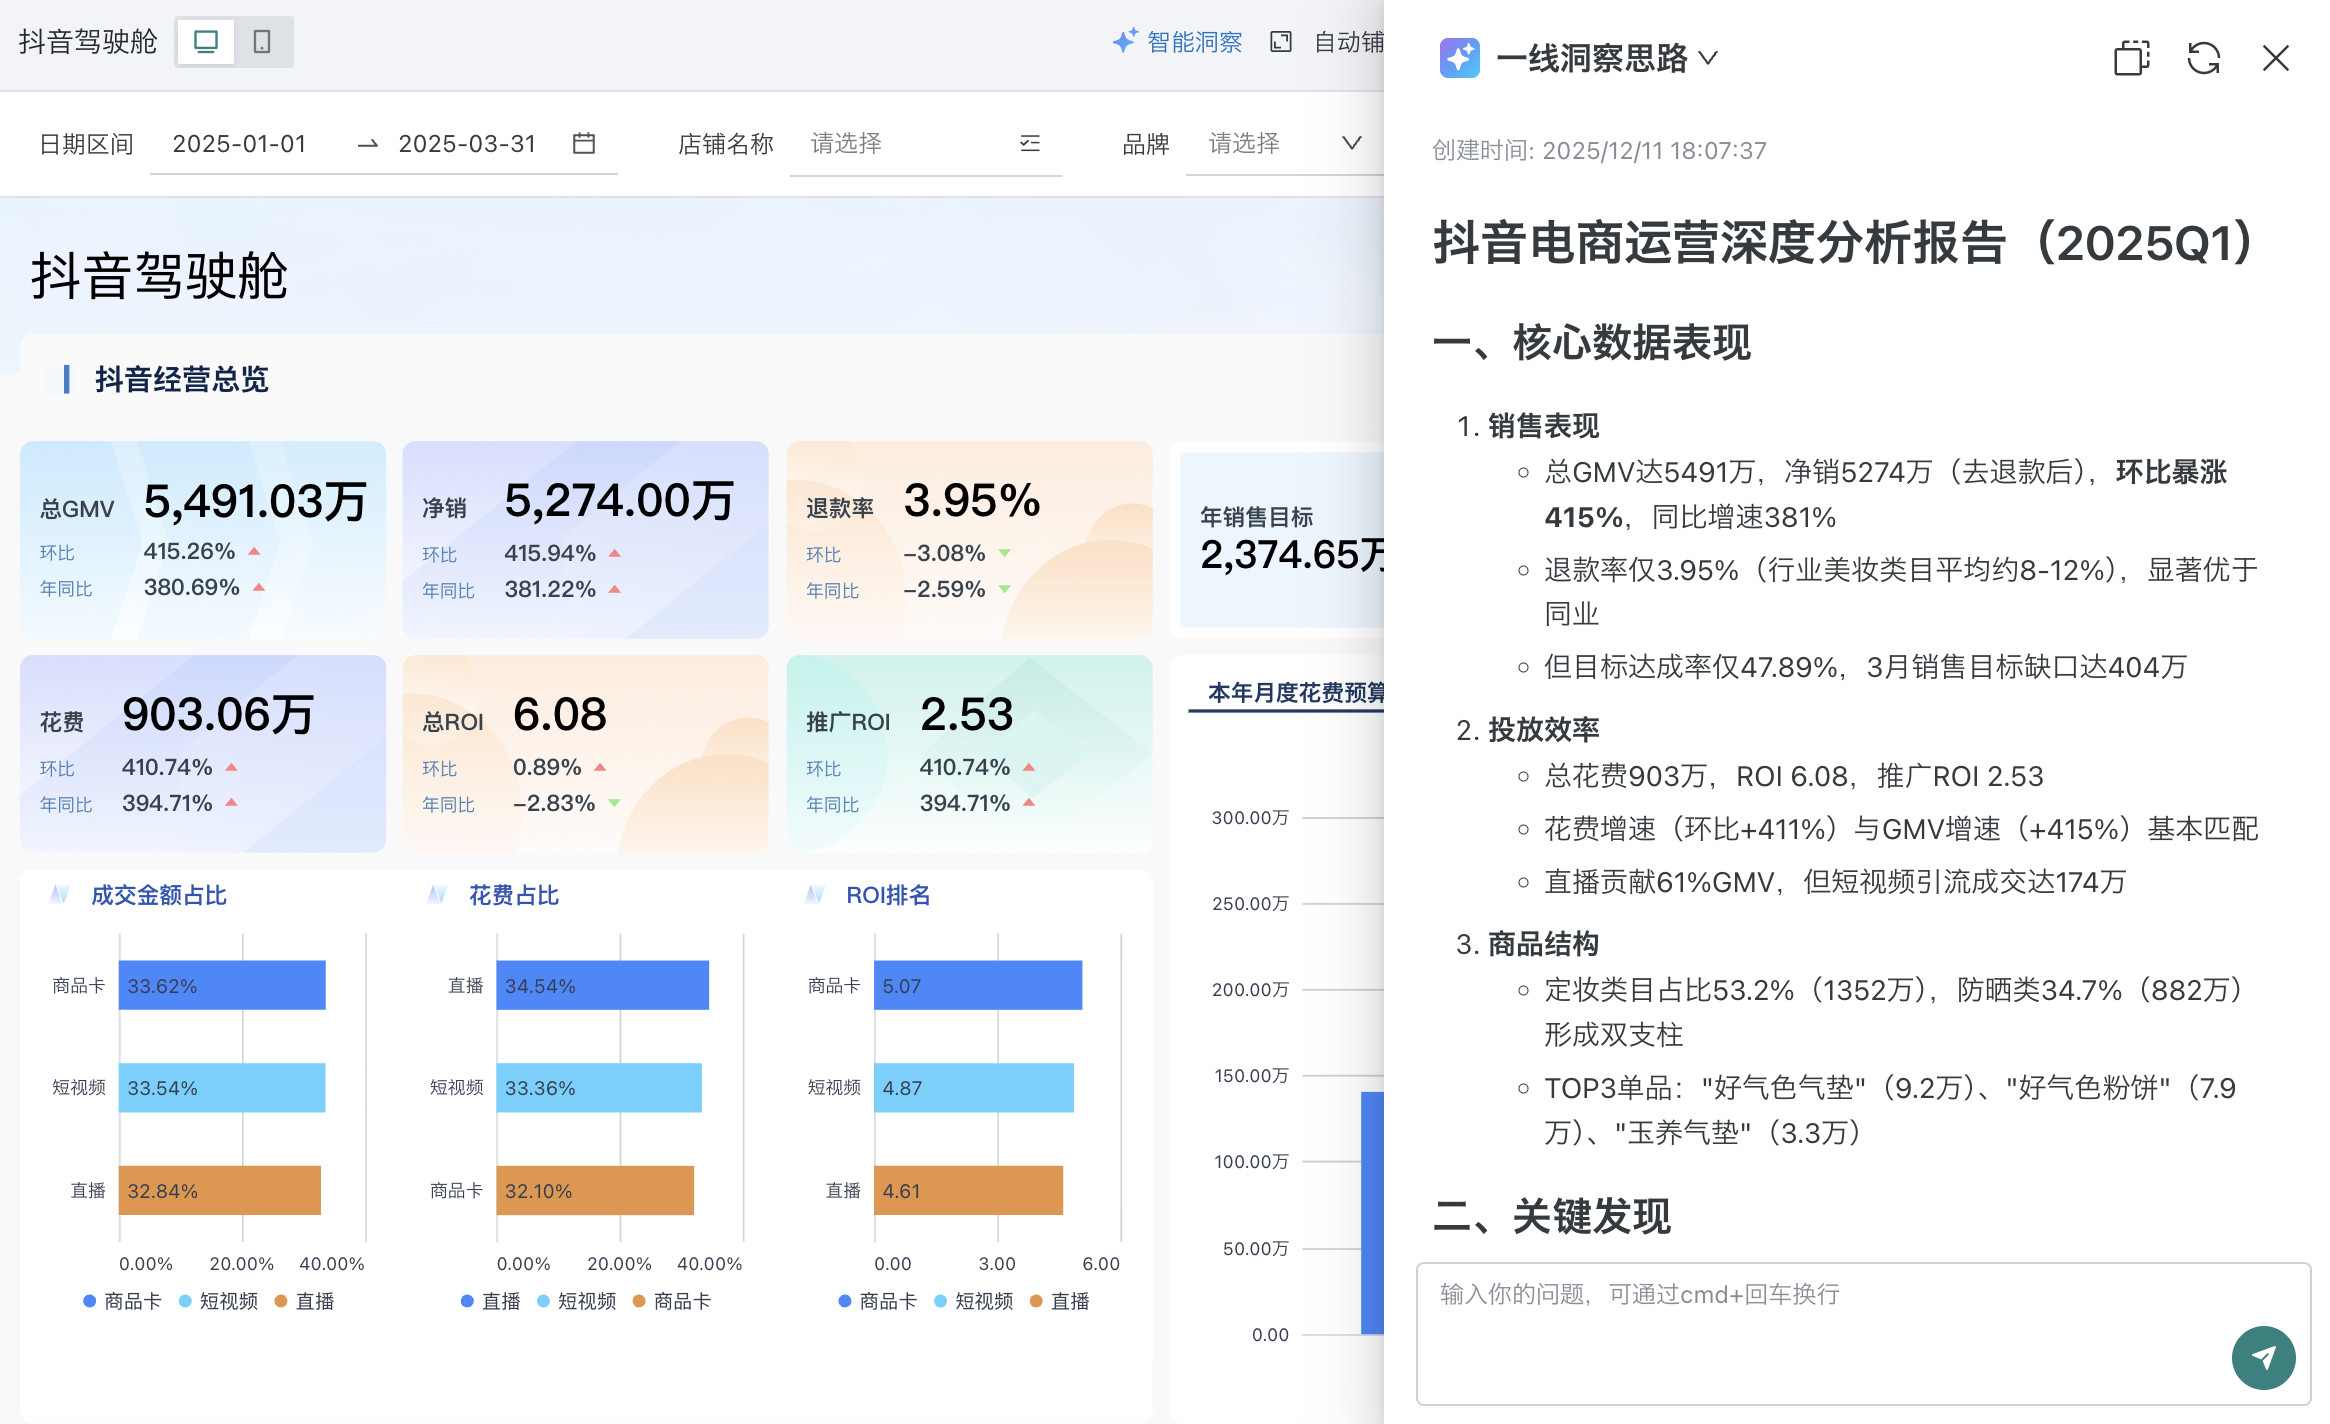
View Insight Conclusions
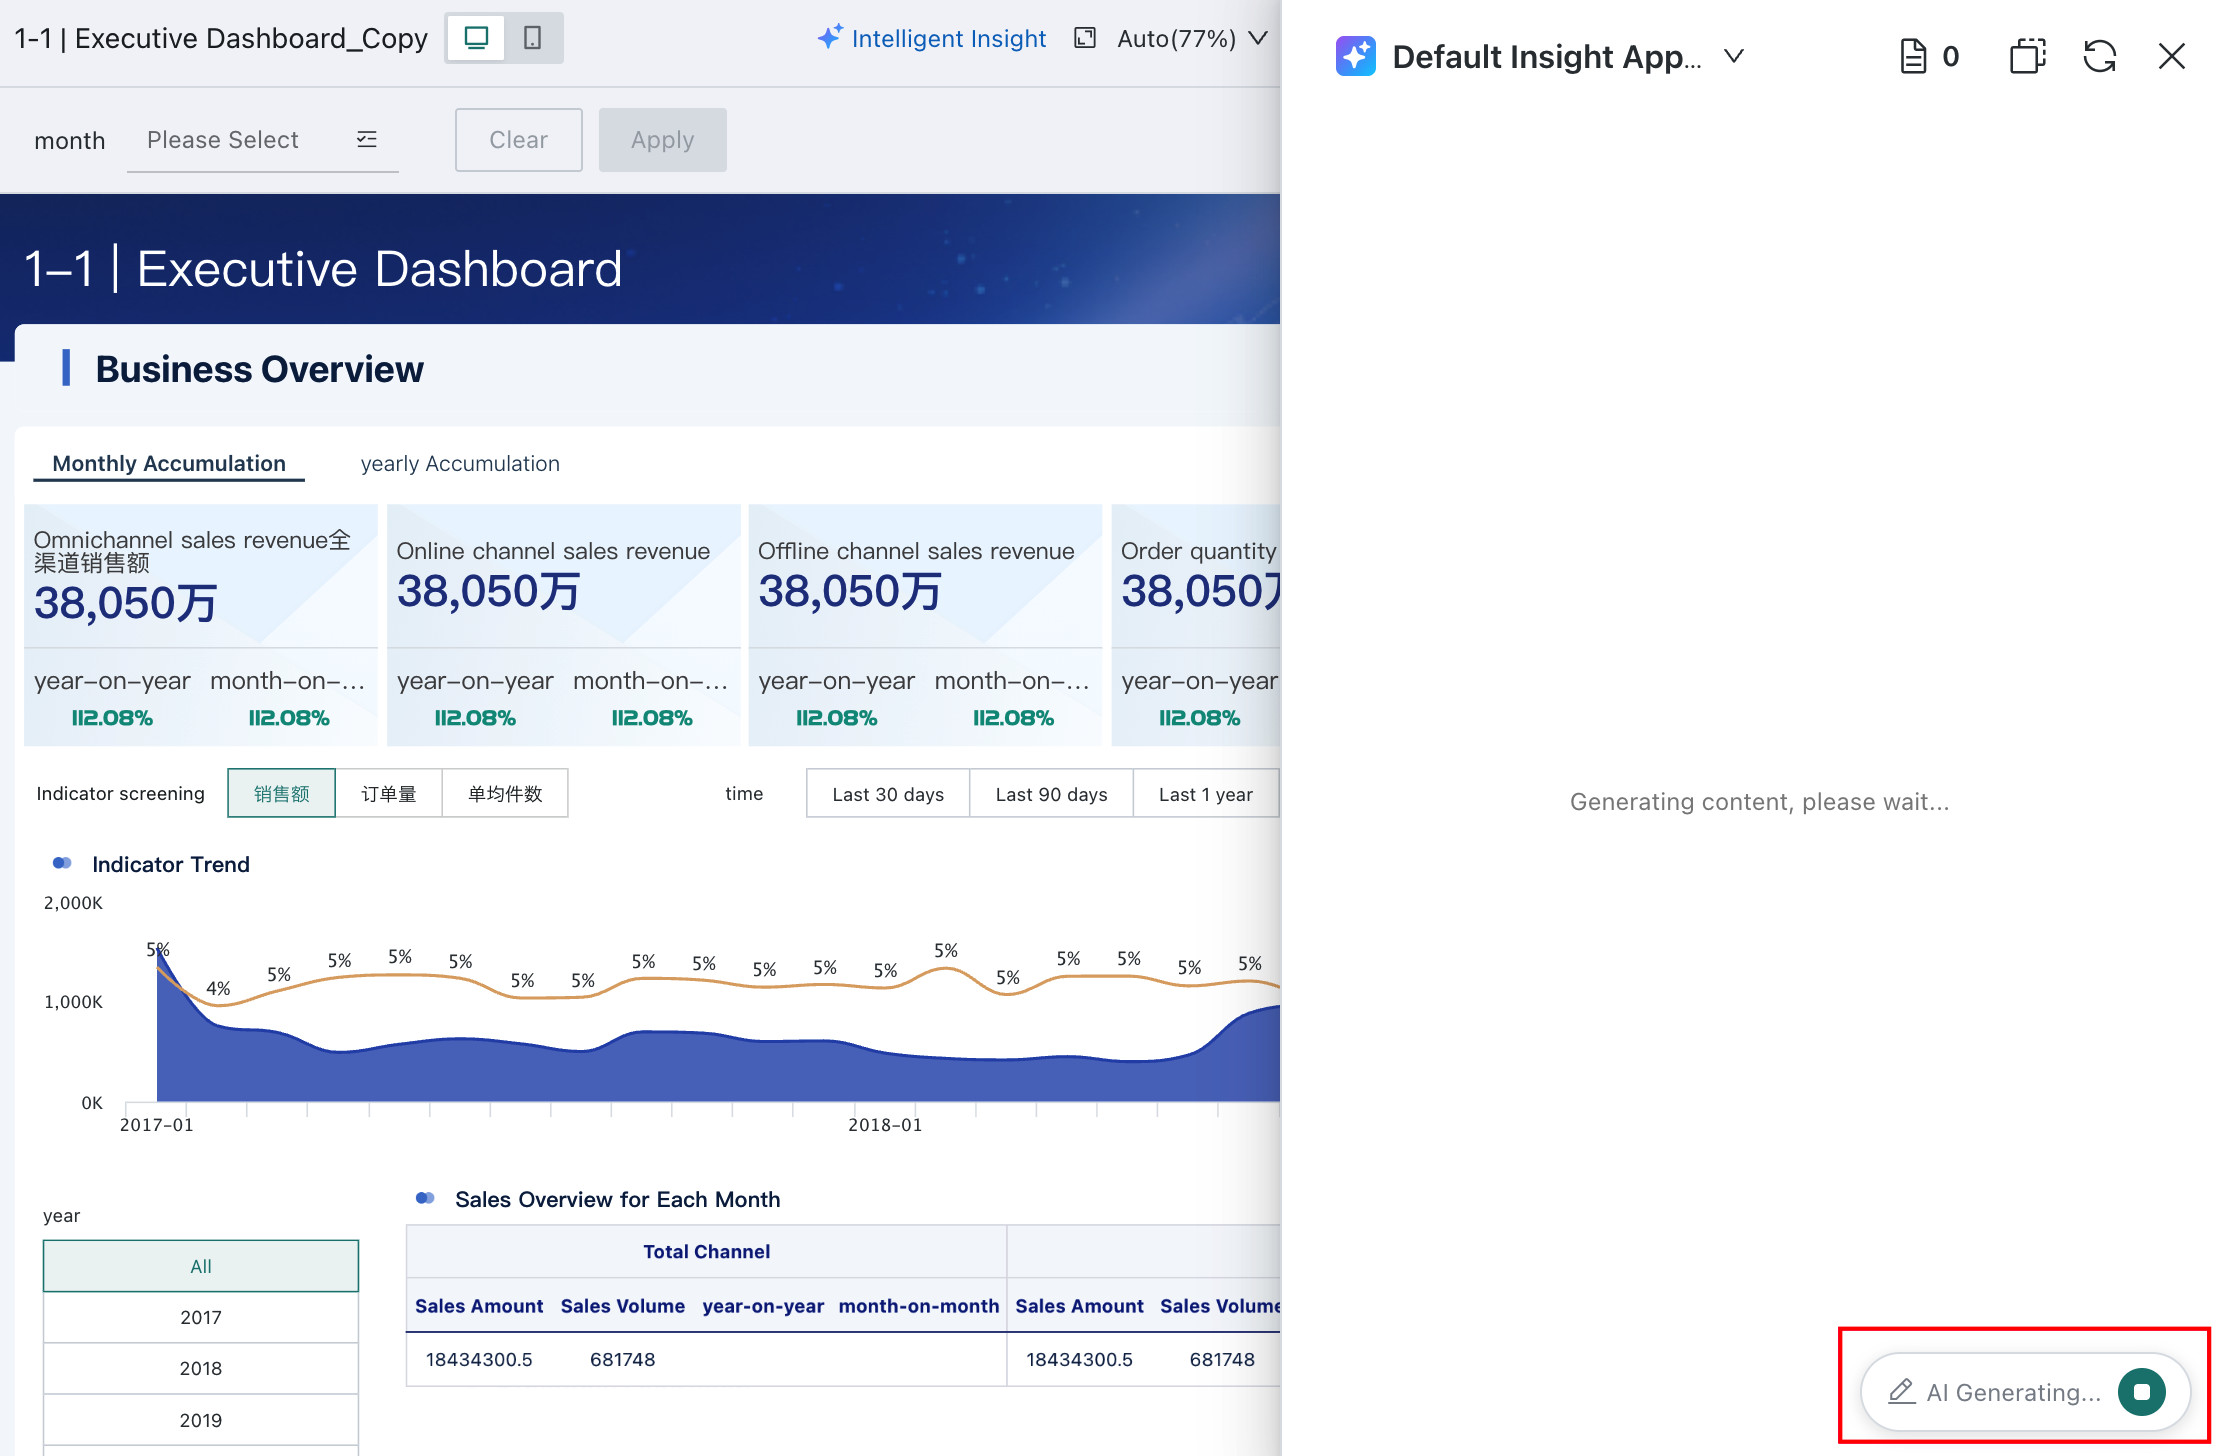
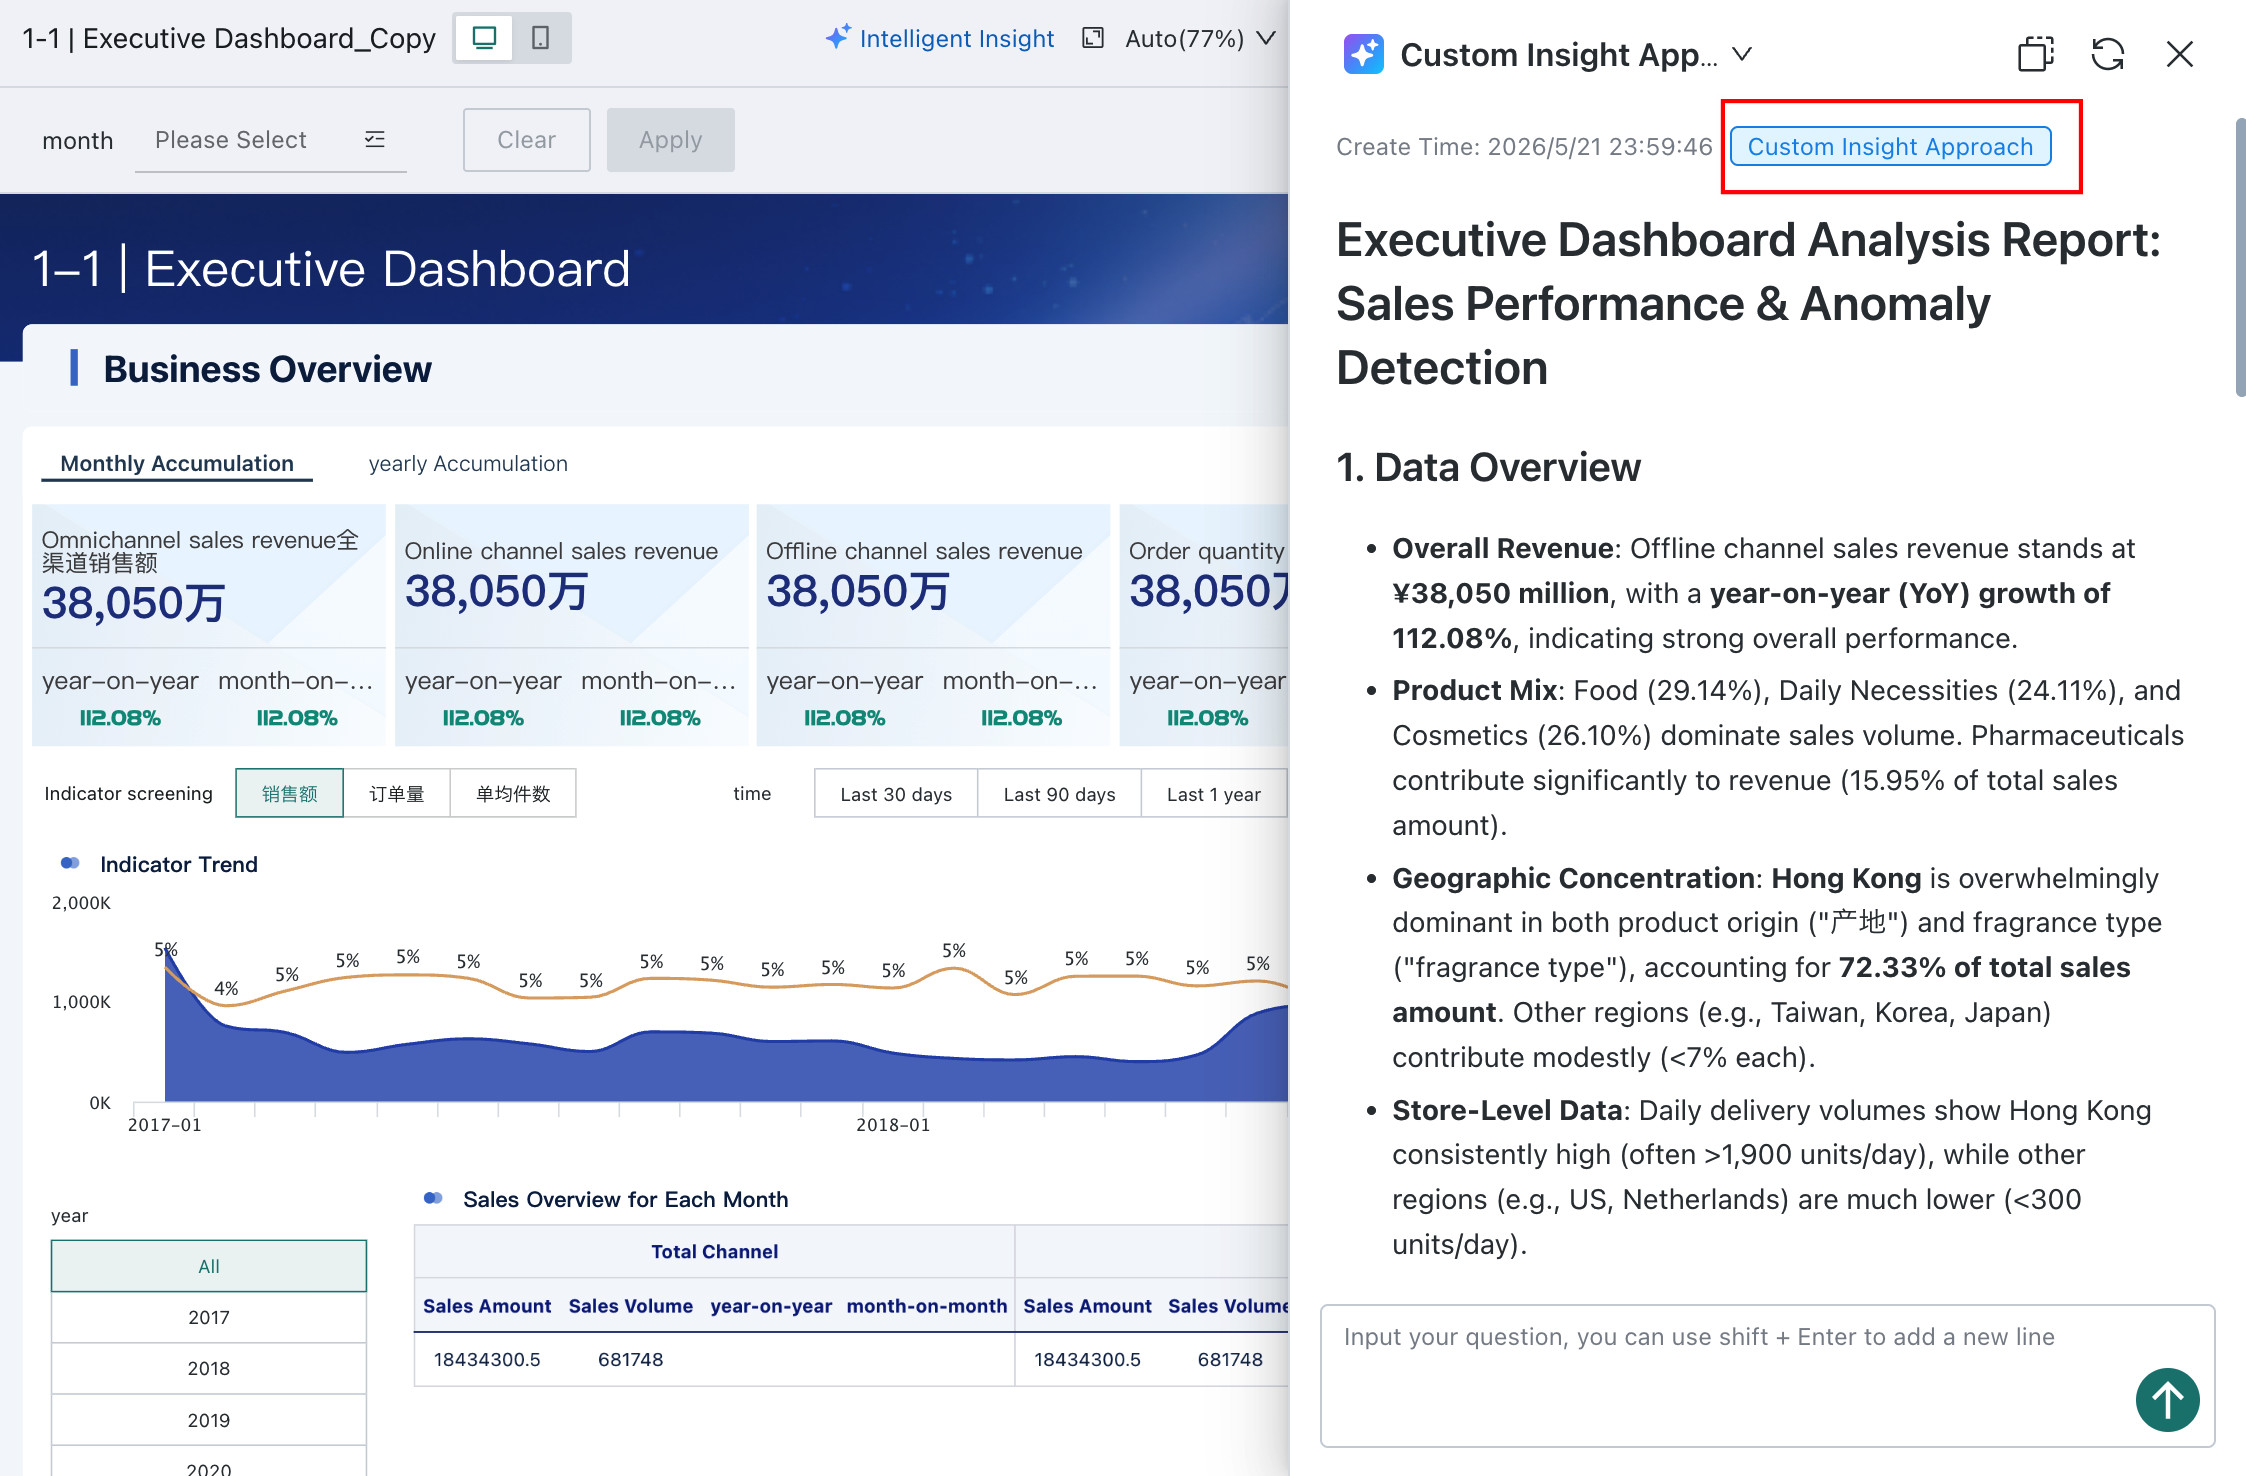
For dashboards with Smart Insights enabled, clicking Smart Insights prompts the LLM to analyze the entire dashboard data in depth. Based on the background knowledge provided by the dashboard editor, it generates concise conclusions and recommendations.
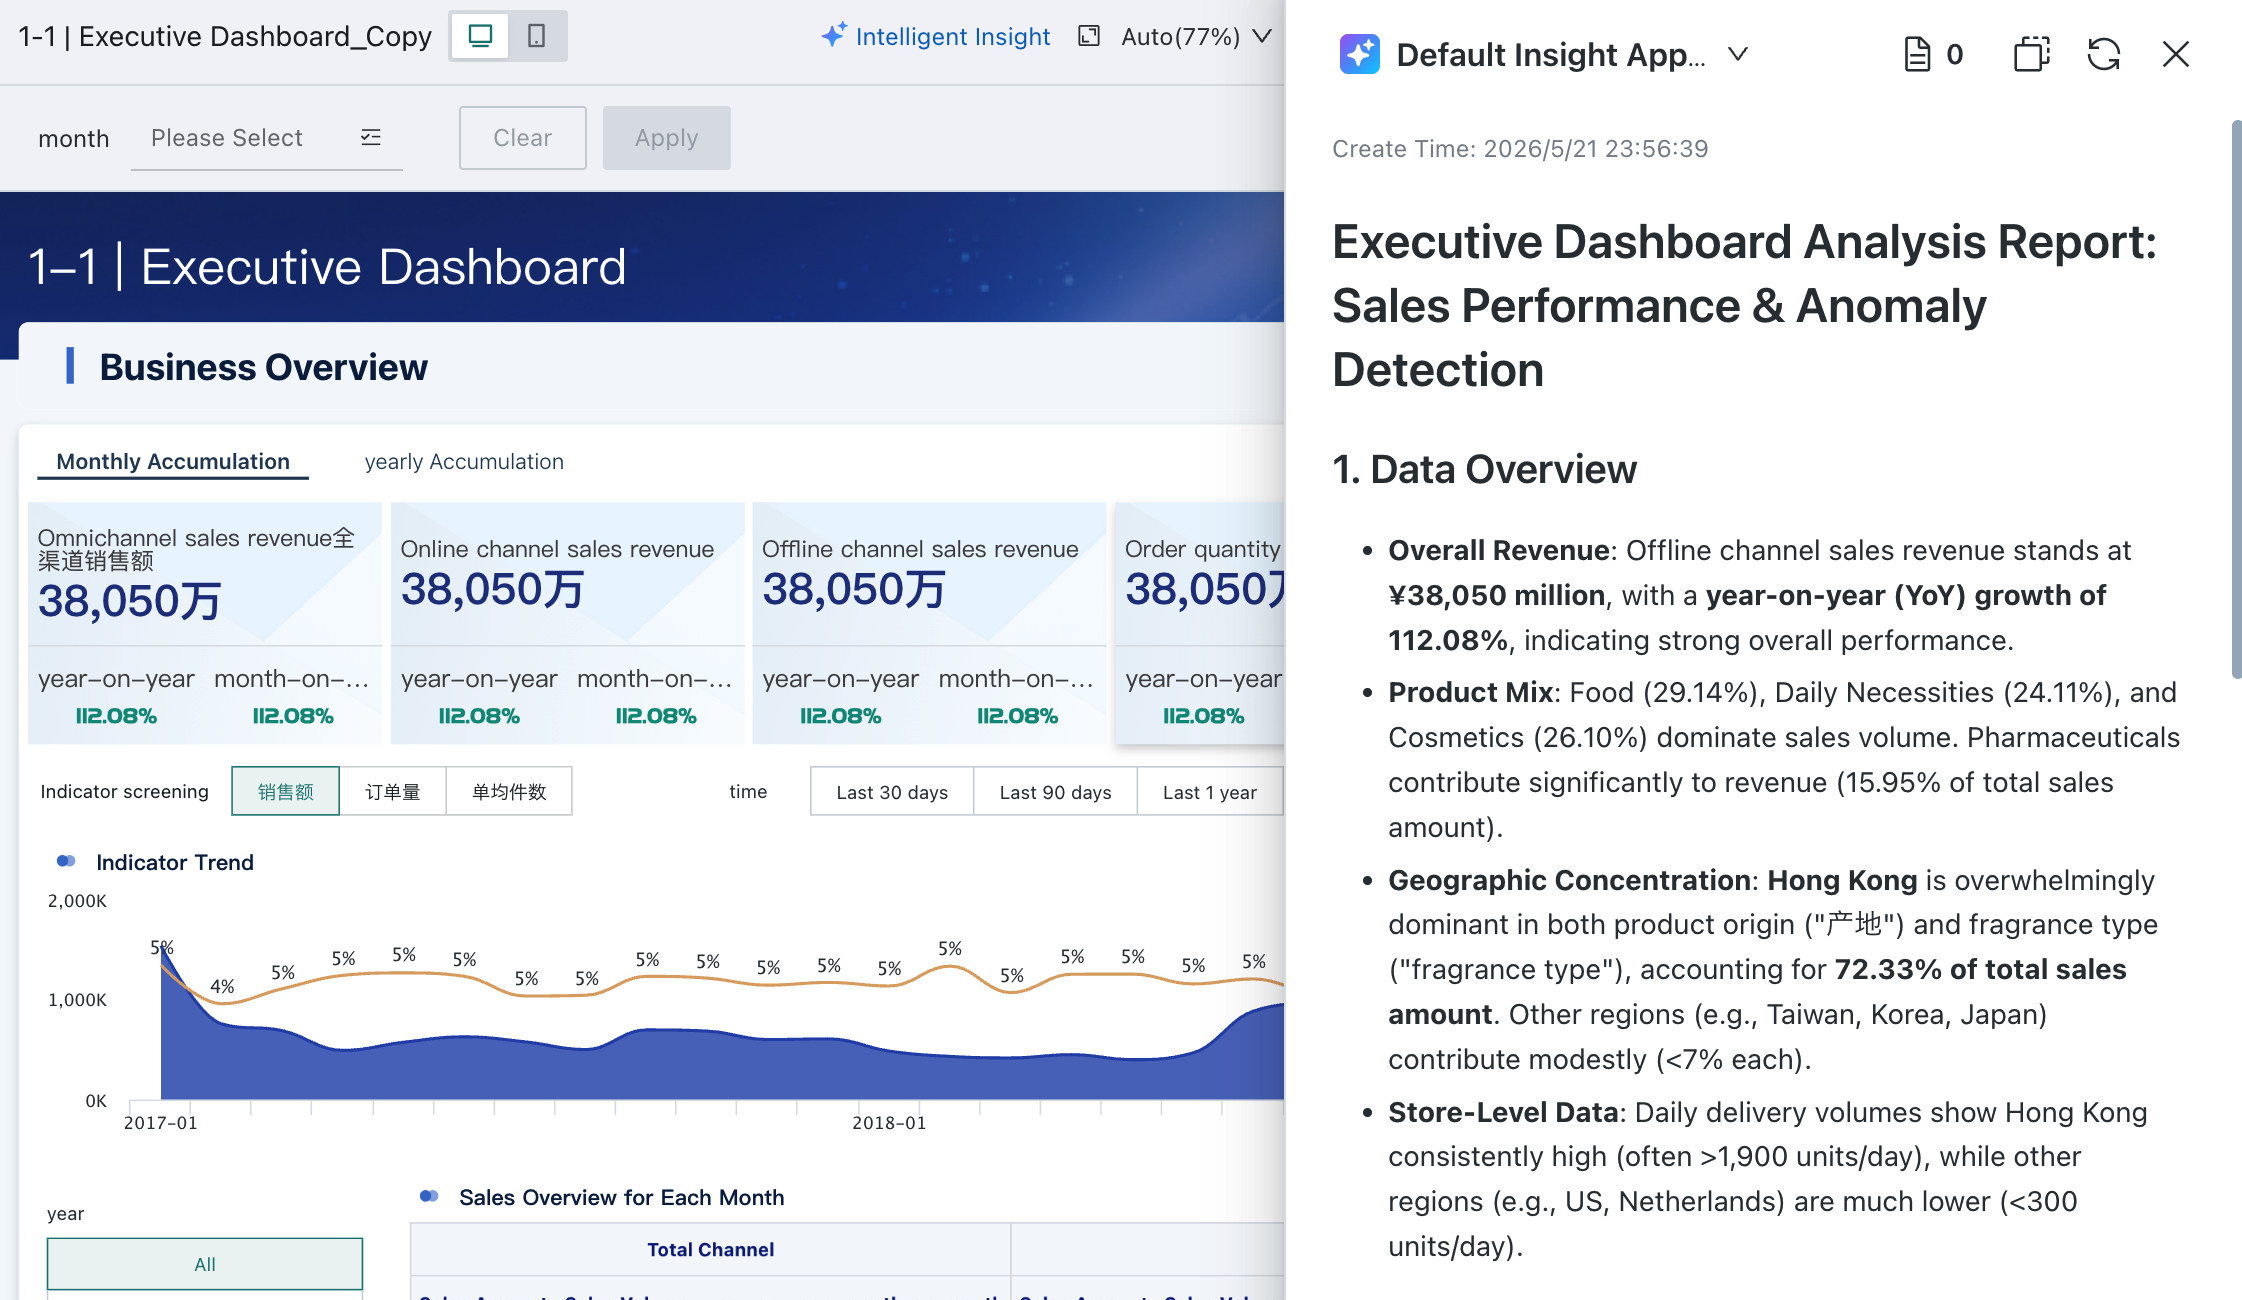
During generation, users can stop the process at any time.
The sidebar used to display Dashboard Insights on desktop supports width adjustment for easier reading.
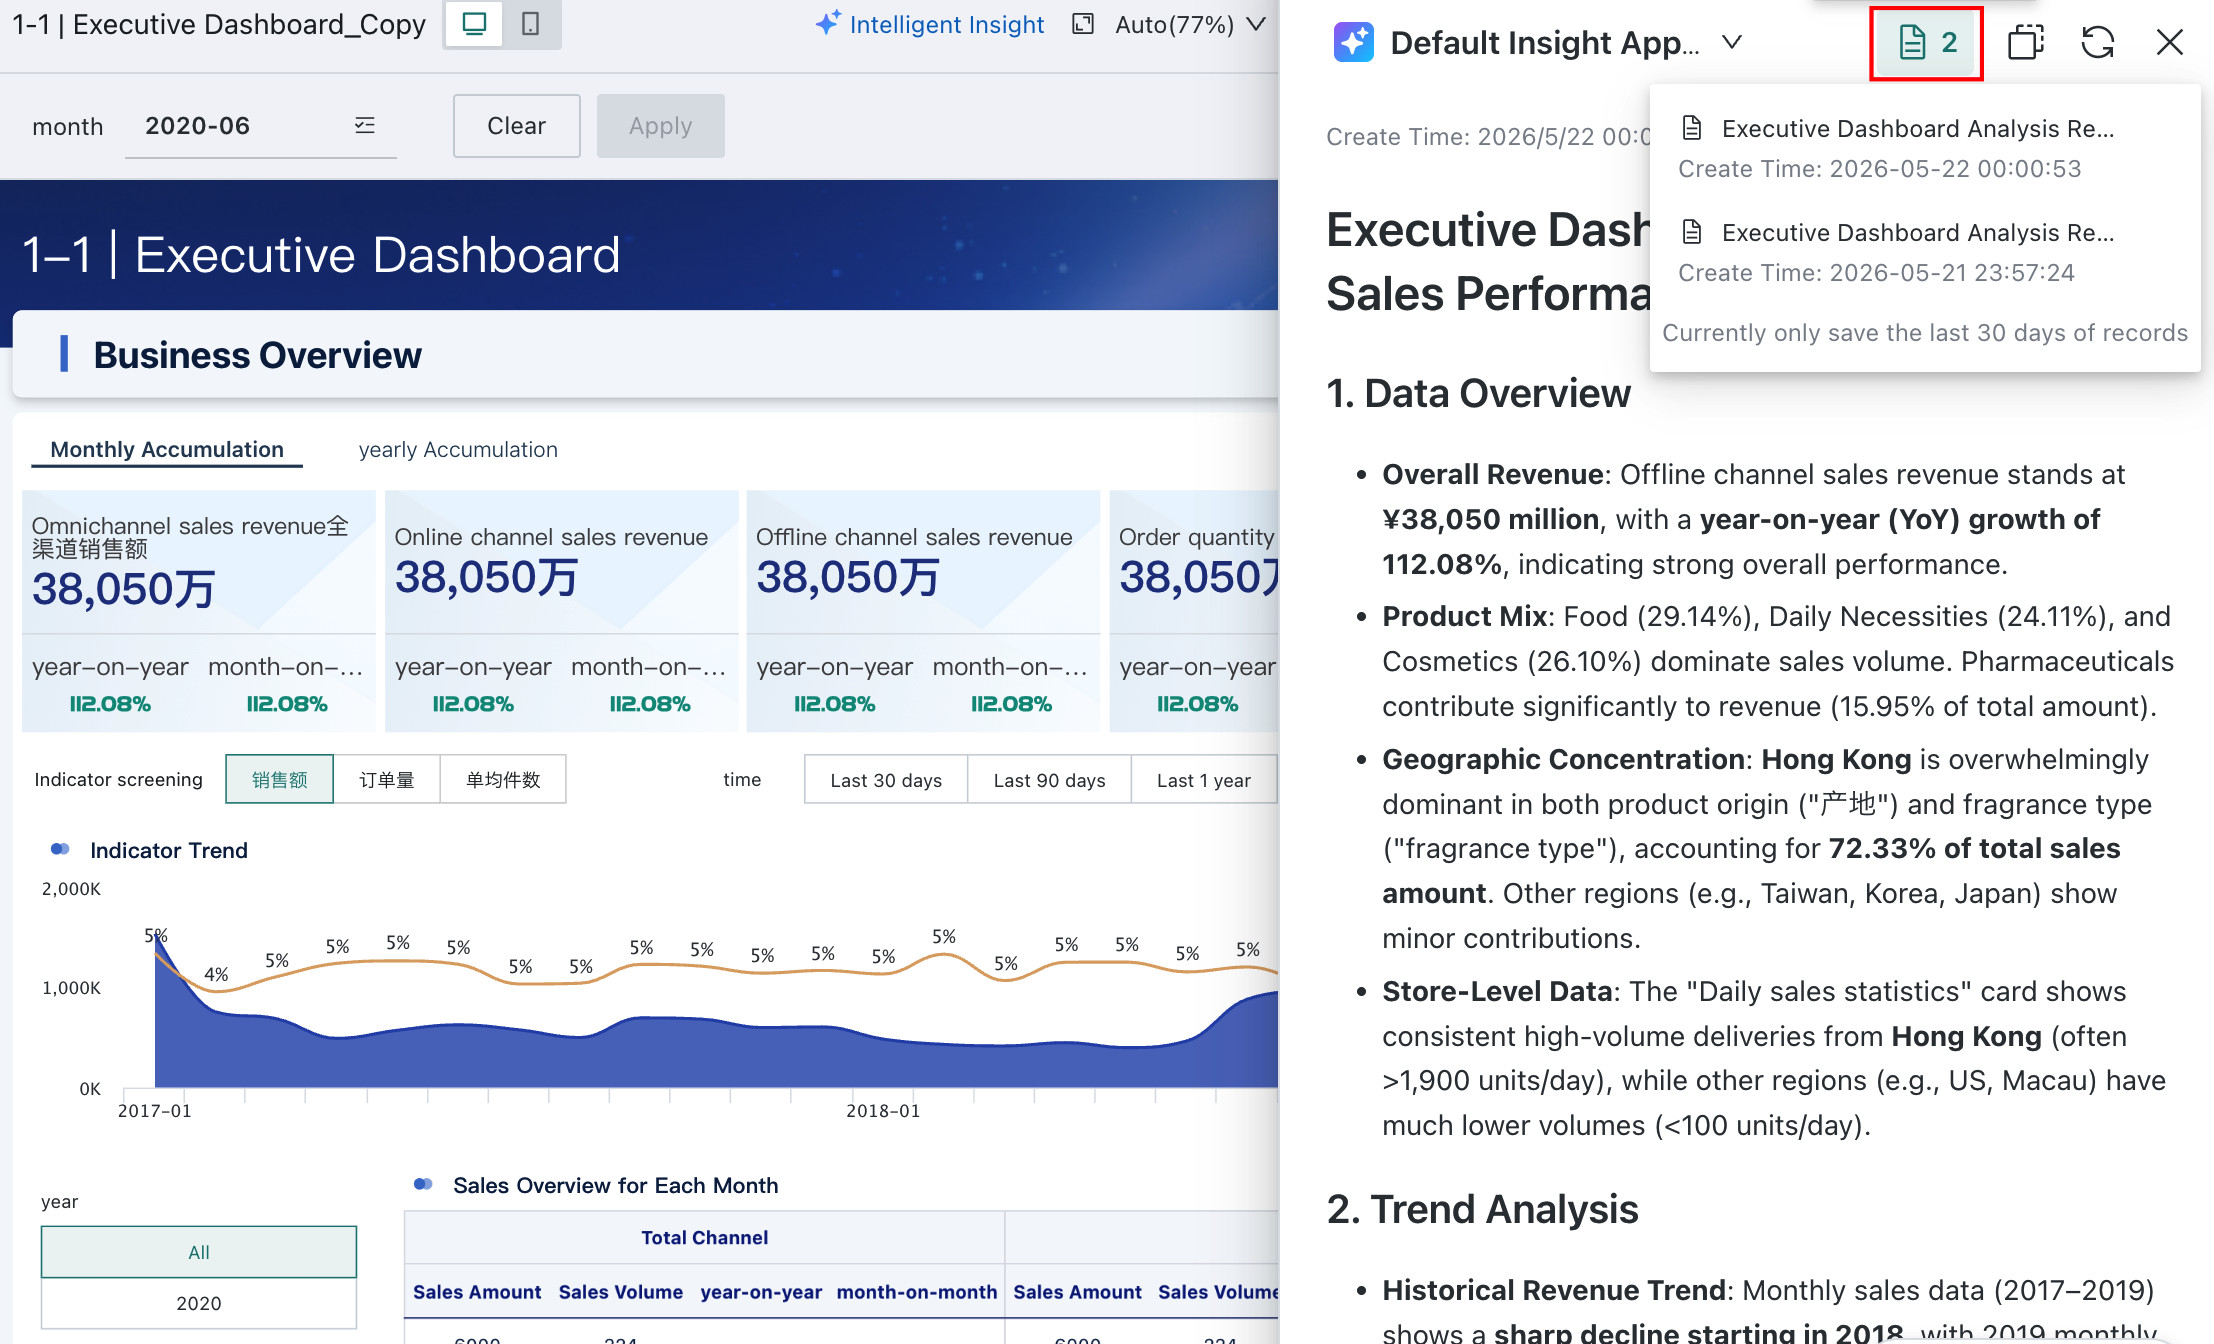
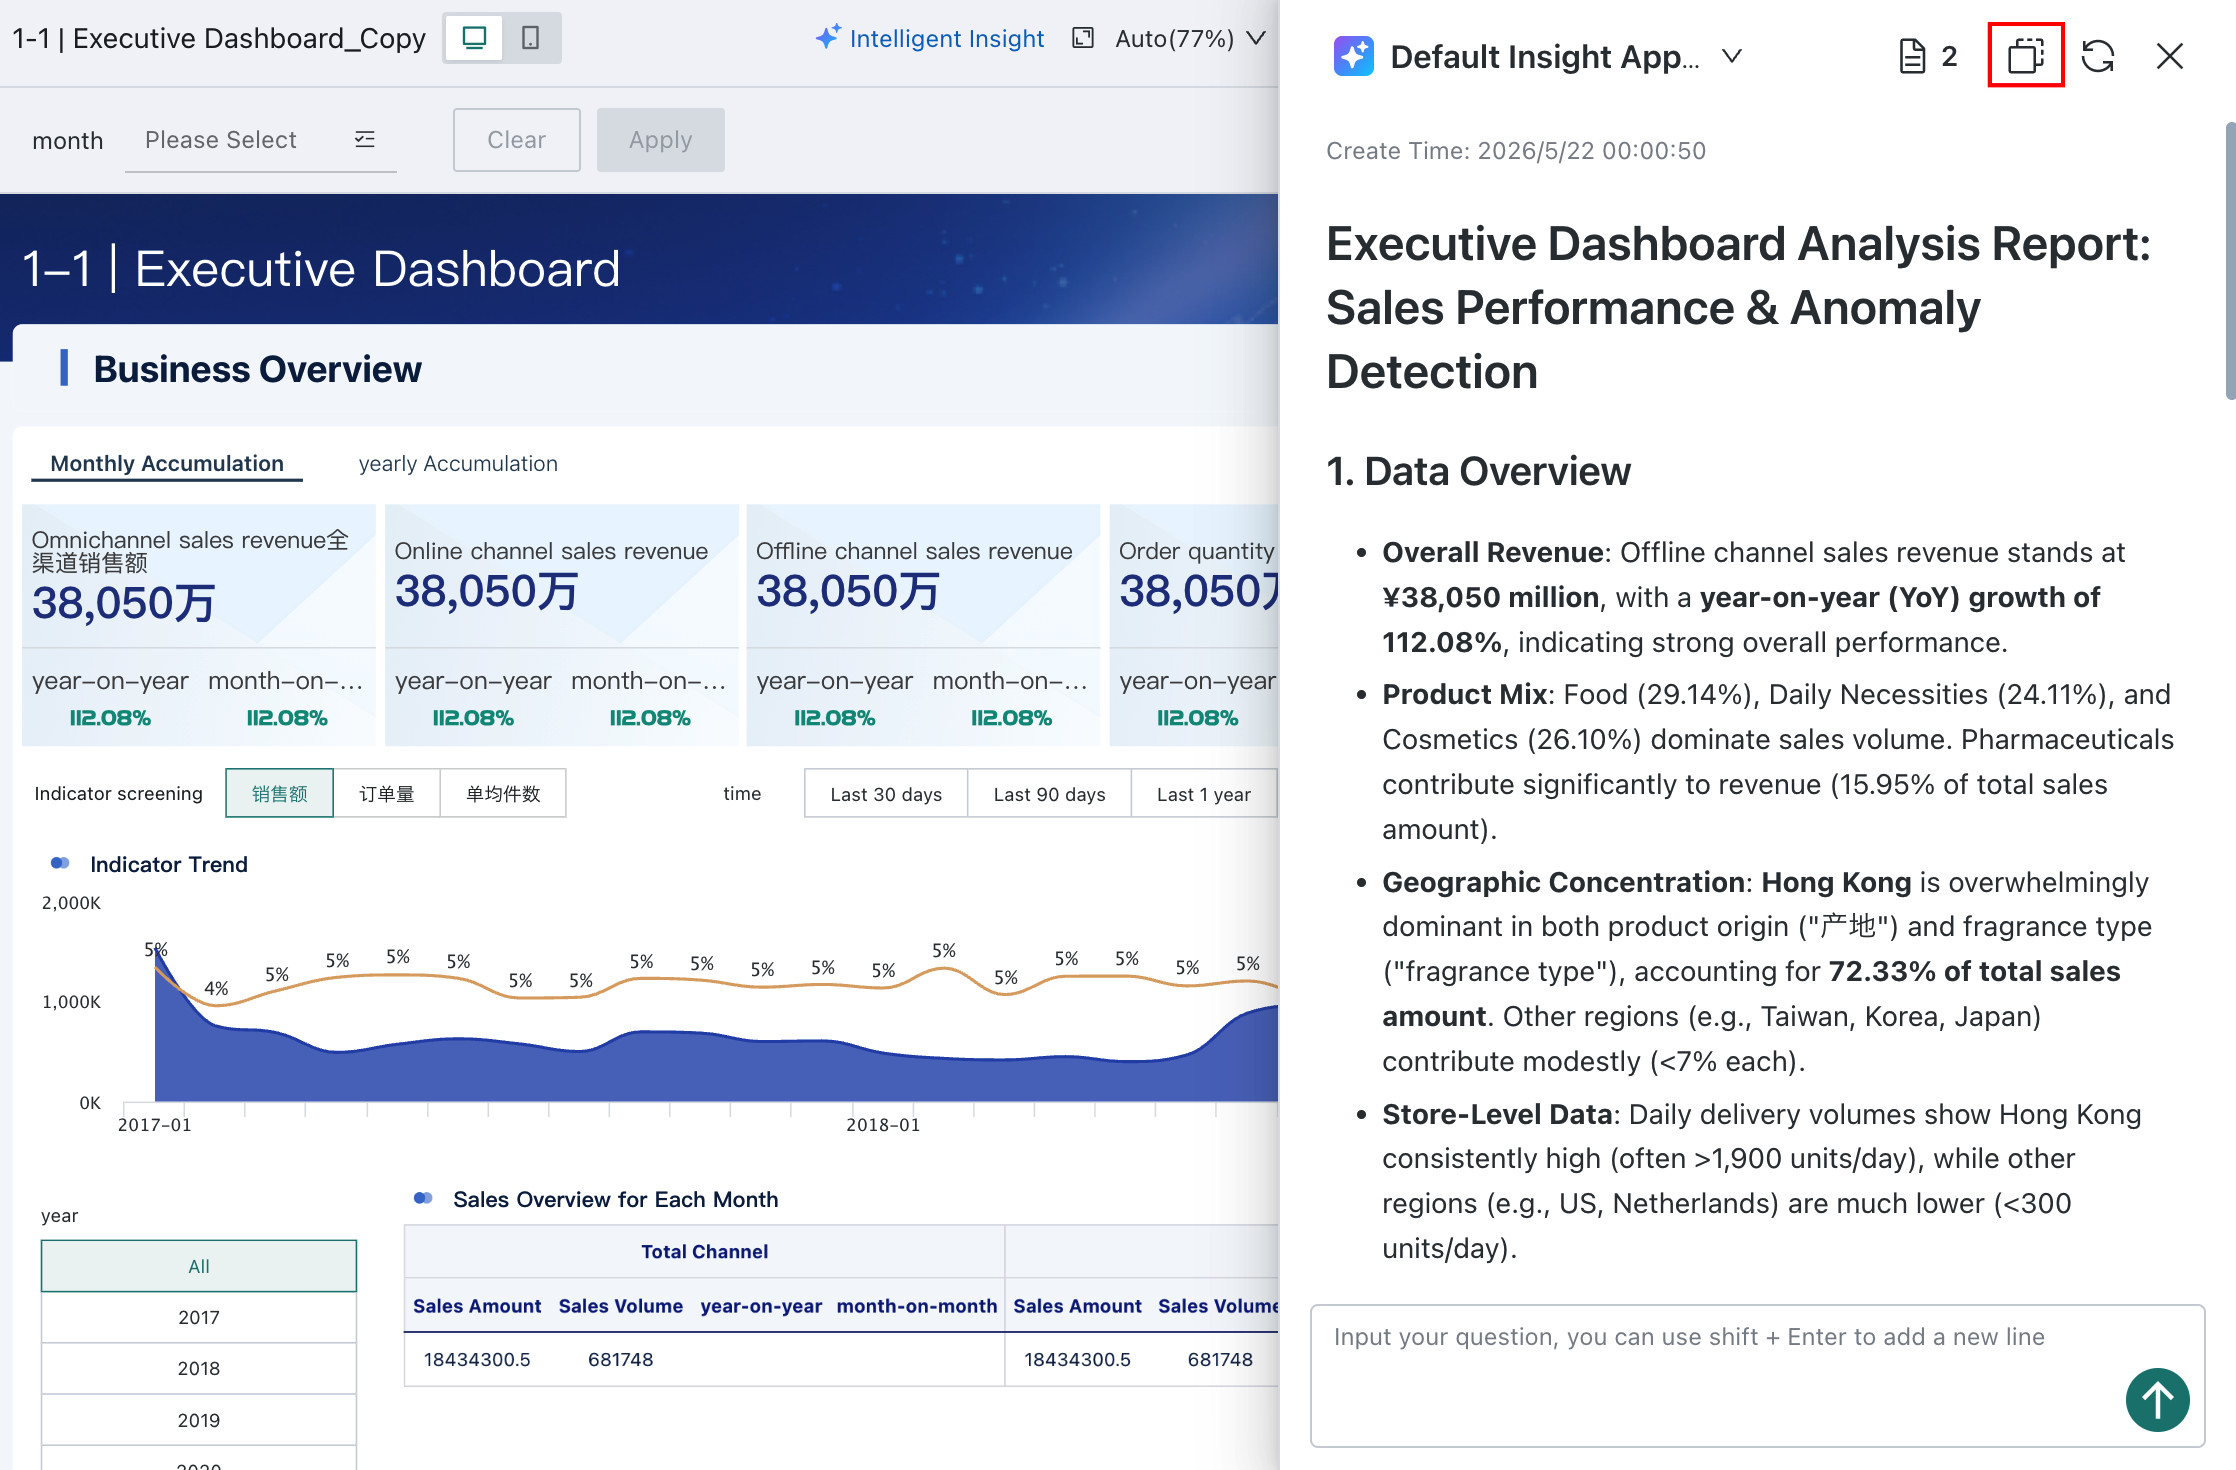
View Historical Insight Conclusions
The system records every generated insight conclusion. Click the button shown below to view the history.
- Historical conclusions are recorded separately for each insight logic.
- Follow-up questions are also included in the history for traceability.
Switch Insight Logic
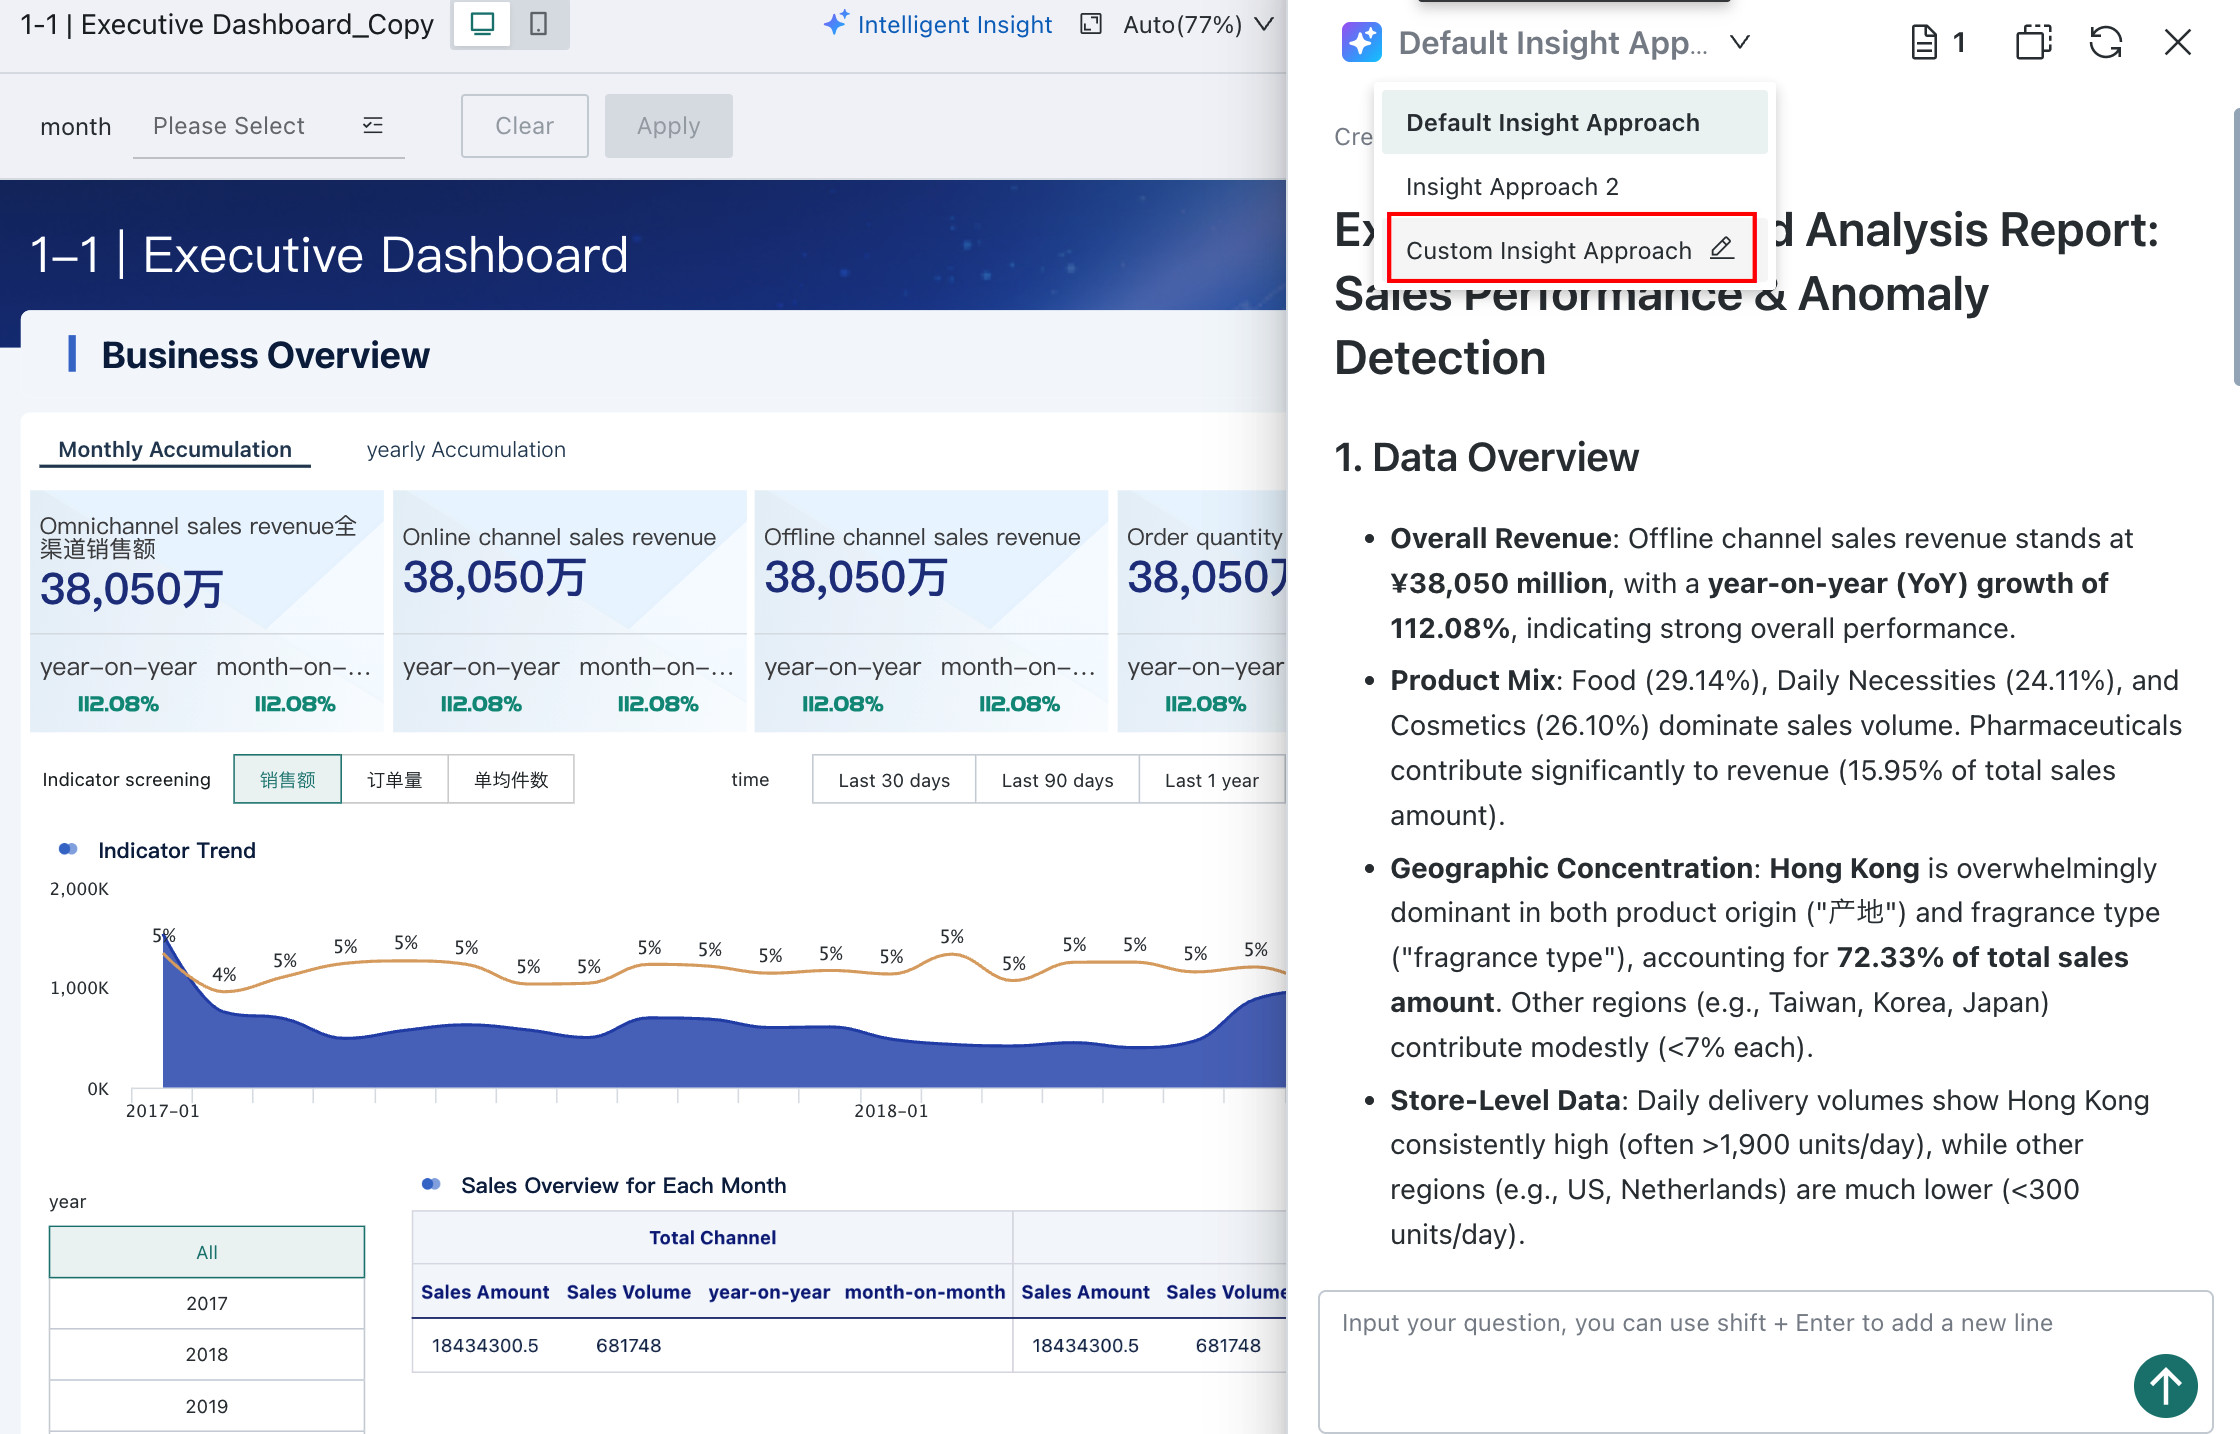
For dashboards with multiple configured insight prompts, users can manually select which insight logic to use when viewing insight results.
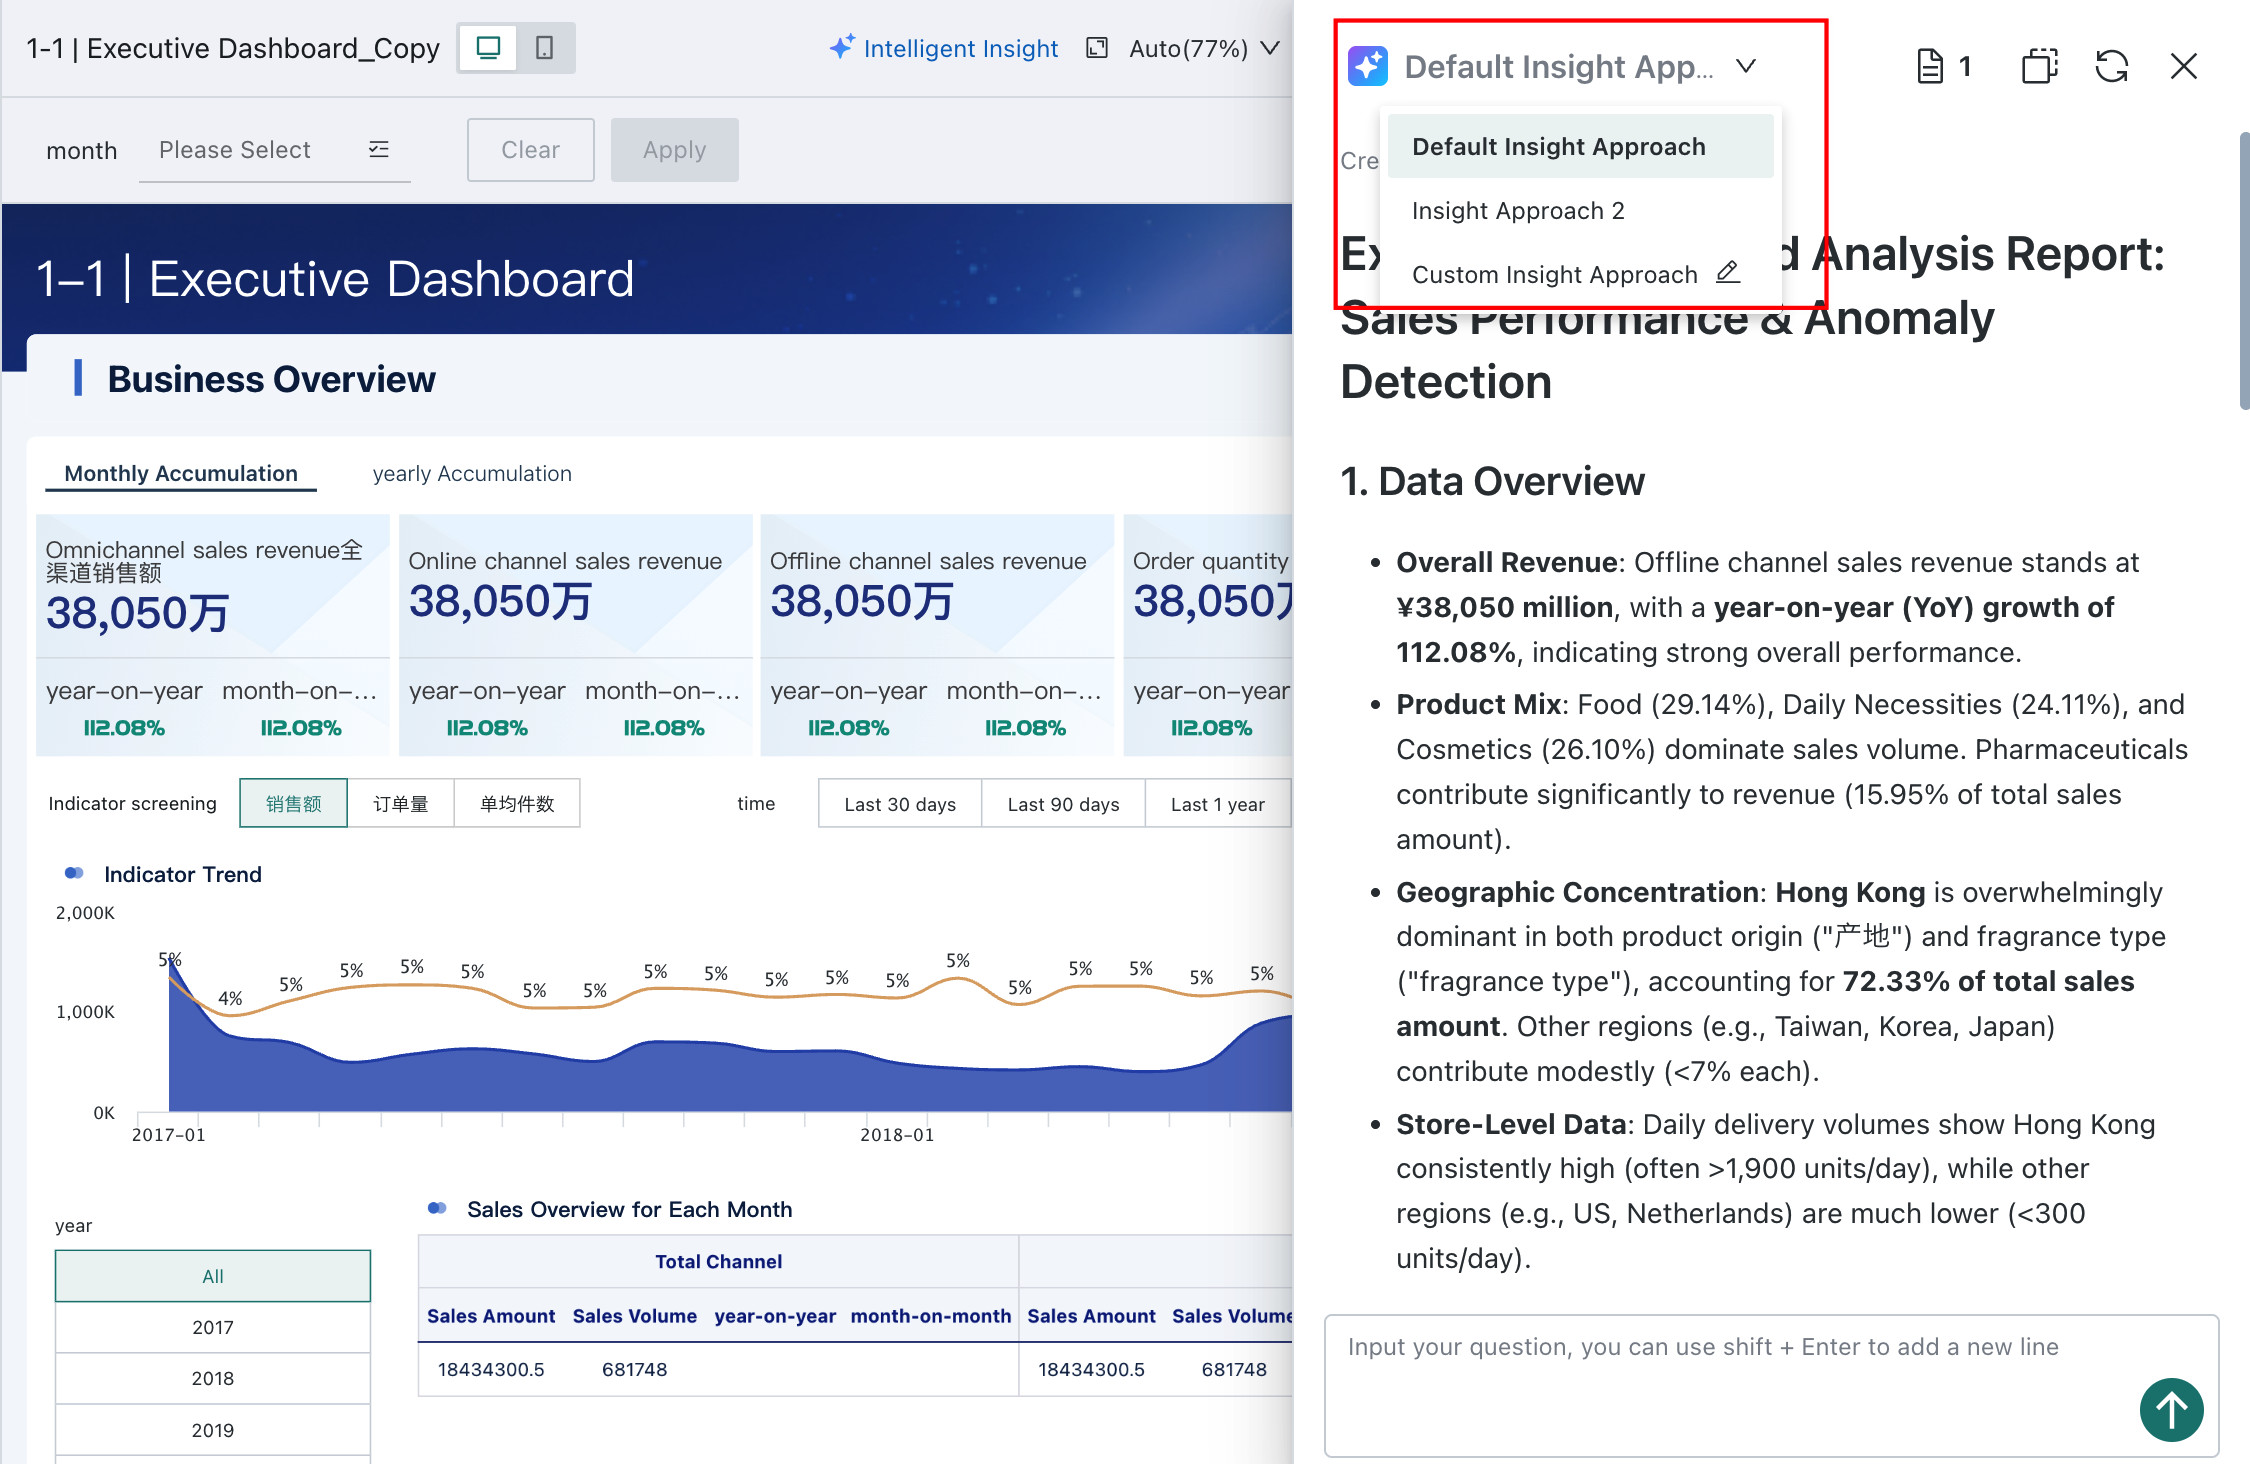
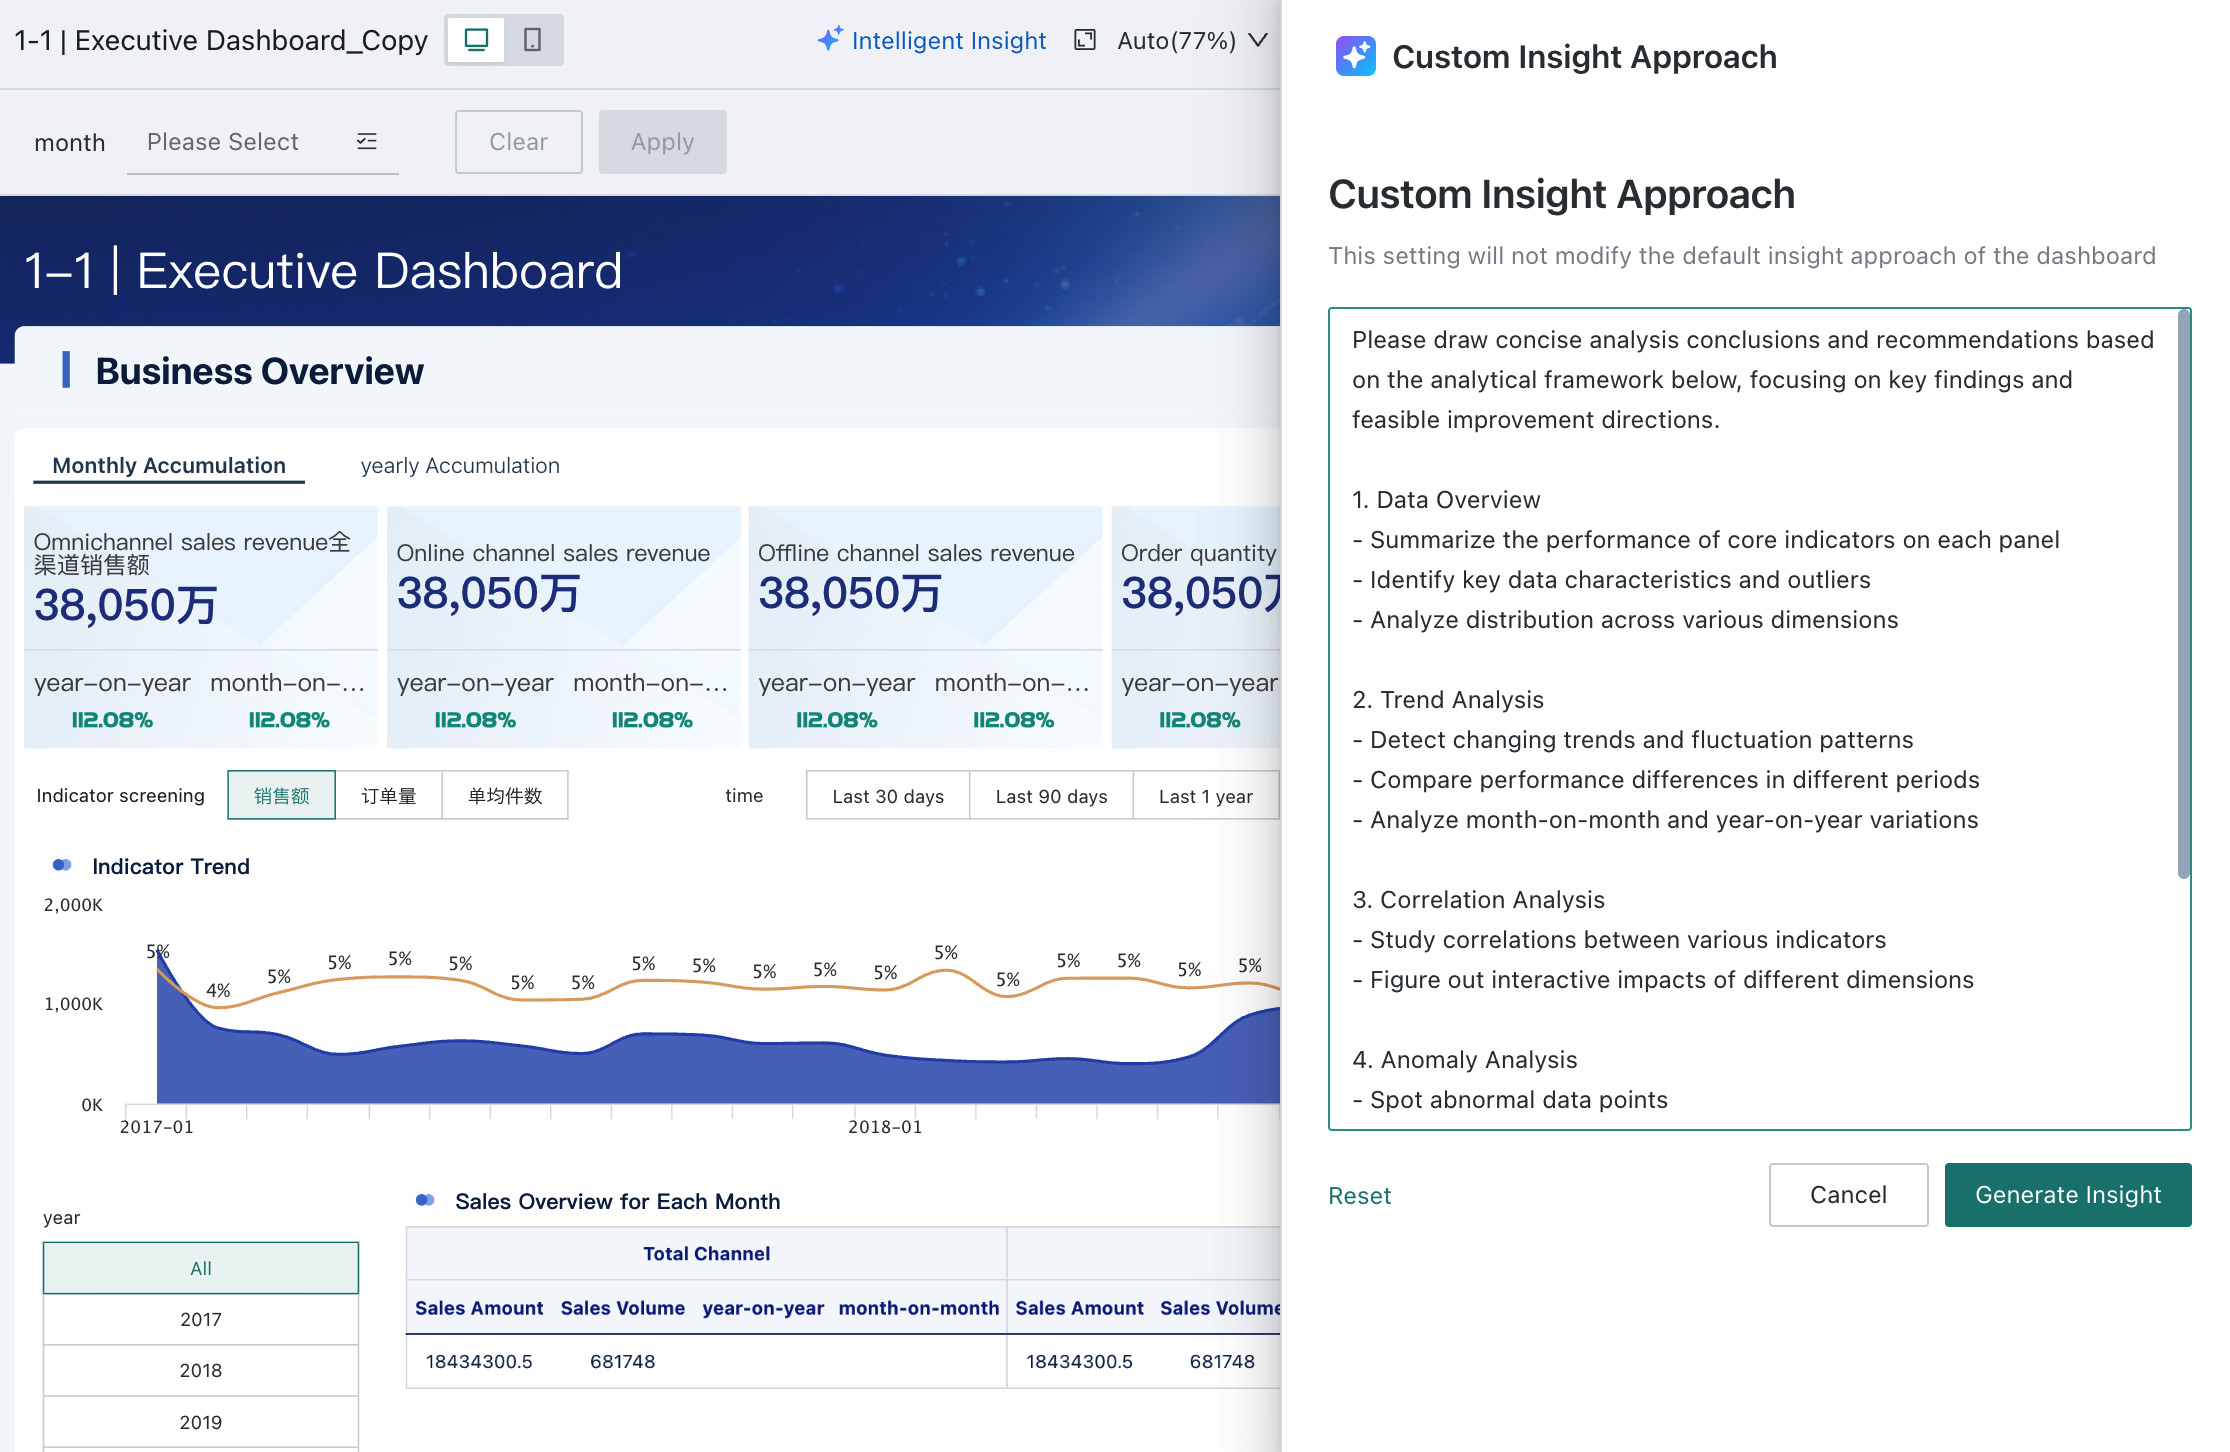
Users can also temporarily define a custom analytical framework through Custom Insight Logic to generate highly personalized reports.
Interactive Analysis
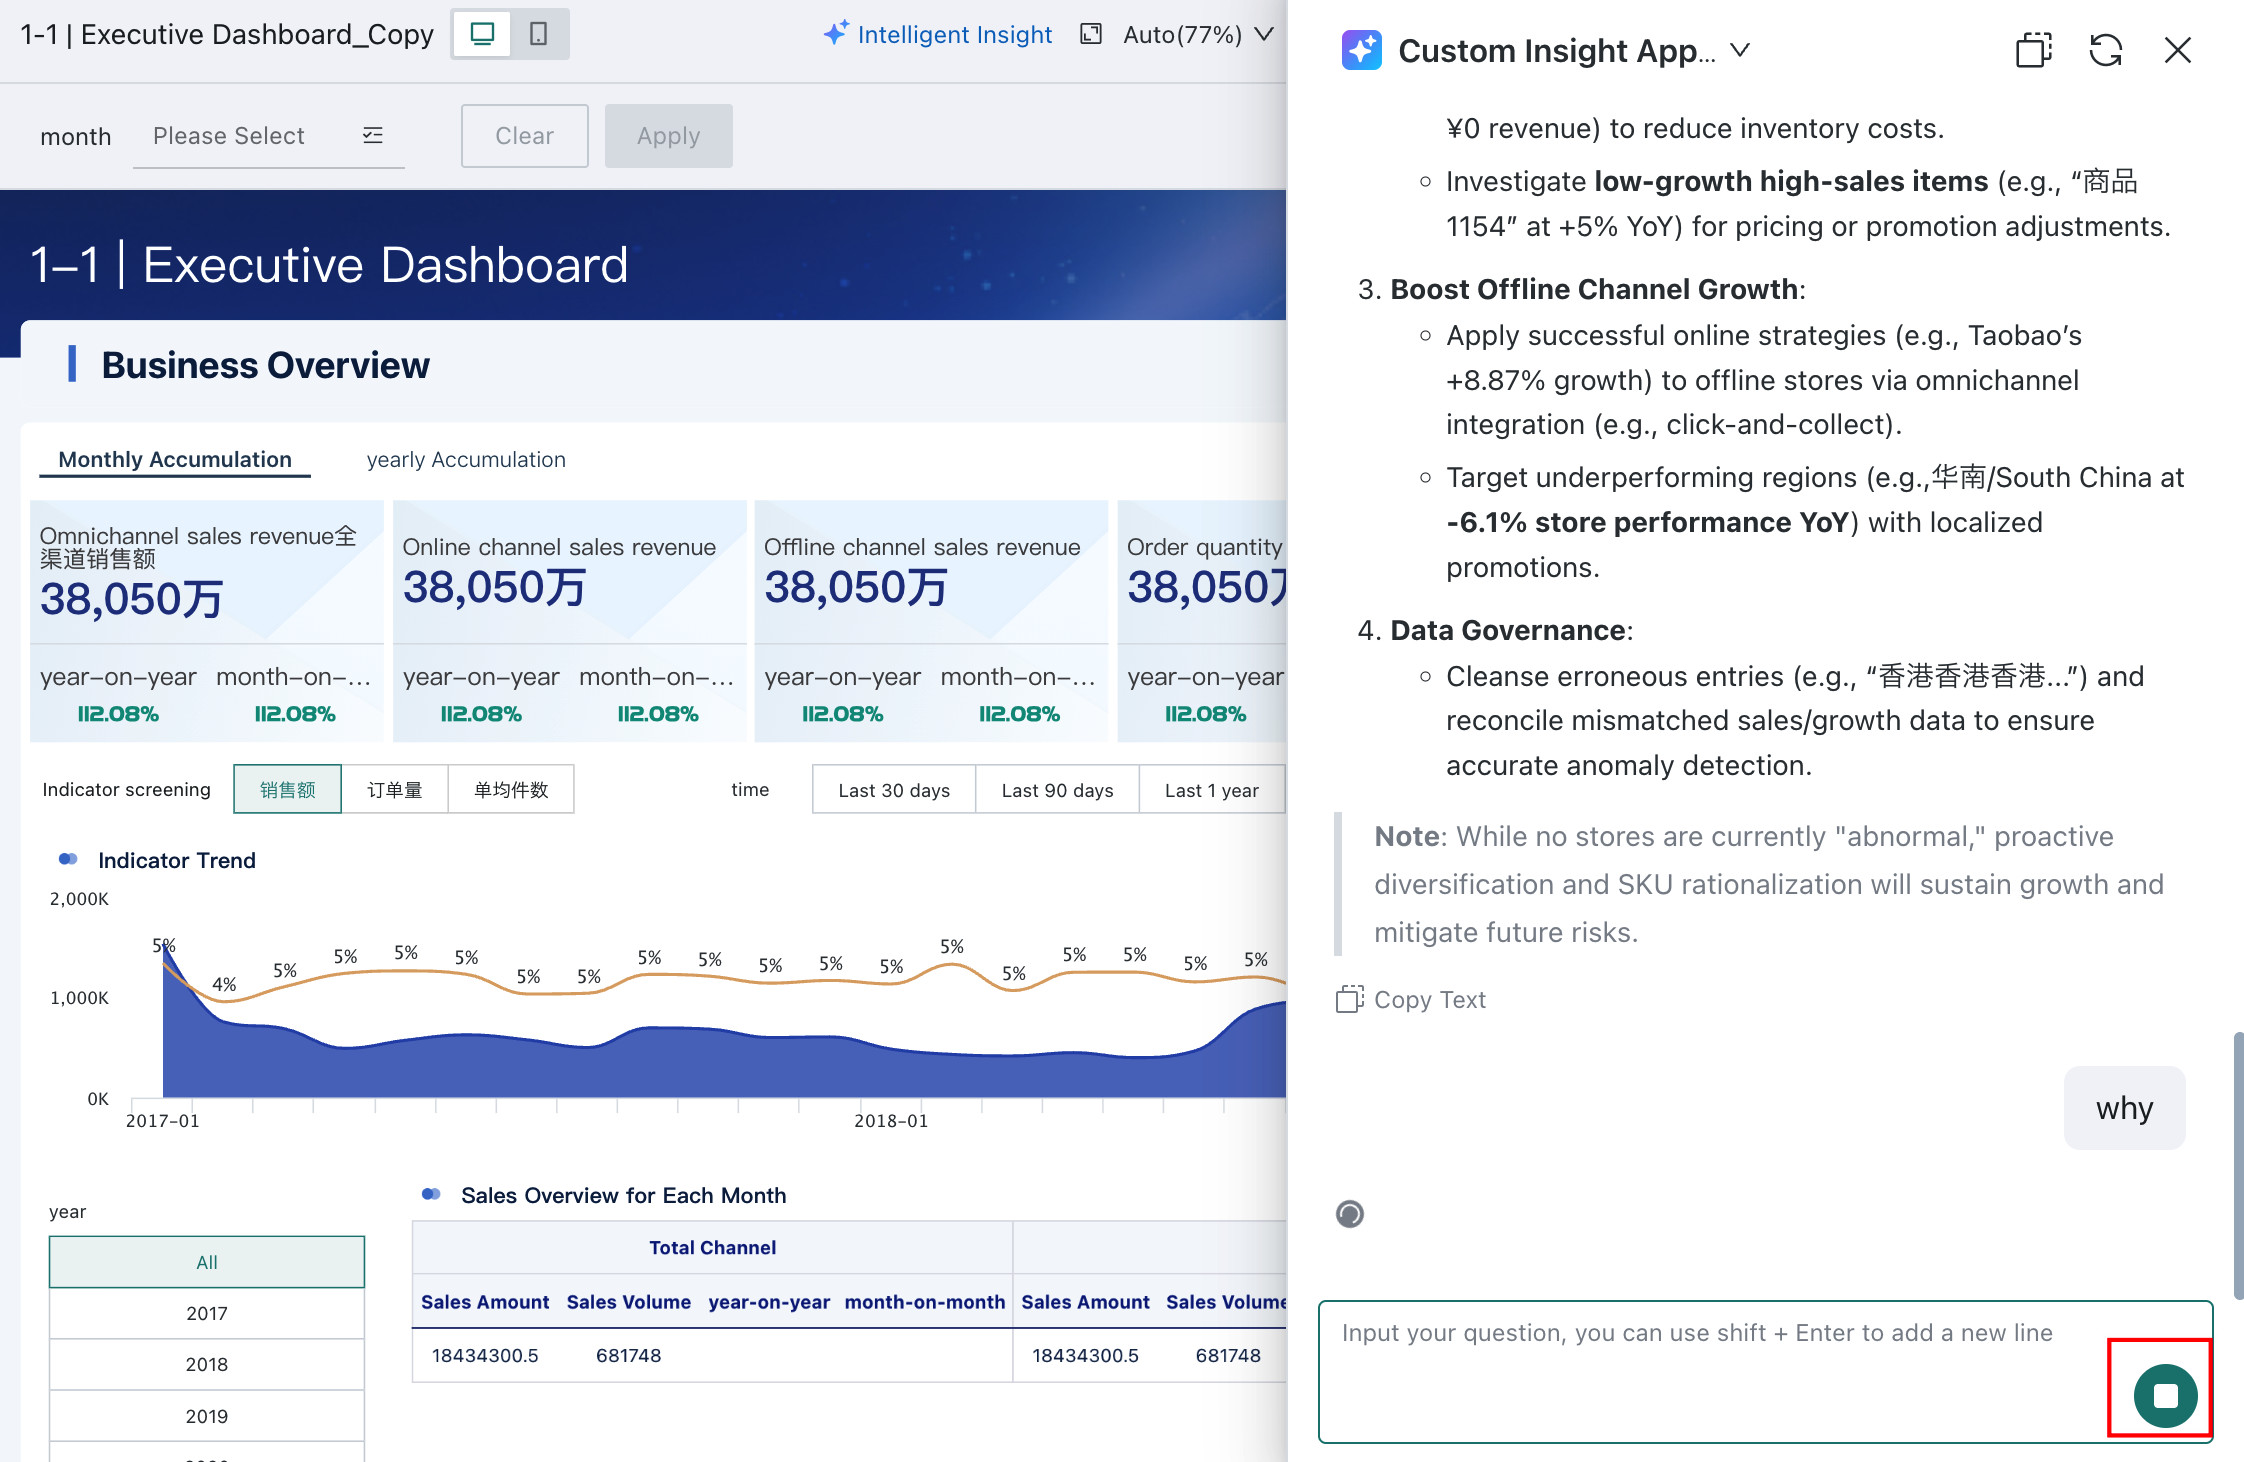
Follow-Up Questions
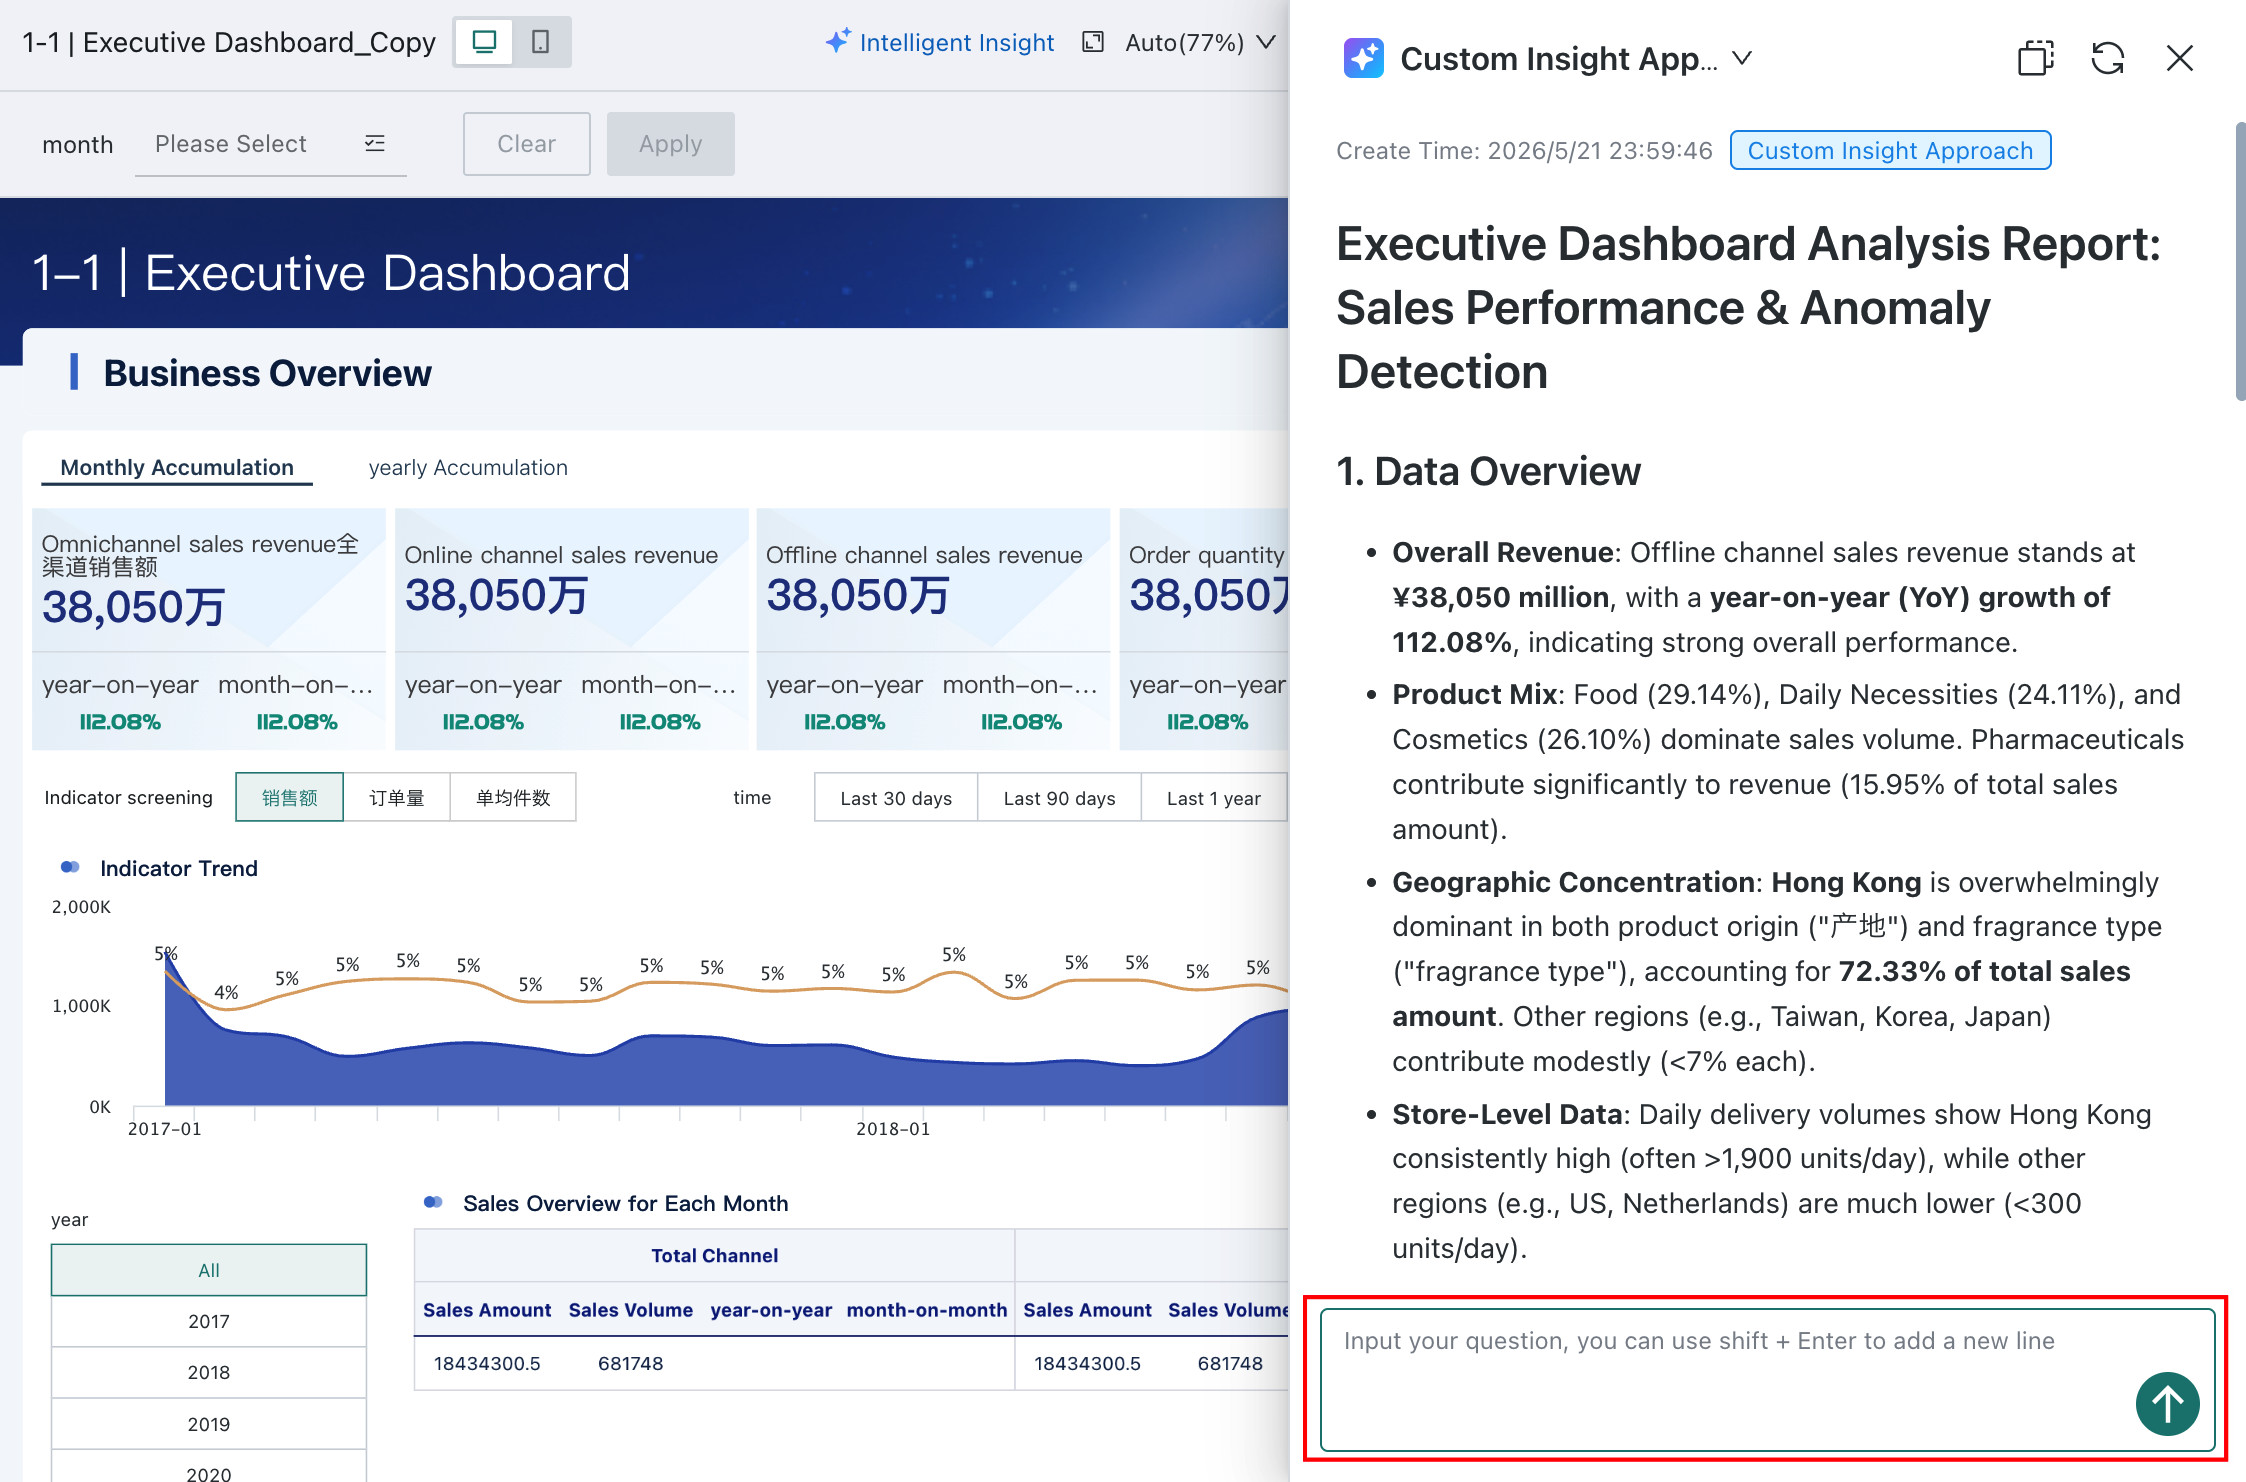
Enter a question in the dialog box and click Send to ask flexible follow-up questions about the current insight result. Multi-turn conversations are supported to explore the reasons behind the data more deeply.
Users can stop generation at any time during follow-up analysis.
Copy
The output of Smart Insights supports Copy and preserves text formatting such as bold, indentation, and numbered lists.
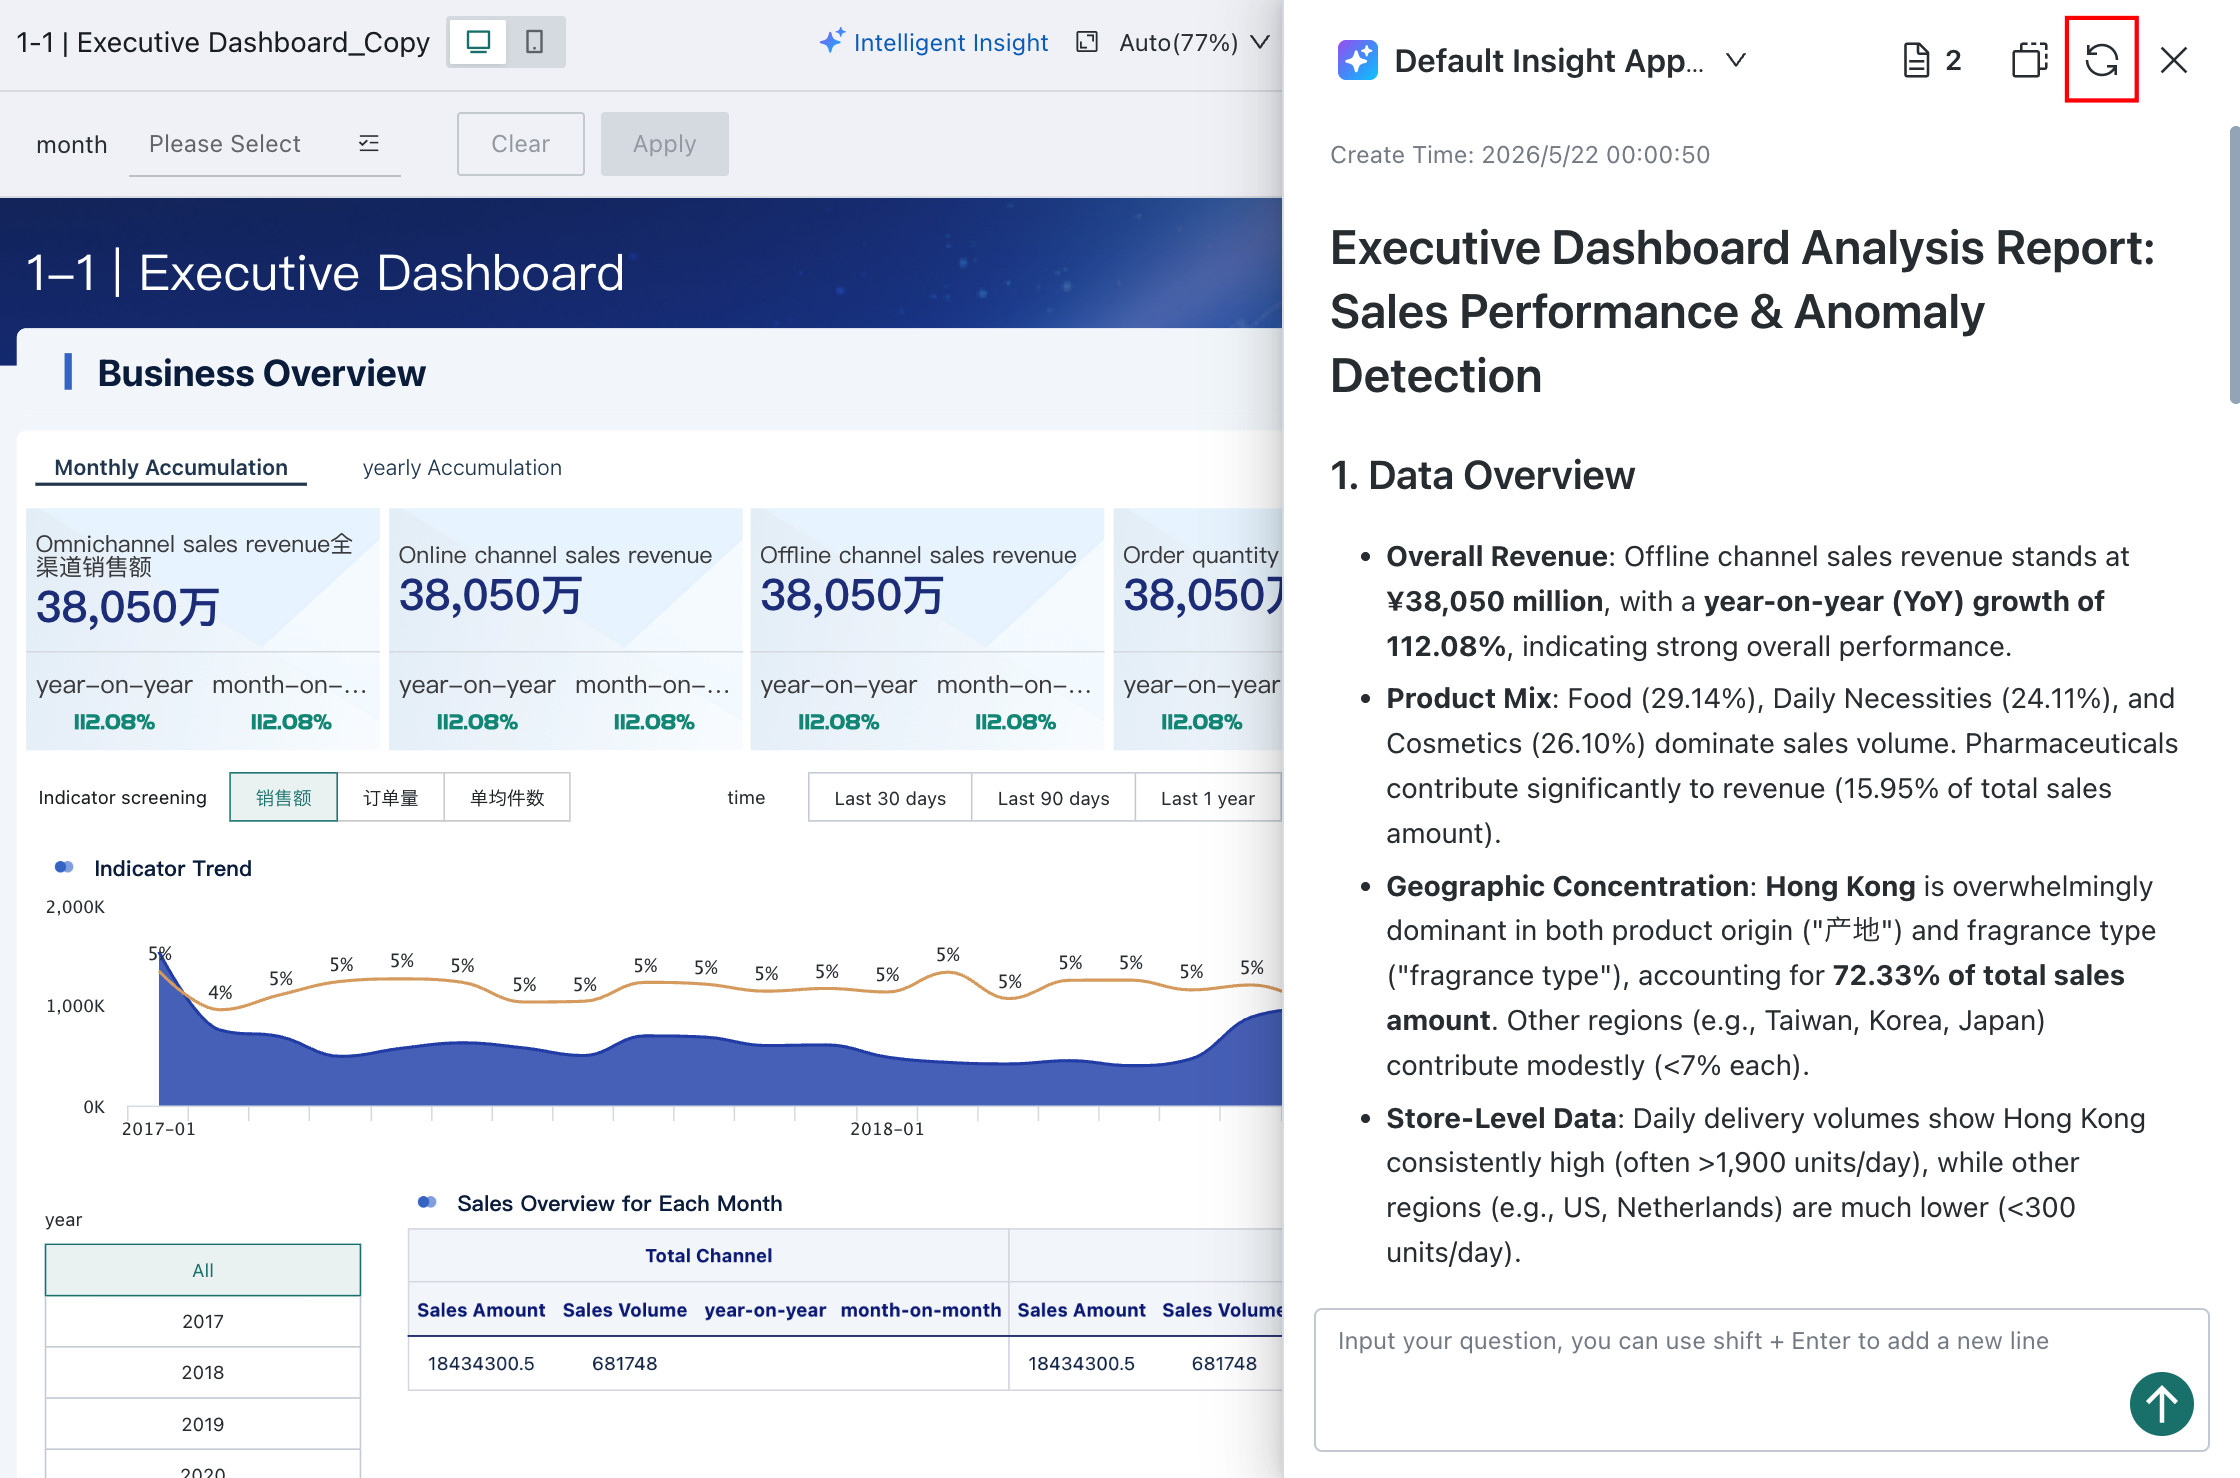
Regenerate
If the generated conclusion is unsatisfactory, click this button to generate it again.
View Insight Subscriptions
When a subscription is triggered, recipients receive the message in the configured channel and can directly view the insight conclusion there. For details, see View Dashboard Insights Subscription Results.
Data Processing Mechanism
Data Scope
Dashboard data is extracted for Smart Insights on a what-you-see-is-what-you-get basis, including:
- visible data under the current filter conditions
- card data under different tabs
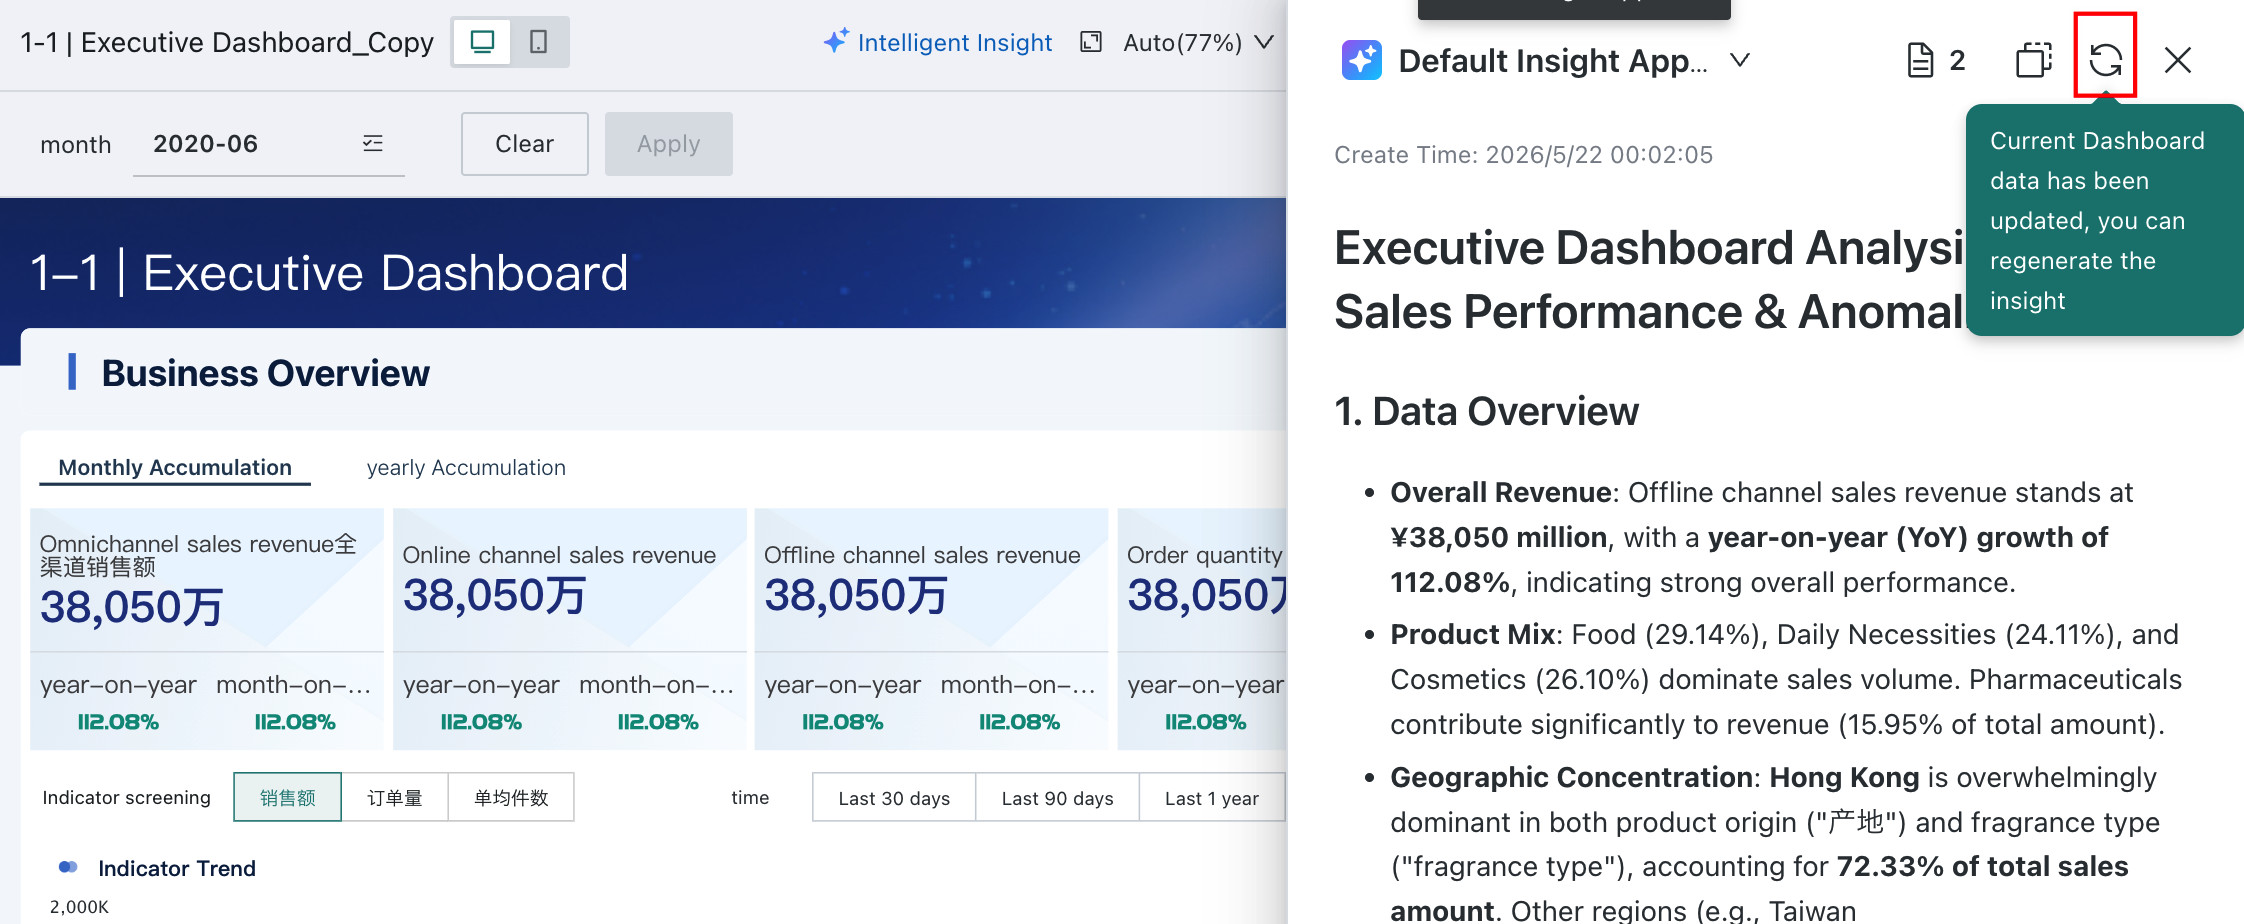
Dynamic Update Logic
When filter conditions change or a card is drilled into, the data displayed in the current dashboard changes as well. Click Regenerate to update the insight report.
Limitations
-
Image cards and external-link cards are not currently supported.
-
Table-type cards provide the first 200 rows of data for analysis.
If you need to change the number of table rows available for analysis, go to
Admin Center > Open Platform > Plugin Managementand modify the configuration by creating a plugin. For plugin management operations, see Plugin Management.NoteThis configuration takes effect globally and applies to both Dashboard Insights and Card Insights.
Example: change
200in the code below to the required number of rows.
GD.dispatch('config-dashboard-insight-settings', {
    cardDataLimit: 200, // Modify the table row limit here
})