Dashboard General Operations
Overview
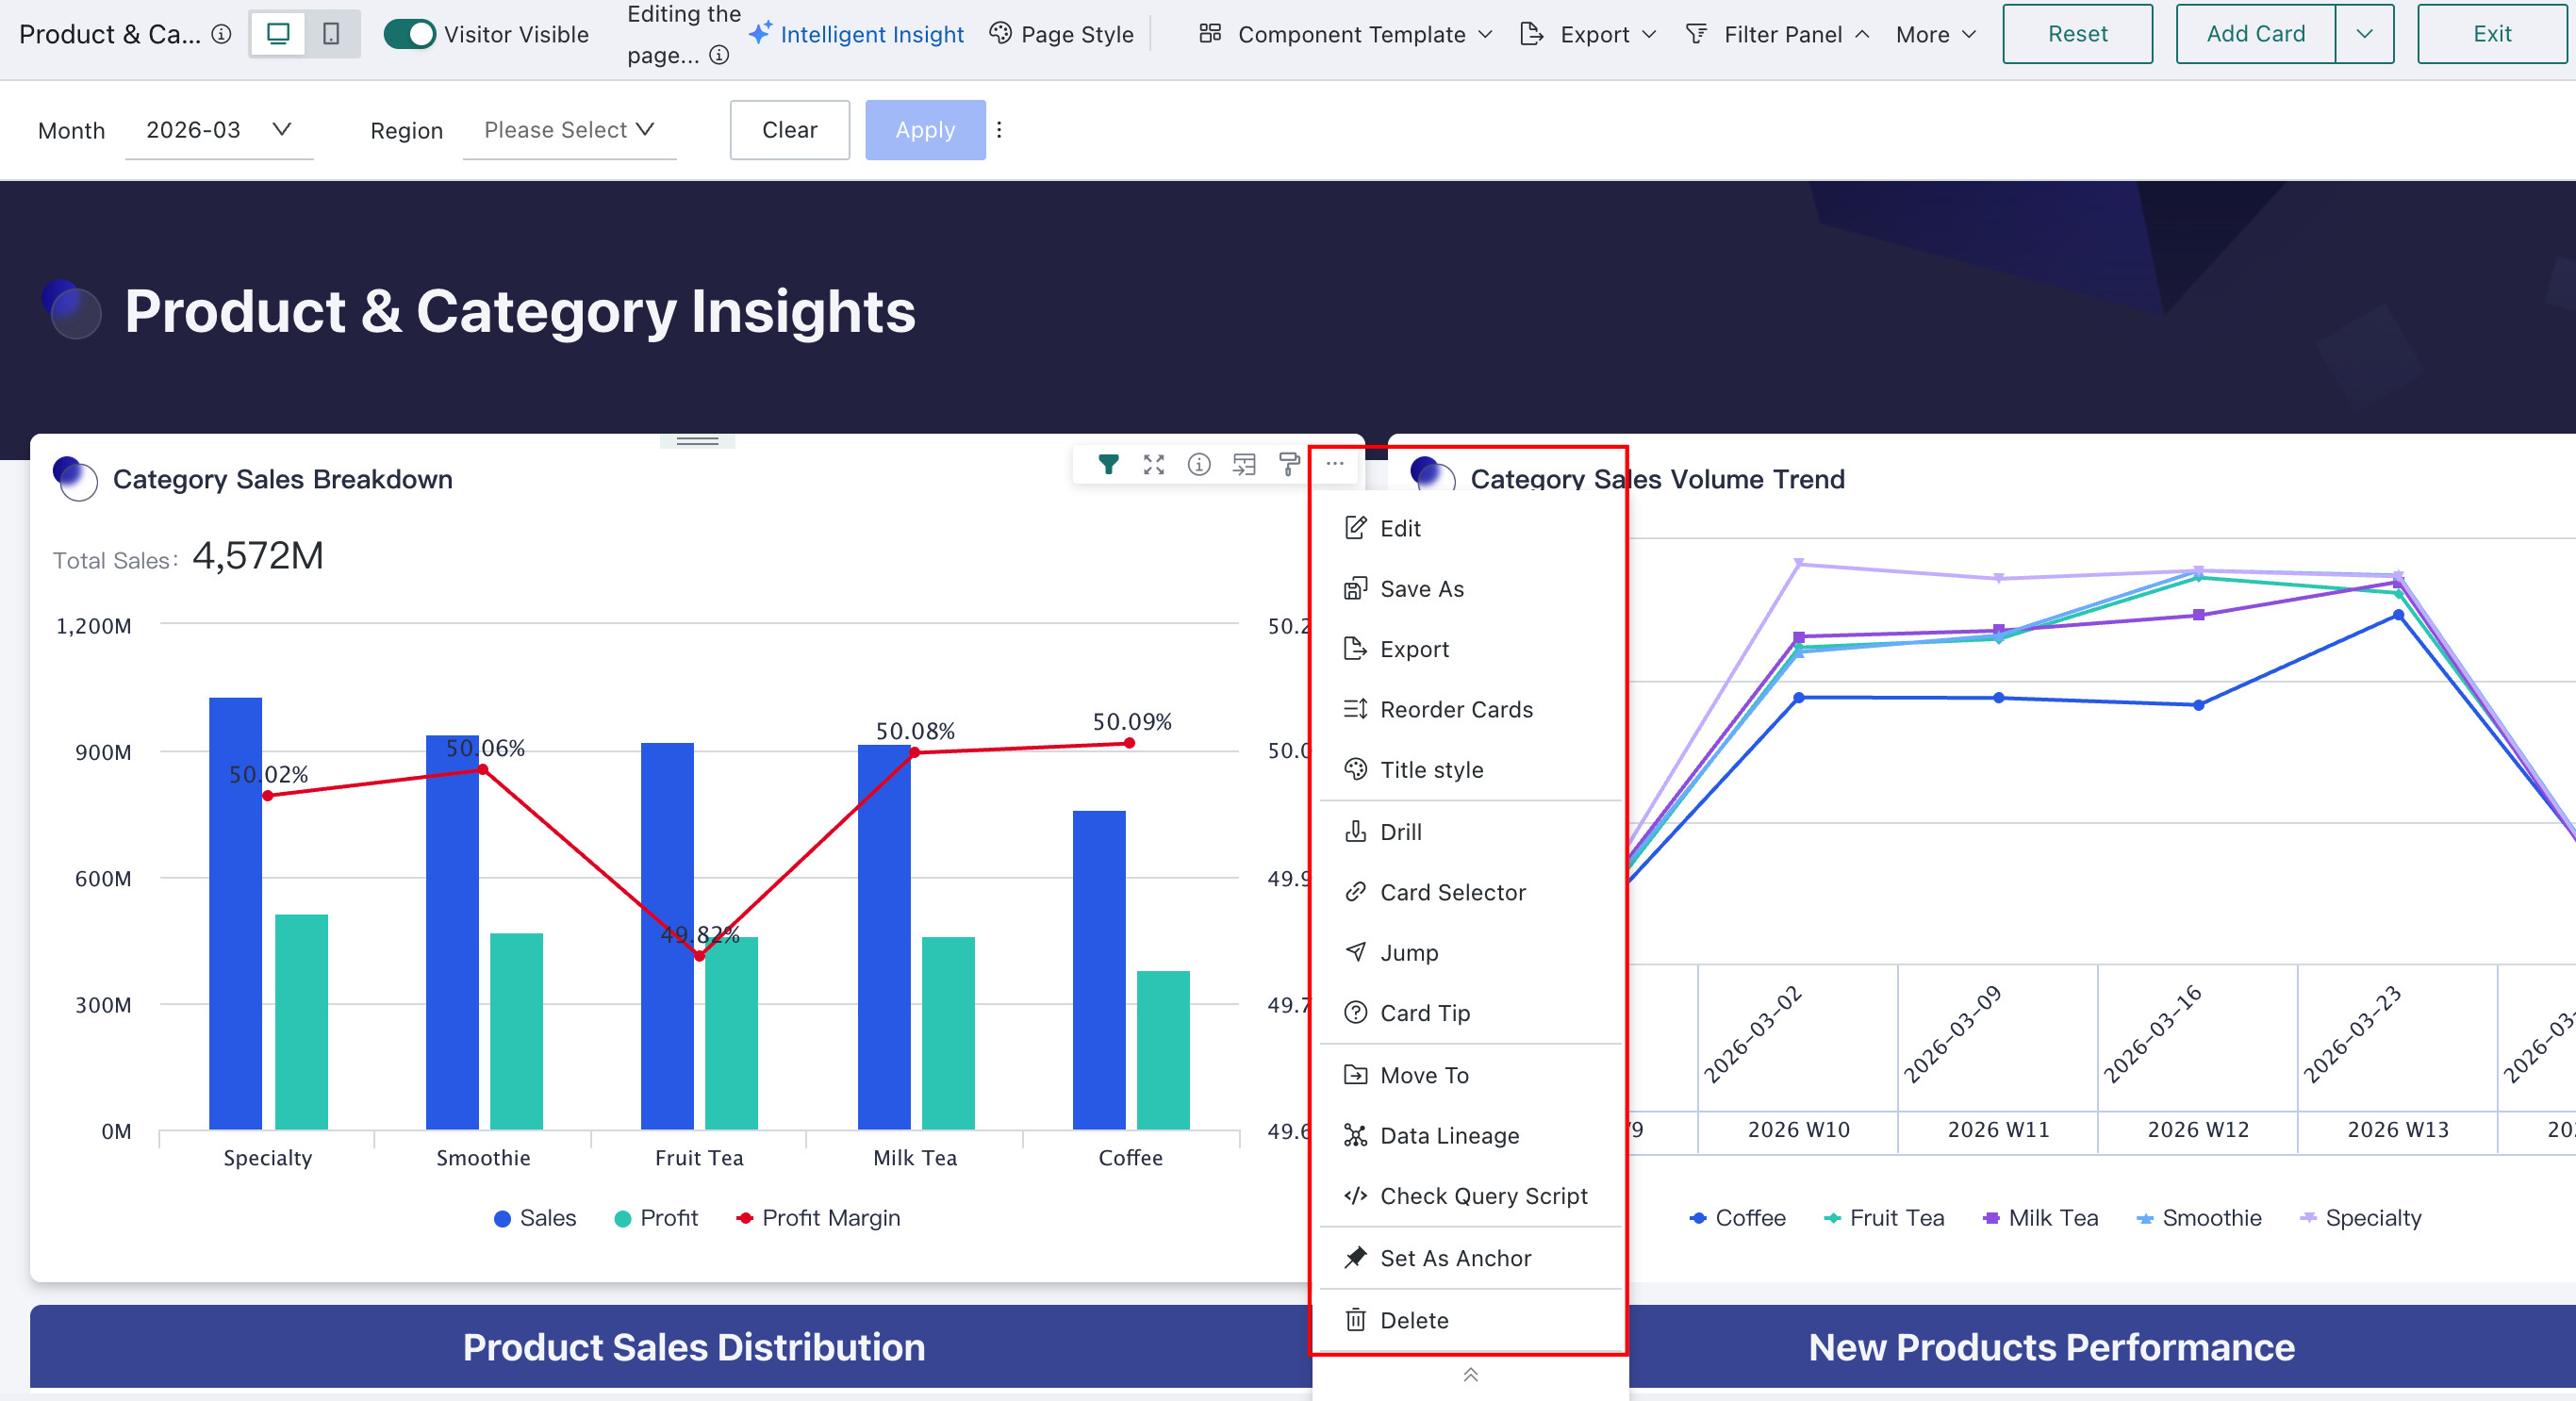
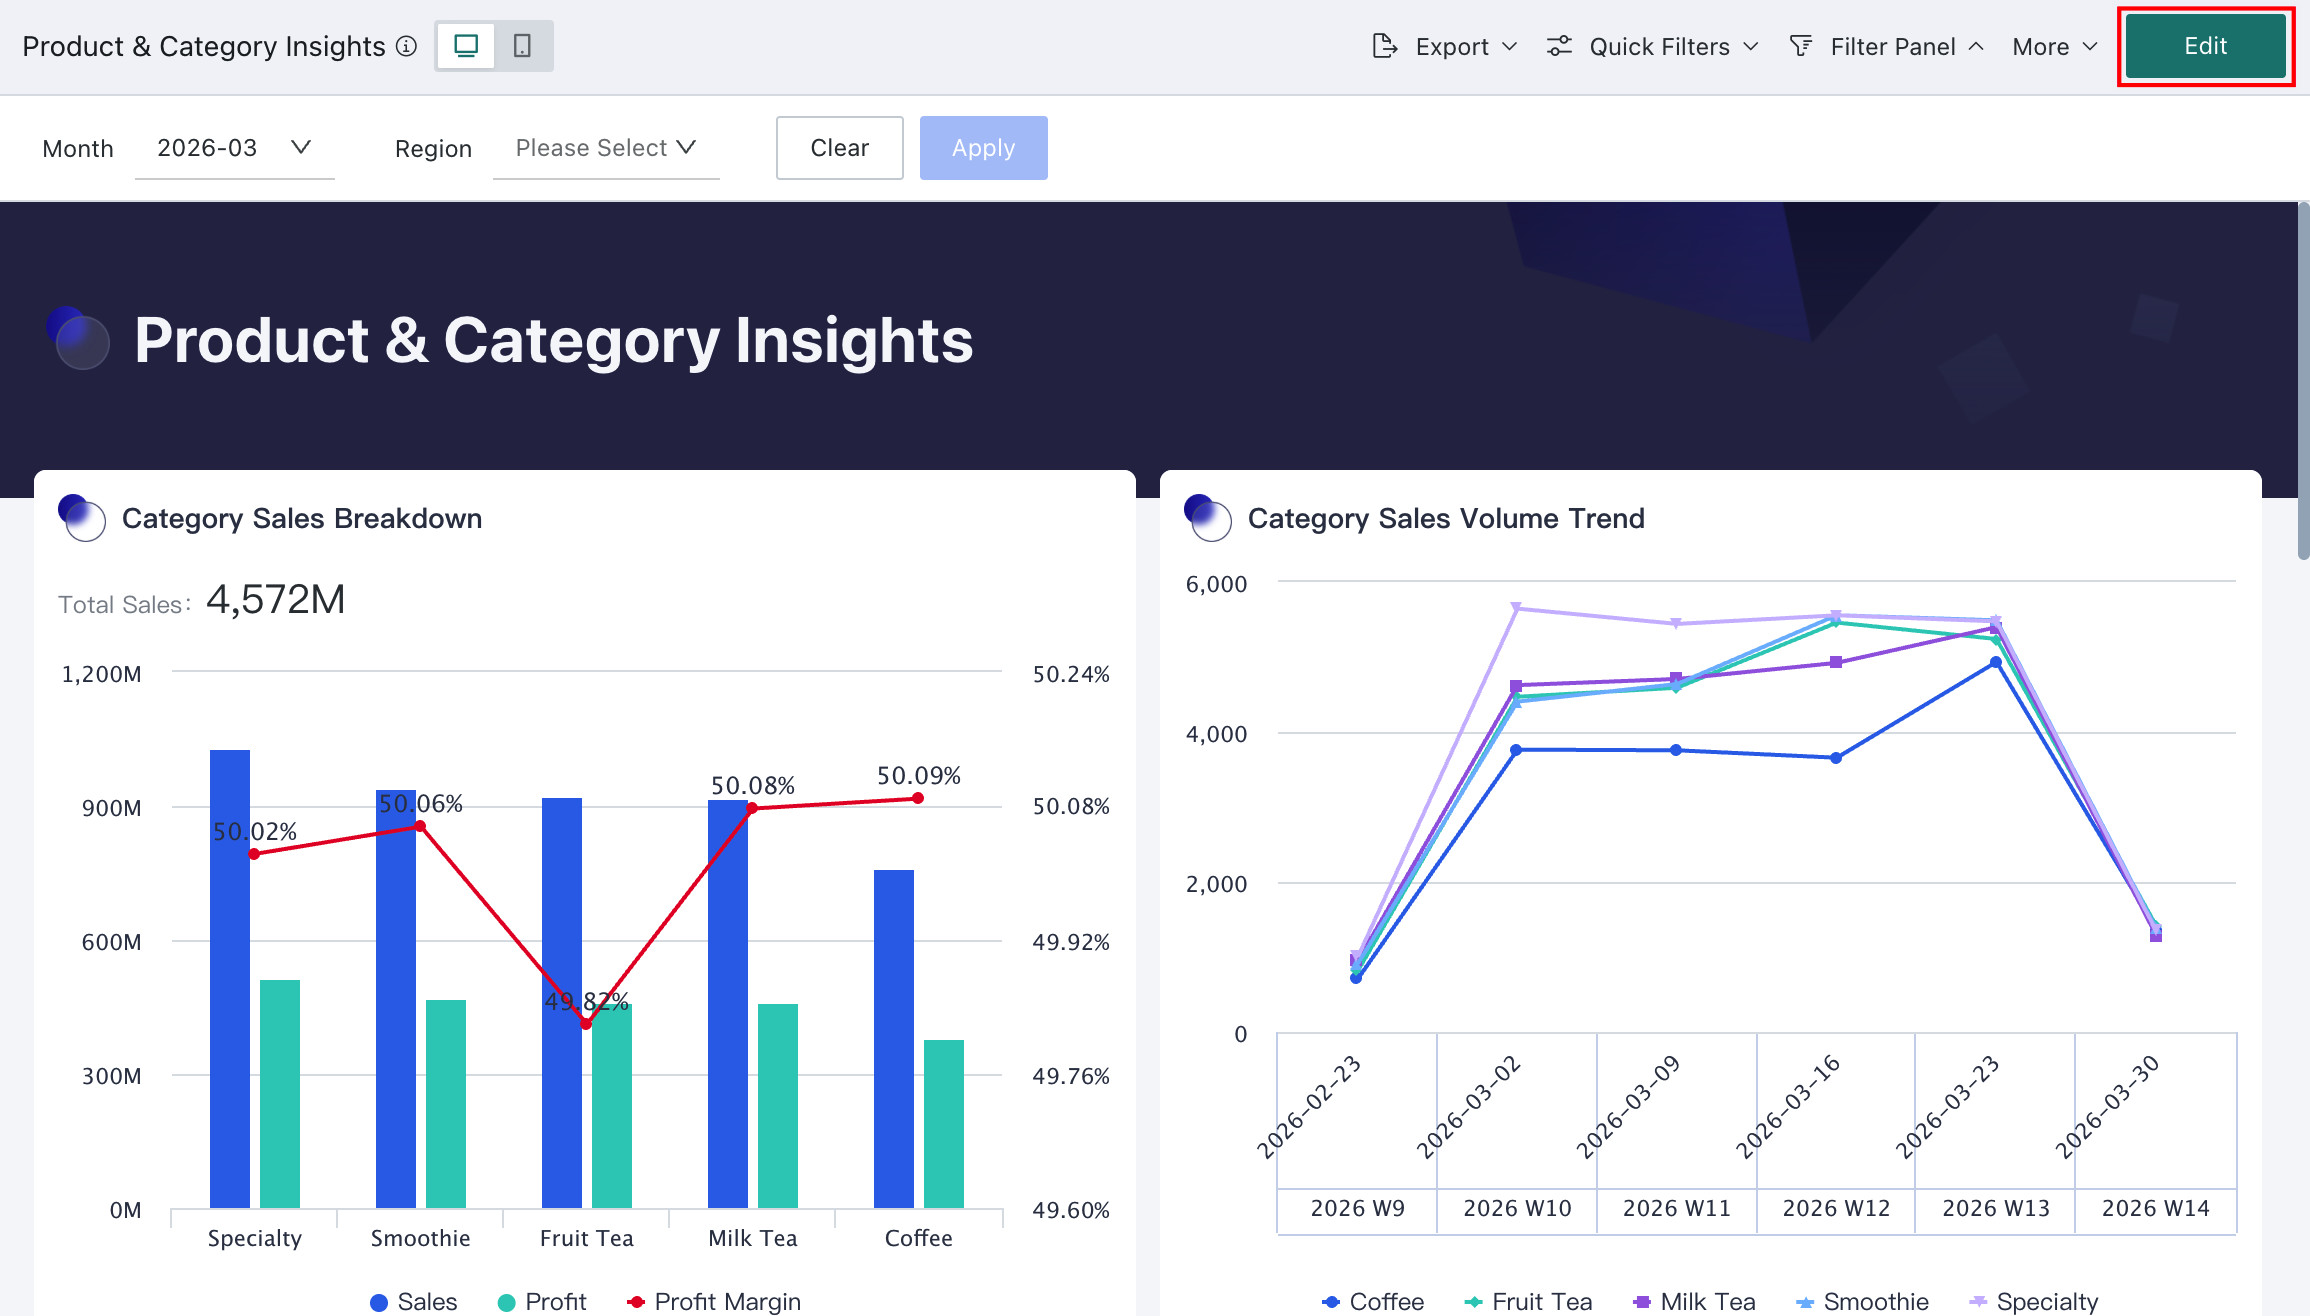
After a Dashboard page has been created, analysts can continue maintaining it through a variety of management actions. For example, they can add viewers or editors through Permission Management, adjust page styles, view dataset information, and more. They can also open a Dashboard in a new tab, rename it, move it, or save it as another page from the left-side Dashboard directory.
Dashboard Left Directory Operations
Favorite Pages
You can favorite any page you have access to. In the left-side Dashboard directory, click the star icon for a page to add it to **Favorites**, making it easier to find important pages quickly.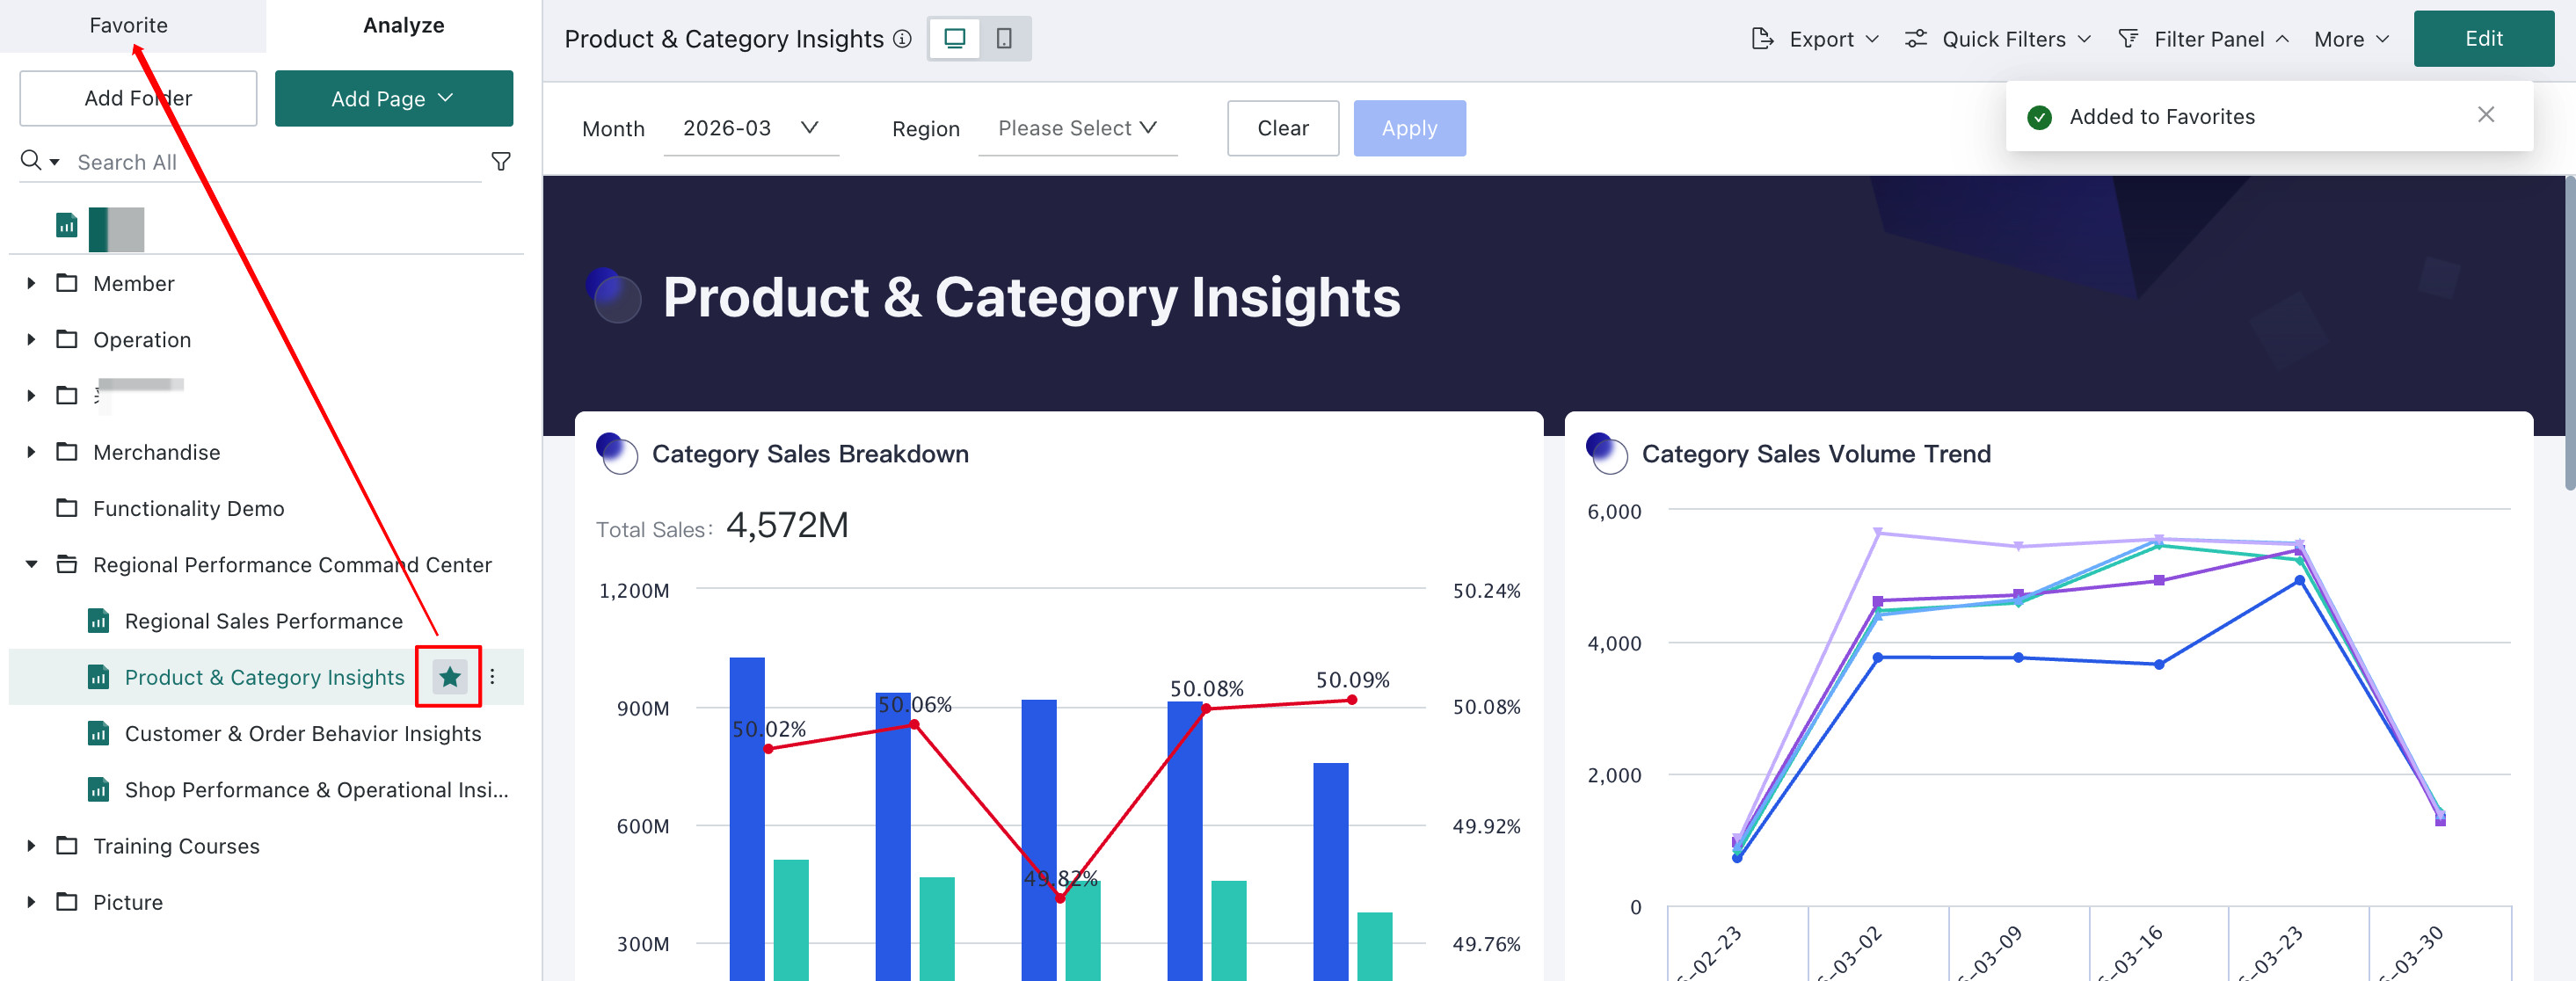
Open in New Tab
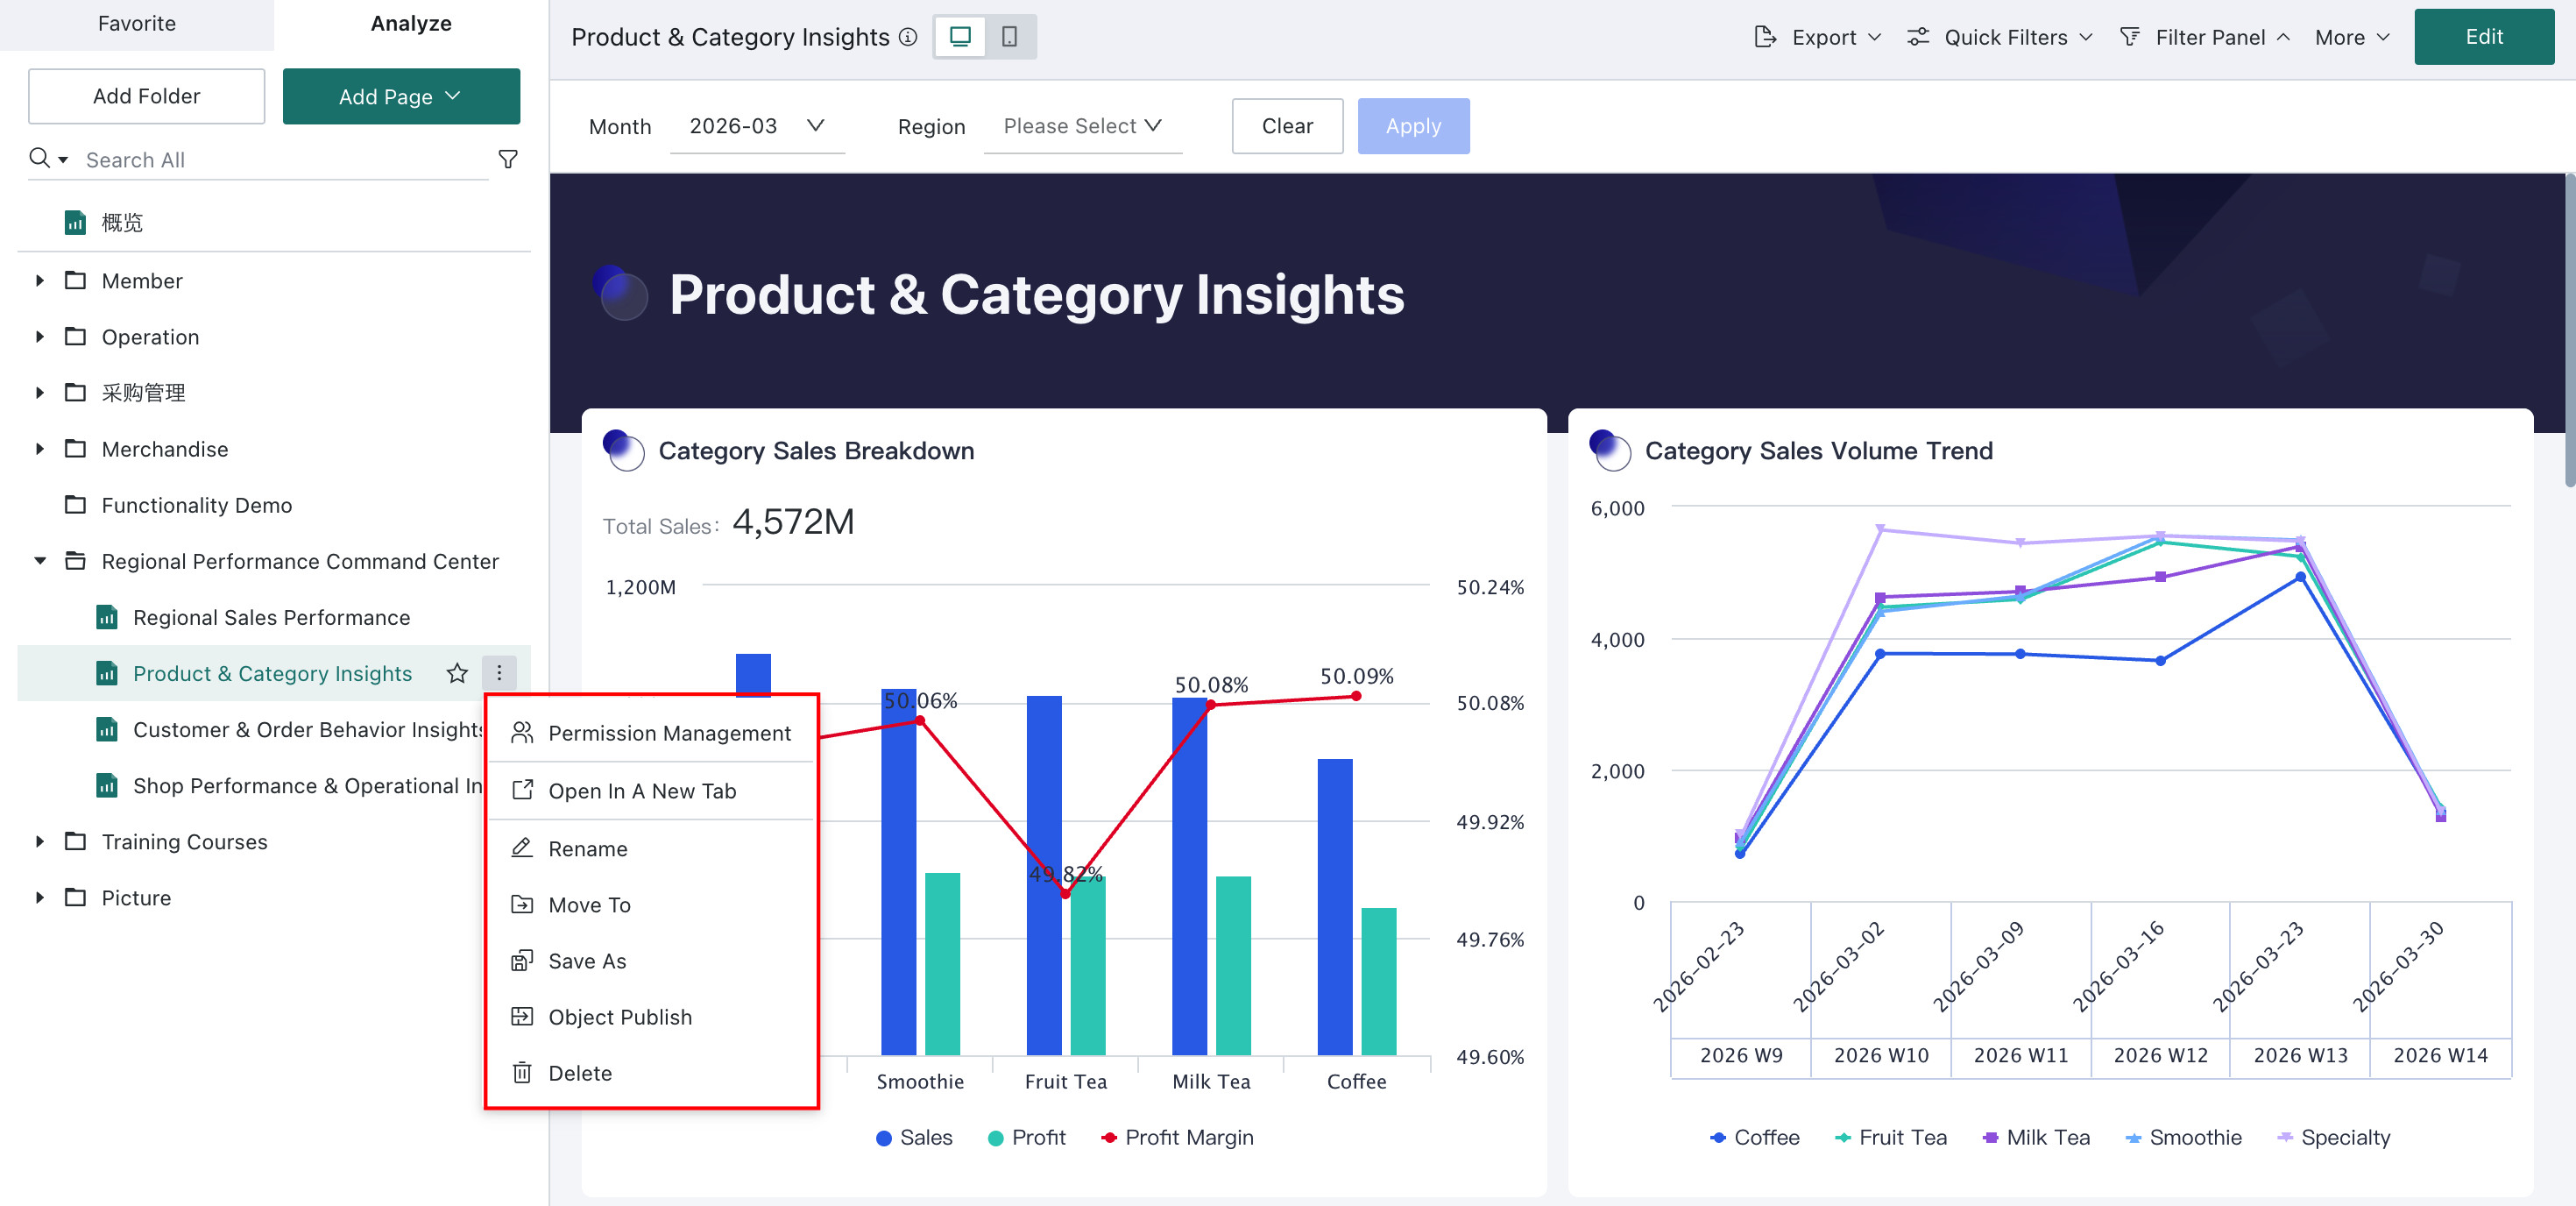
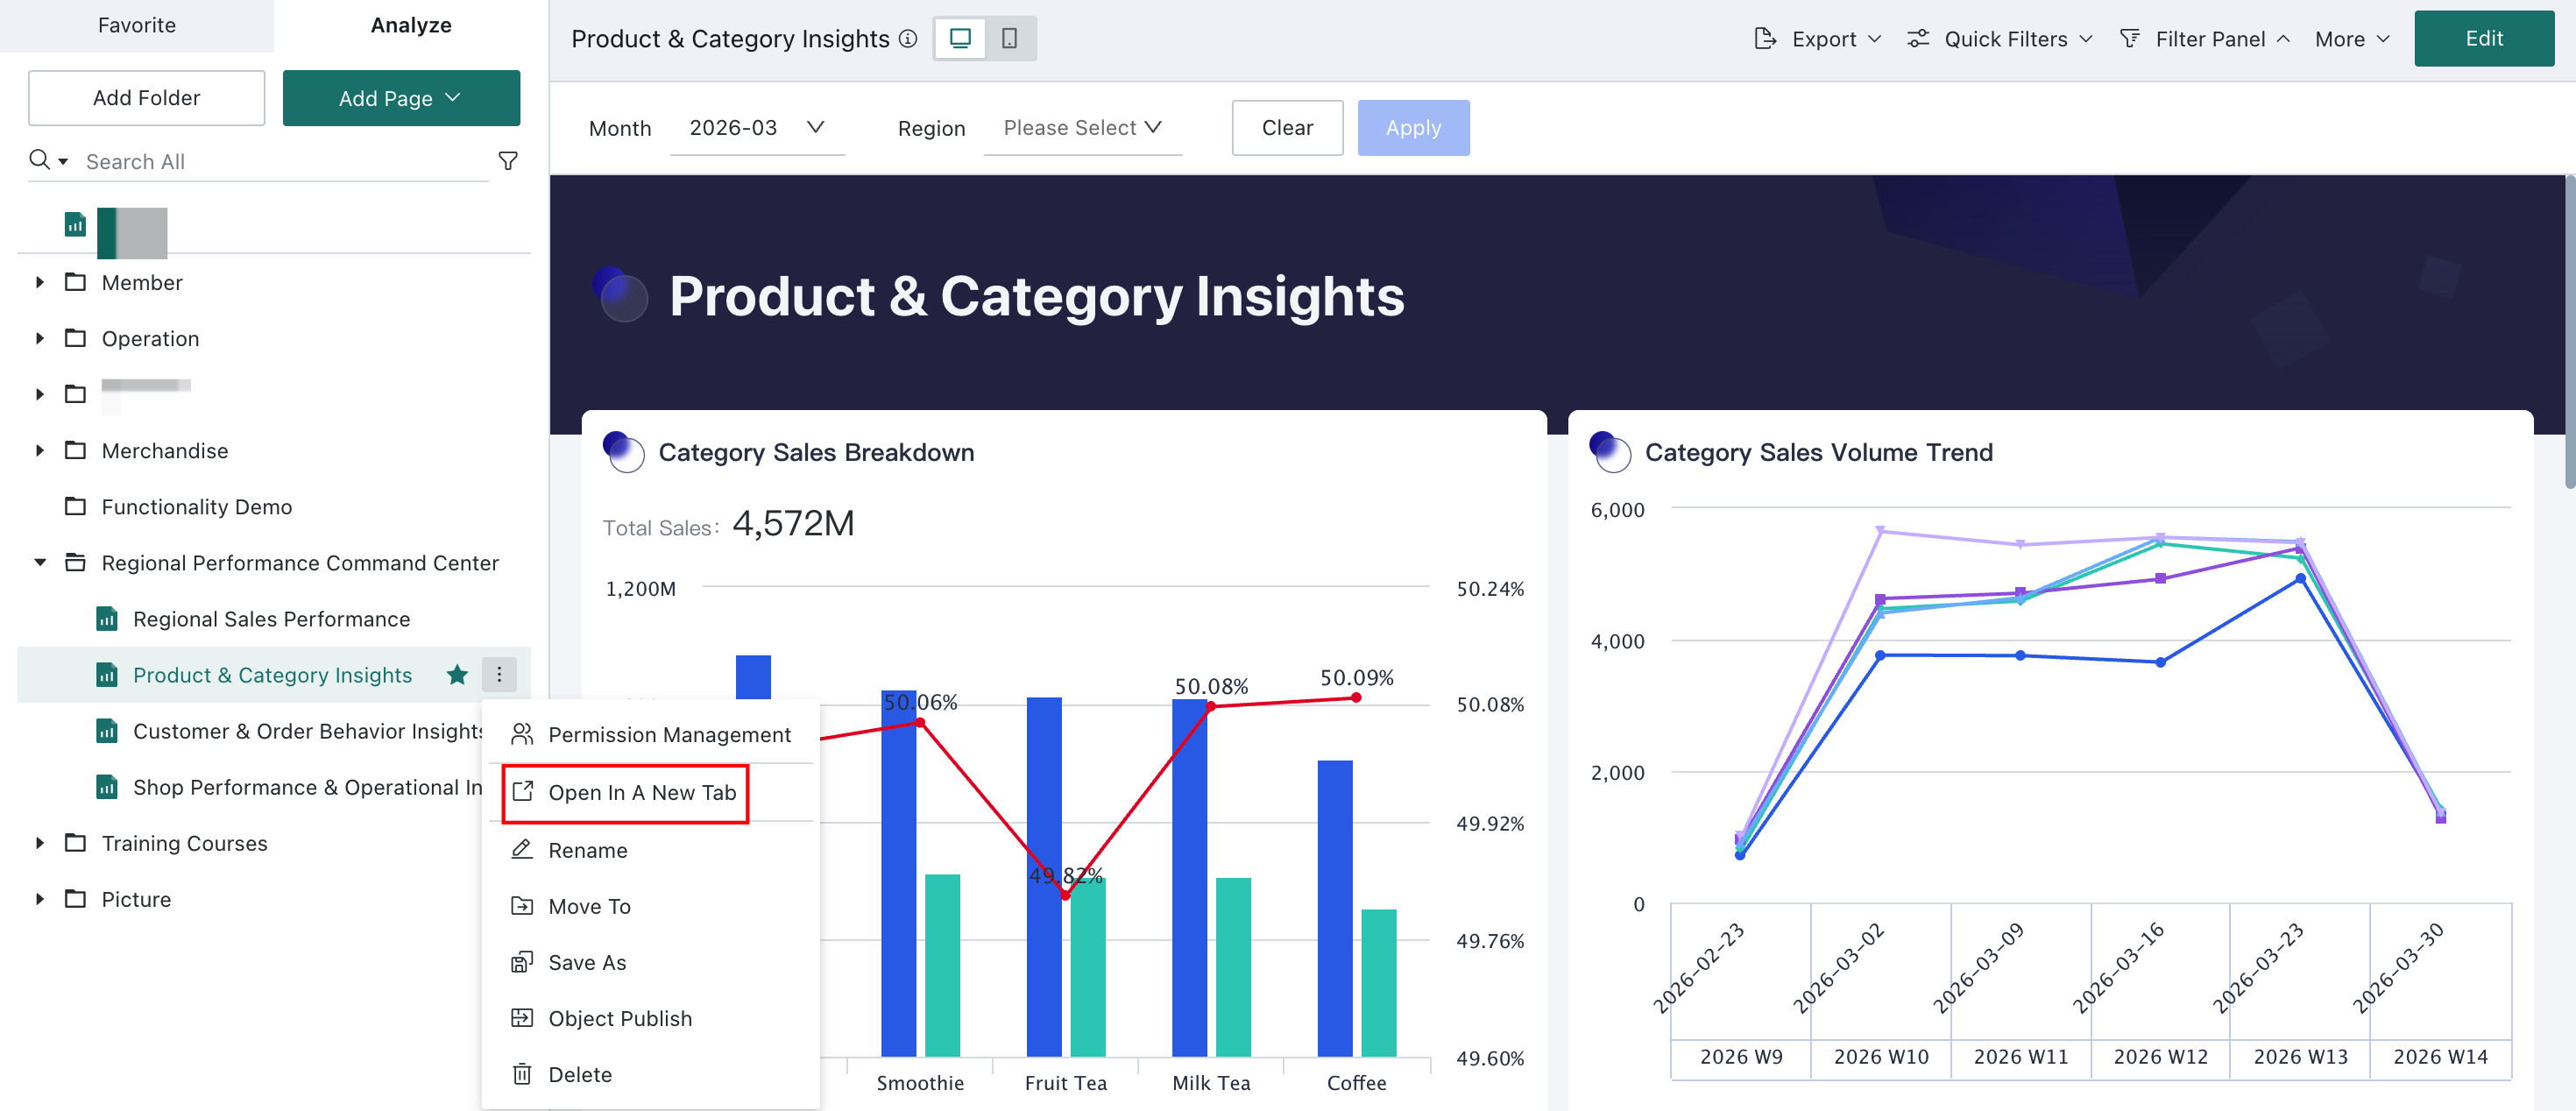
If you want to review another analysis page without replacing the current tab, select the page in the left-side resource list, click ..., and choose Open in New Tab.
Rename
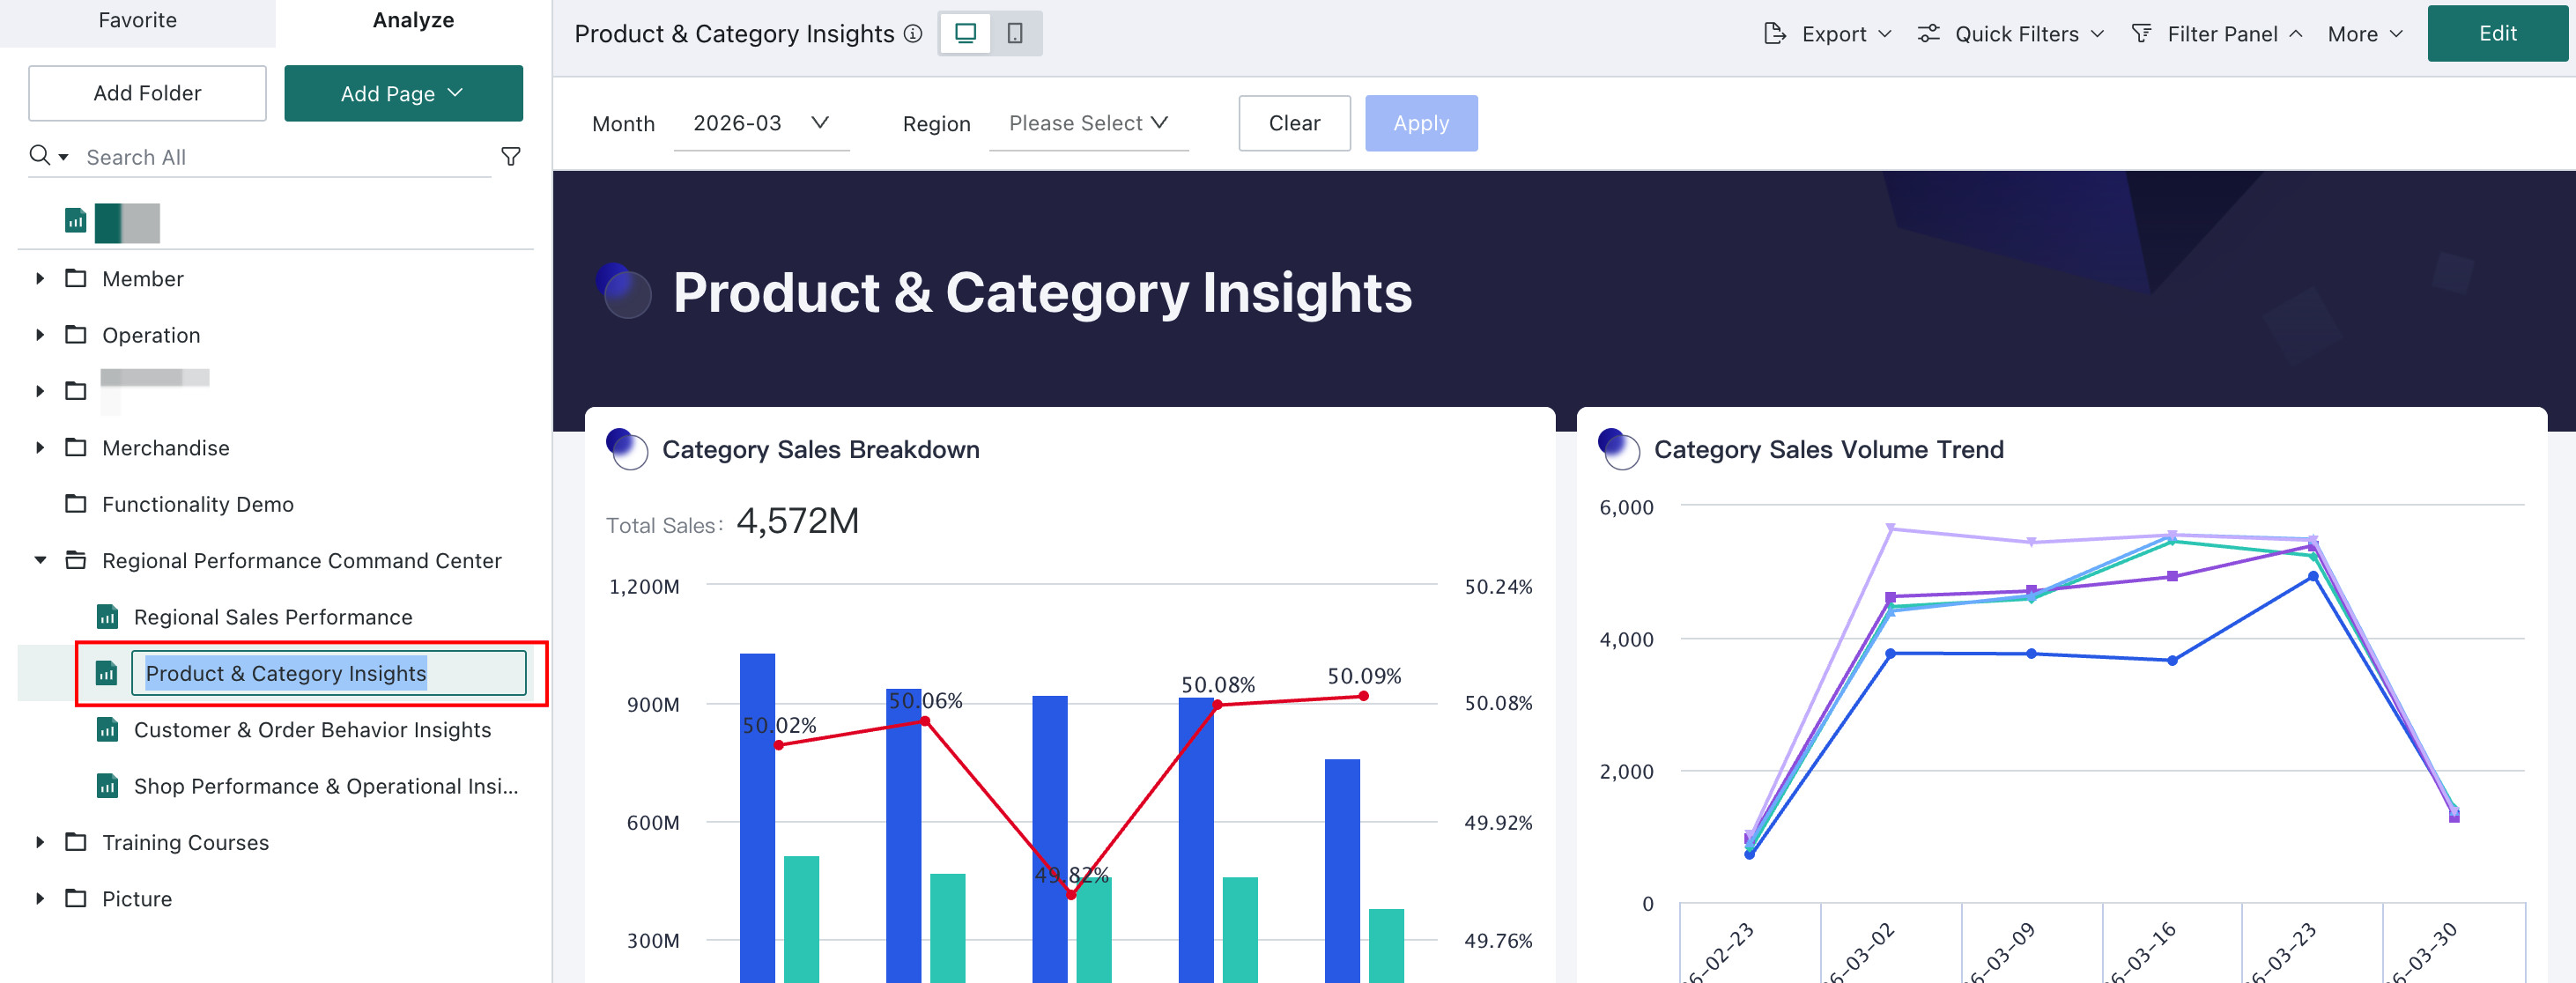
In the left-side Dashboard directory, select a page, click ..., and choose Rename.
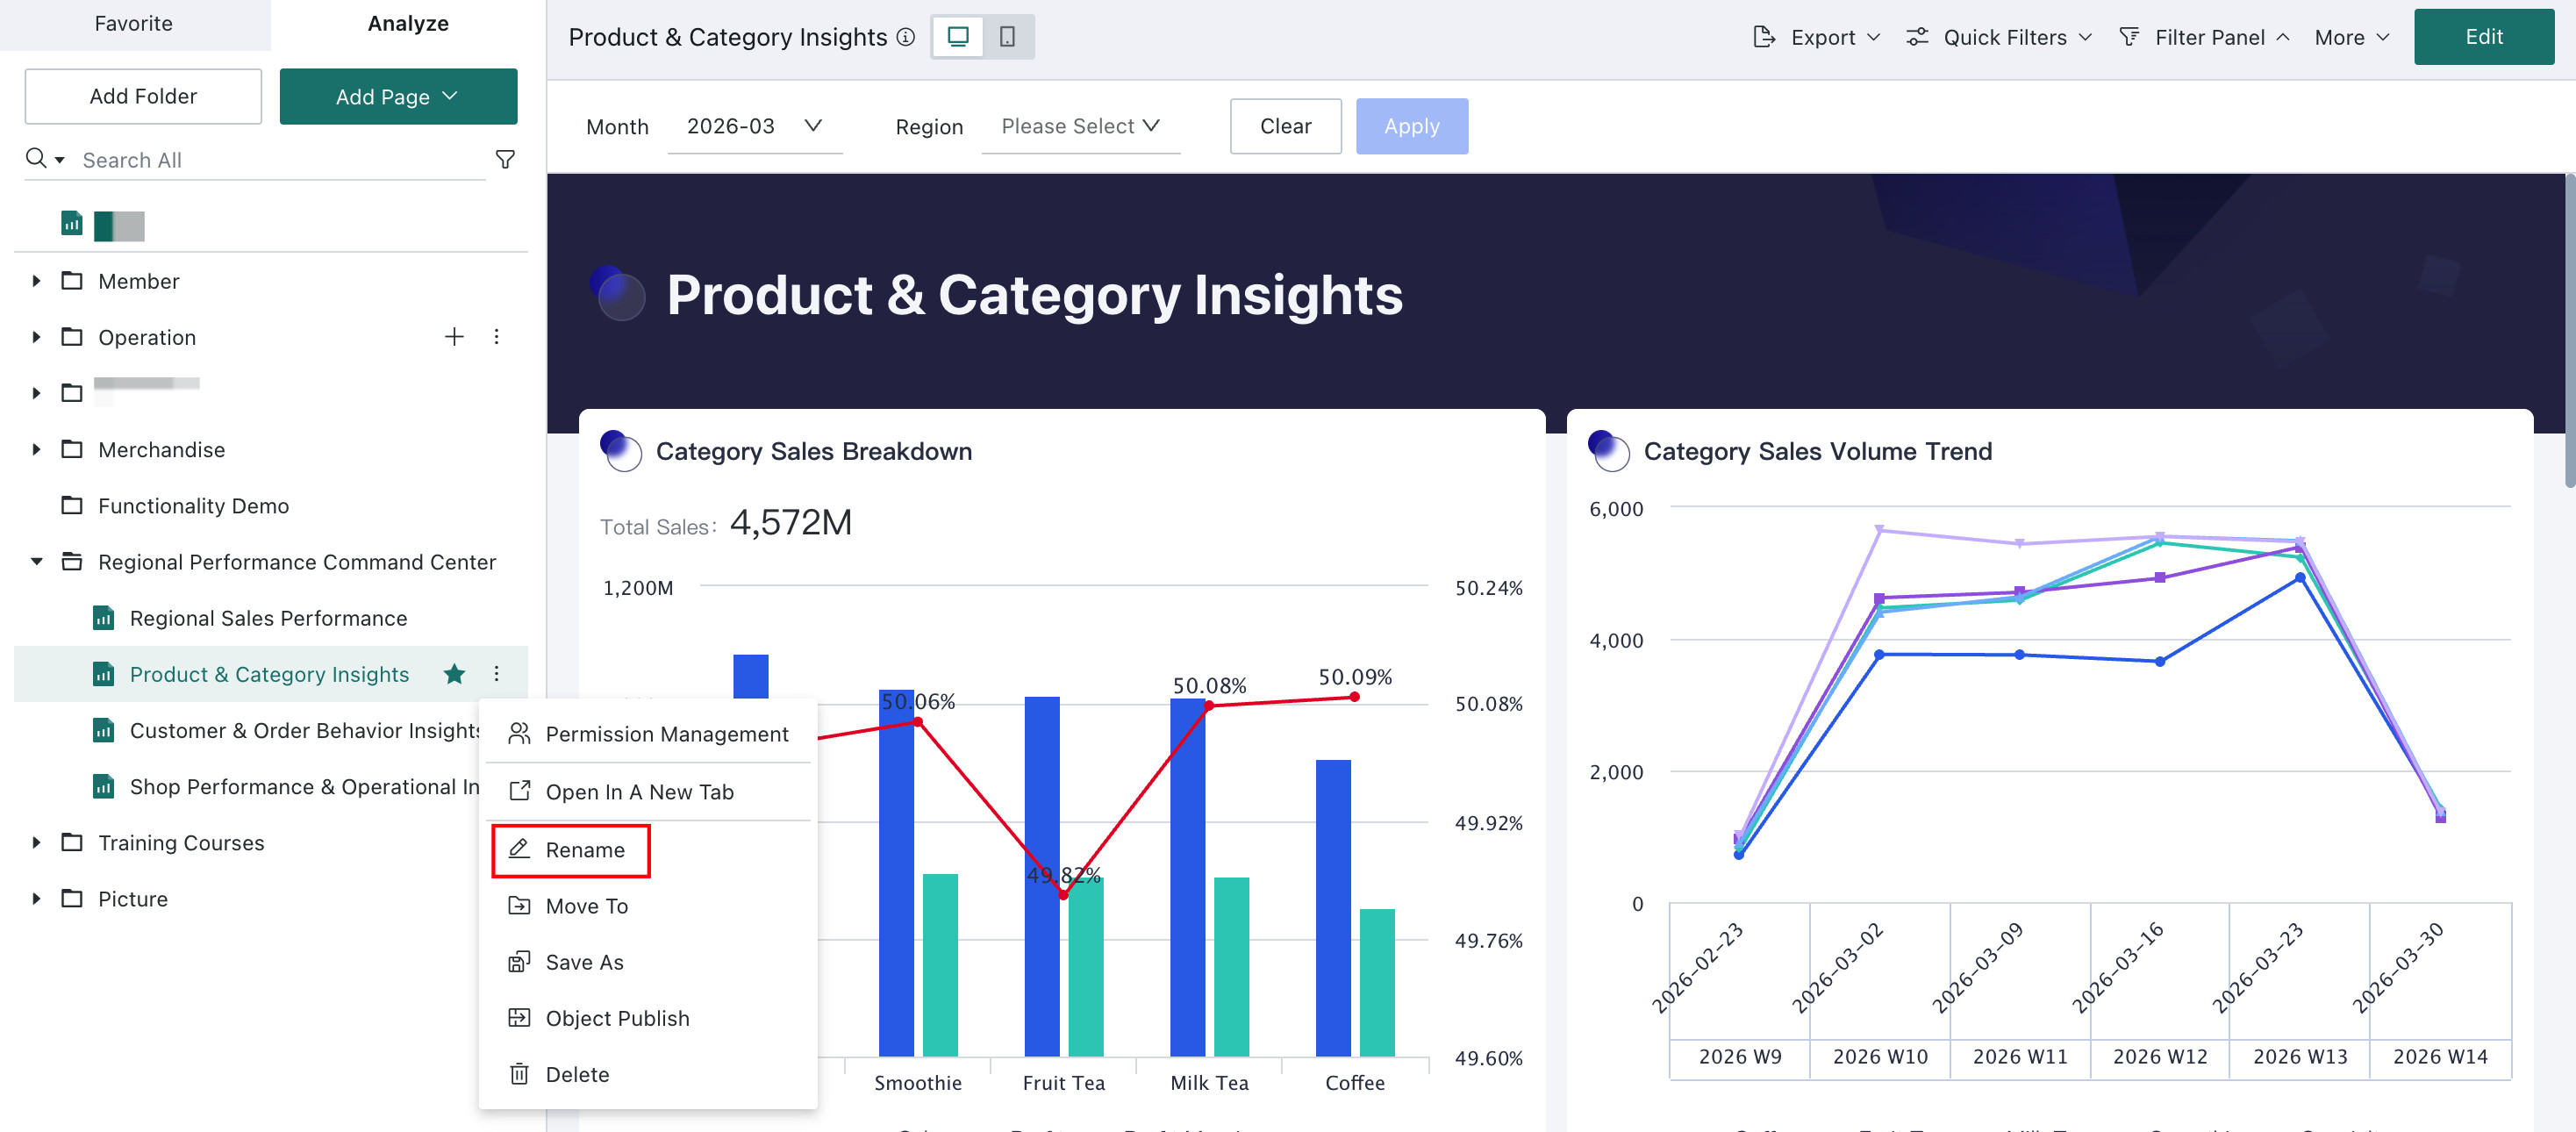
You can also rename a folder or page directly by double-clicking its name.
Move To
Click ... for a page and choose Move To to move it into another directory you can access. The page is removed from the current directory after the move.
If you want to create a copy instead of moving the page, use Save As.

Migrate
When resources need to be moved from one environment to another, for example from testing to production, you can use the migration feature. Click ... for the page, select Migrate, complete the required migration settings and test the connection, then migrate the target Dashboard in one step. For more details, see Resource Migration.
If Management Center > Operations Management > Migration > Online Migration is configured to assign a fixed resource owner after migration, the migration can be completed directly without filling in additional ownership information.
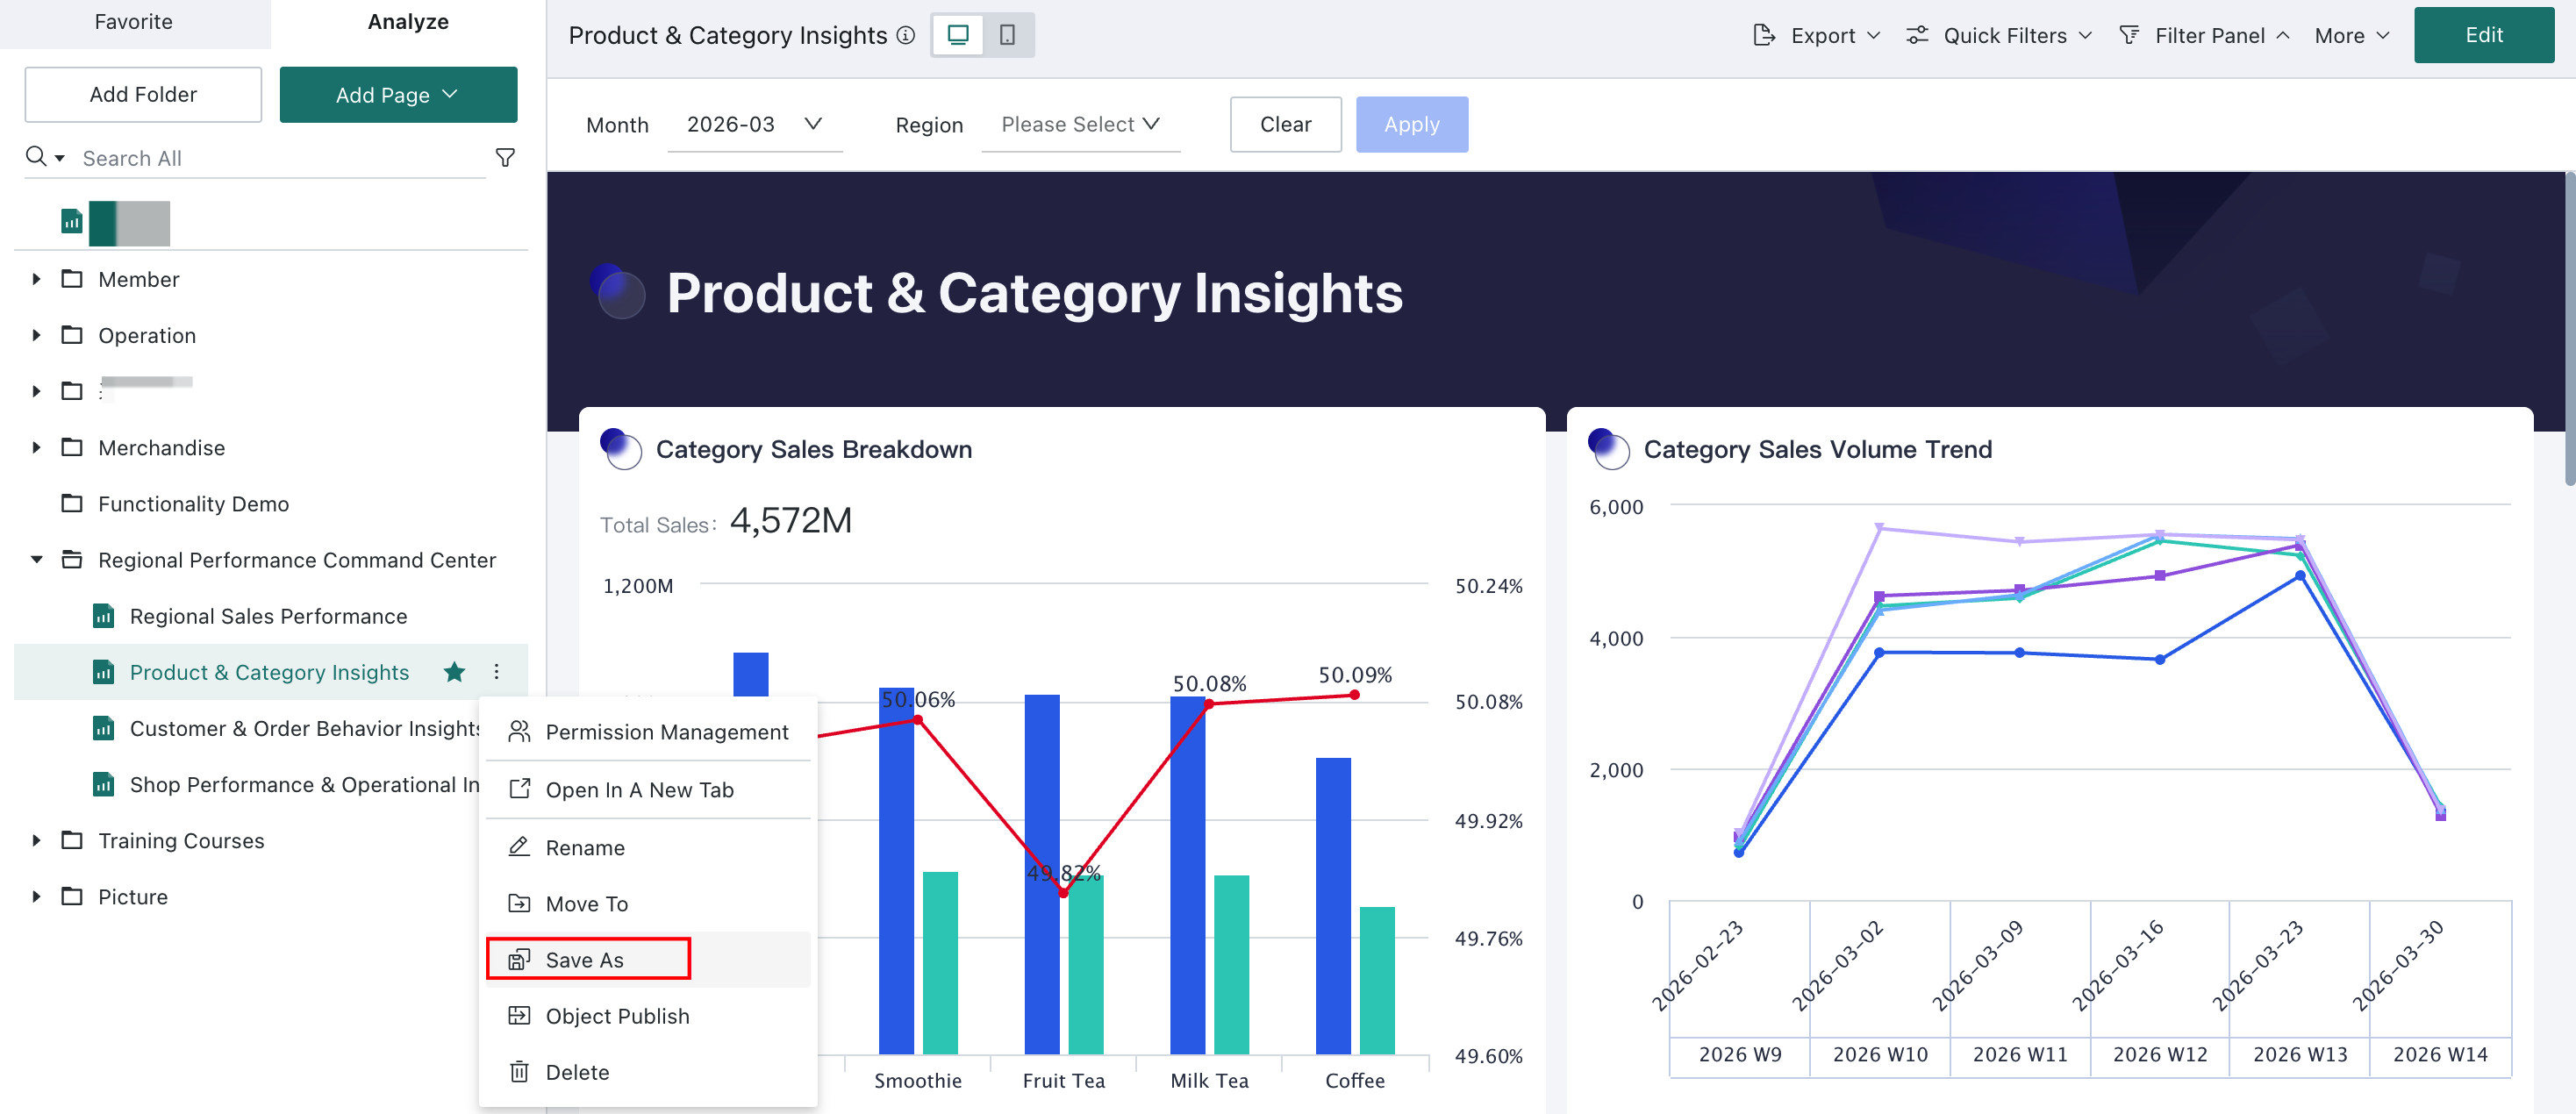
Save As
Click ... for a page and choose Save As to save a copy into another directory you can access. This does not affect the current page.
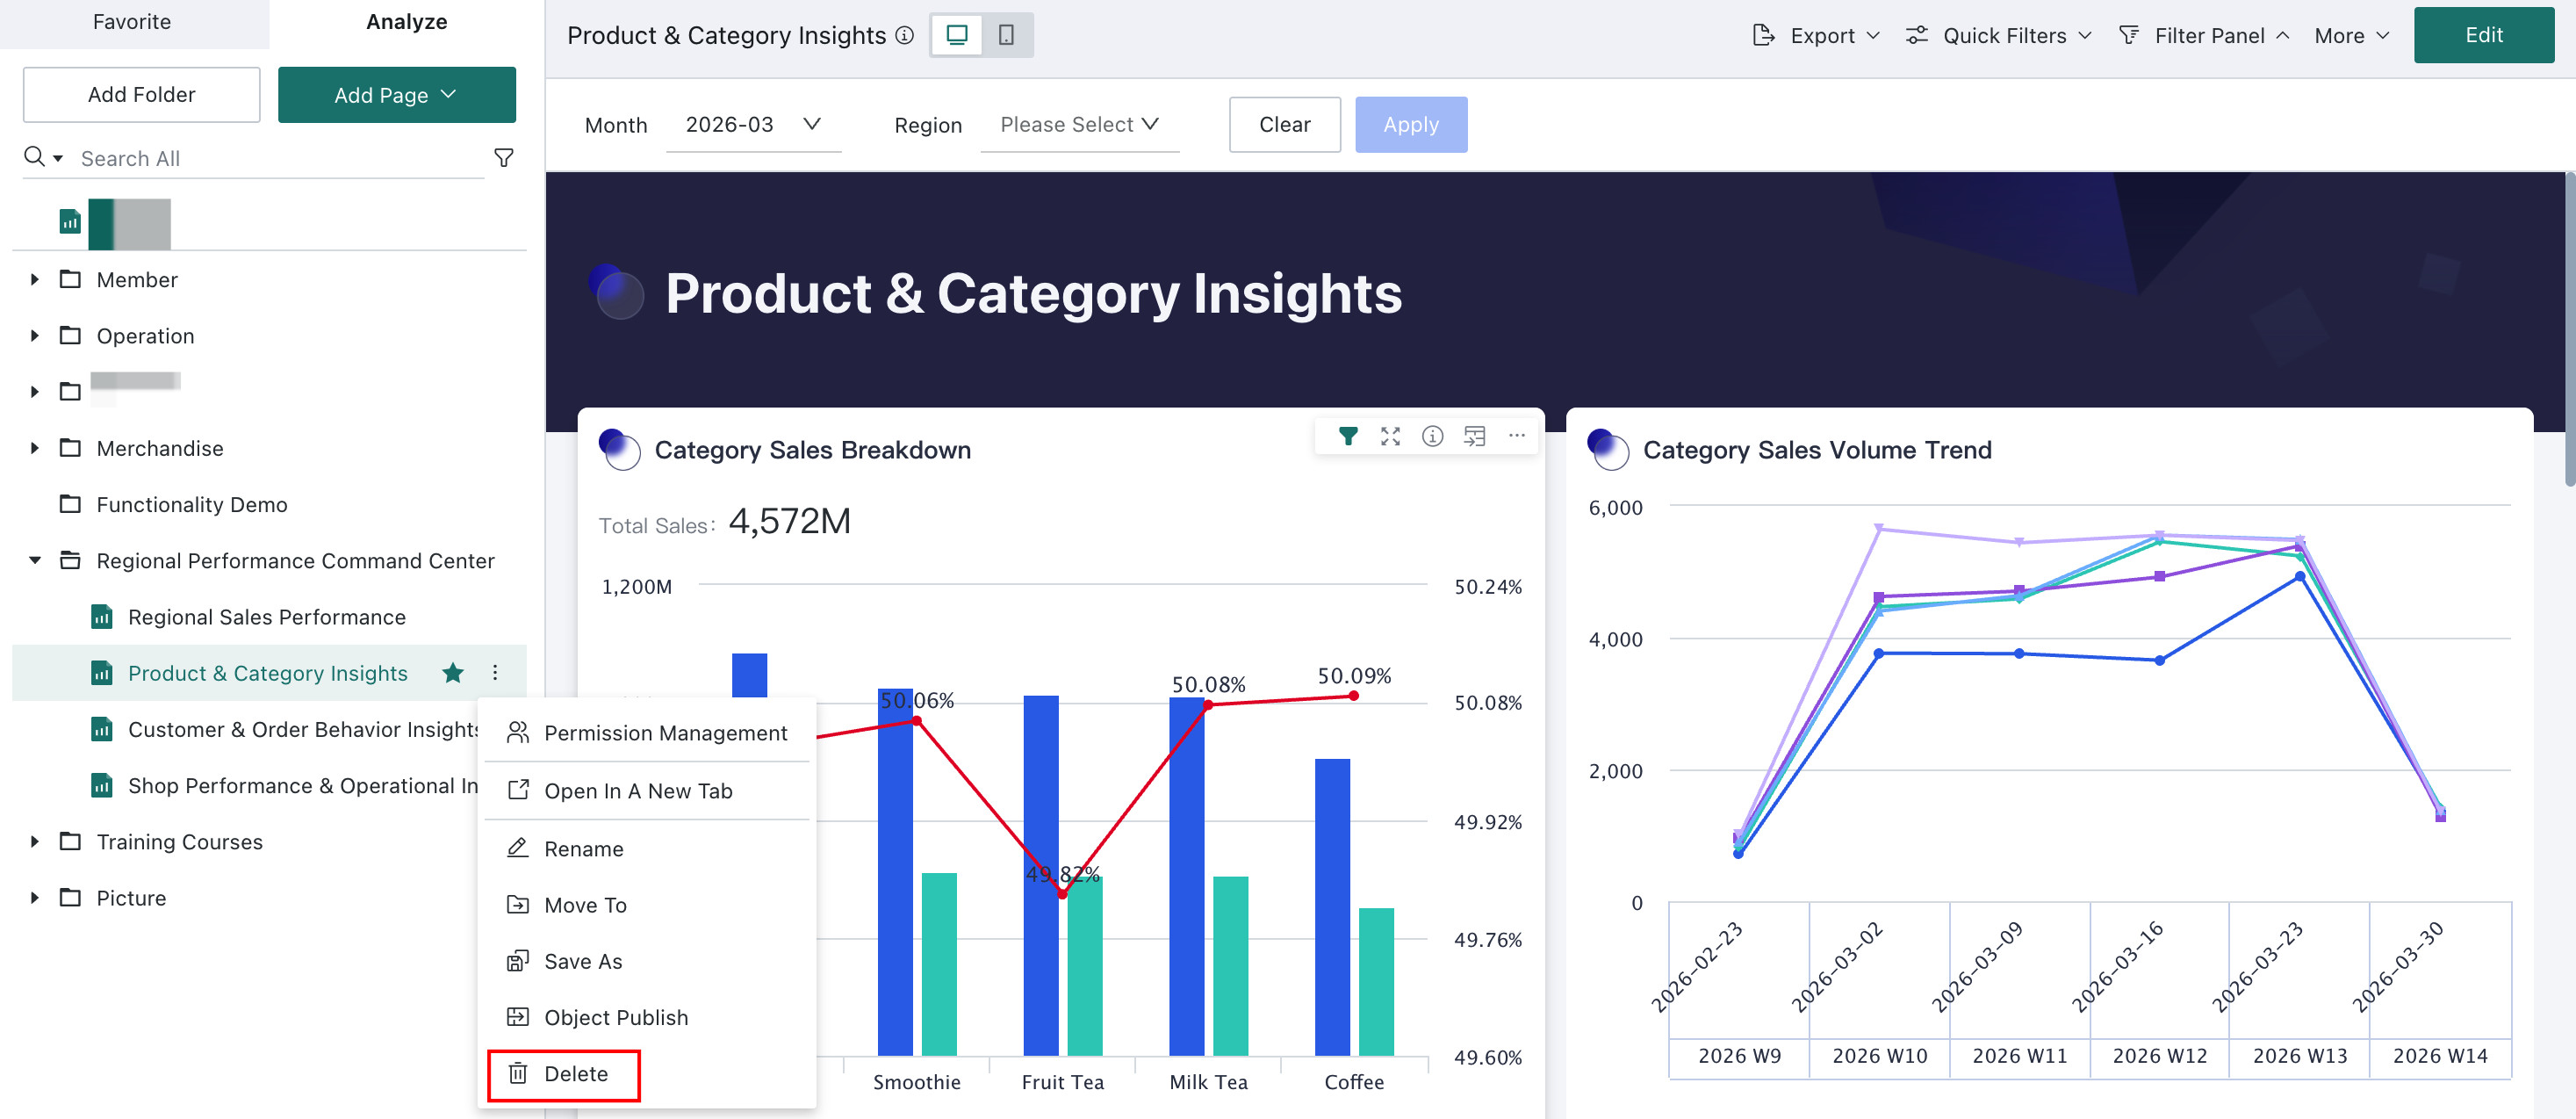
Delete
Click ... for a folder or page and choose Delete to remove it.
A folder cannot be deleted while it still contains content. For more details, see Dashboard Deletion and Recycling.
Dashboard Top Page Operations
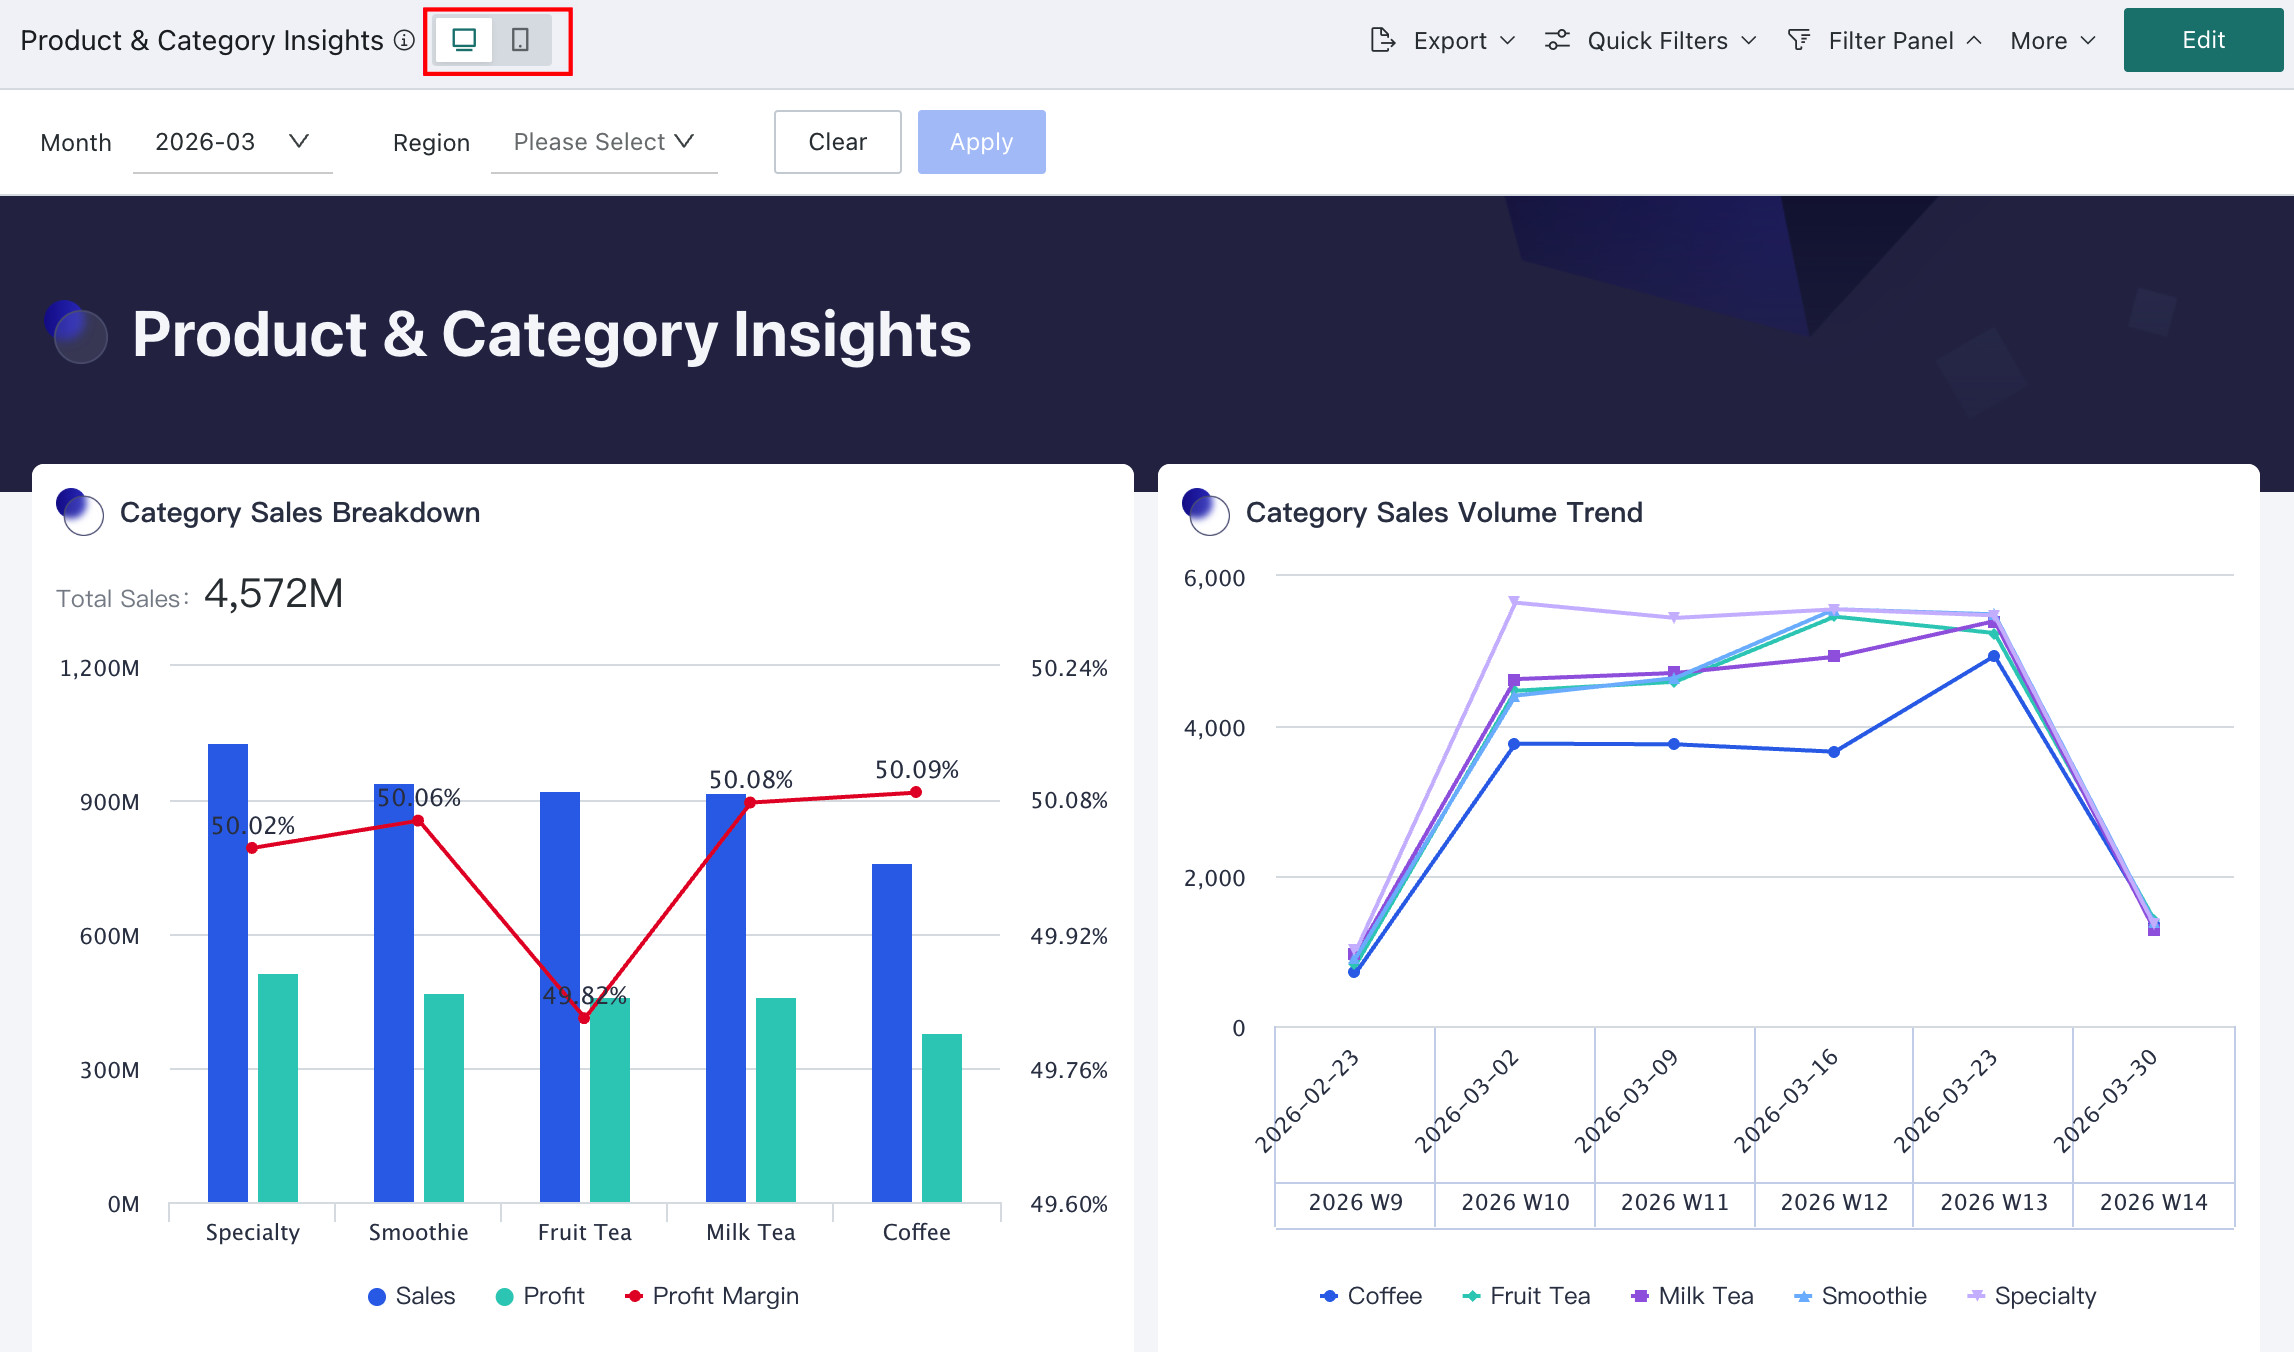
Desktop/Mobile Layout
New pages use the desktop layout by default. If business users also need to view the page on mobile devices, you can switch to the mobile layout and redesign the content for smaller screens. For details, see Mobile Layout.
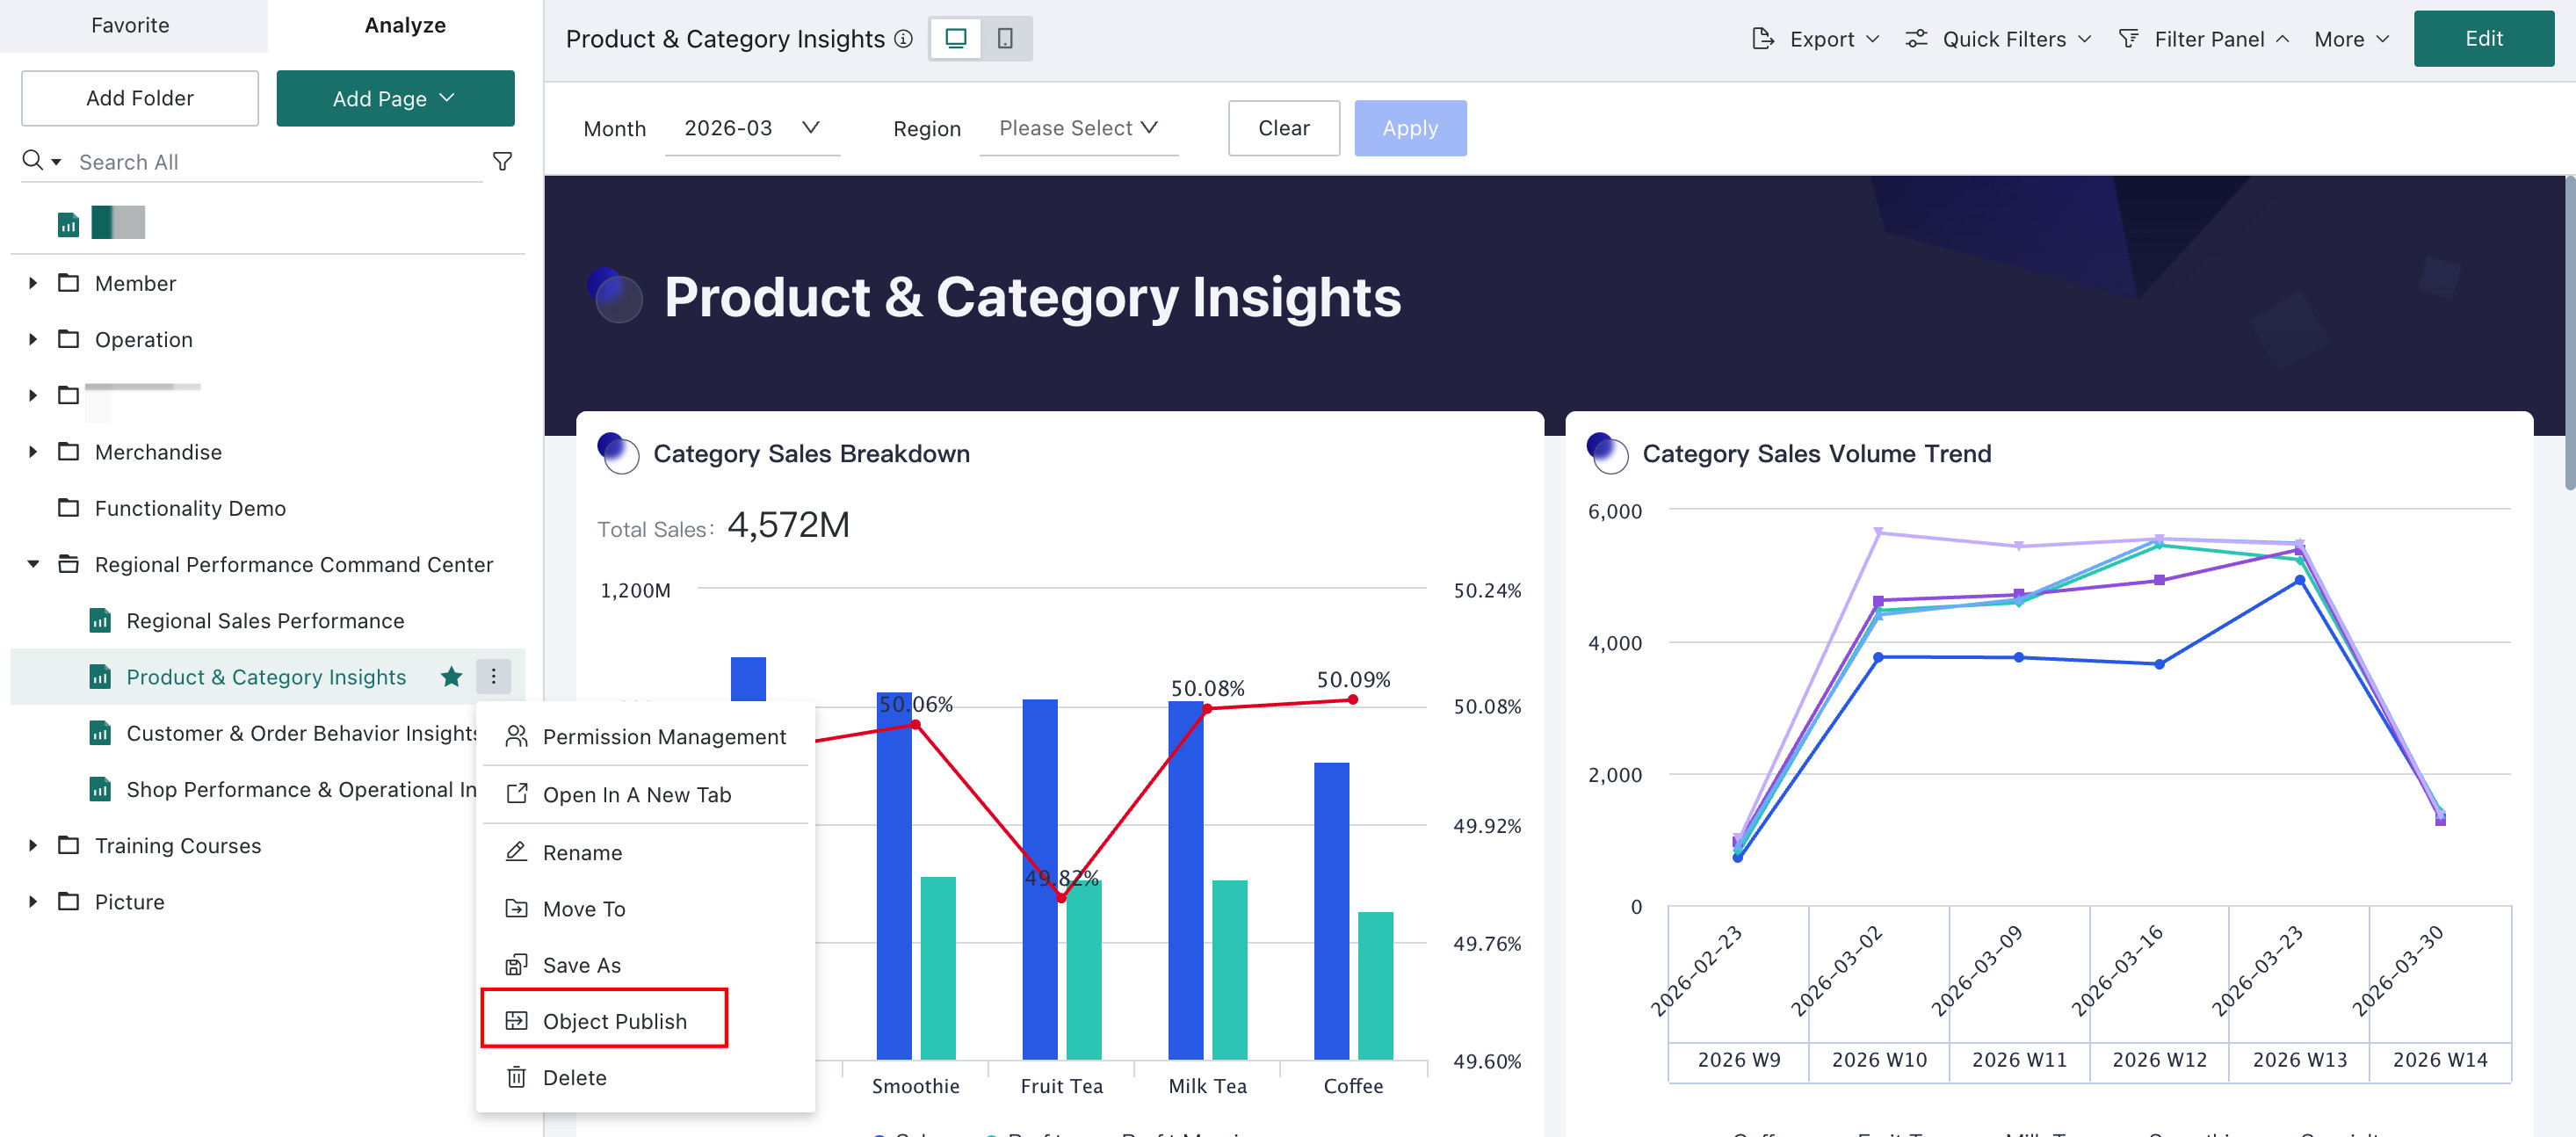
Publish
After editing is complete, click **Publish** to make the Dashboard available online.If business users should be able to see the page, turn on Visitor Visible for the relevant layout. Users with page-view permissions can then open the page and perform filtering and analysis. If the page needs to be revised or taken offline, turn Visitor Visible off. Editors can still access and maintain the page, but general viewers will no longer be able to open it.
Draft Page Feature Description
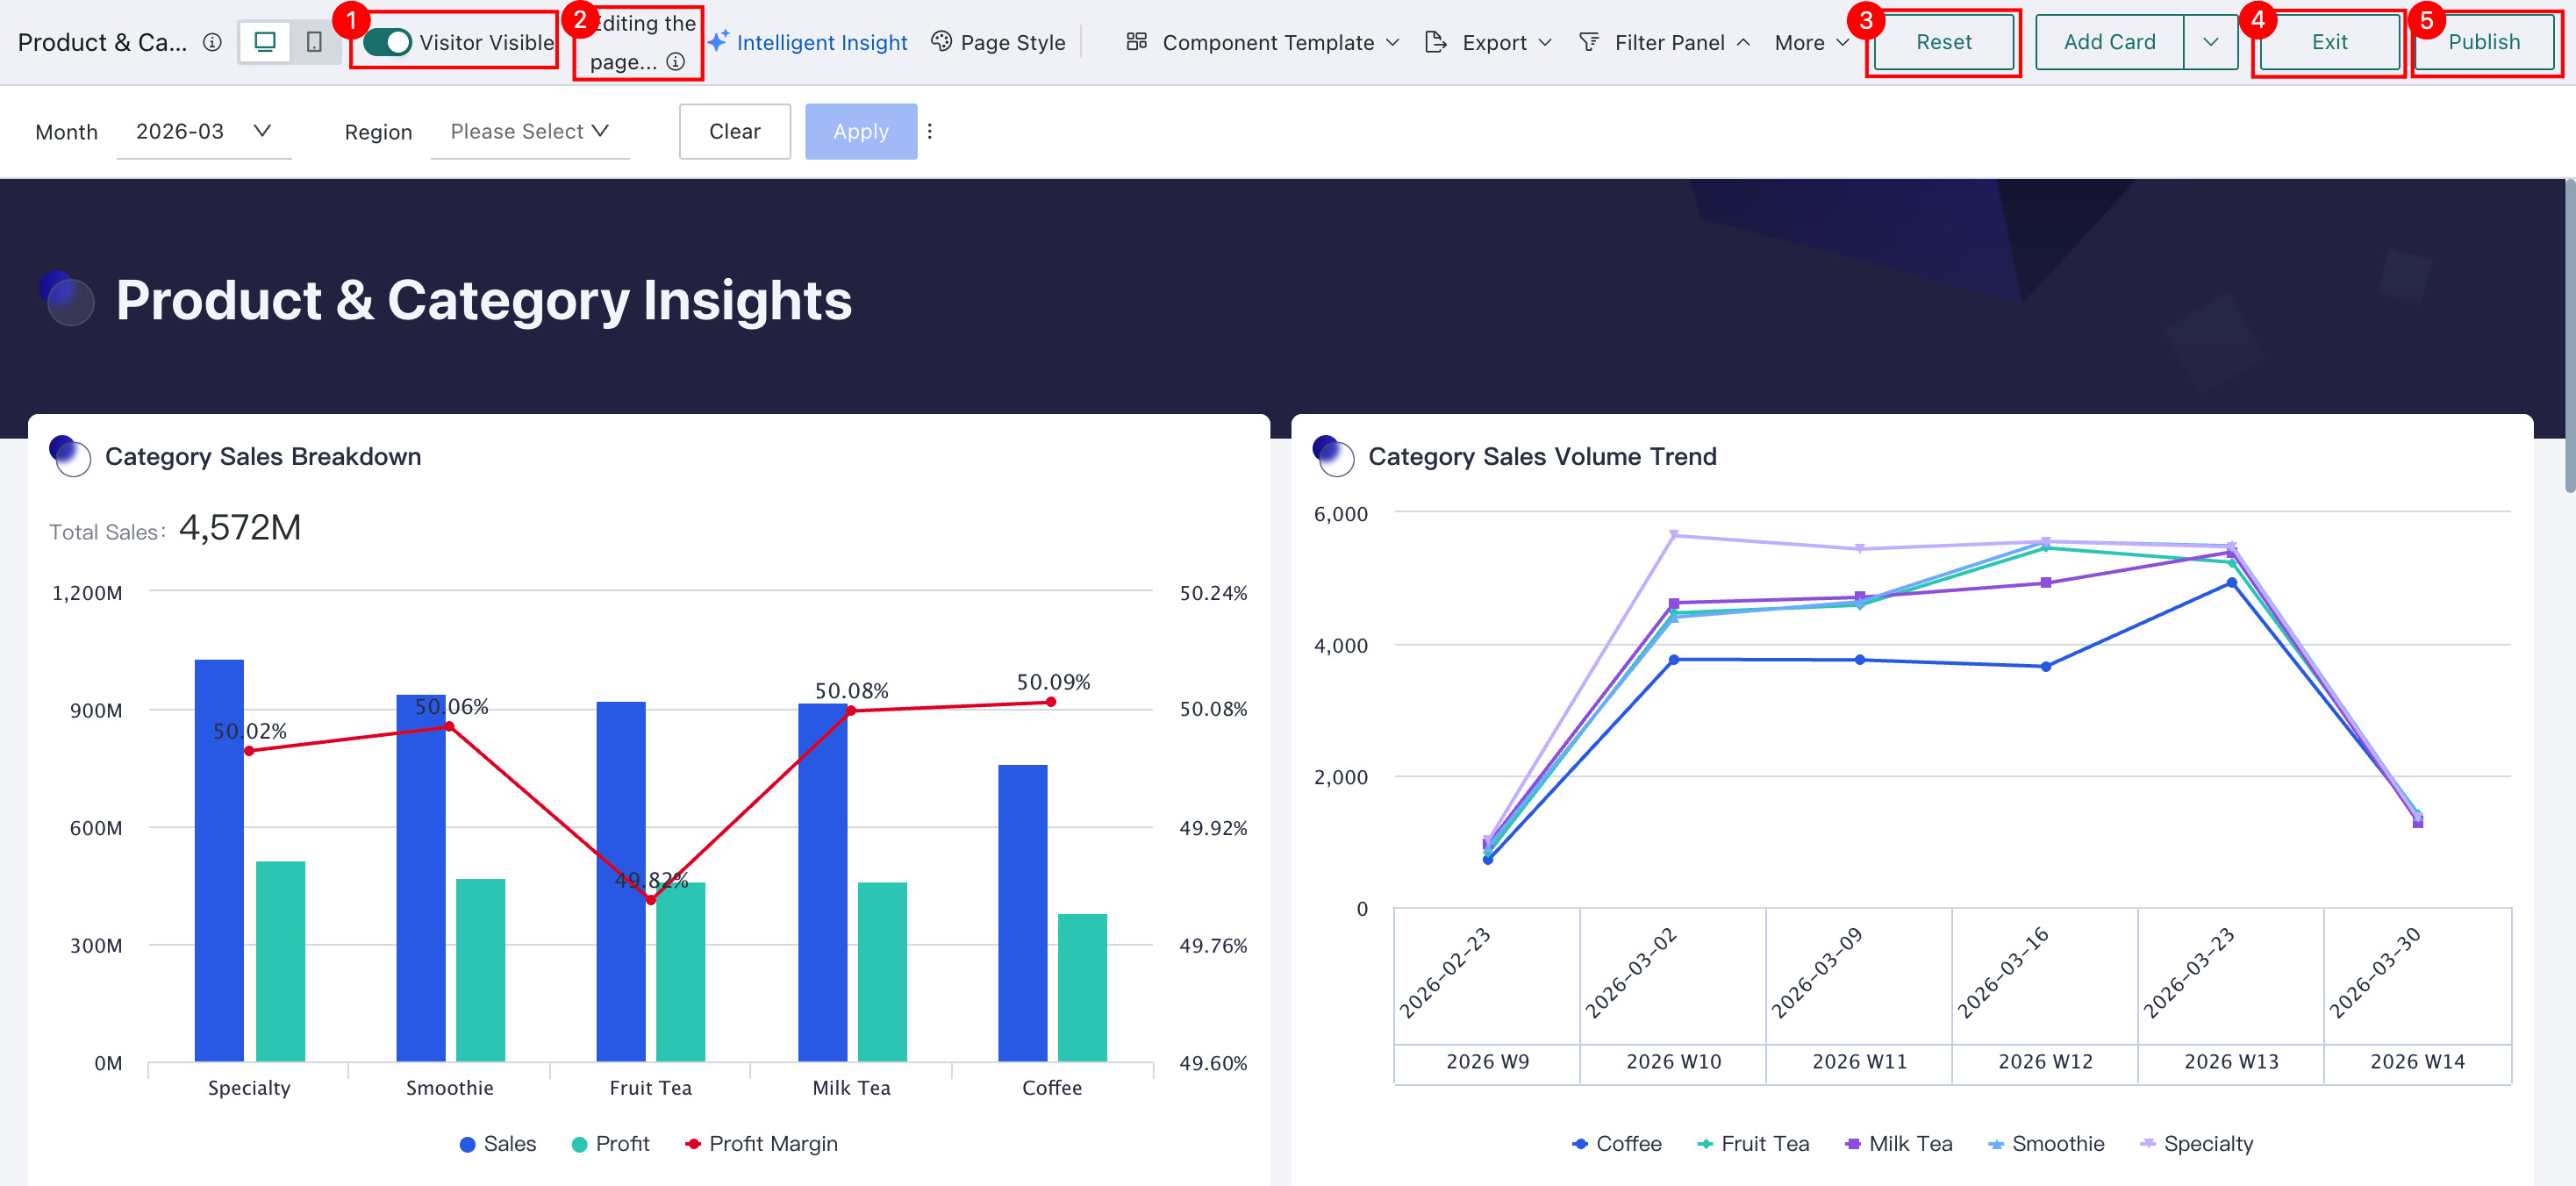
| No. | Button | Description |
|---|---|---|
| 1 | Visitor Visible | On: Authorized visiting users can view and use the published Dashboard. Off: Visitors cannot view the Dashboard. |
| 2 | Editing... | 1. Changes are saved in real time. 2. If you click Exit and later re-enter the editor, the latest draft is retained. 3. After publishing, the current draft is cleared. Re-entering the editor creates a new draft. 4. If multiple people edit at the same time, drafts may be overwritten. When one user publishes, other users' drafts become invalid. For details, see Multi-user Collaborative Editing Description. |
| 3 | Reset | Resets the draft back to the currently published online version. This action cannot be undone. |
| 4 | Exit | Leaves the editing page without publishing. When you return later, the latest saved draft is still available. |
| 5 | Publish | Publishes the Dashboard online for end users after the page is ready. |
How to Enter Draft State from Online State
Click Edit on the right side of the online page to enter draft mode.
Multi-user Collaborative Editing Description
When multiple people edit the same Dashboard at the same time, the system does not automatically merge their changes. The final result depends on the latest saved/published edit.
FAQ
-
Q: Why does it prompt me to refresh the page when I try to publish?
A: If another user edits after you and publishes, what is published is the latest draft on the server, not the content you currently see in your browser. At this time, the system will prompt you to refresh the page to view the latest draft. Please confirm it is correct before publishing.
-
Q: Why does it prompt "Page draft does not exist / Card not found"?
A: Another user has already published, causing the current draft to be cleared. You can refresh the page to re-enter the editing state.
-
Q: Why doesn't the card I added appear in the final published page?
A: After you added the card, another user made other edits to the Dashboard page and published them, causing your new content to not be included. After re-entering editing, the card will appear at the end of the page.
Quick Problem Location
| Problem Phenomenon | Possible Cause | Solution |
|---|---|---|
| Content after publishing is not what I modified | Others edited last and covered it | When trying to publish, the system will prompt to refresh. After refreshing, confirm it is correct before publishing |
| Cards disappear or positions are abnormal after publishing | Others edited last and covered it | When trying to publish, the system will prompt to refresh. After refreshing, confirm it is correct before publishing |
| Cannot publish / "Page draft does not exist / Card not found" error during Dashboard editing | Draft has been cleared | Refresh the page to re-enter editing state |
Collaborative Editing Mechanism
-
Draft Mechanism: All users share the same draft. The system does not automatically merge modifications from different users.
-
Content Overwrite Rules
- Editing the same card: Based on the content saved by the last click.
- Editing page structure (layout, card addition/deletion): Based on the result of the last edit.
-
Publish Mechanism
- When clicking "Publish", what is published is the latest draft on the server. It does not merge unsynchronized modifications from each user's local environment.
- After publishing, the current draft will be cleared. Unsynchronized or unapplied modifications will become invalid.
-
Publish Verification Mechanism
When clicking "Publish", the system performs the following verifications:
- Compares the server draft time with the local editing time. If they are inconsistent, it means another user has modified it. The system will prompt "Page content has changed". After clicking "Refresh Page", the latest draft will be loaded, and then you can publish.
- Checks whether there are abnormal cards (cards exist in the card list but are missing from the current canvas). If verification fails: refresh the page to avoid card missing after publishing.
Usage Suggestions (Strongly Recommended)
To reduce collaborative conflicts and content loss, it is recommended to:
- Avoid multiple people editing the same module simultaneously, especially the same card or the same area layout.
- If an abnormal prompt appears during editing, refresh the page immediately.
- When collaborating with multiple people, it is recommended to communicate the editing scope in advance, clarify division of labor, and reduce the risk of overwriting.
Permission Management
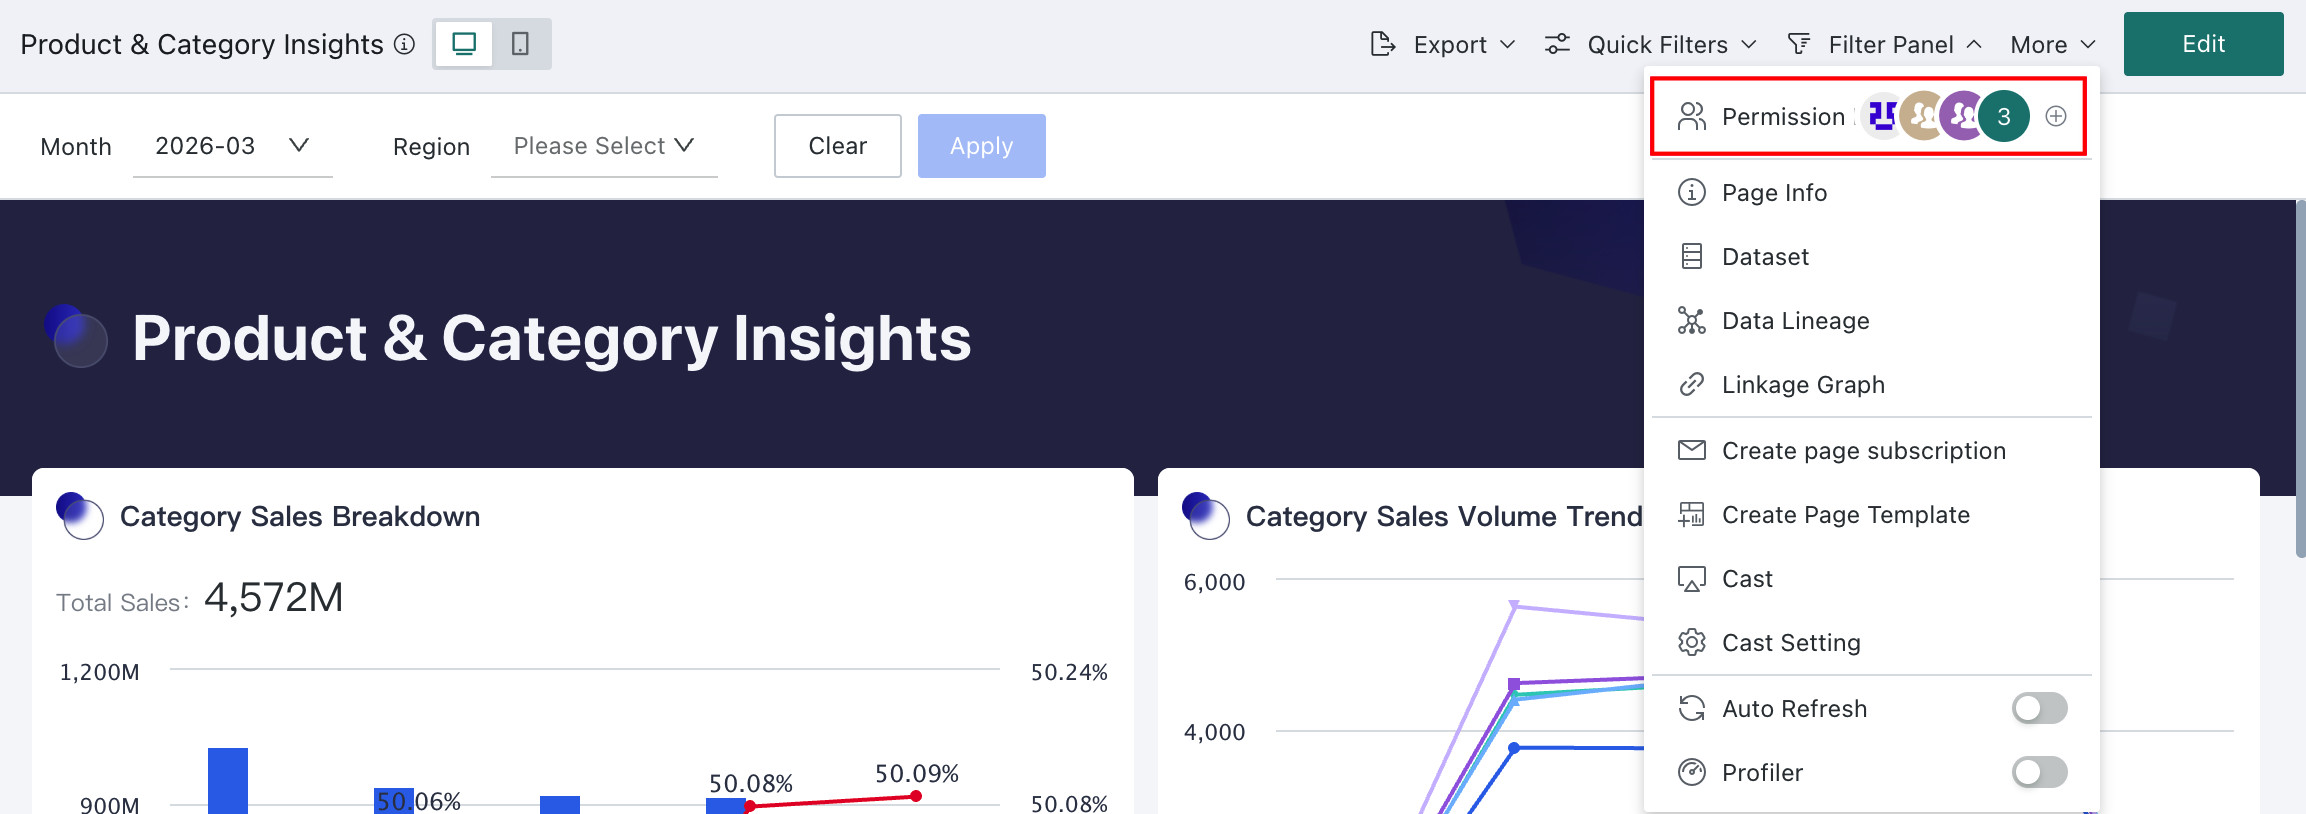
Different analysis topics are often meant for different business roles. Use Permission Management to add editors and viewers and control who can access the page. For details, see Permission Management.
Page Information
If a page requires additional business context, metric definitions, or other explanatory information, you can add a page description. This helps users understand the background and key logic behind the board more quickly.
Users can add description text when creating a Dashboard. Click Add Page on the left, open the page information dialog, and fill in the Description field.
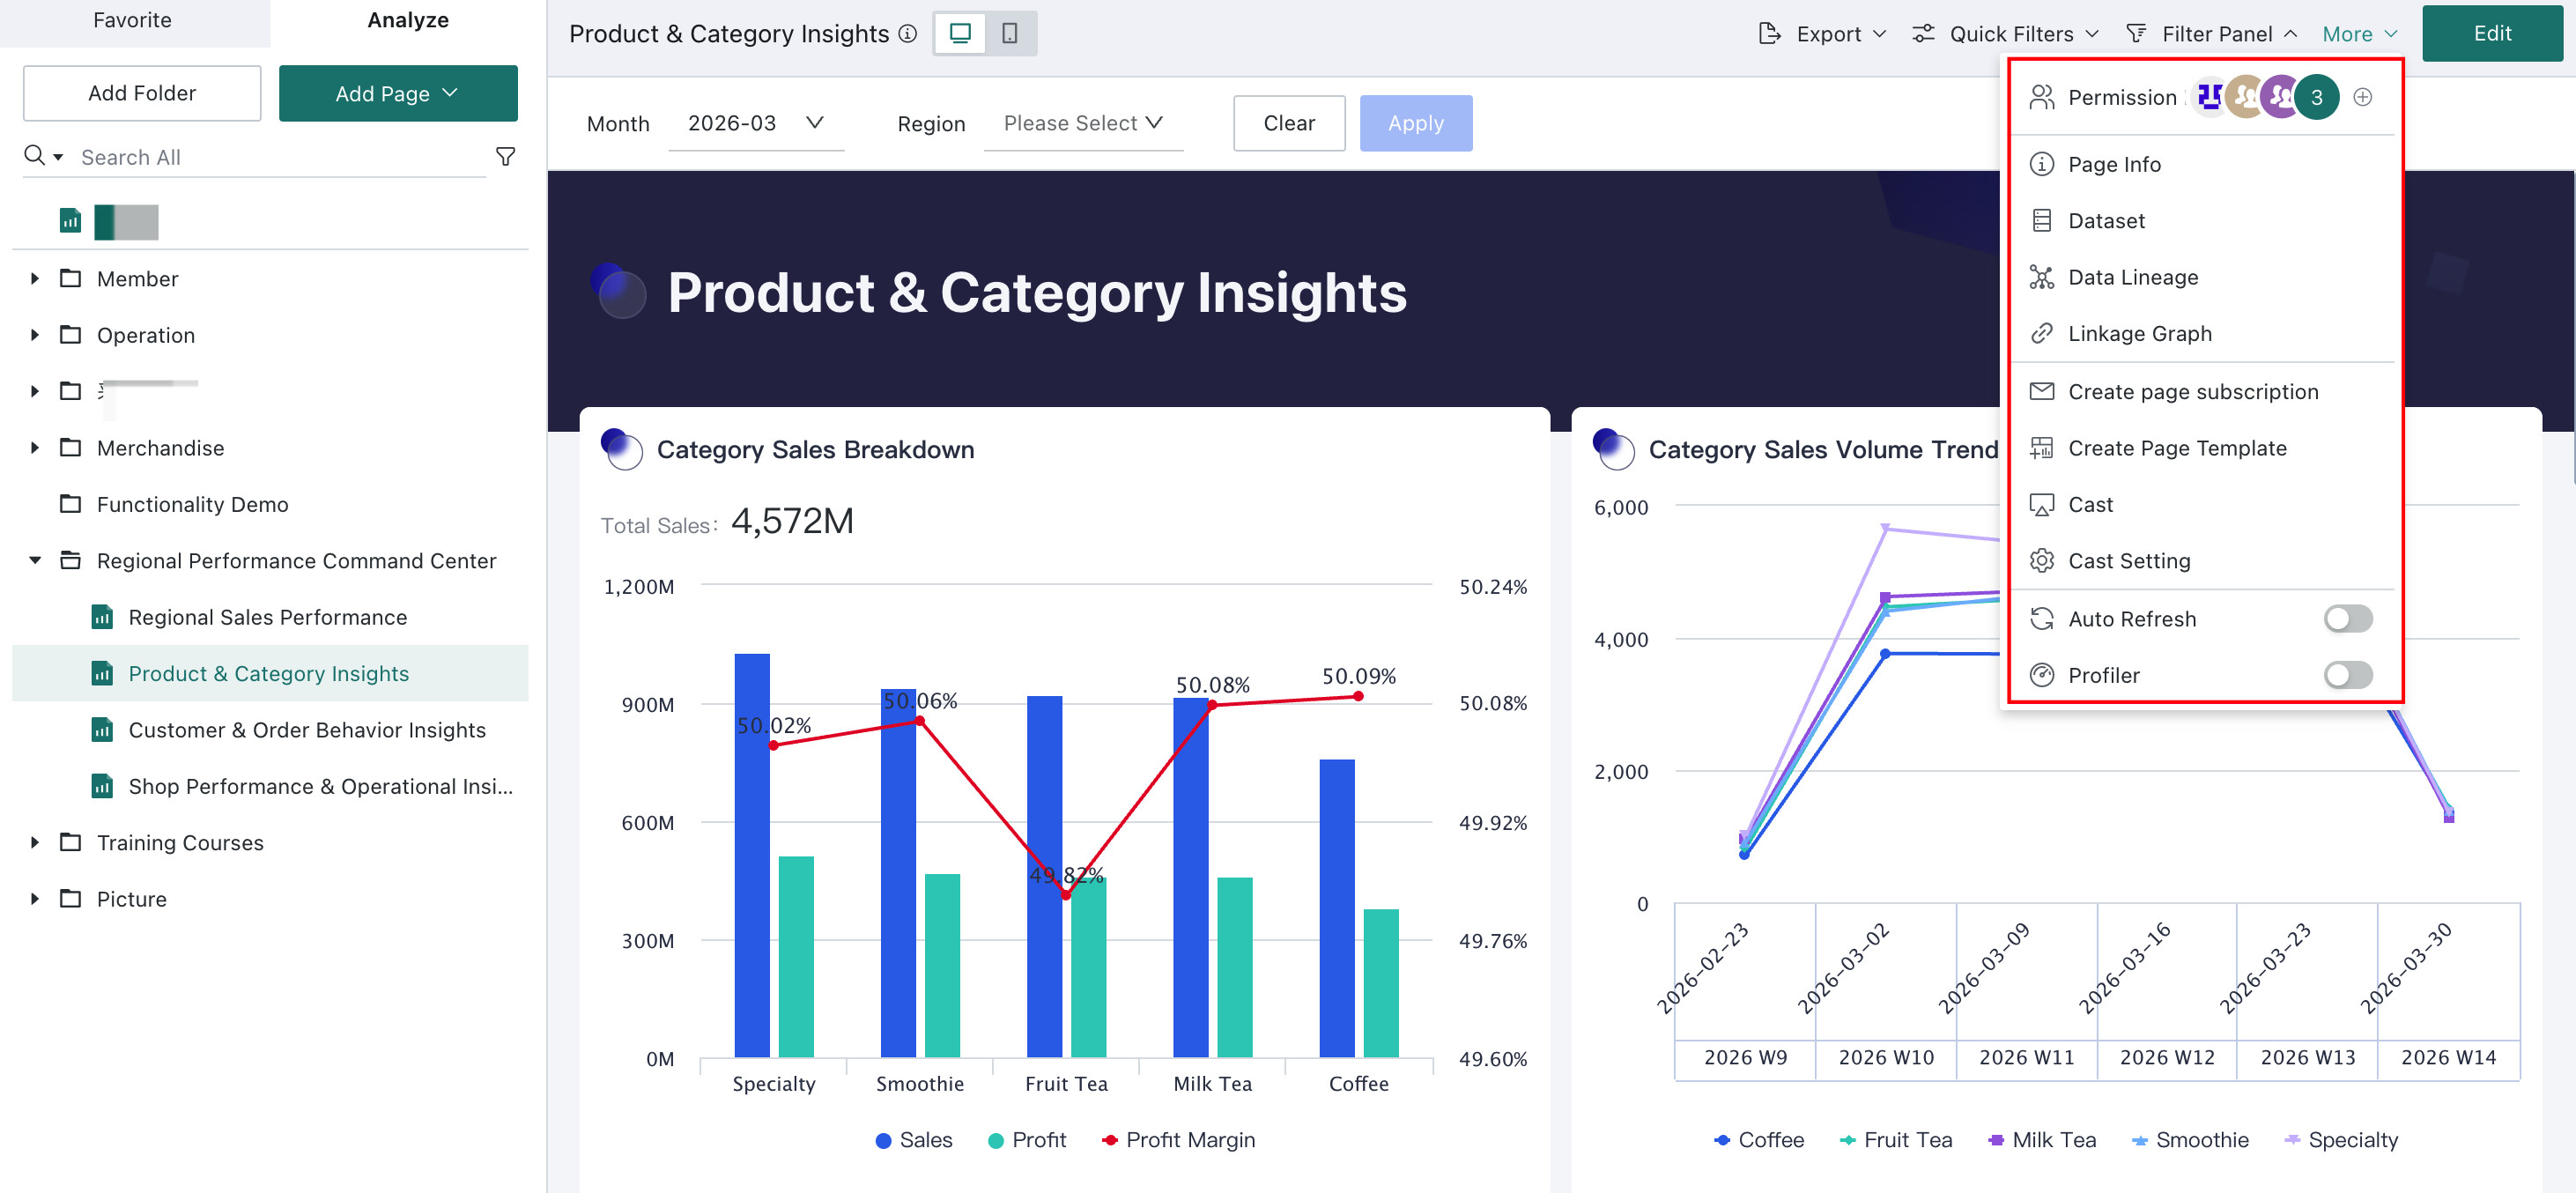
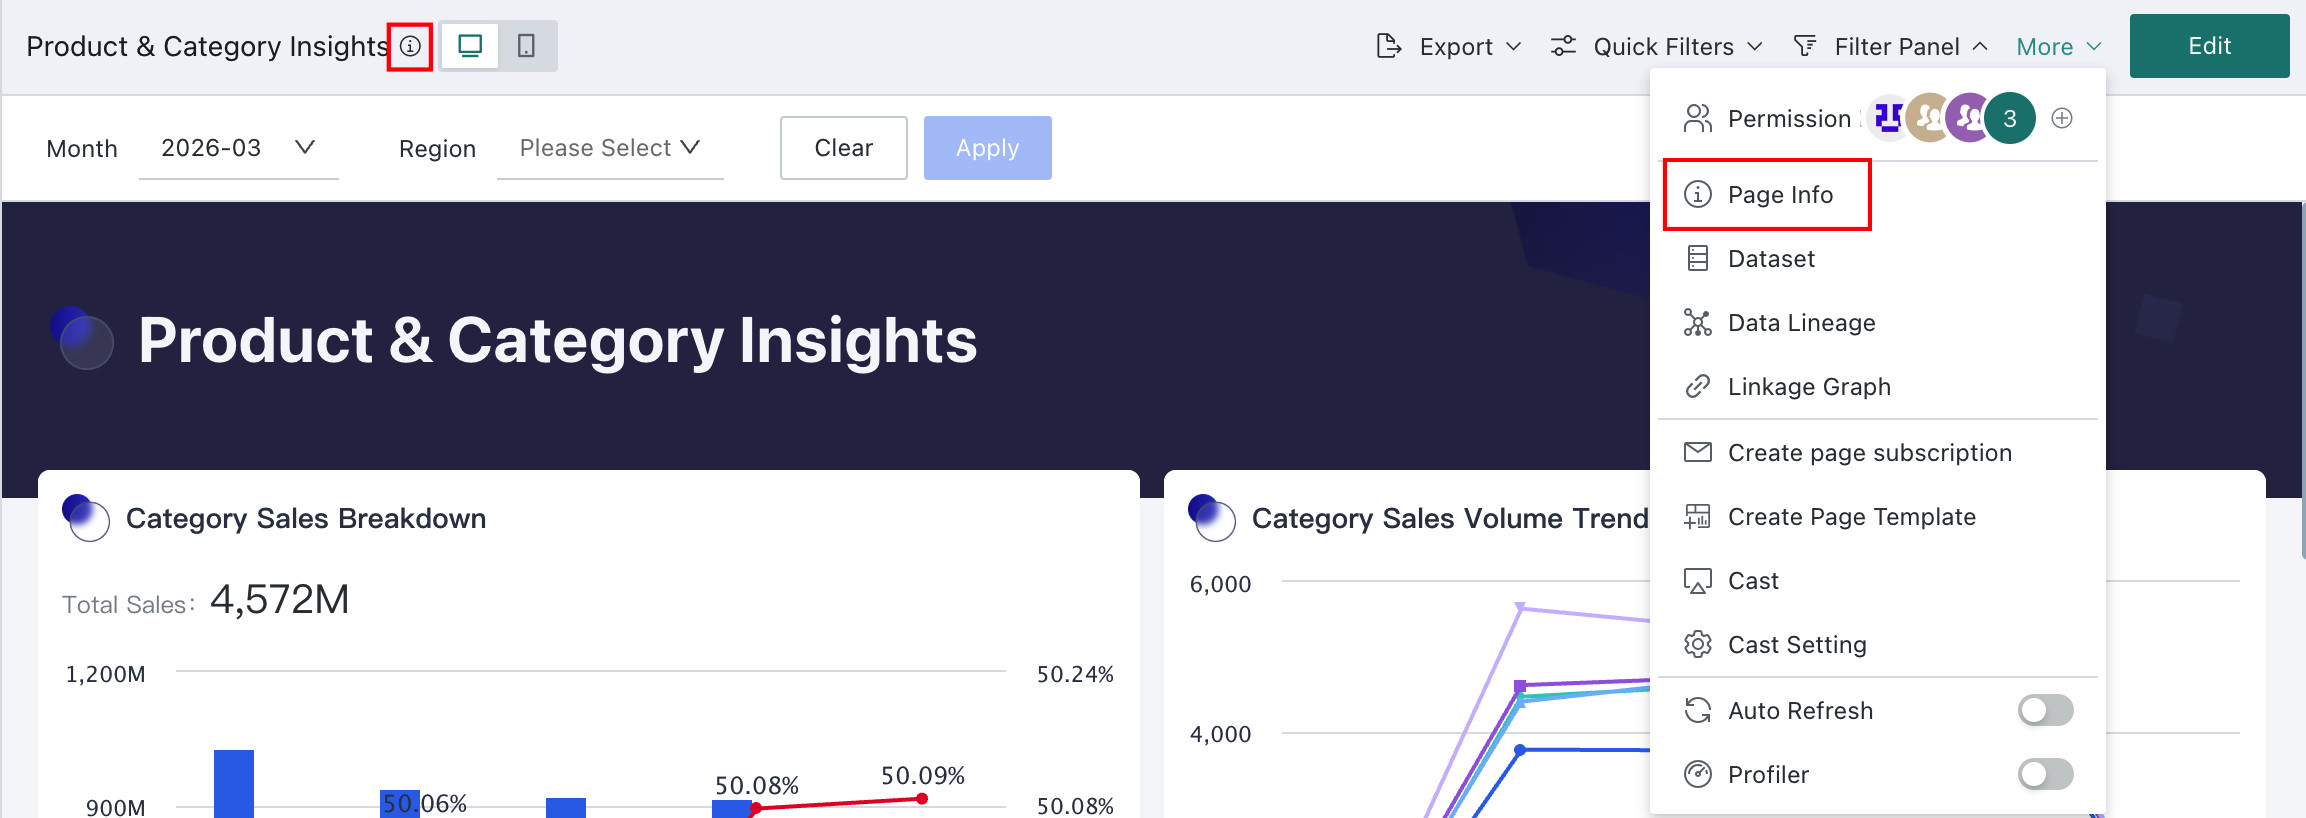
For an existing Dashboard, click More on the right side of the page and choose Page Info. You can also control whether the description is displayed by using the Show Description switch.
- Turning on
Show Descriptiondisplays the page description. This switch is off by default. - If
Show Descriptionis turned on but the description is empty, the page cannot be saved until you either enter a description or turn the switch off. - The description supports up to 200 characters.
After adding page information, users can view the page information in the Dashboard navigation.
Dataset Information
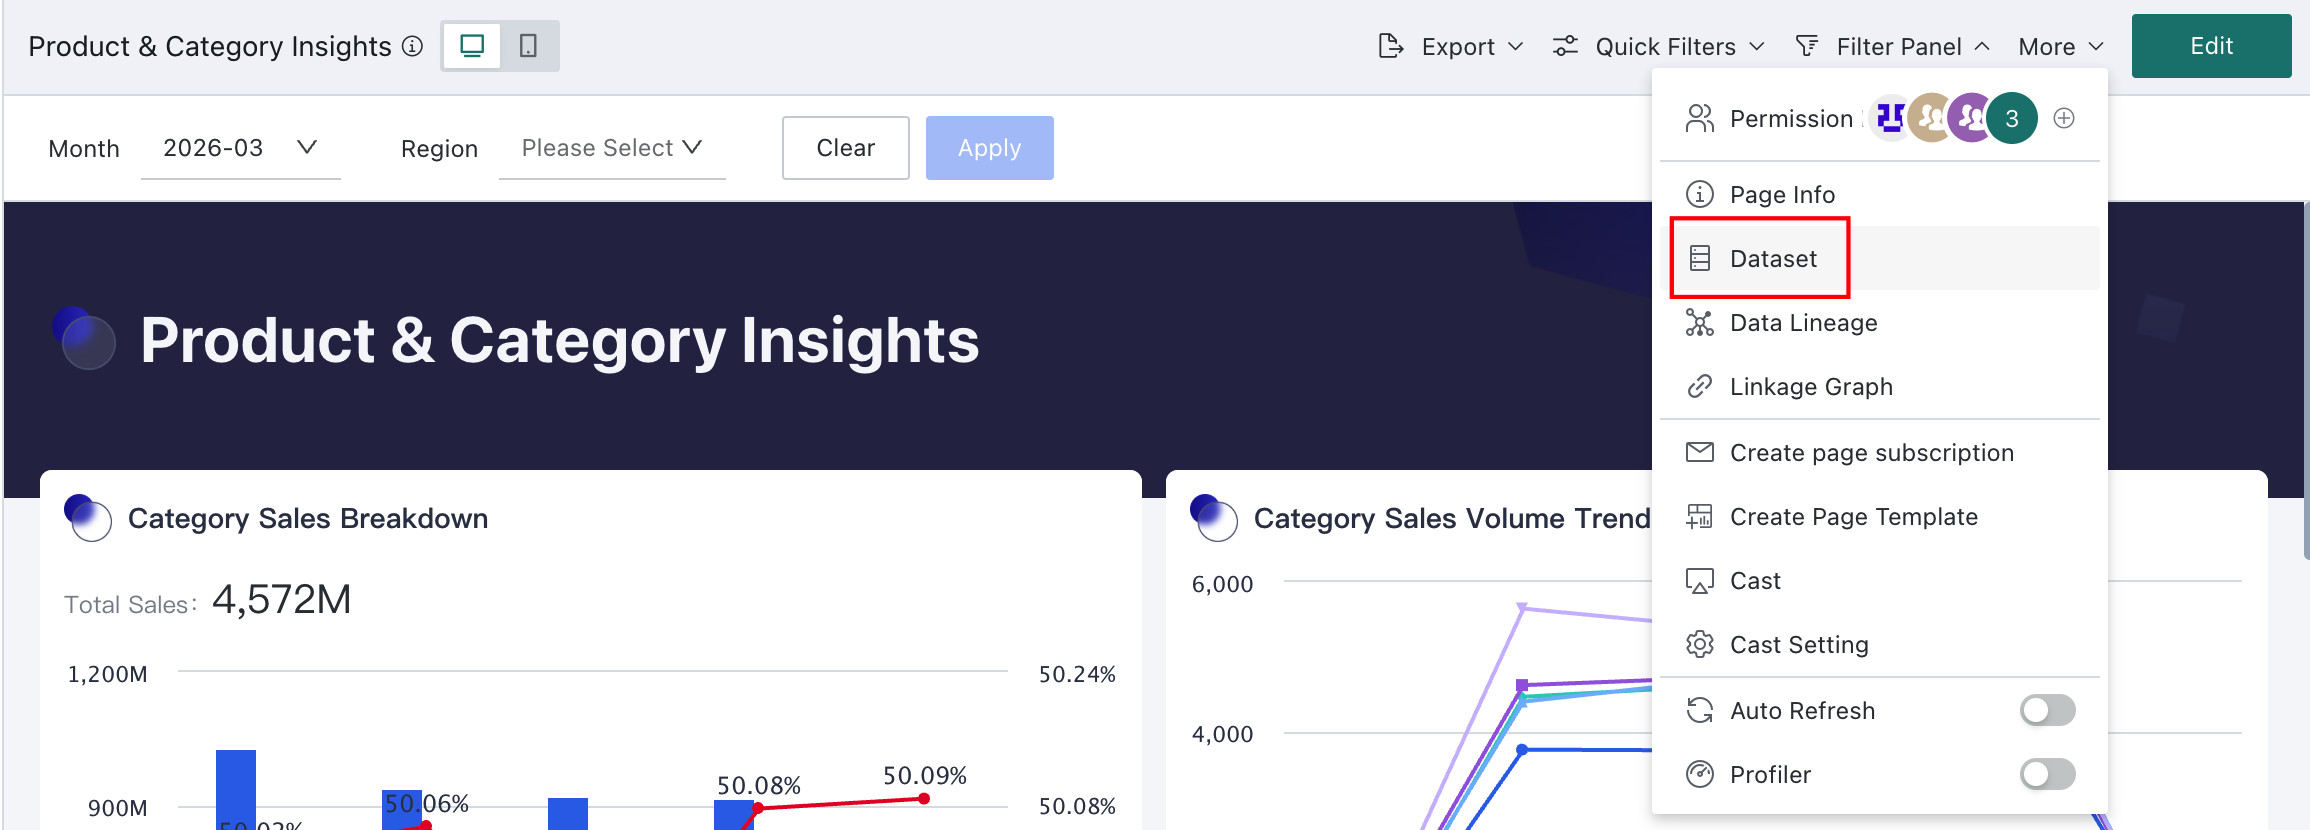
If users want to view all datasets used by the current Dashboard, they can click More at the top of the page and choose Dataset.
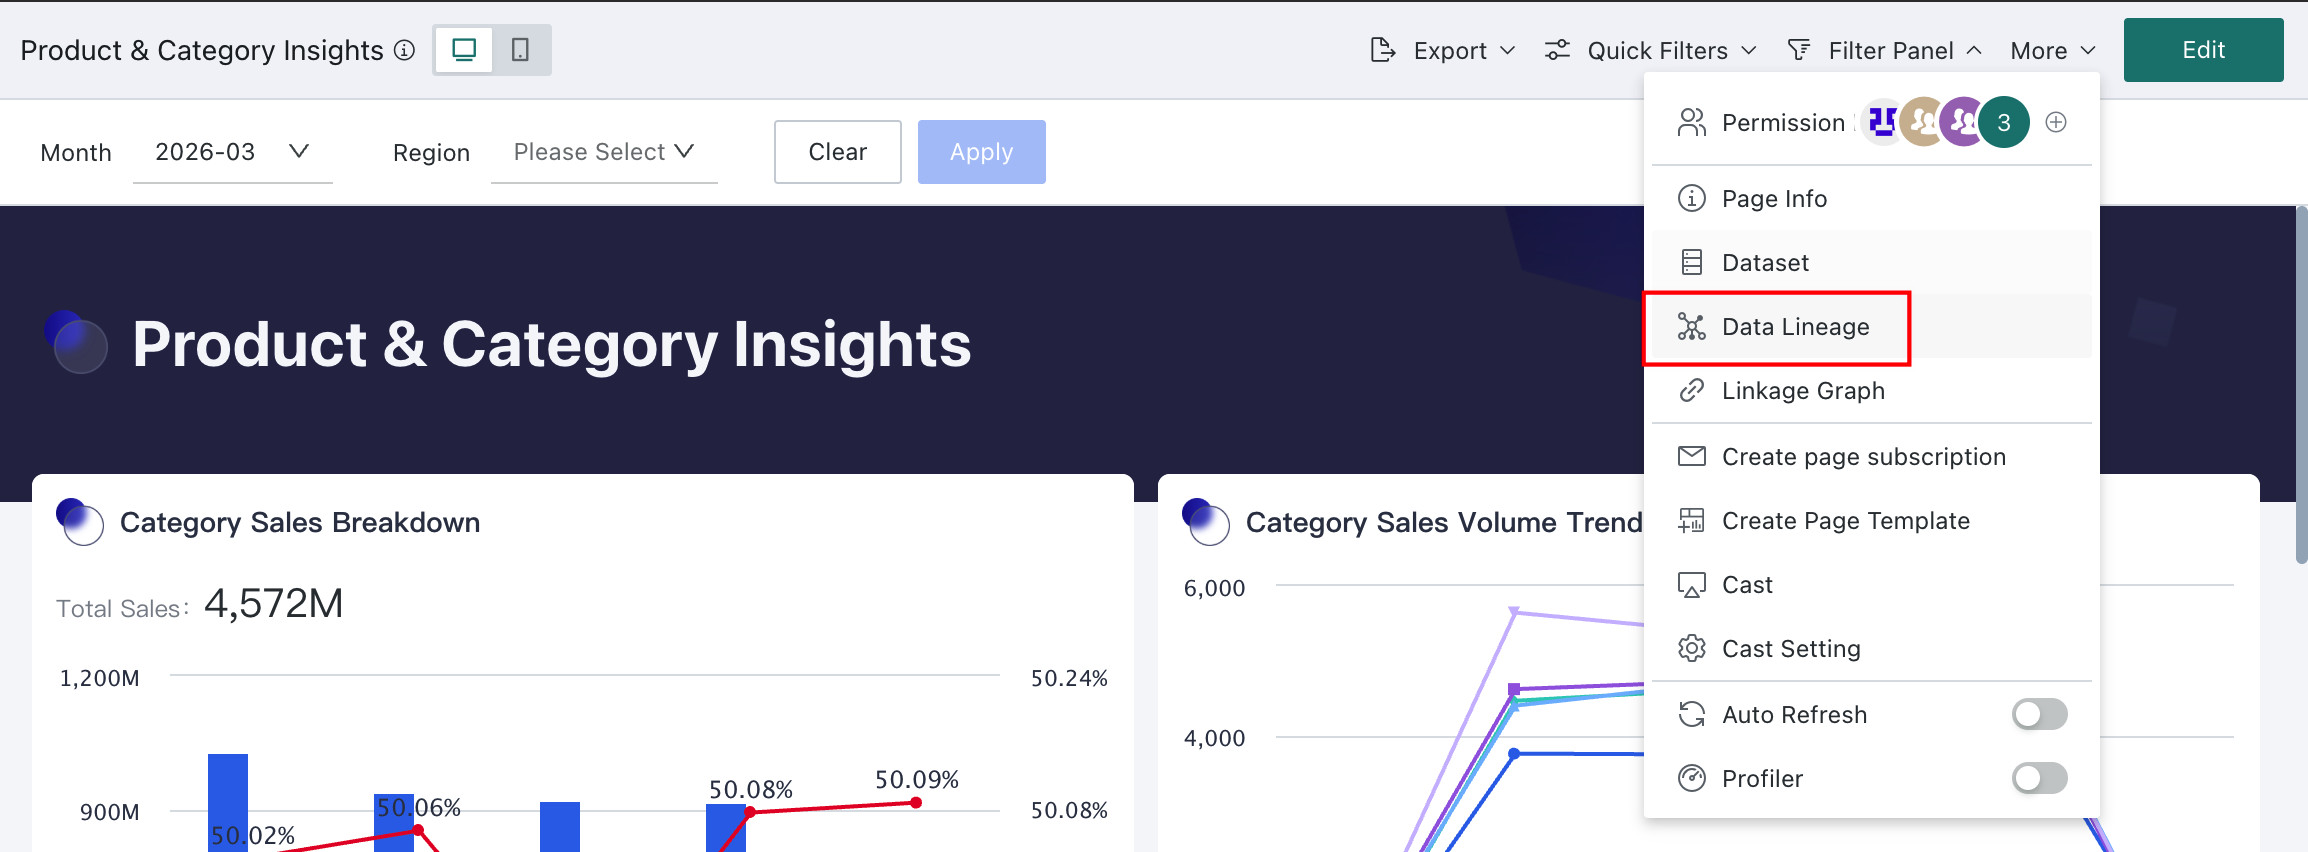
View Resource Lineage
Resource lineage lets users trace the origin of the current analysis content and its downstream dependencies, making it easier to understand how information flows through the system.
Click More in the upper-right corner and choose Data Lineage to view the global lineage of the current resource. For more details, see Resource Lineage.
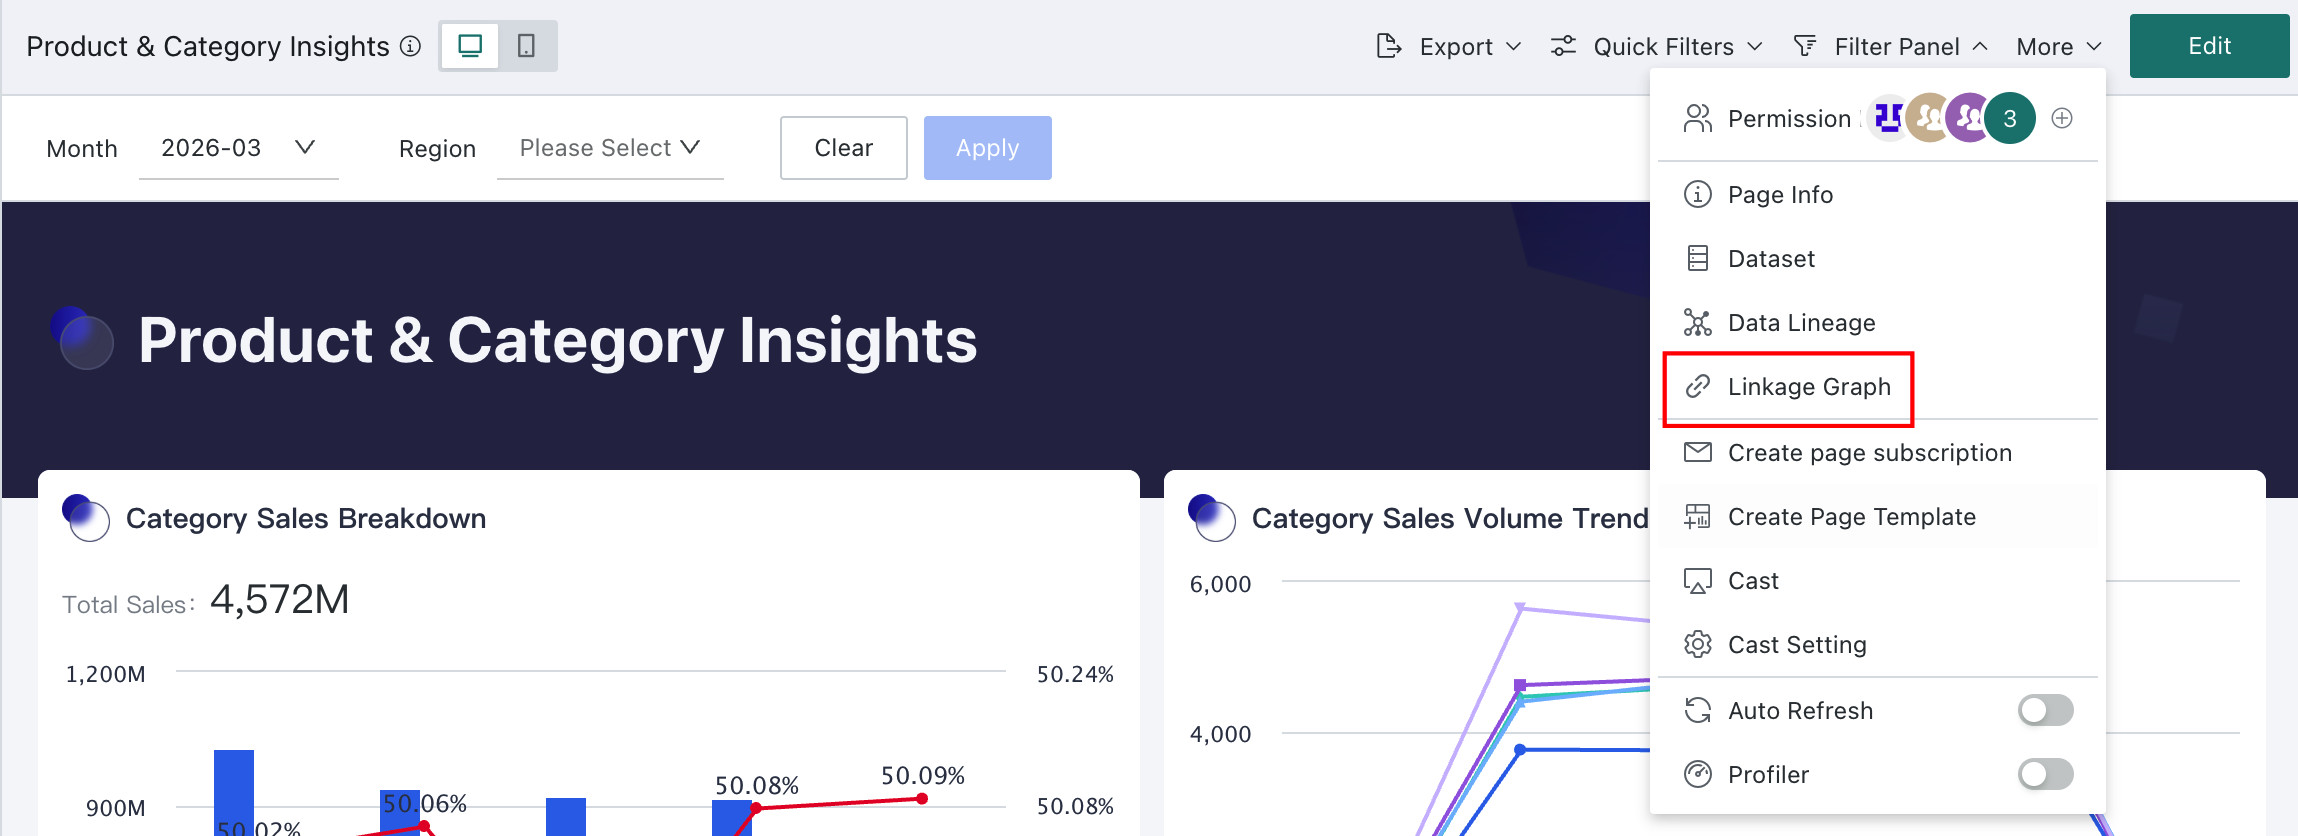
Card Selector Relationship Diagram
The Card Selector relationship diagram visually displays the linkage relationships between cards on a page. It helps users understand complex Card Selector setups more quickly by showing linkage paths, parent-child hierarchies, and Drill relationships.
Click More in the upper-right corner and choose Linkage Graph to view the Card Selector, parent-child, and Drill relationships between cards on the page.
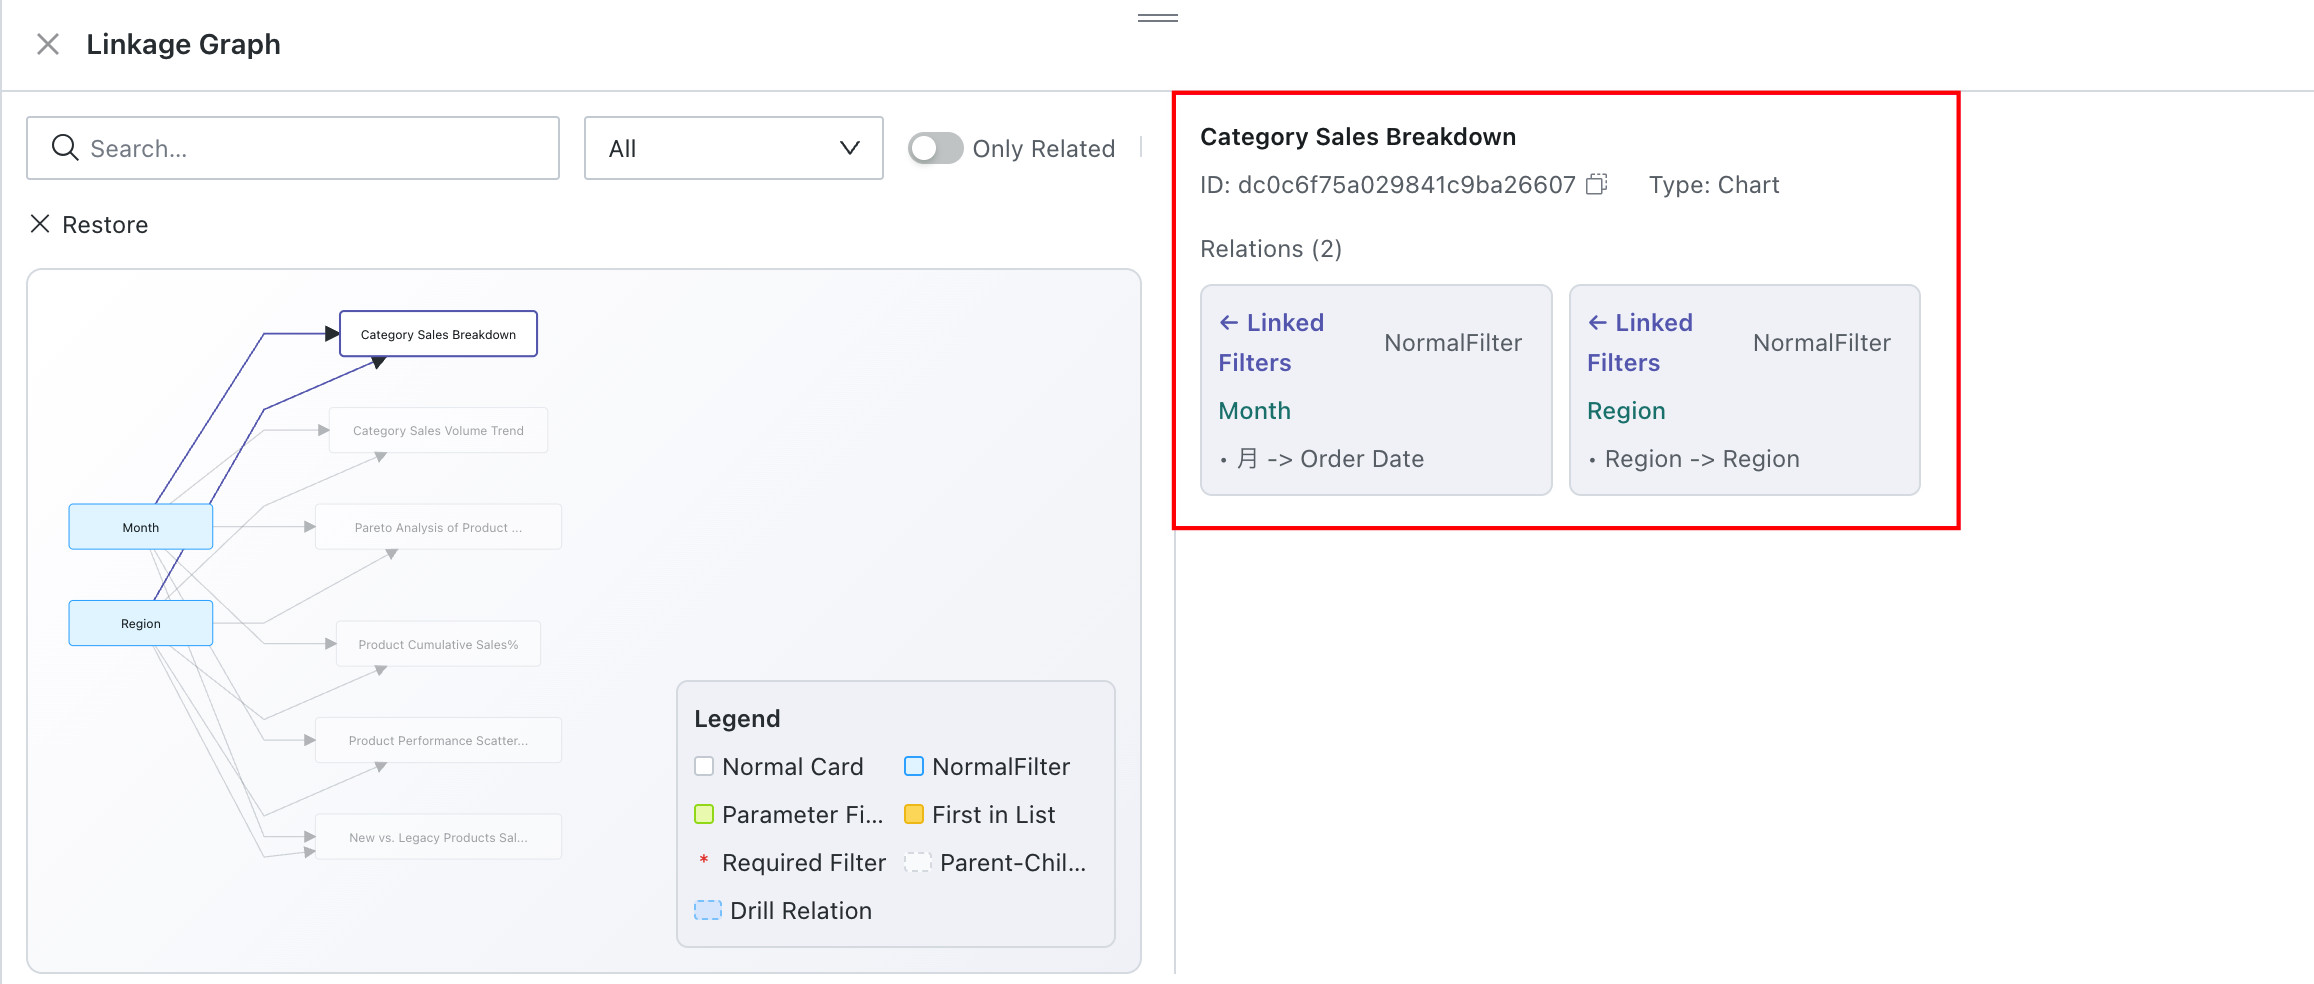
- Display Card Selector relationships between cards
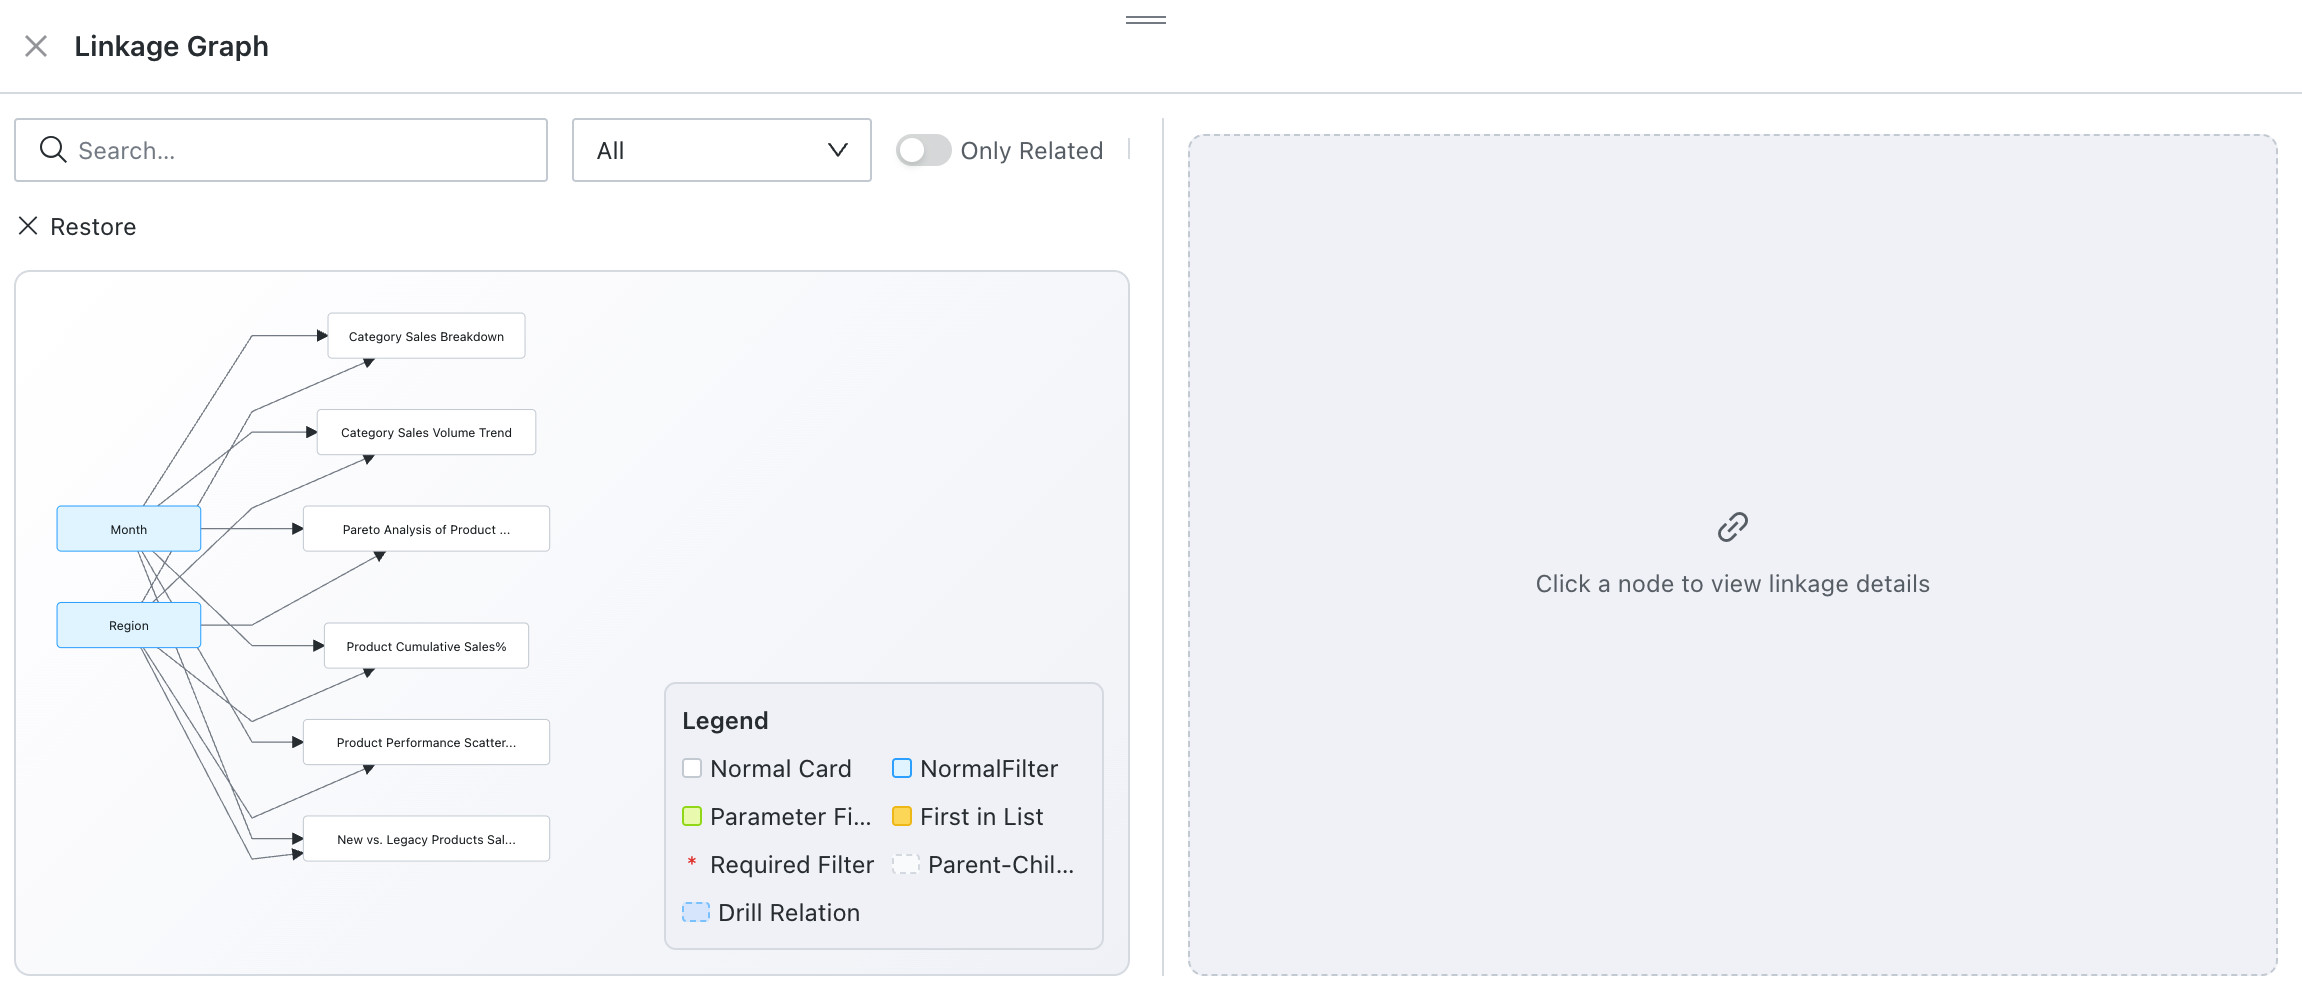
- Click a card to display Card Selector details on the right
Spare Cards
:::note[Note]This operation requires entering the dashboard editing page.
:::
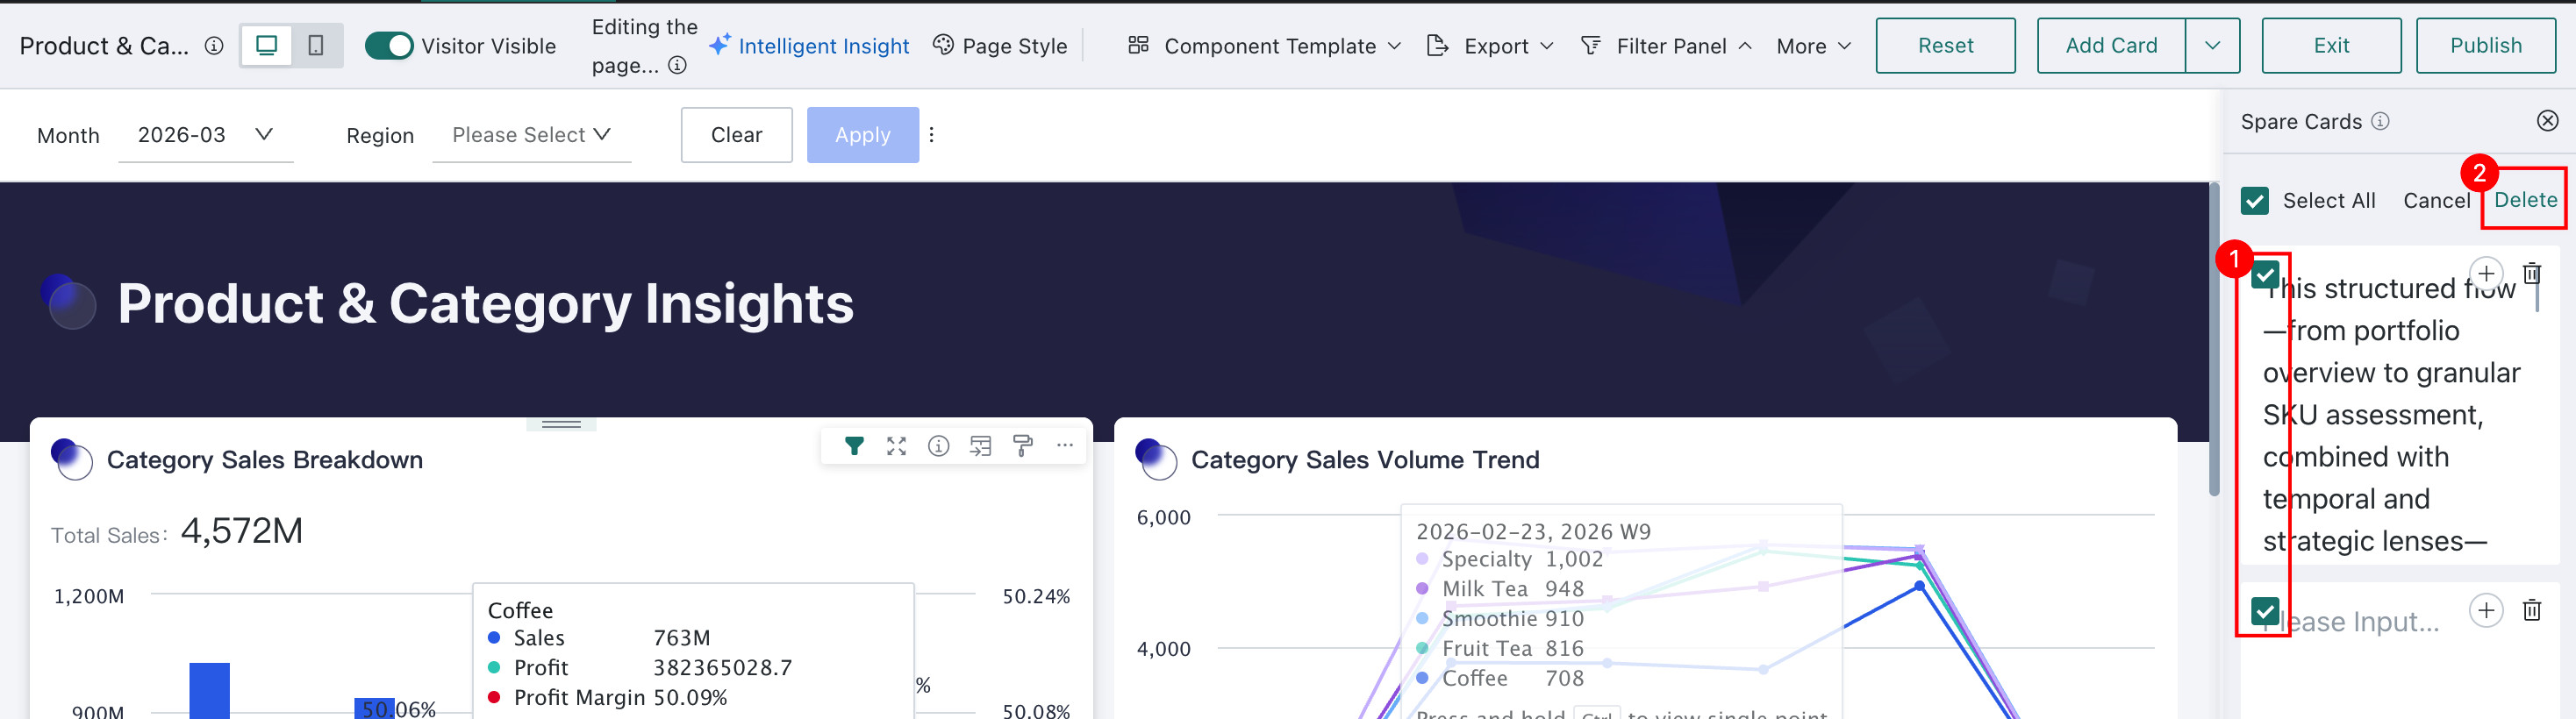
The Spare Cards panel stores backup cards. During Dashboard design, cards that are temporarily not needed on the page can be moved into Spare Cards. Cards in Spare Cards support filtering and batch deletion.
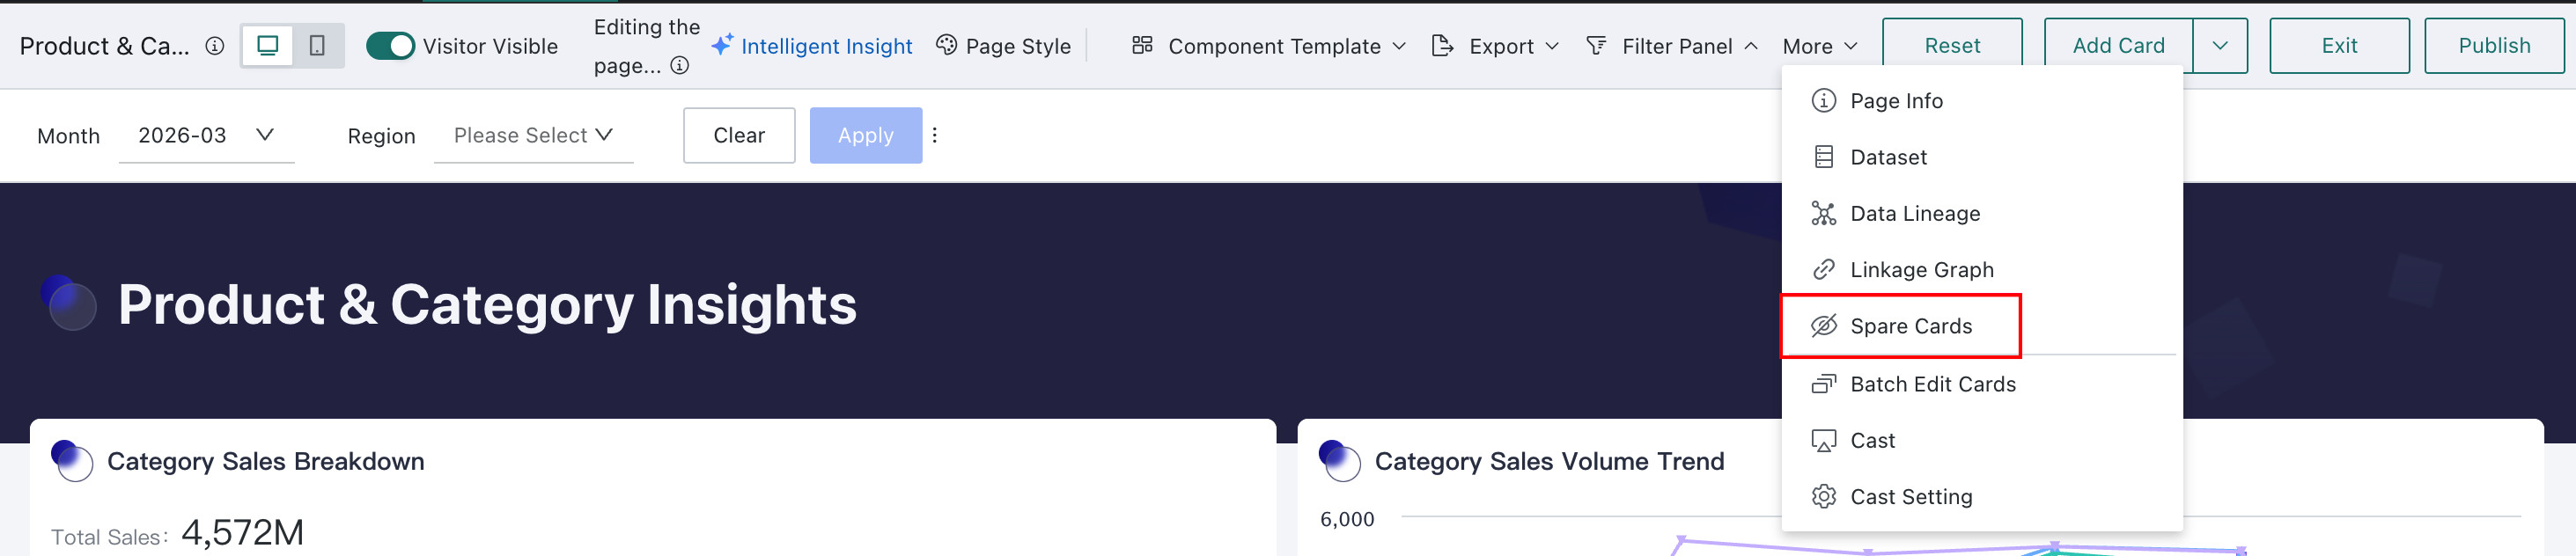
If you later need to restore cards from Spare Cards to the page, click More > Spare Cards in the upper-right corner and select the cards to add back.
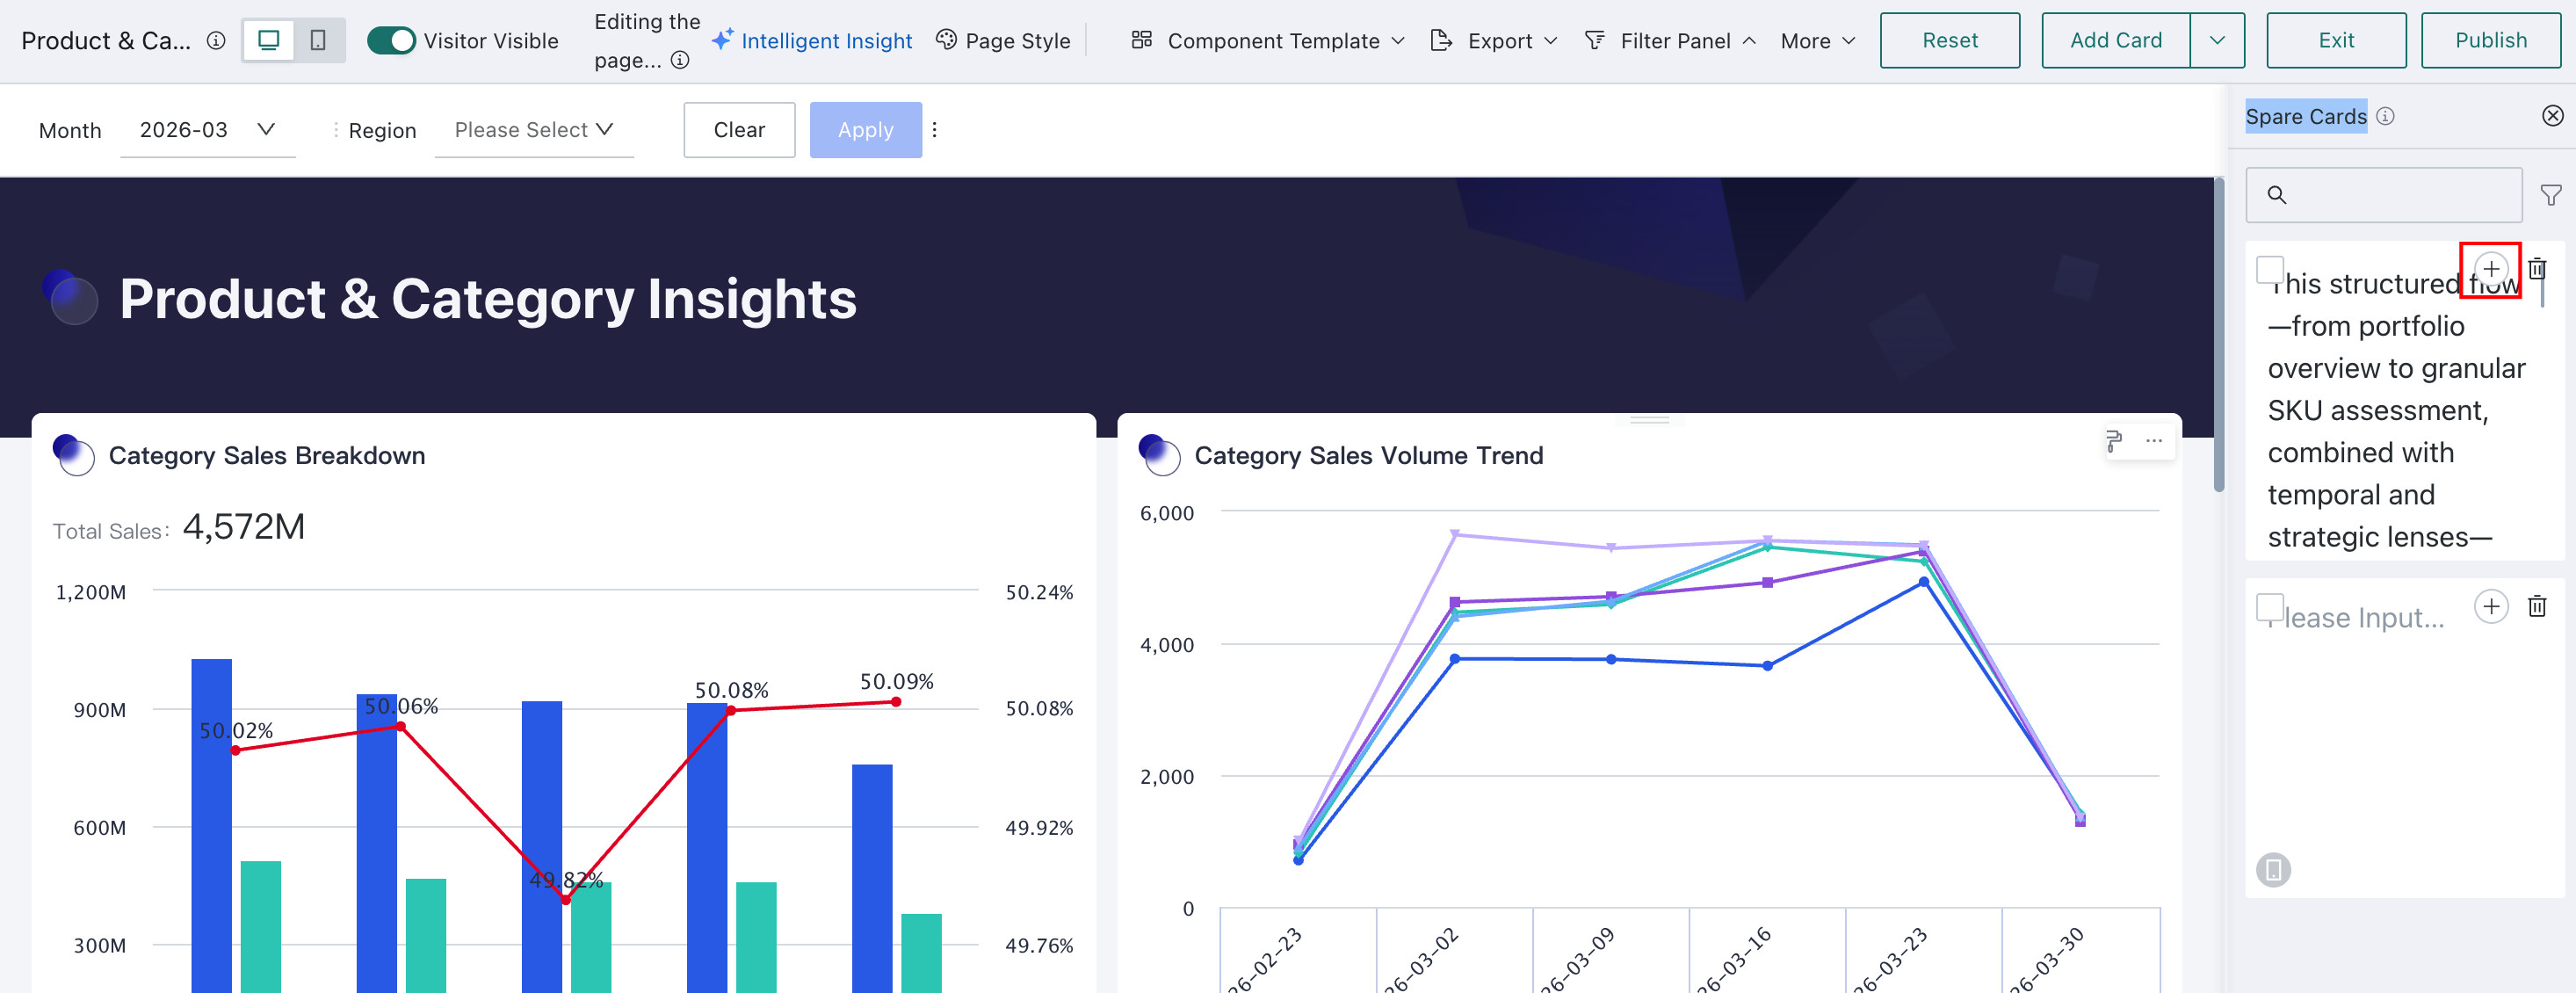
Add Cards
Click the + button in the upper-right corner of a card to add it back to the Dashboard.
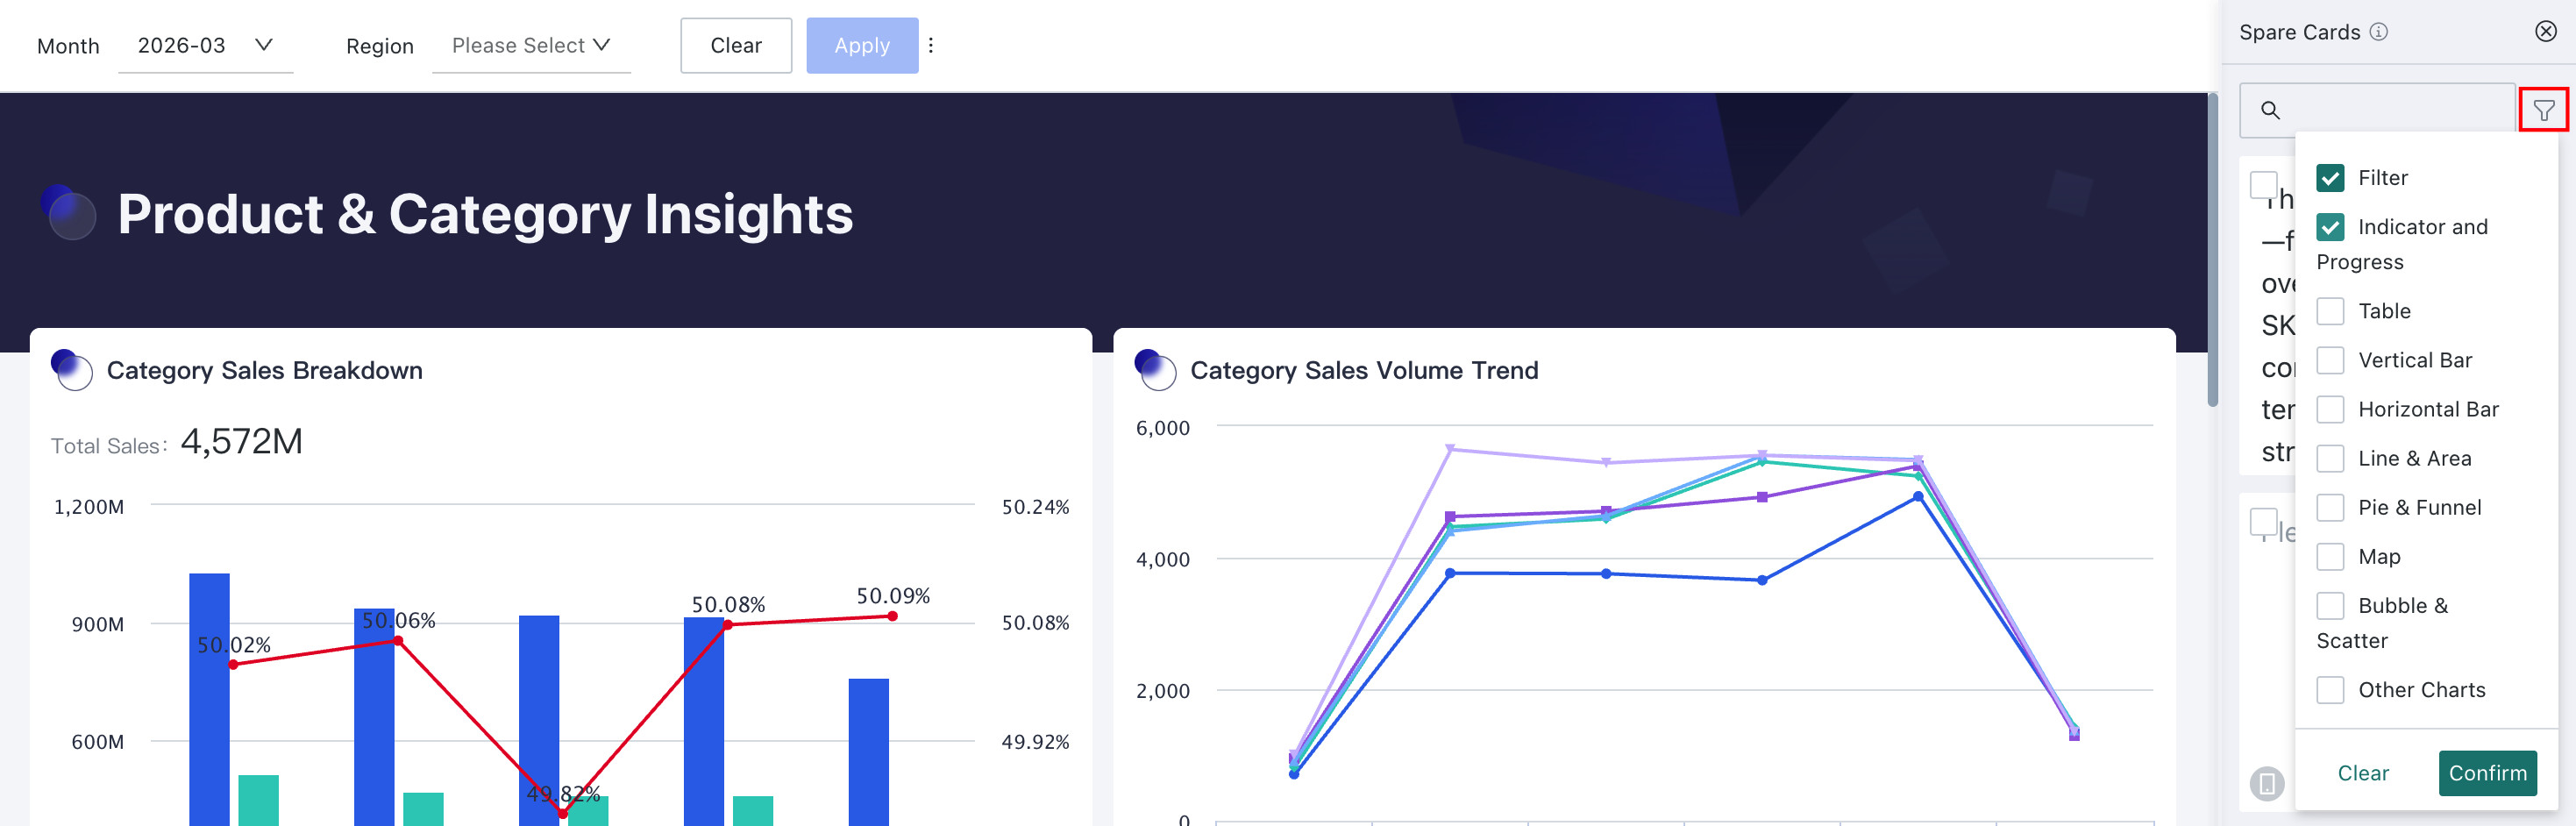
Filter Cards
Click the funnel-shaped Filter icon next to the search box to open the filter options. The list includes multiple card types, such as Filter, Metrics and Progress, Table, and Bar Chart. Select the types you need, click OK to apply the filter, or click Clear All to reset it.
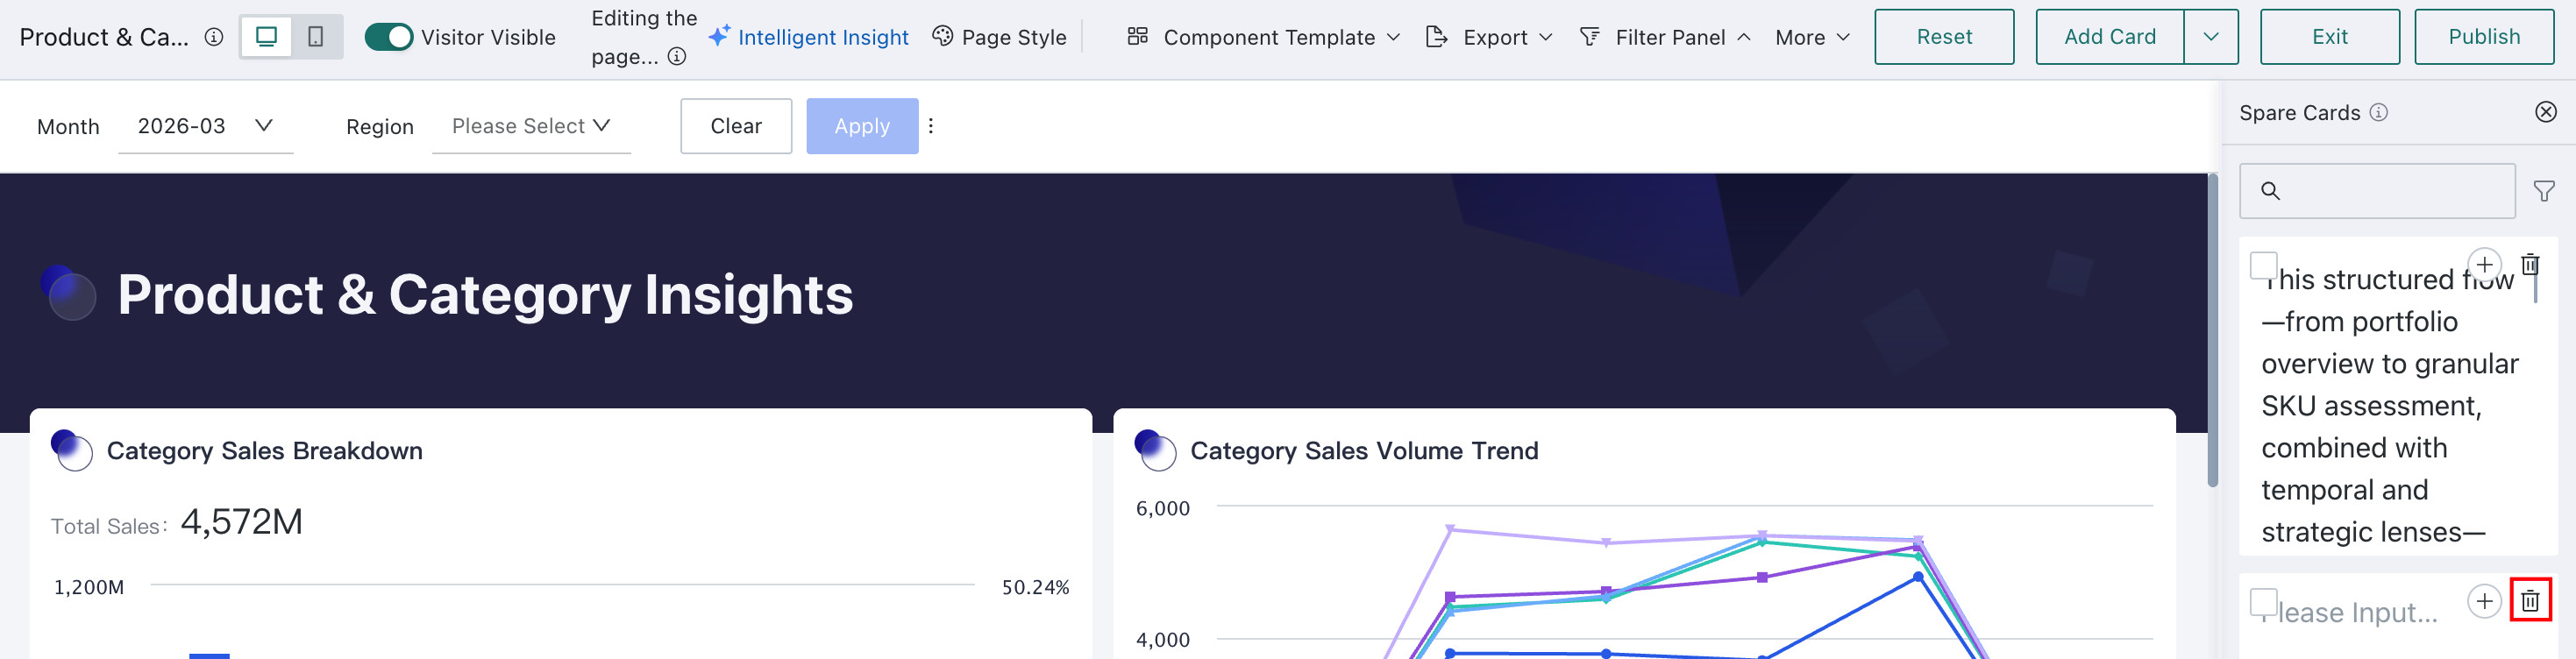
Delete Single Card
Find the card to delete, click the delete button in its upper-right corner, and confirm the operation. The card is then moved to the recycle bin, where it can be restored or permanently deleted.
If there are many cards in the Spare Cards, use filtering to narrow them down and find the target card more easily.
Batch Delete Cards
- Check multiple cards to be deleted;
- Click the "Delete" button at the top of the interface. After confirming the operation, the selected cards will be batch moved to the recycle bin for unified management or cleanup.
Page Style
This operation requires entering the dashboard editing page.
To make a Dashboard page more polished and expressive, you can configure page styles such as the theme, page layout, and card styles. For details, see Page Style.
Batch Edit Cards
:::note[Note]This operation requires entering the dashboard editing page.
:::
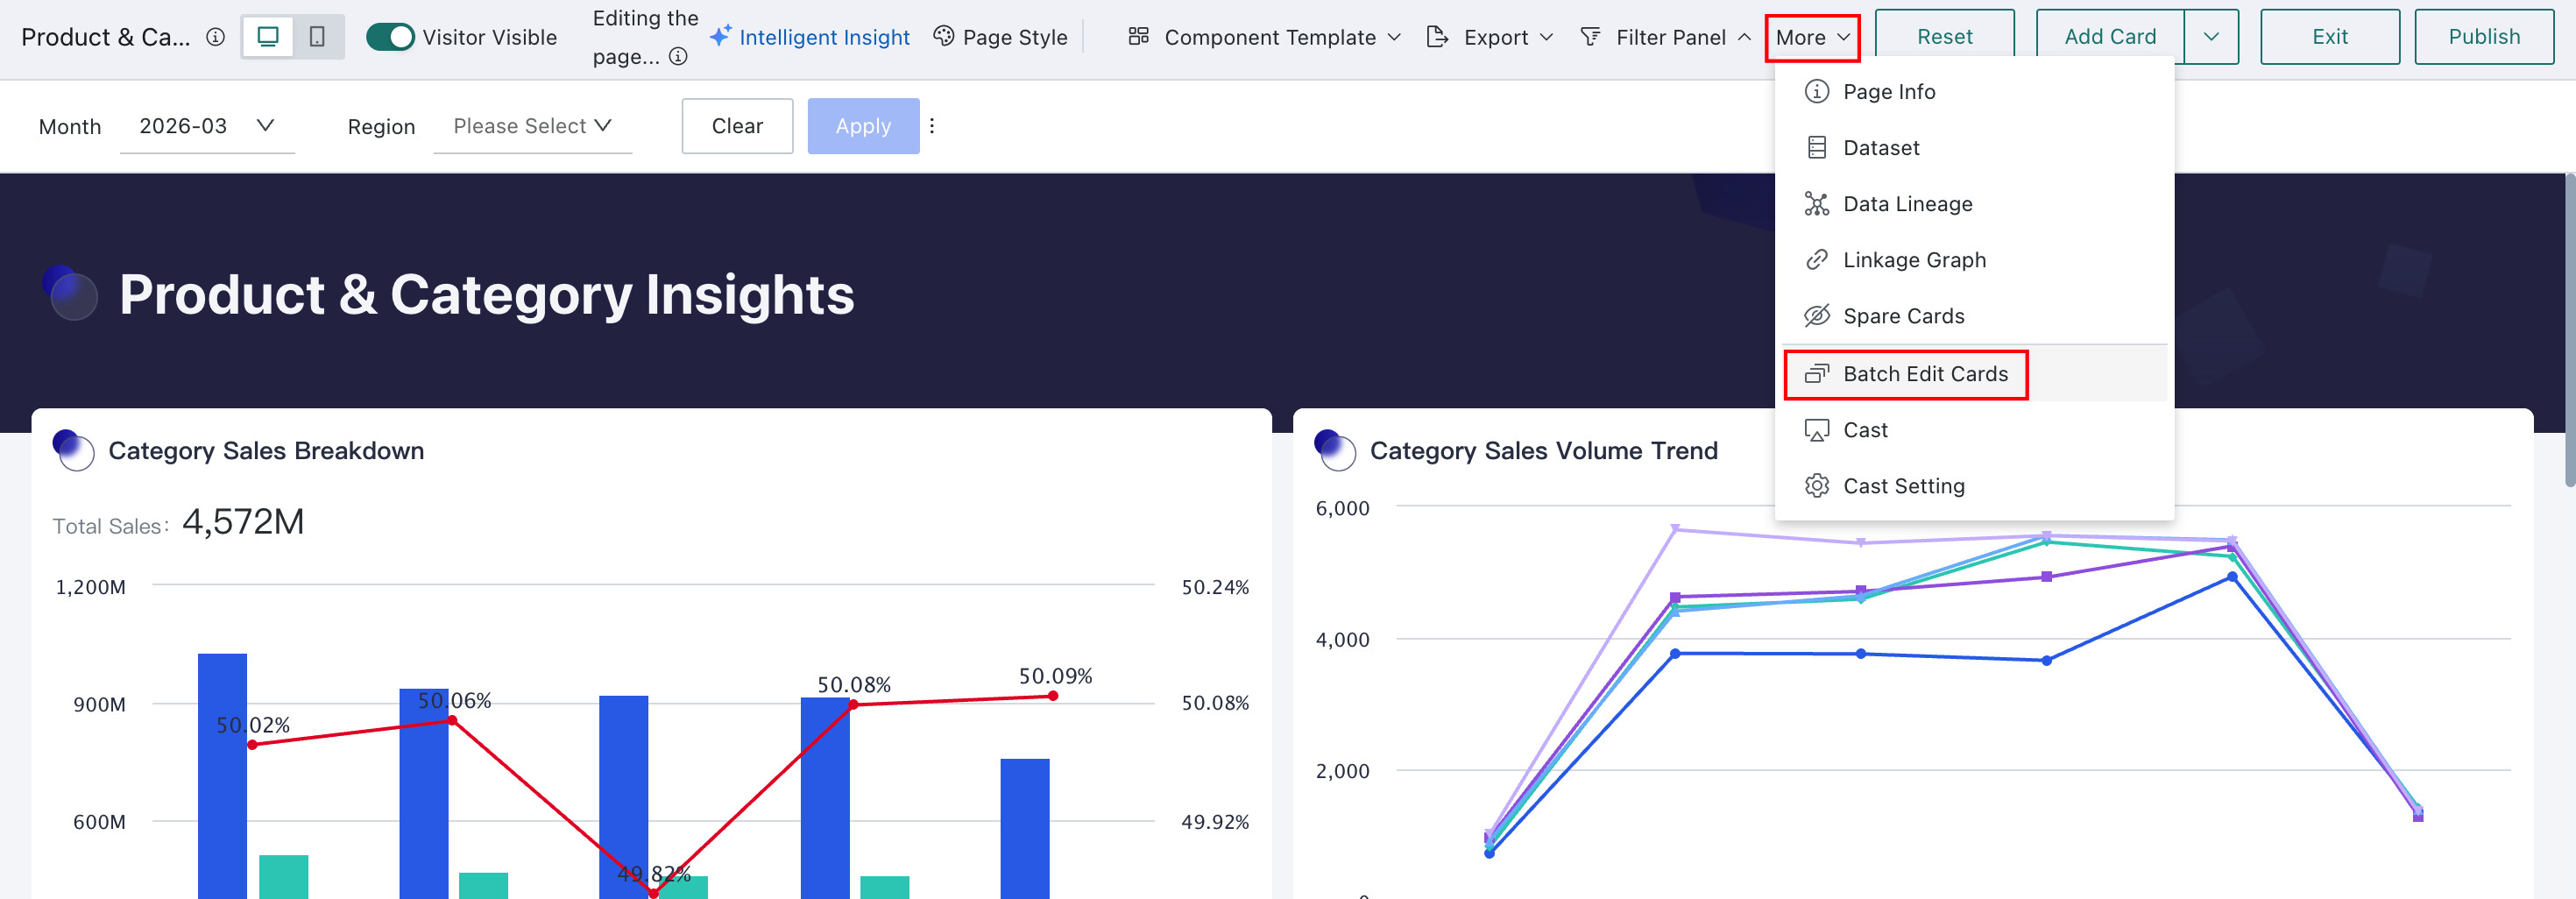
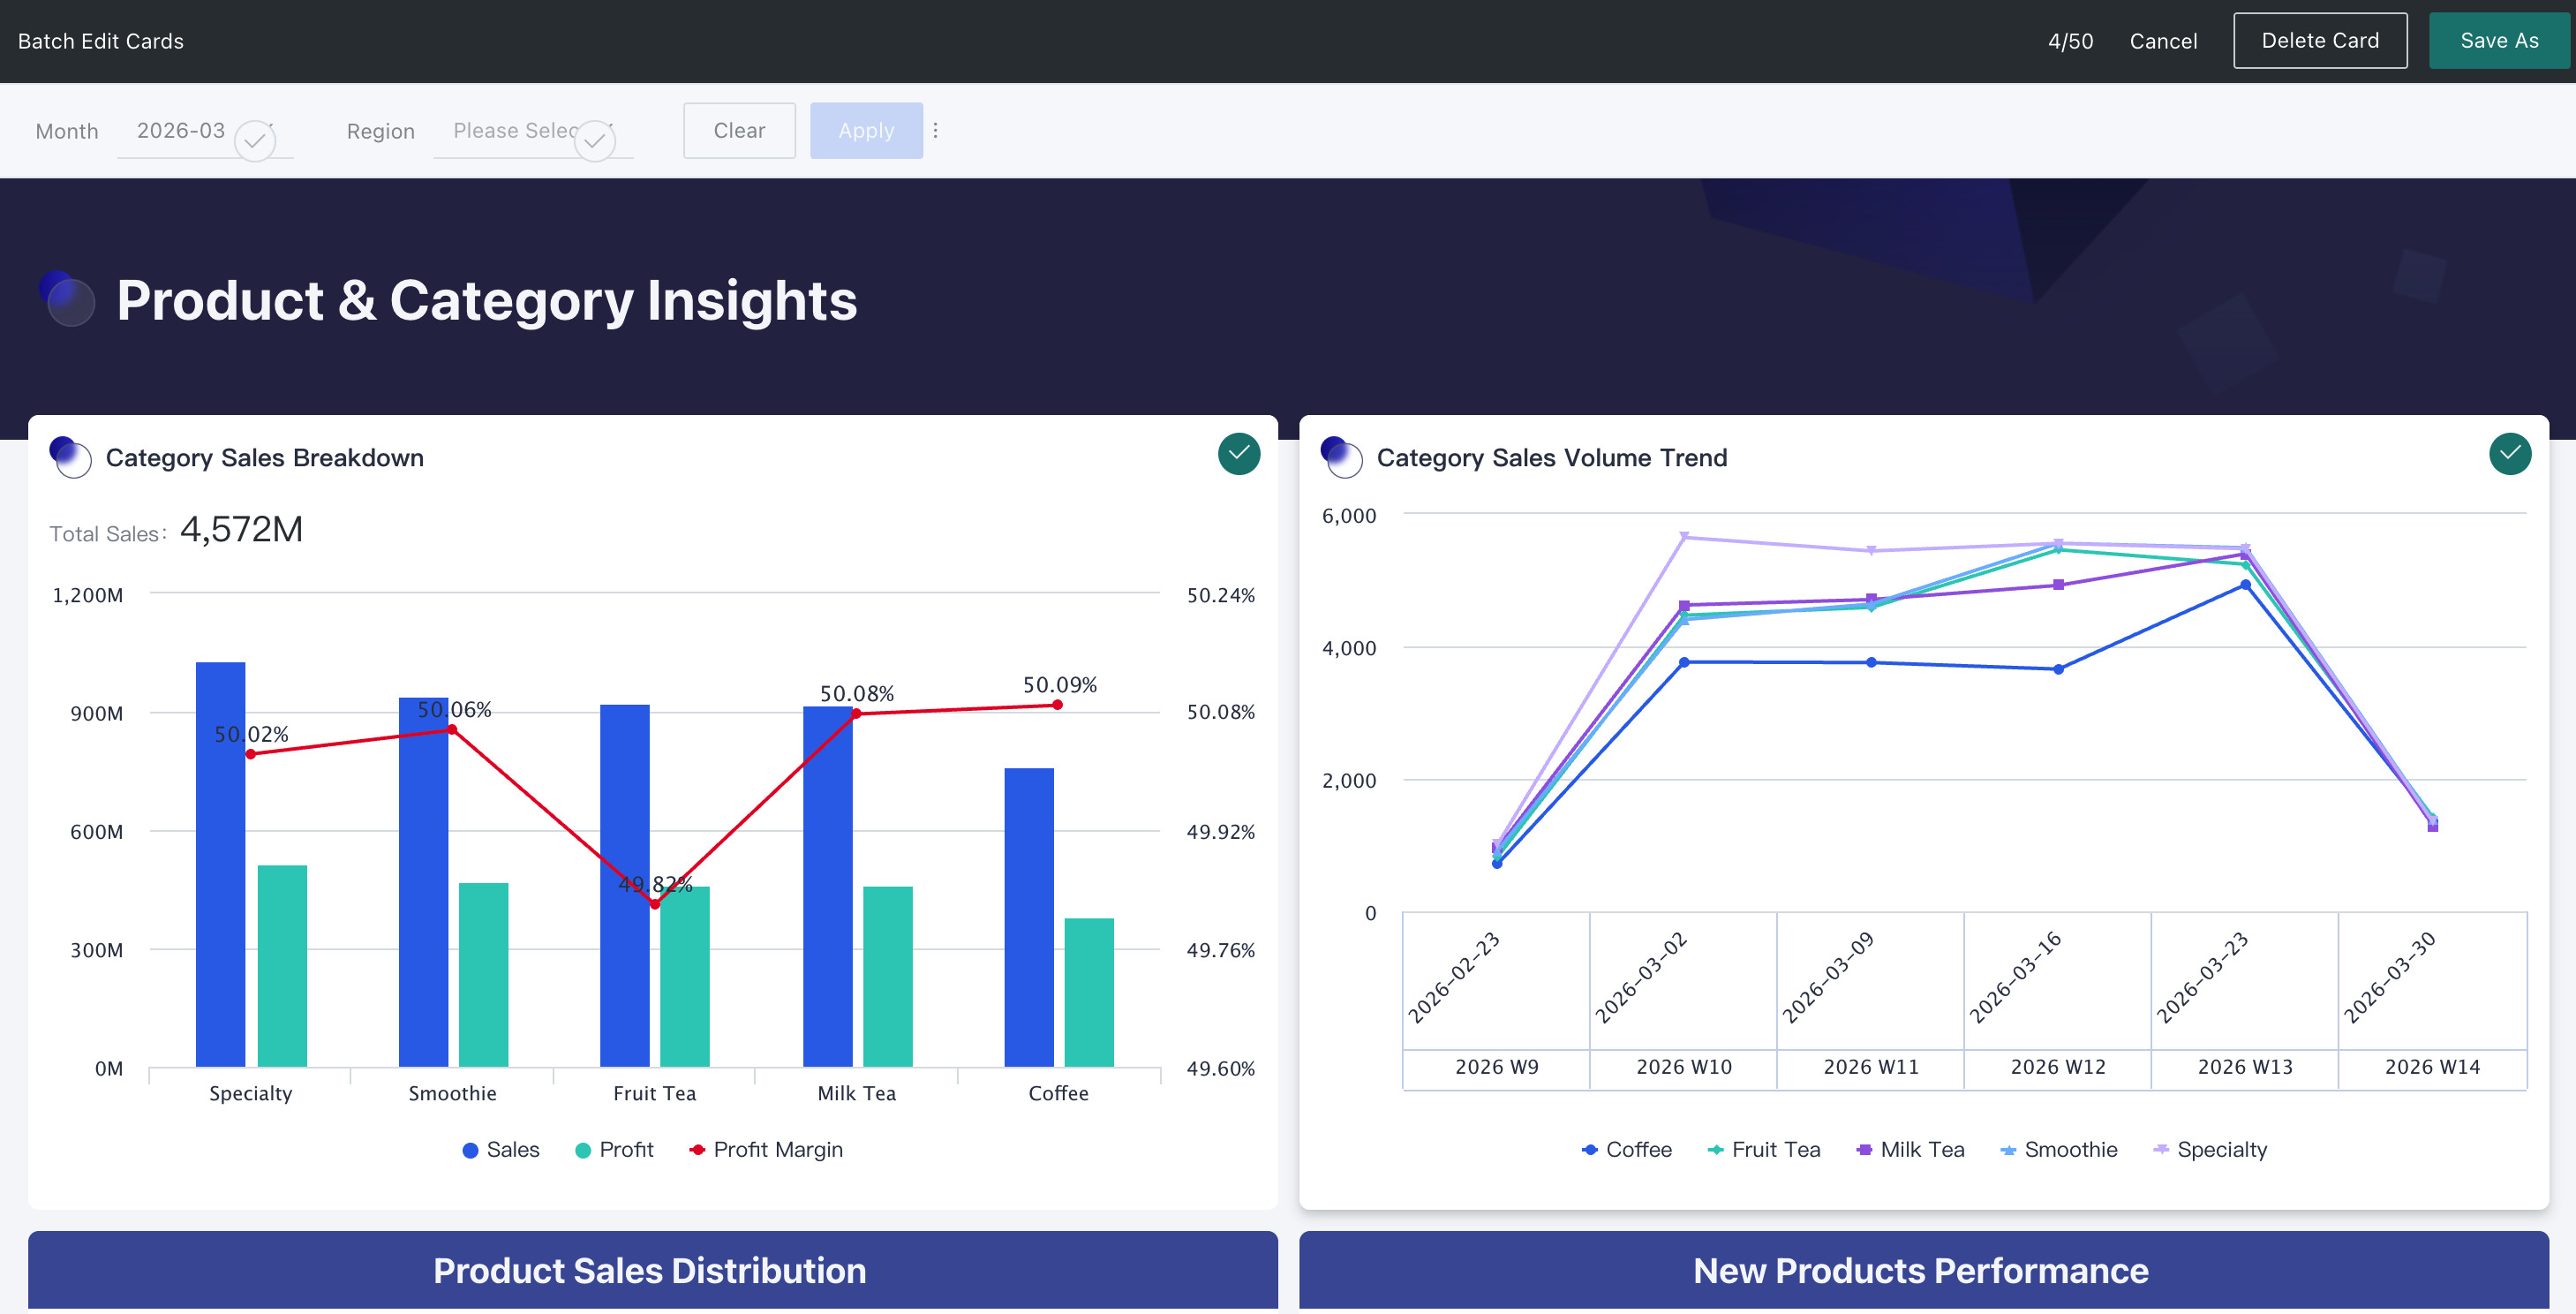
If you need to save as or delete multiple cards in a board, you can use the Batch Edit Cards feature. Click More in the upper-right corner of the page, select Batch Edit Cards, and enter the batch editing state. Taking batch copy as an example, select multiple cards, check them, and click Save Cards As in the upper-right corner. Finally, batch rename the card names, select the target page, and click OK to batch copy cards to the selected page.
- A maximum of 50 cards can be selected at a time.
- Batch editing does not support the following Resource types: Filter cards in the Filter bar, Custom Report/Custom List.
Share Link
Guandata BI supports anonymous access to Dashboards and Data Screens, meeting temporary page sharing and Data Screen casting needs, making data content sharing more convenient.
Applicable to the following scenarios:
- Group companies temporarily sharing Dashboards across companies and departments, casting sharing;
- IT and data personnel temporarily troubleshooting issues in data boards;
- Individual data analysts sharing data insights and views in communities.
Prerequisite: The administrator turns on the Page Public Link feature switch in Management Center > General settings > System rules.
The current version only allows the owner of the page (Dashboard and Data Screen) to generate a public link.
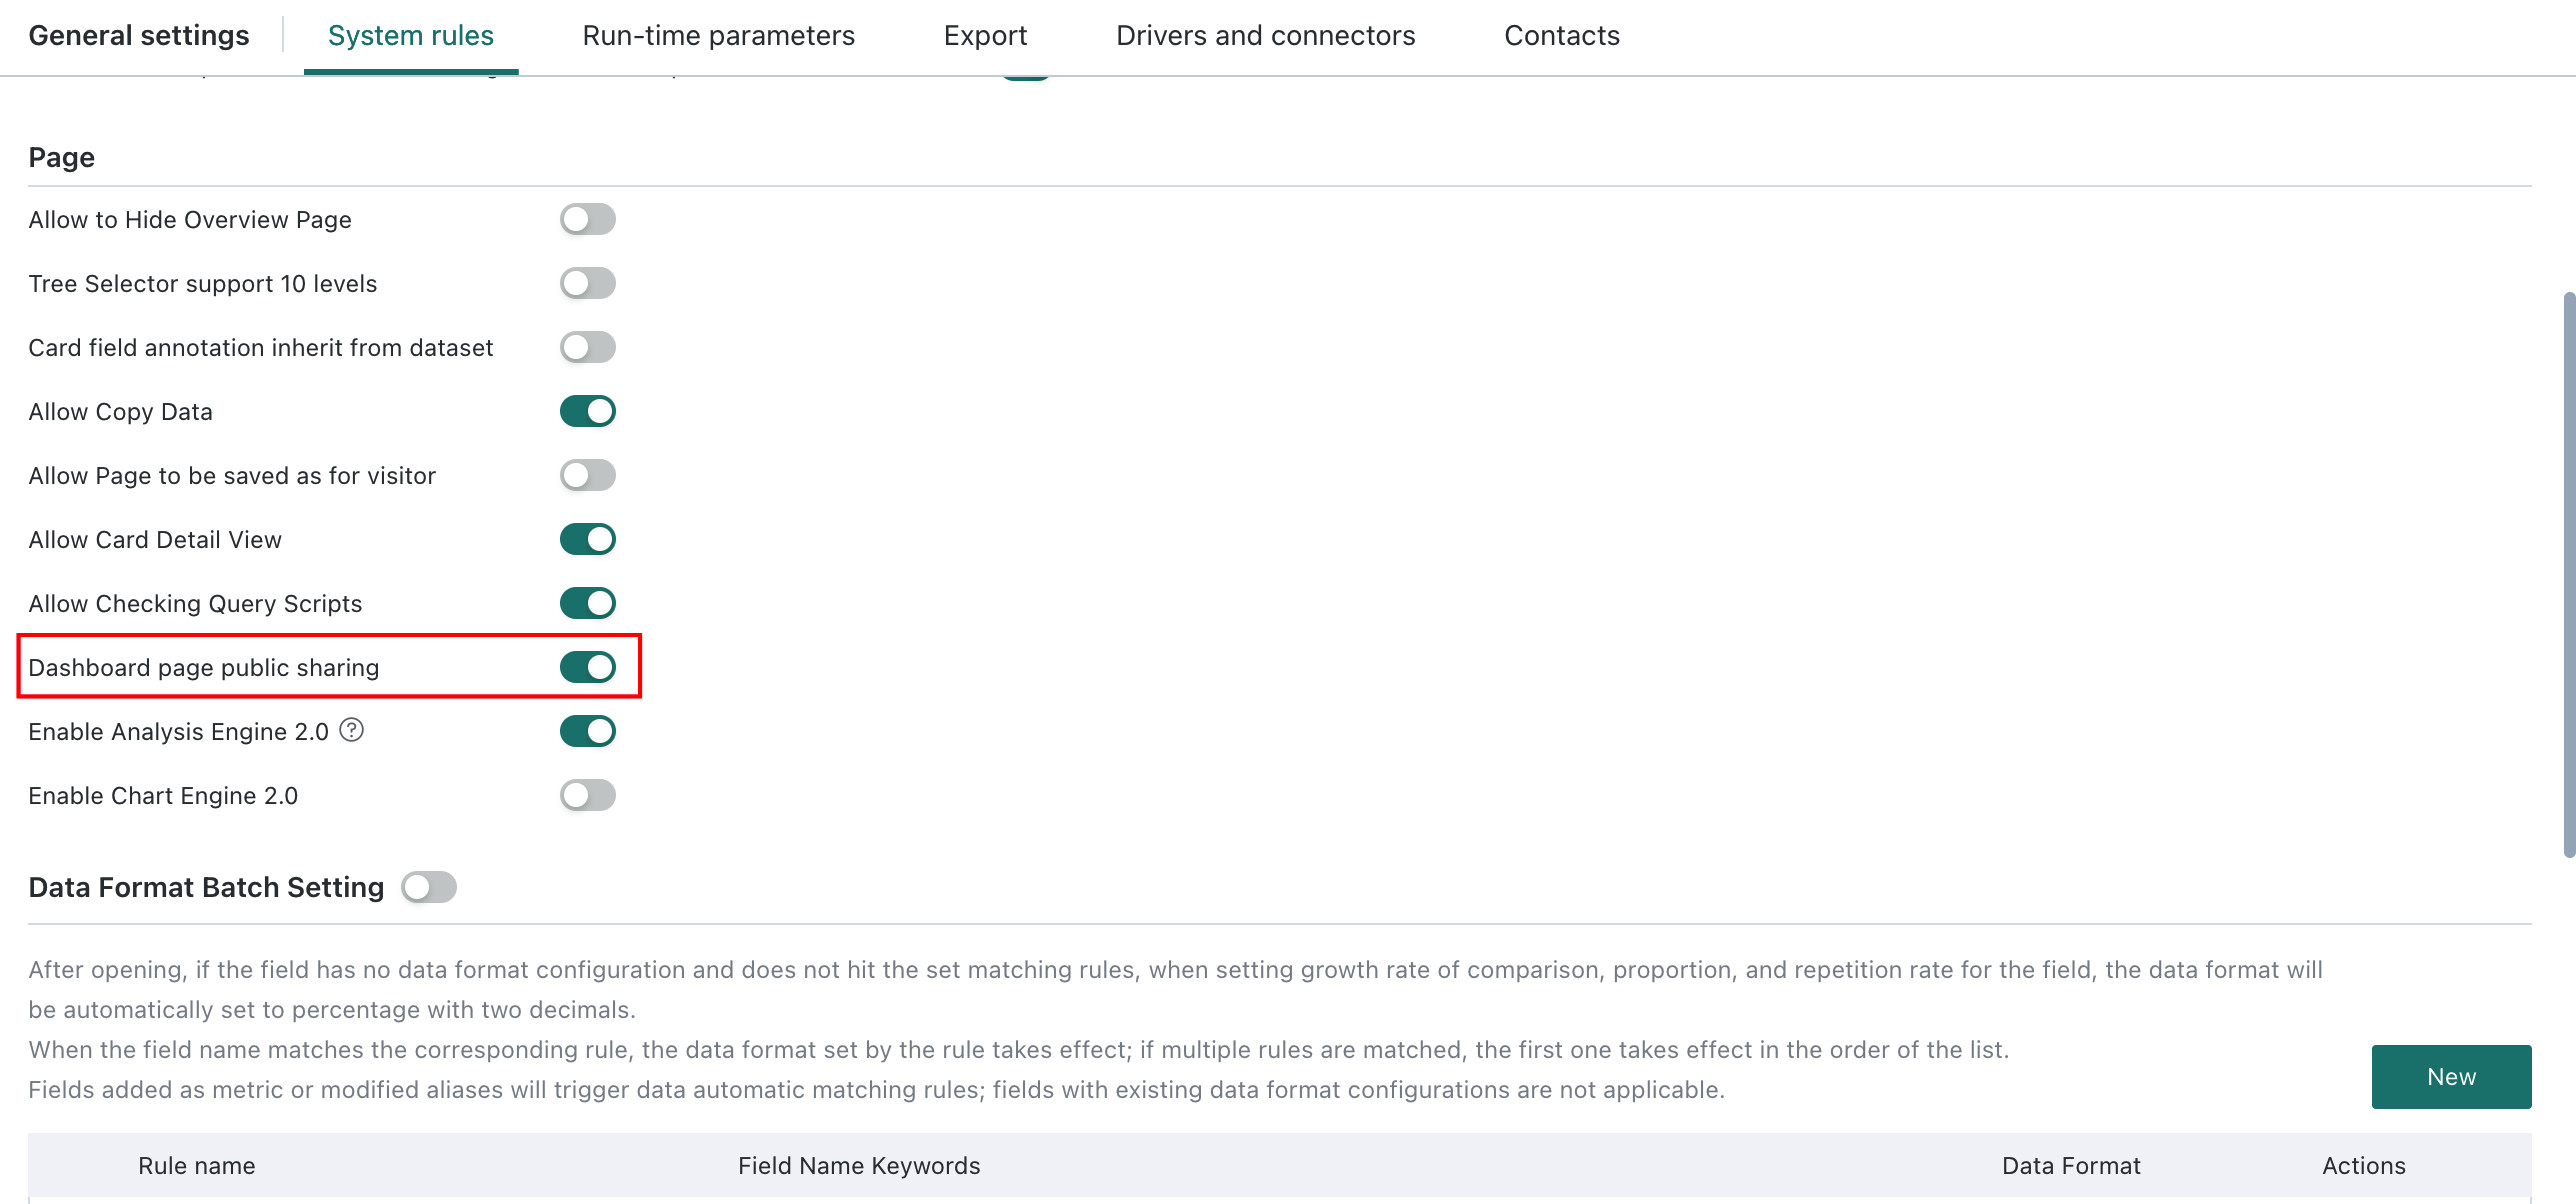
After turning on the Page Public Sharing feature switch, the owner can configure and enable Public Link at the page level, configure the corresponding messages, and then copy the link to other users.
-
For already developed pages (Dashboards and Data Screens), click
Morein the upper-right corner of the page and selectShare Link.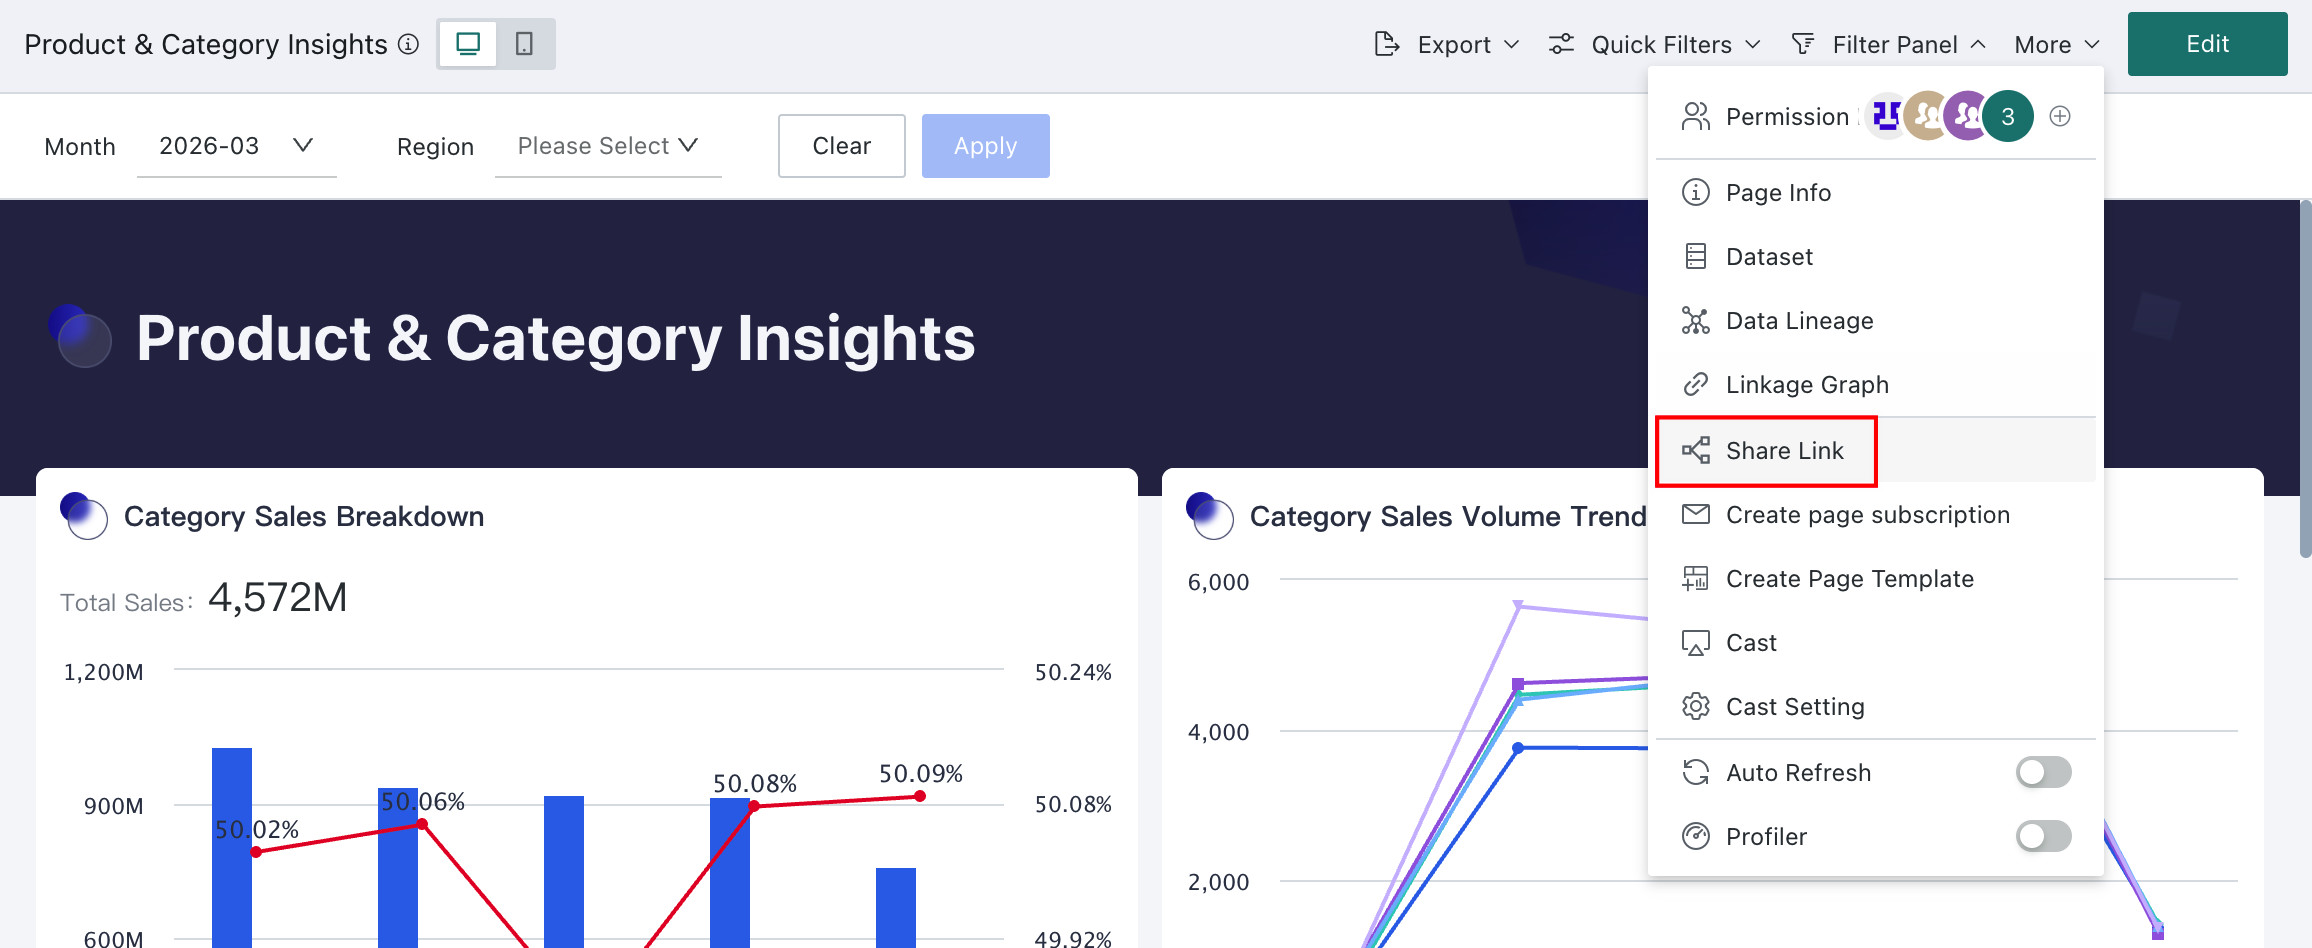
-
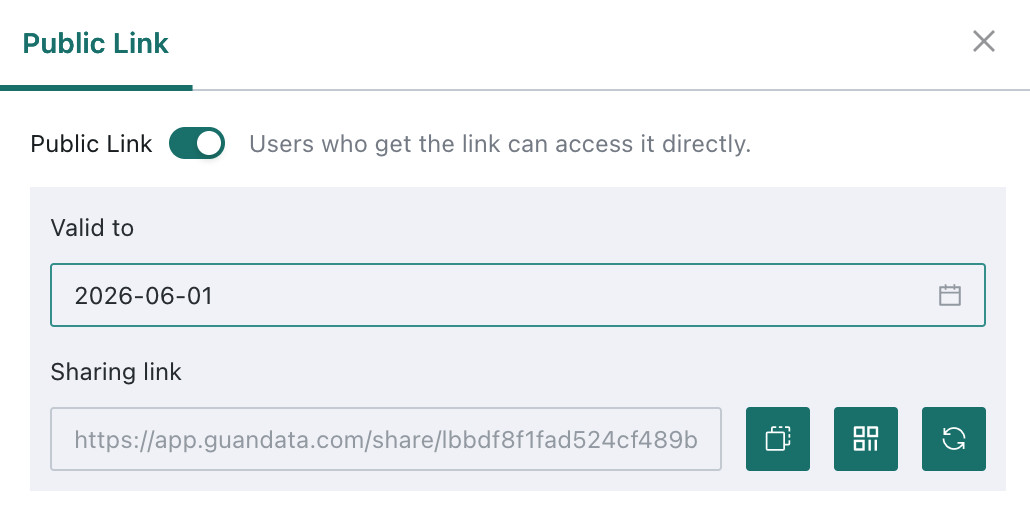
Enable and configure the expiration time in the pop-up.
-
Click the first button on the right side of the link address to copy the sharing link address.
-
If you need to change the sharing address, click the third button on the right side of the address. After refreshing successfully, the previous link address will become invalid.
- Enterprises need to accurately assess the potential security impact of enabling this feature and enable it with caution.
- Multiple owners can share a page simultaneously, and each owner's sharing link address is different.
- After other users obtain the sharing link, they will view specific card data with the row and column permissions of the sharer.
Page Subscription
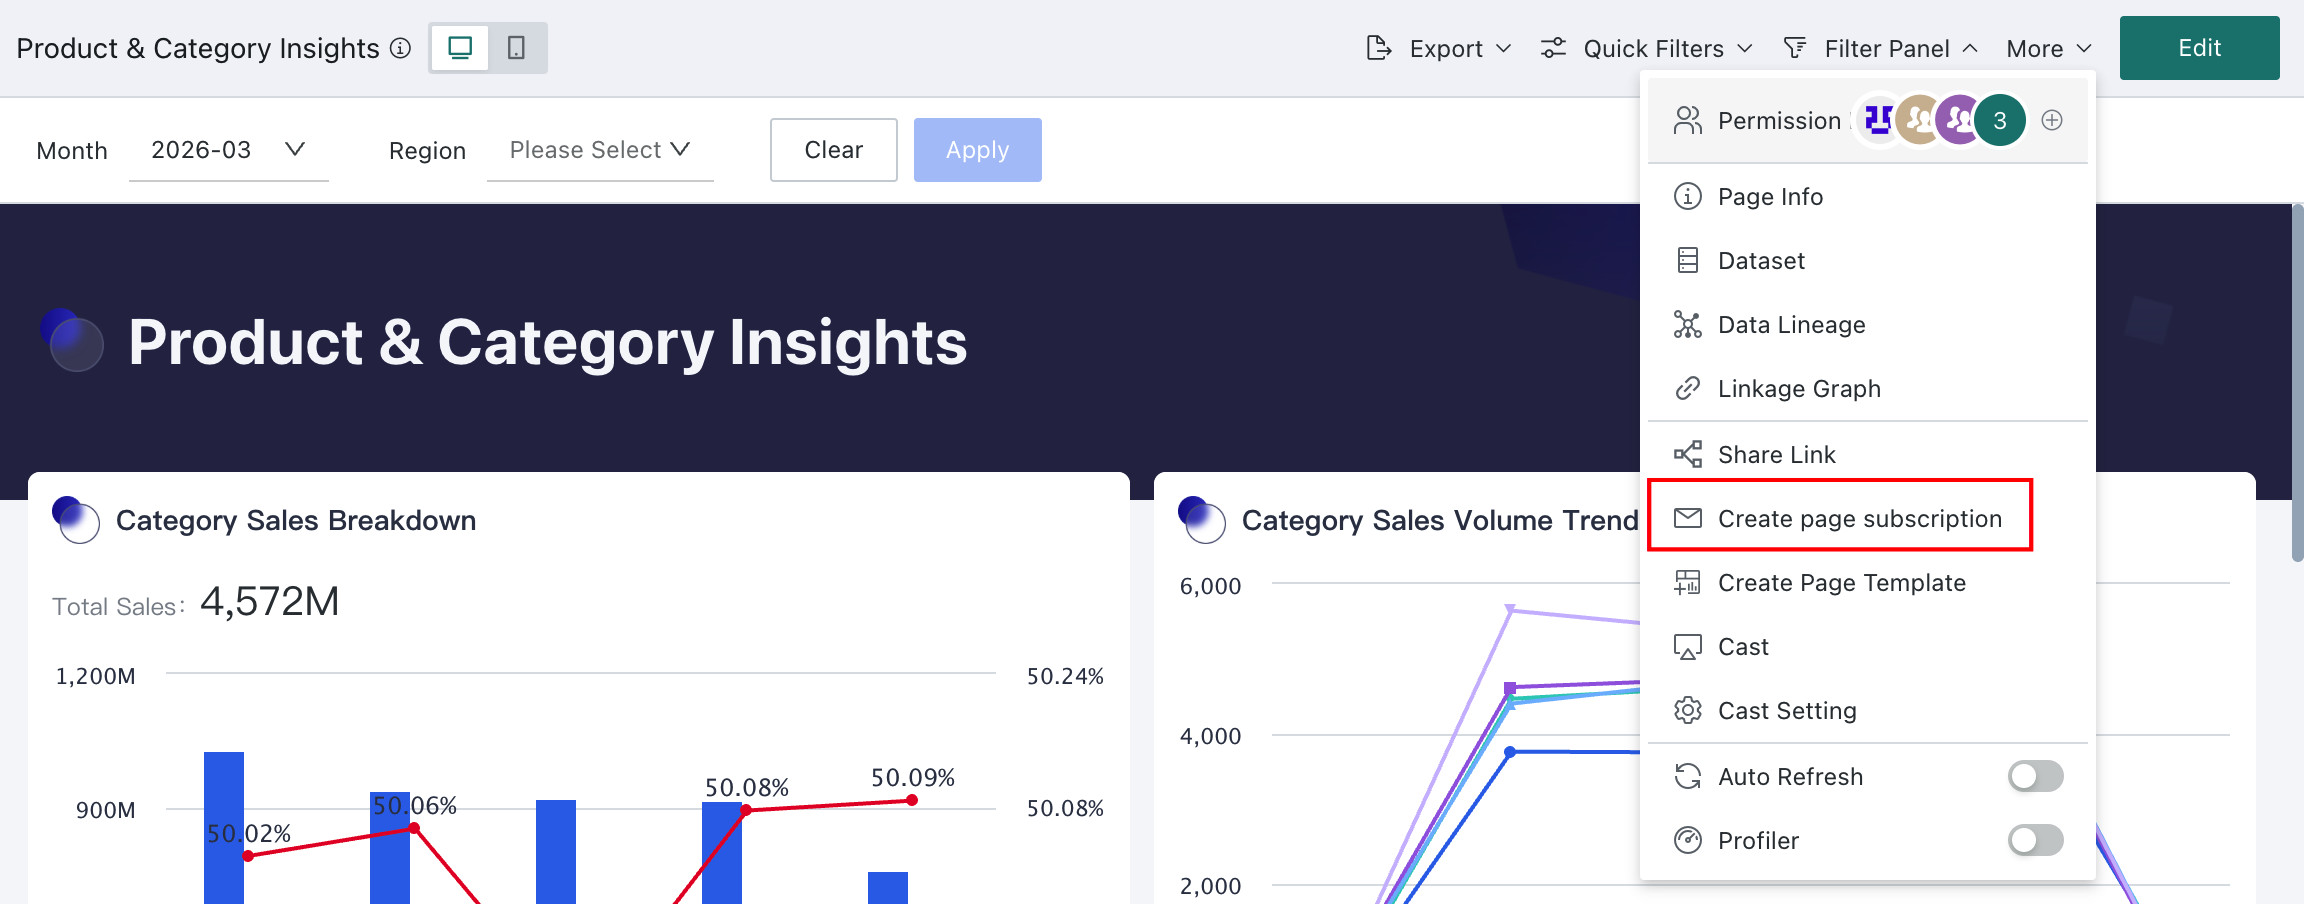
After a Dashboard is created, it often needs to be shared with business users for decision-making and communication. To do this, you can use the page subscription feature to send page content to specified users through email, DingTalk, WeCom, and other channels. For details, see Subscription.
Create Page Template
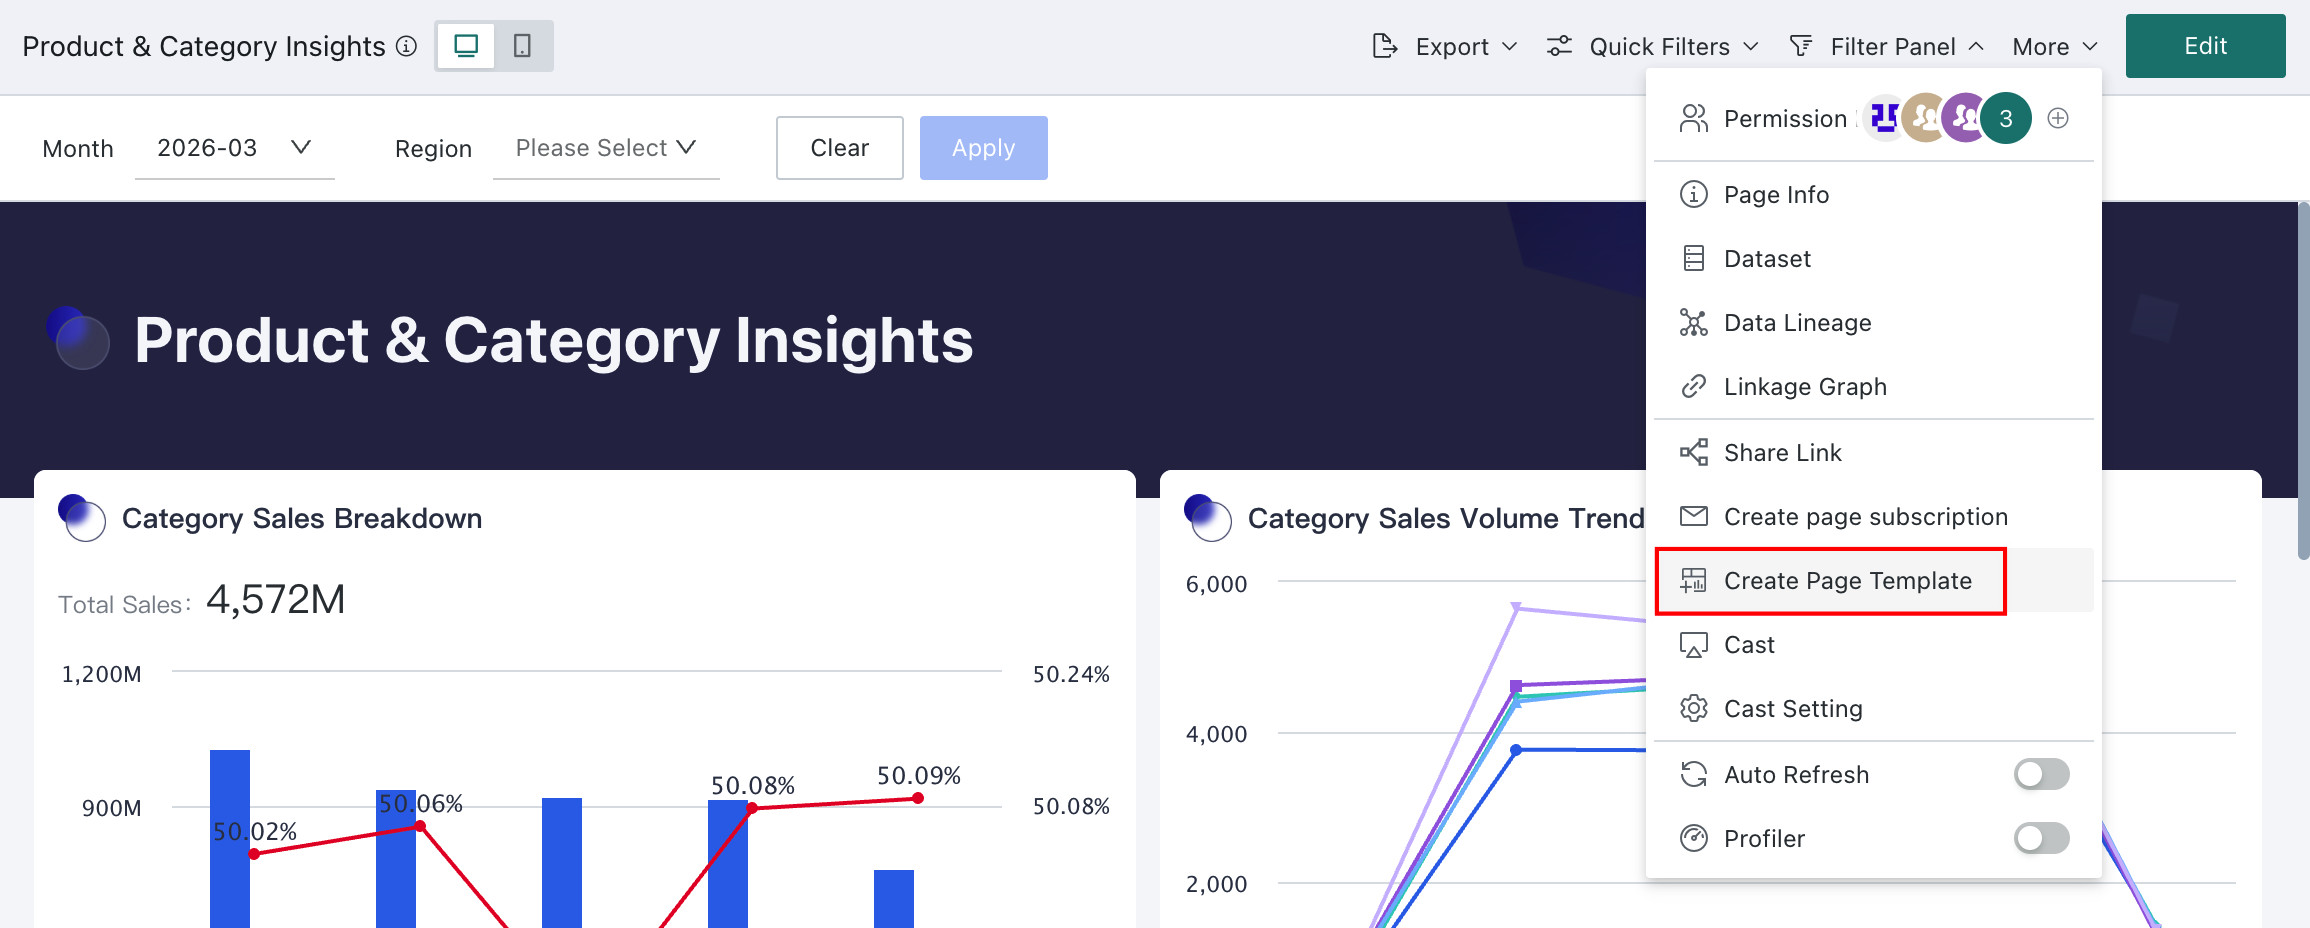
After Dashboard production is completed, the current Dashboard can be created as a page template, that is, saved as a reusable page component template. The template will save the Dashboard's layout, color, font, and other style settings. Other editors can directly use this template when creating a new Dashboard. After replacing the data, they can quickly create a new page with consistent interactive visual effects.
Open an existing Dashboard, click More at the top of the page, and select Create Page Template to save the entire Dashboard as a reusable page template. For detailed configuration steps, see Component Template.
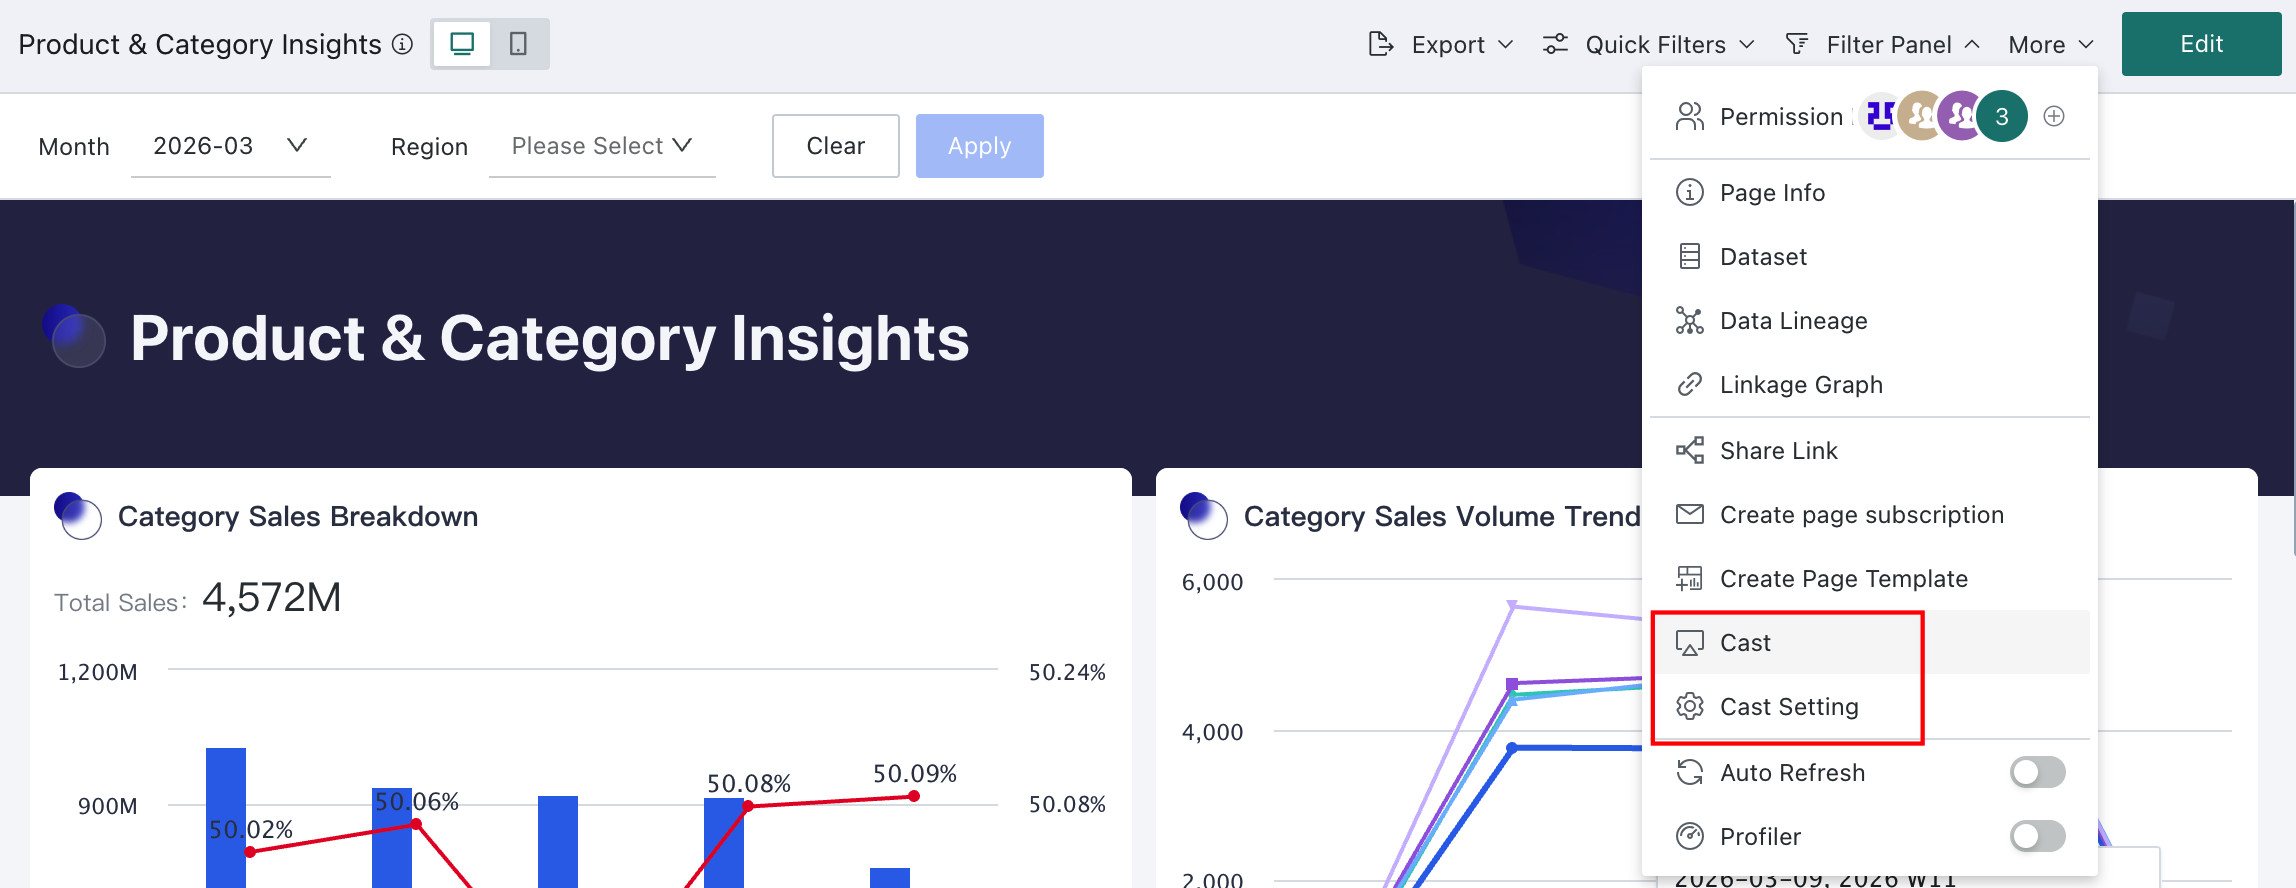
Page Screen Casting
Users can cast data reports, charts, or analysis results from the Guandata BI system through casting devices (such as large screens, projectors, etc.) for display, so as to share and discuss data with the team during meetings, presentations, or data analysis processes. For specific configuration process details, please refer to Page Screen Casting.
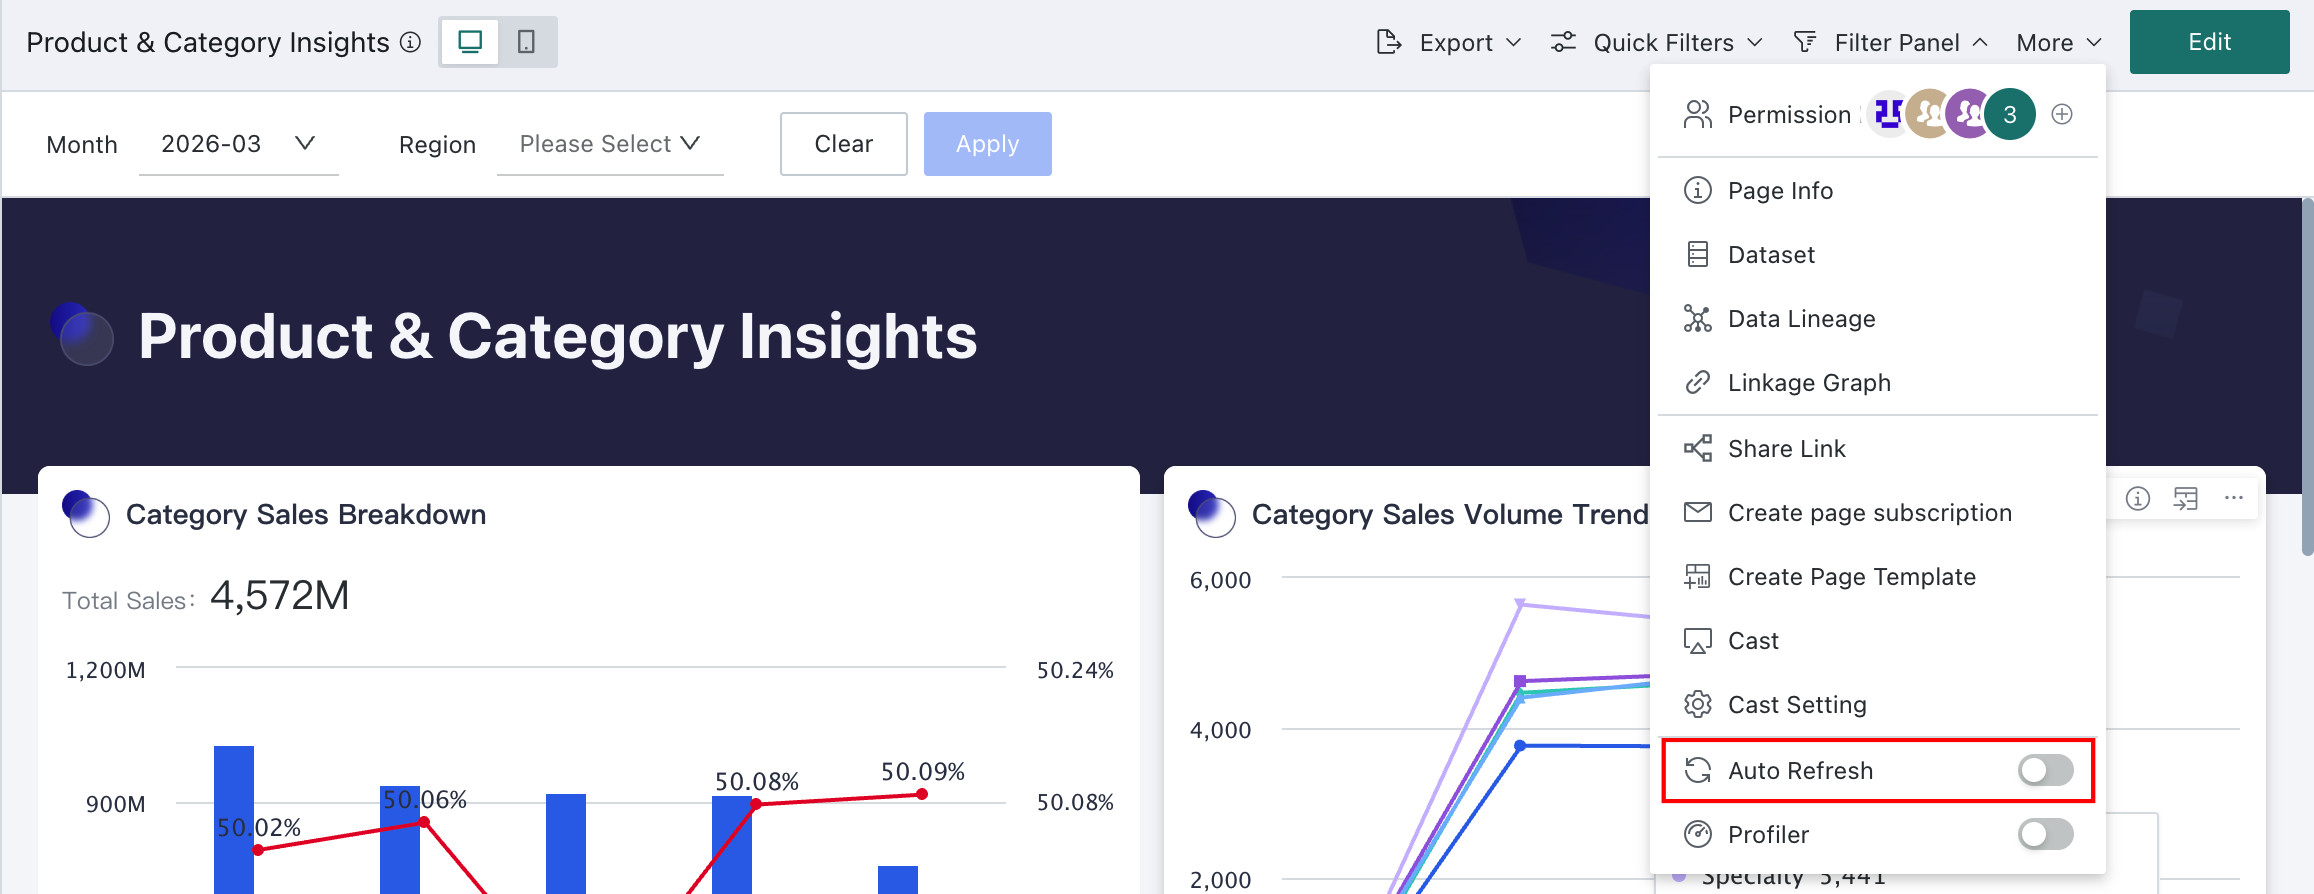
Auto Refresh
The Auto Refresh feature allows data in the data board to be automatically updated at certain time intervals without user manual intervention. This ensures users always view the latest data without worrying about data becoming outdated or needing to frequently manually refresh the page. For specific configuration process details, please refer to Auto Refresh.
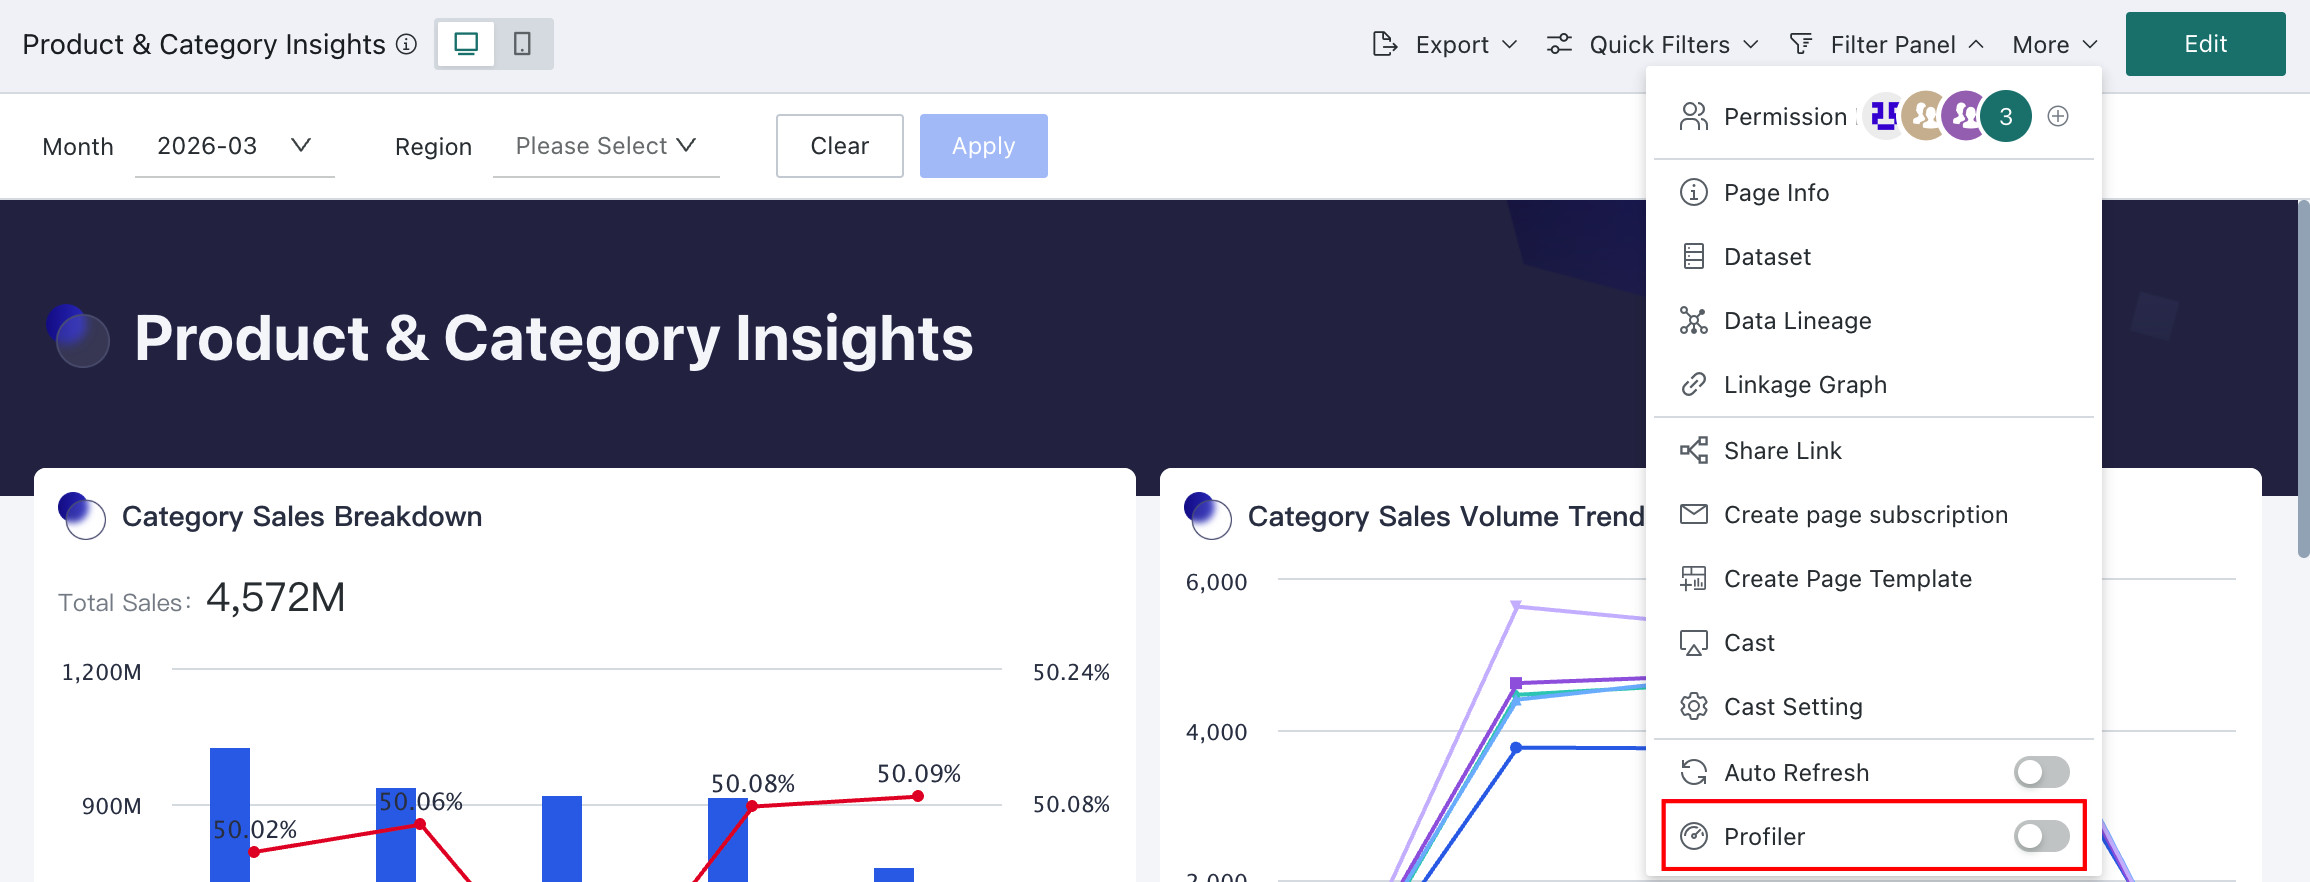
Performance Tracking
Performance Tracking is a monitoring and tracking feature provided by Guandata that displays real-time performance data of the platform. It can help users track the performance of the current Dashboard in a timely manner, thereby achieving self-inspection and positioning of performance issues. For specific configuration process details, please refer to Performance Tracking.
Card Operations
:::note[Note]This operation requires entering the dashboard editing page.
:::
After producing the analysis board, in addition to operating the Dashboard as a whole, users can also perform further operations on cards, such as editing cards, configuring card Interactive Analysis, creating card subscriptions/alerts, etc. For details on this part, please refer to Card Management.