Chart Analysis Preview
Overview
During chart creation, you can preview the result in real time after each editing step and adjust the chart based on the preview. In the preview area of the card editing page, Guandata BI supports switching visualization types and performing preview, modification, and save operations on the chart.
User Guide
Switch Visualization Type
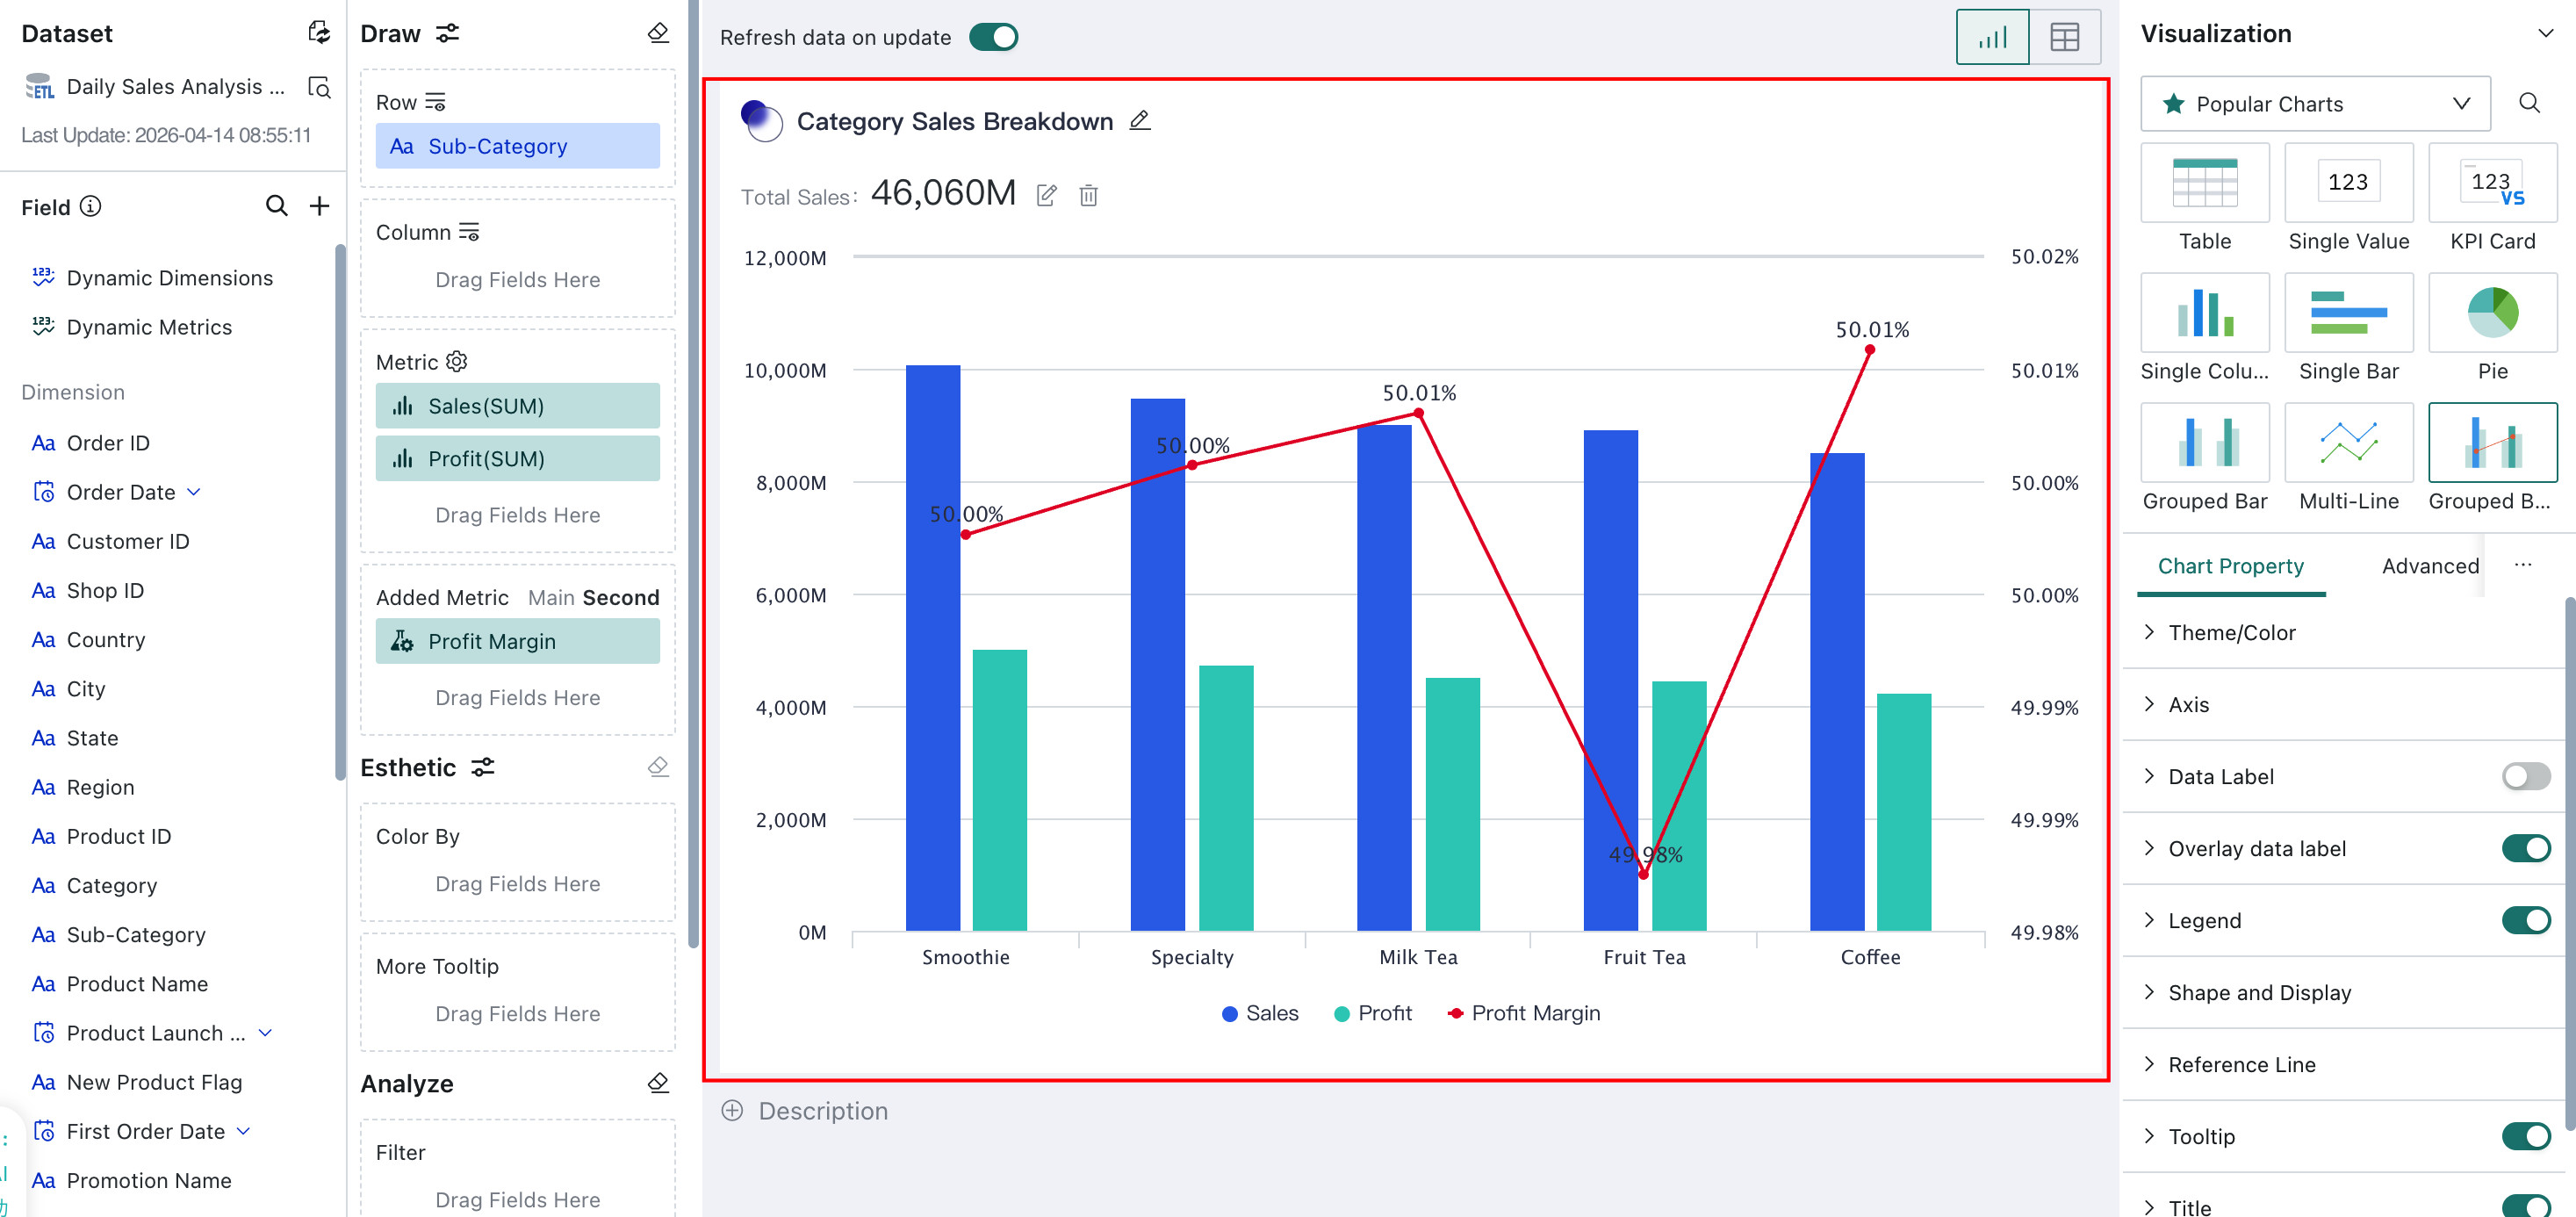
A themed analysis dashboard usually contains multiple types of visualization charts to satisfy different analytical goals and presentation needs. Guandata BI supports many chart types, including column charts, bar charts, line charts, and pie charts, each with its own use cases and strengths.
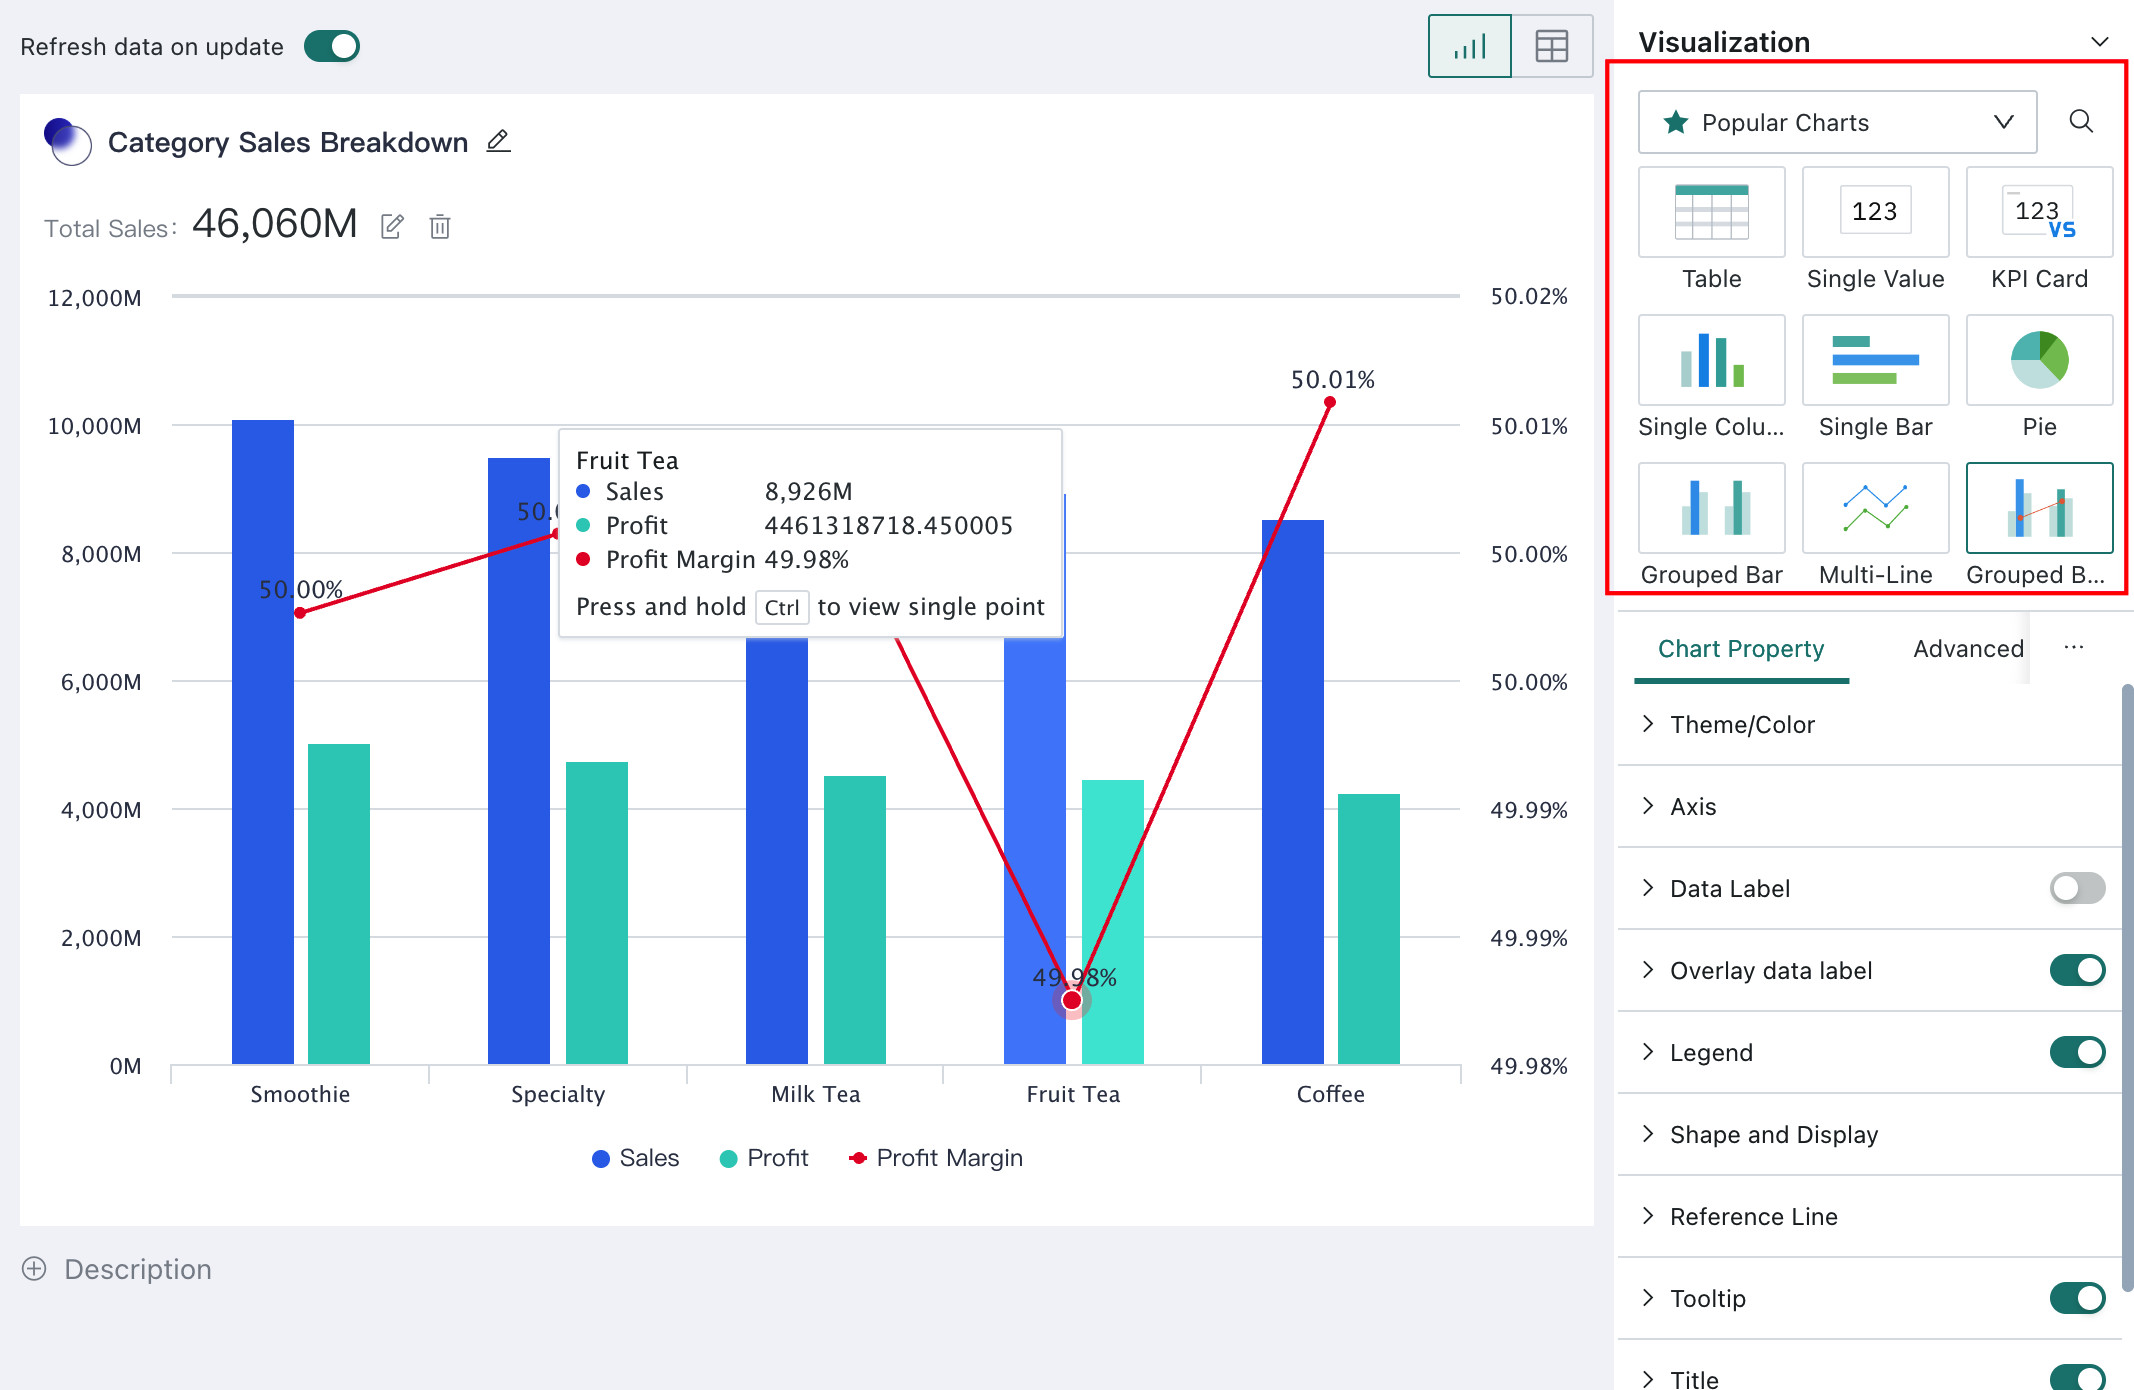
When creating a chart, the first step is to choose an appropriate visualization type. On the card editing page, you can freely switch the chart type in the upper-right area.
Analysis Preview
Automatically Refresh Data After Changes
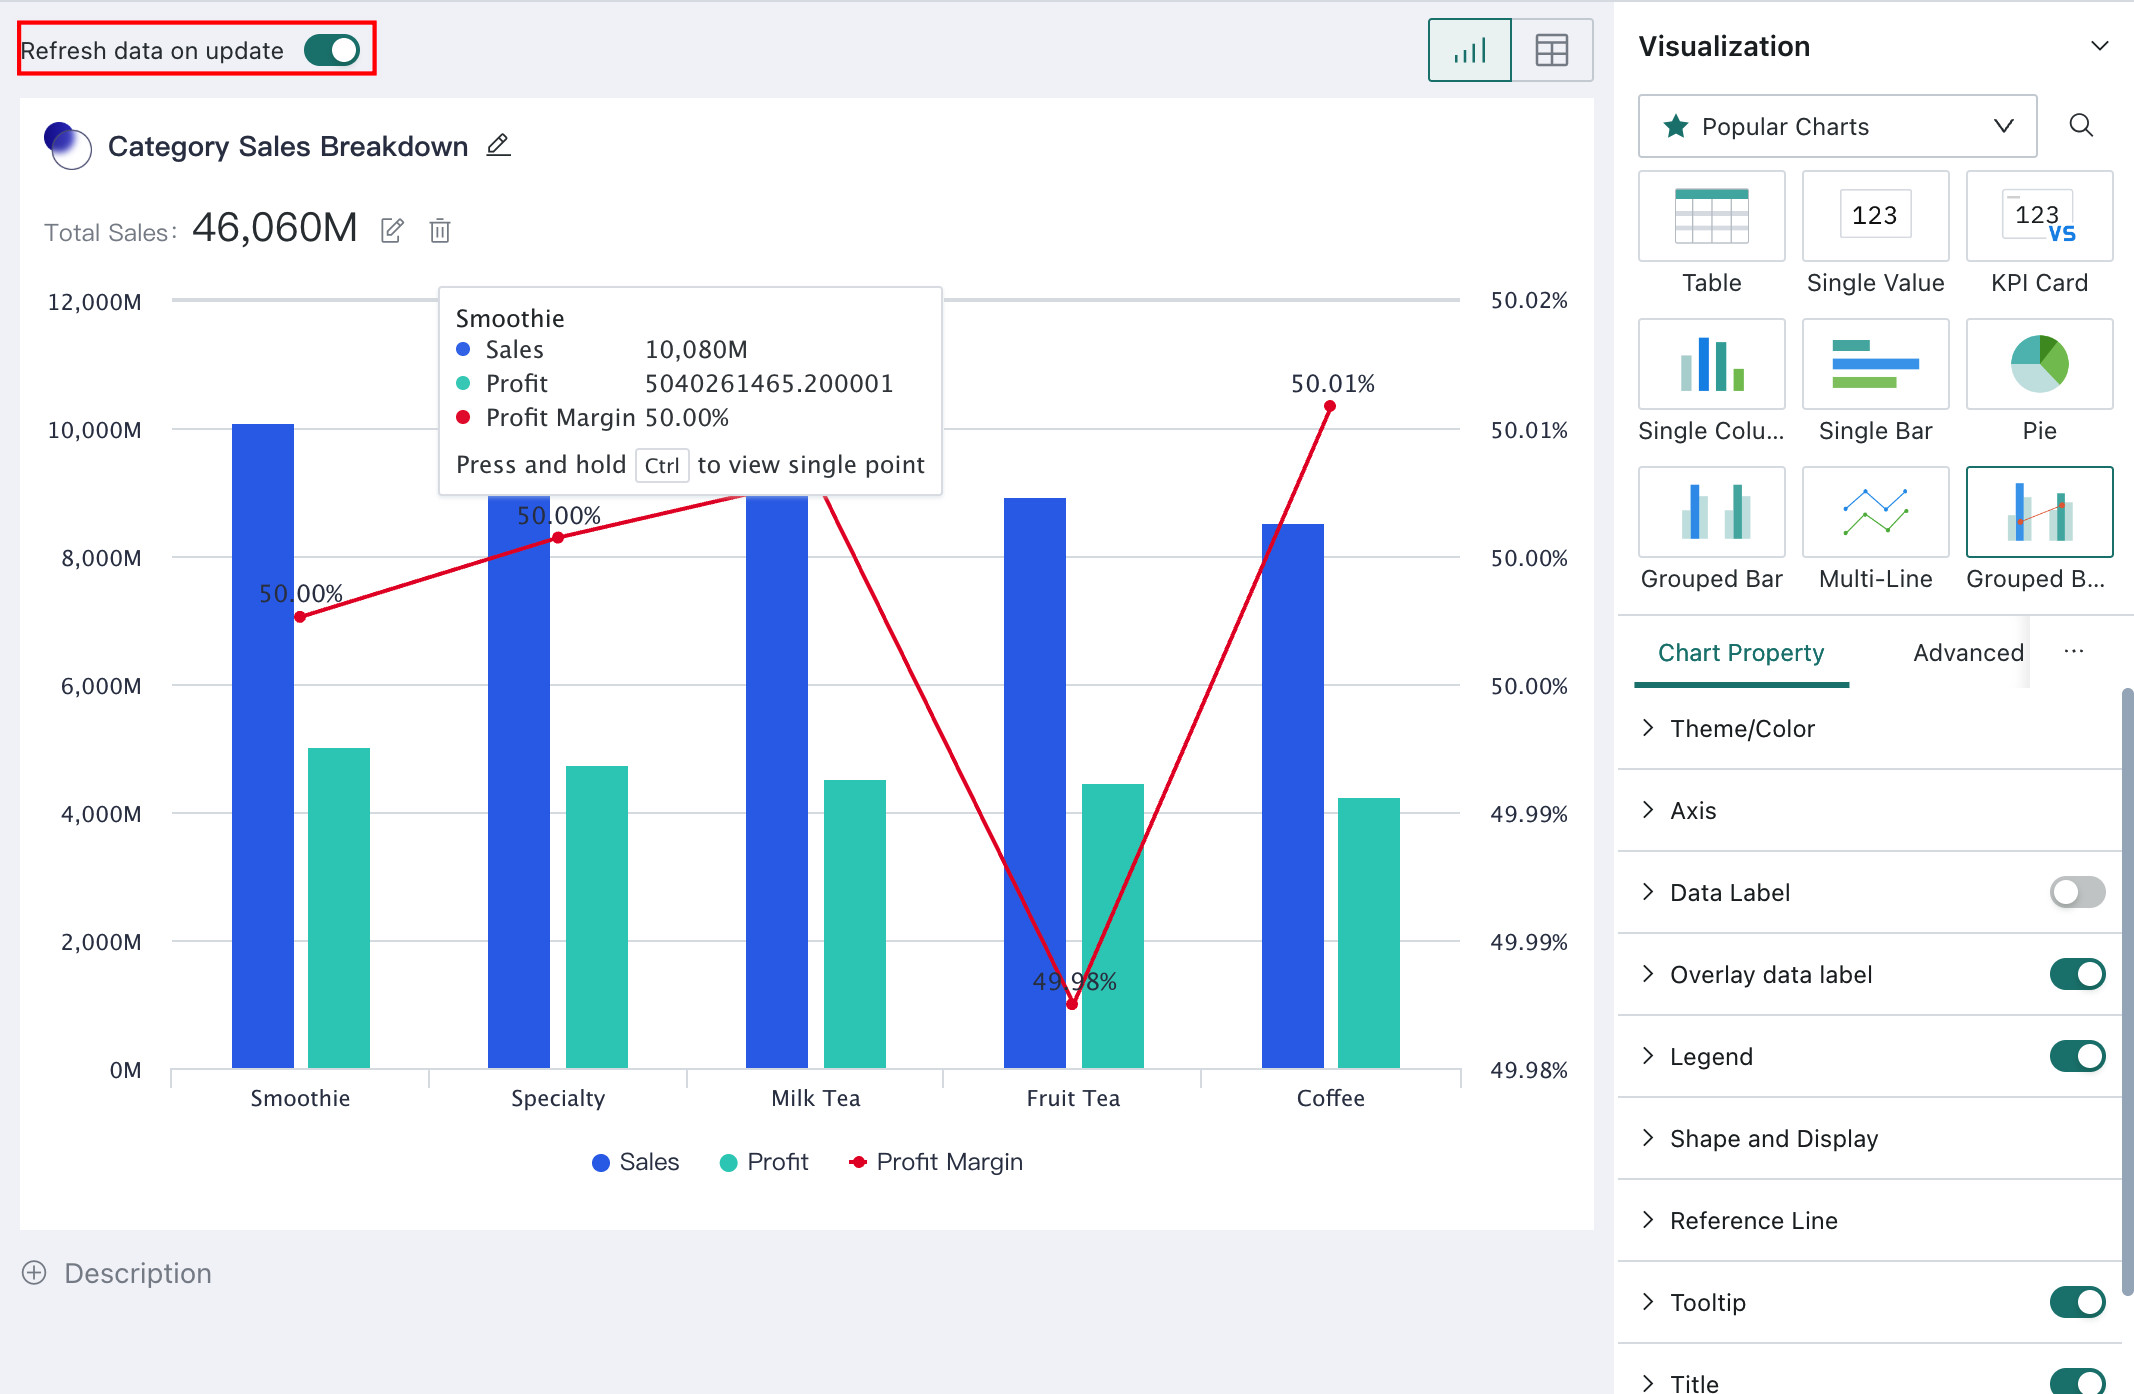
When users create charts, they often perform a series of edits such as switching chart types, adding or removing fields, and adjusting chart properties. After each operation, the chart data needs to be refreshed before the edited result can be previewed.
Guandata BI supports two refresh modes through Refresh data on update: automatic system refresh and manual user refresh.
On the card editing page, if you turn on Refresh data on update, the system refreshes data automatically after every edit. If the switch is turned off, you need to refresh data manually after editing.
When the dataset is large or calculations are complex, it is recommended to turn this option off to avoid slow performance response.
Query Statement
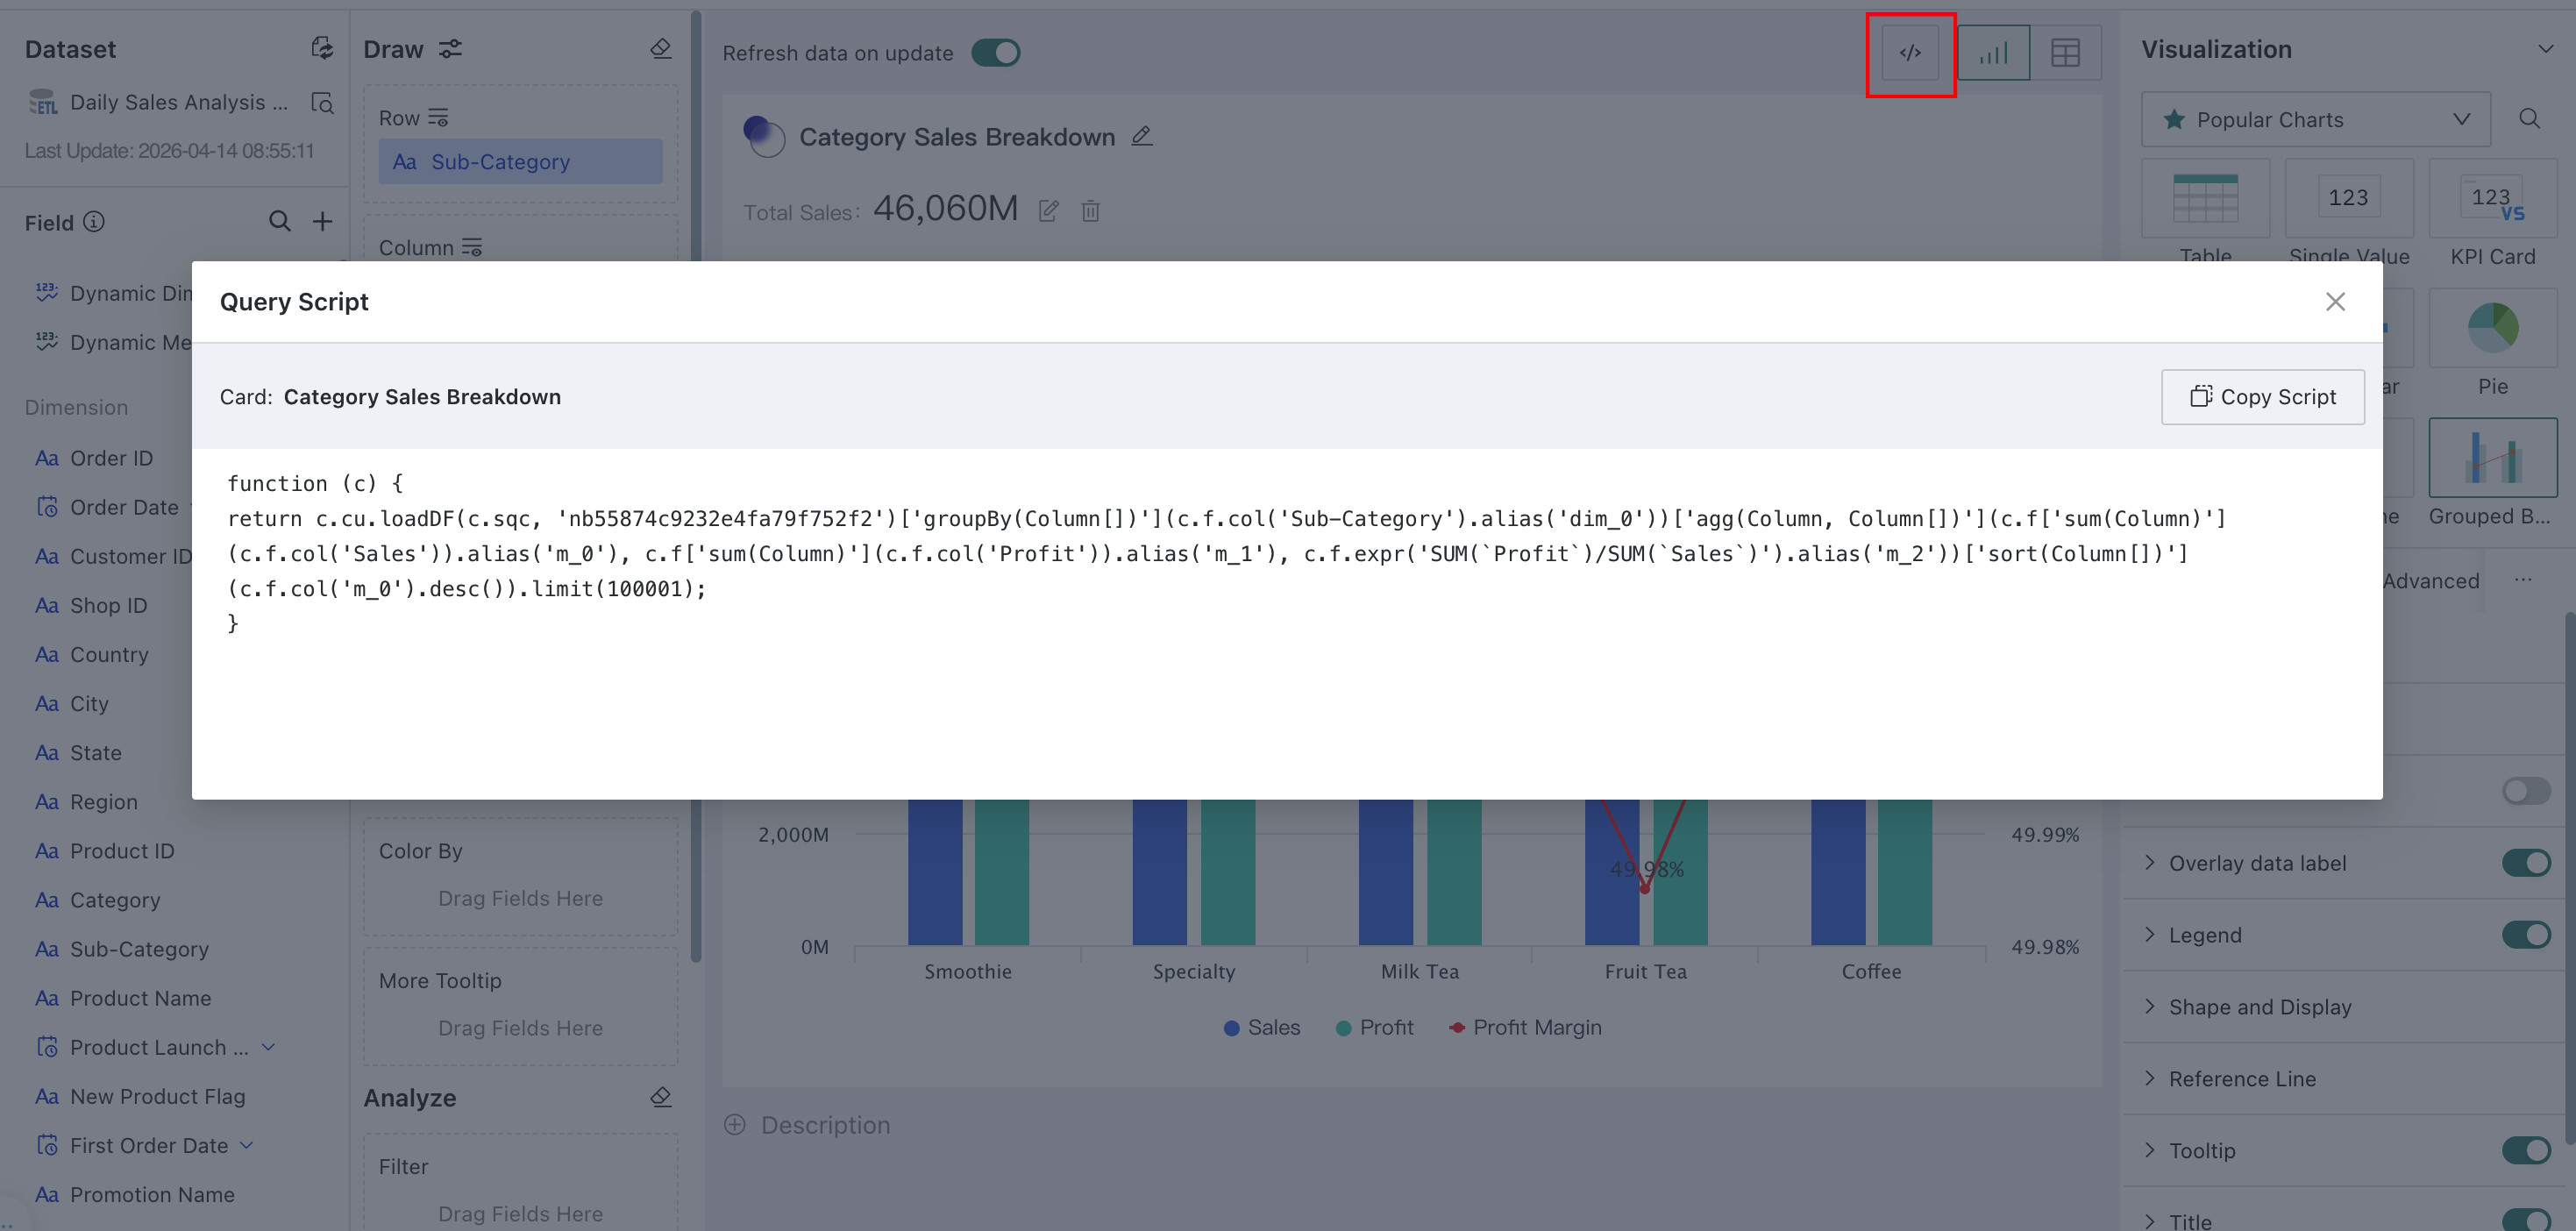
A query statement is an instruction used to retrieve specific data from a database or dataset. To help technical users or analysts understand the calculation logic behind a BI card, Guandata BI supports viewing the SQL or script used by the card.
On the card editing page, click the Query Script icon in the upper-right icon group to view the current card's data logic.
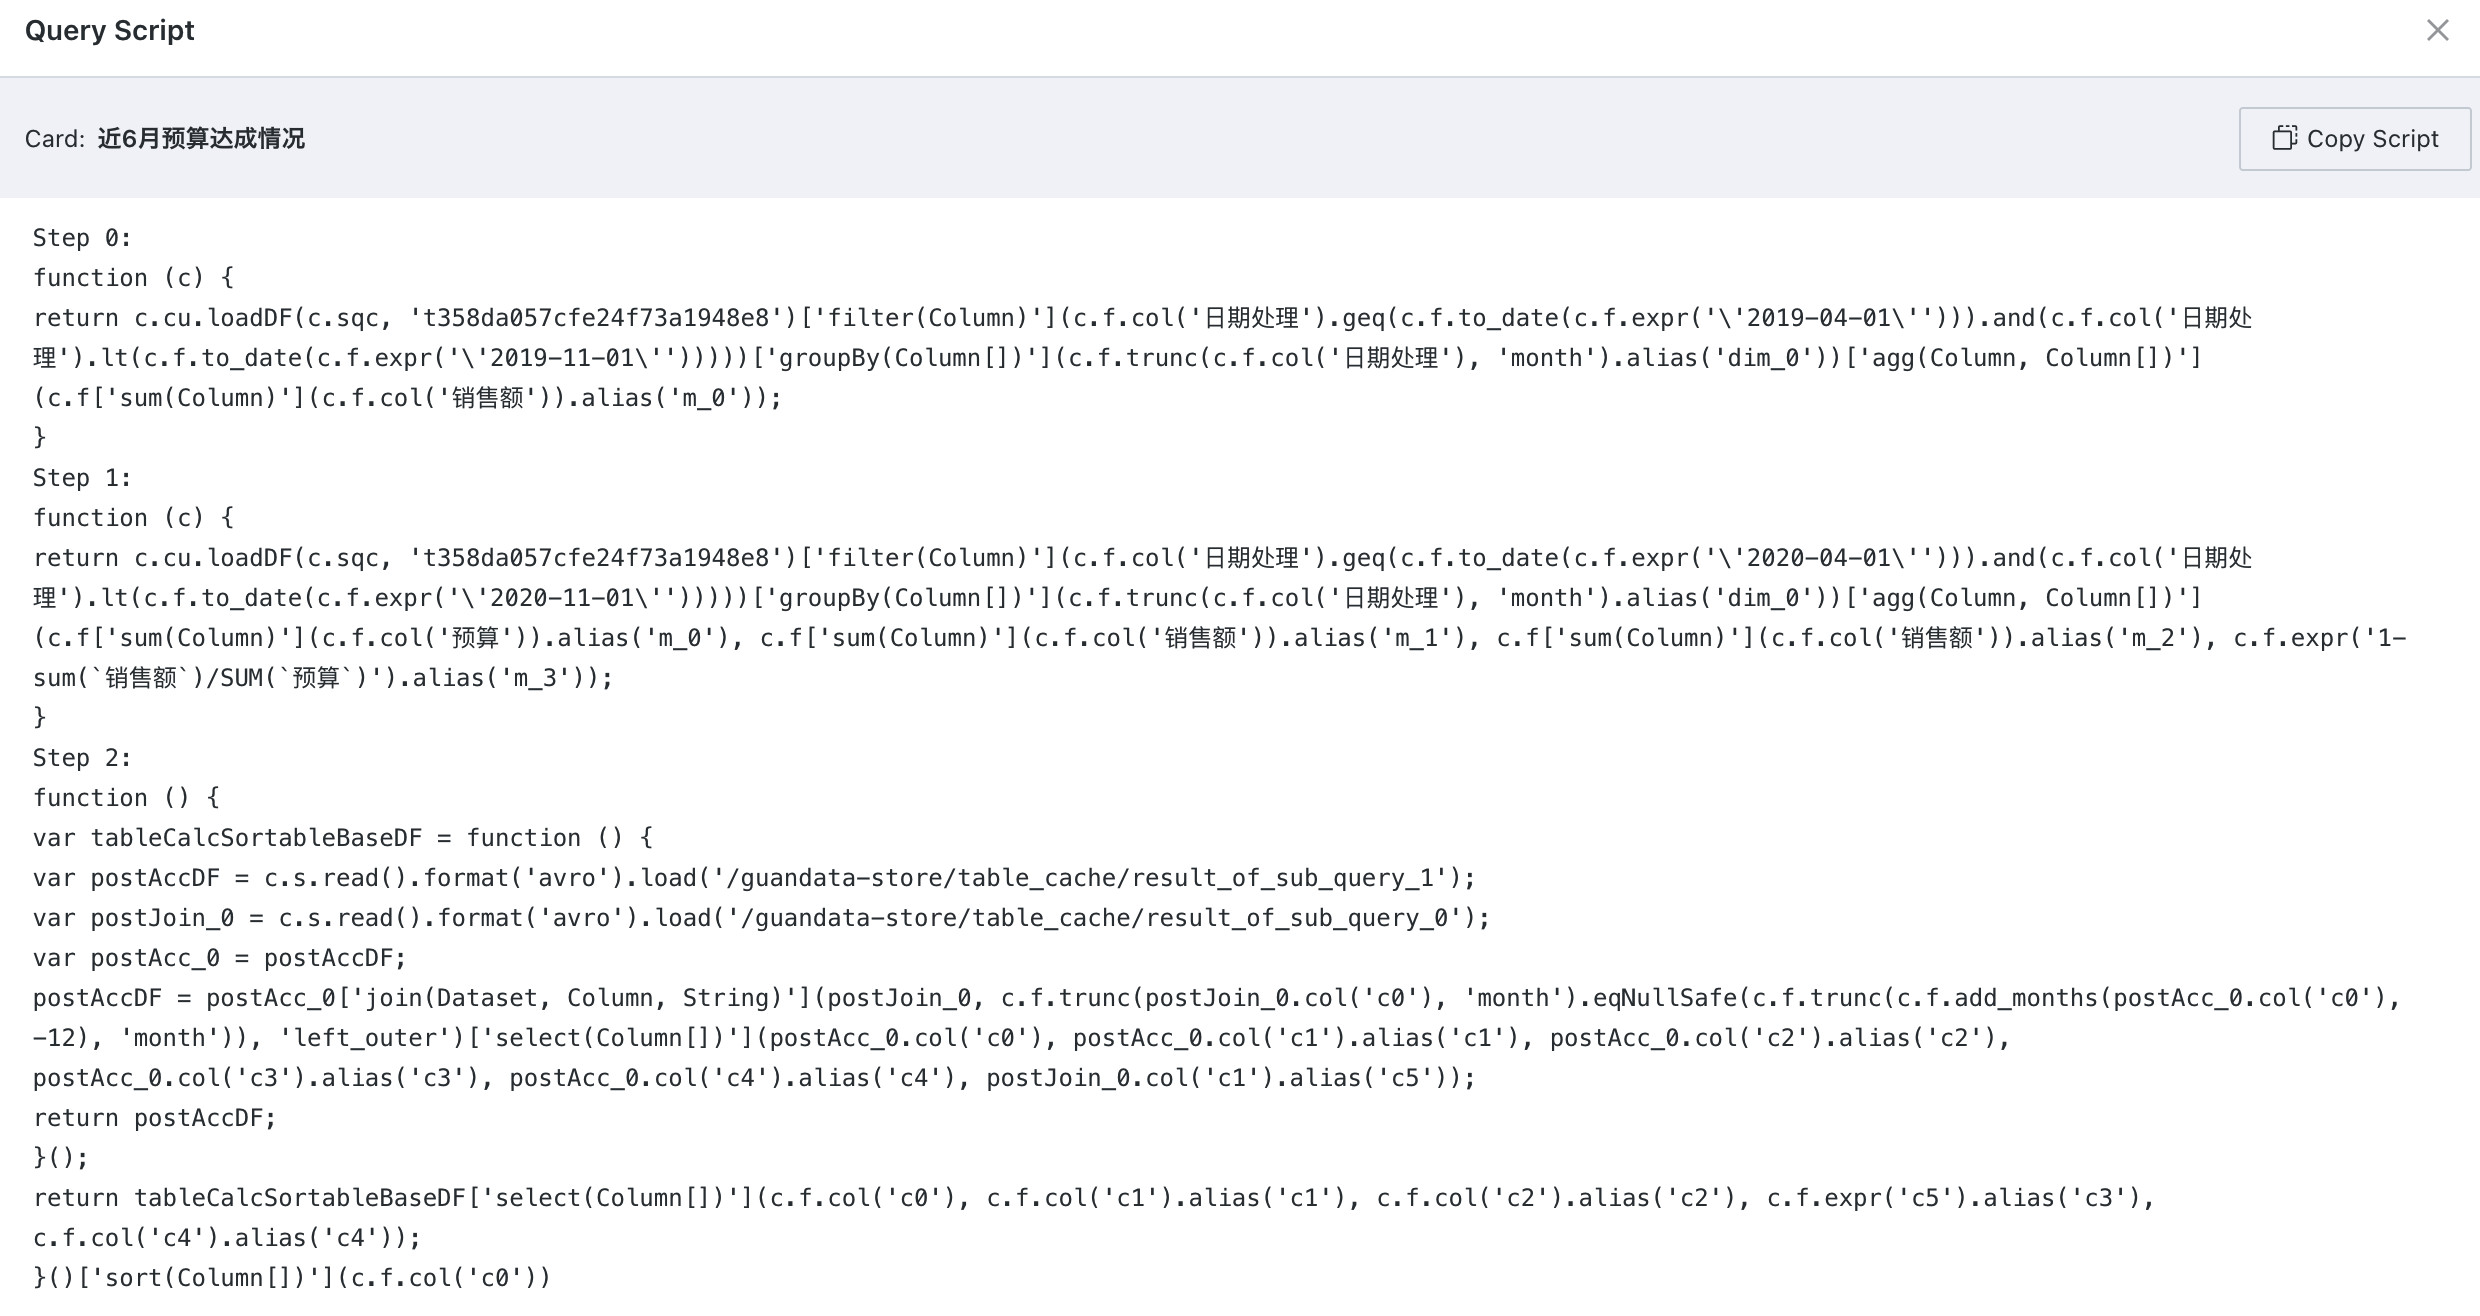
The system provides different query outputs depending on the dataset type:
- Direct-connection database: the database query SQL
- Non-direct-connection dataset: Spark execution script, not SQL but still somewhat readable
- Accelerated dataset: ClickHouse query statement
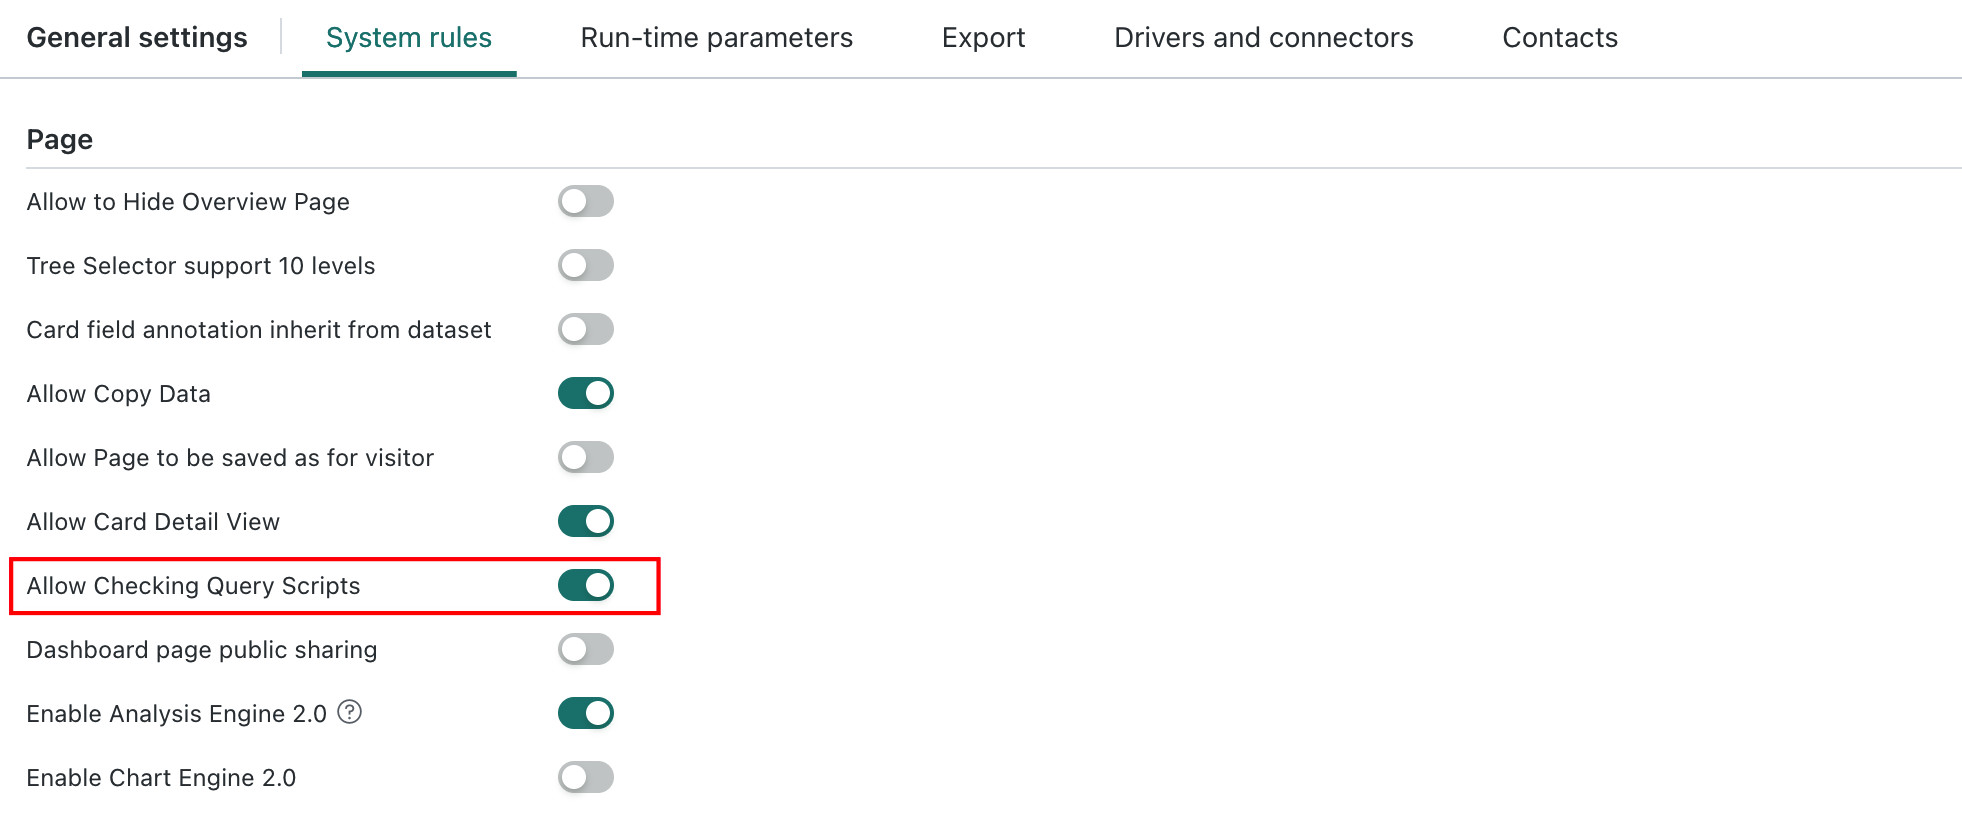
This feature must be enabled by an administrator in Management Center > System Setting > General settings > System rules through the Allow Checking Query Scripts option. The feature is turned off by default and should remain off unless necessary.
In addition to the card editing page, users can also view query statements from the dashboard page. For details, see Card Management.
Switch Between Chart Mode and Data Mode
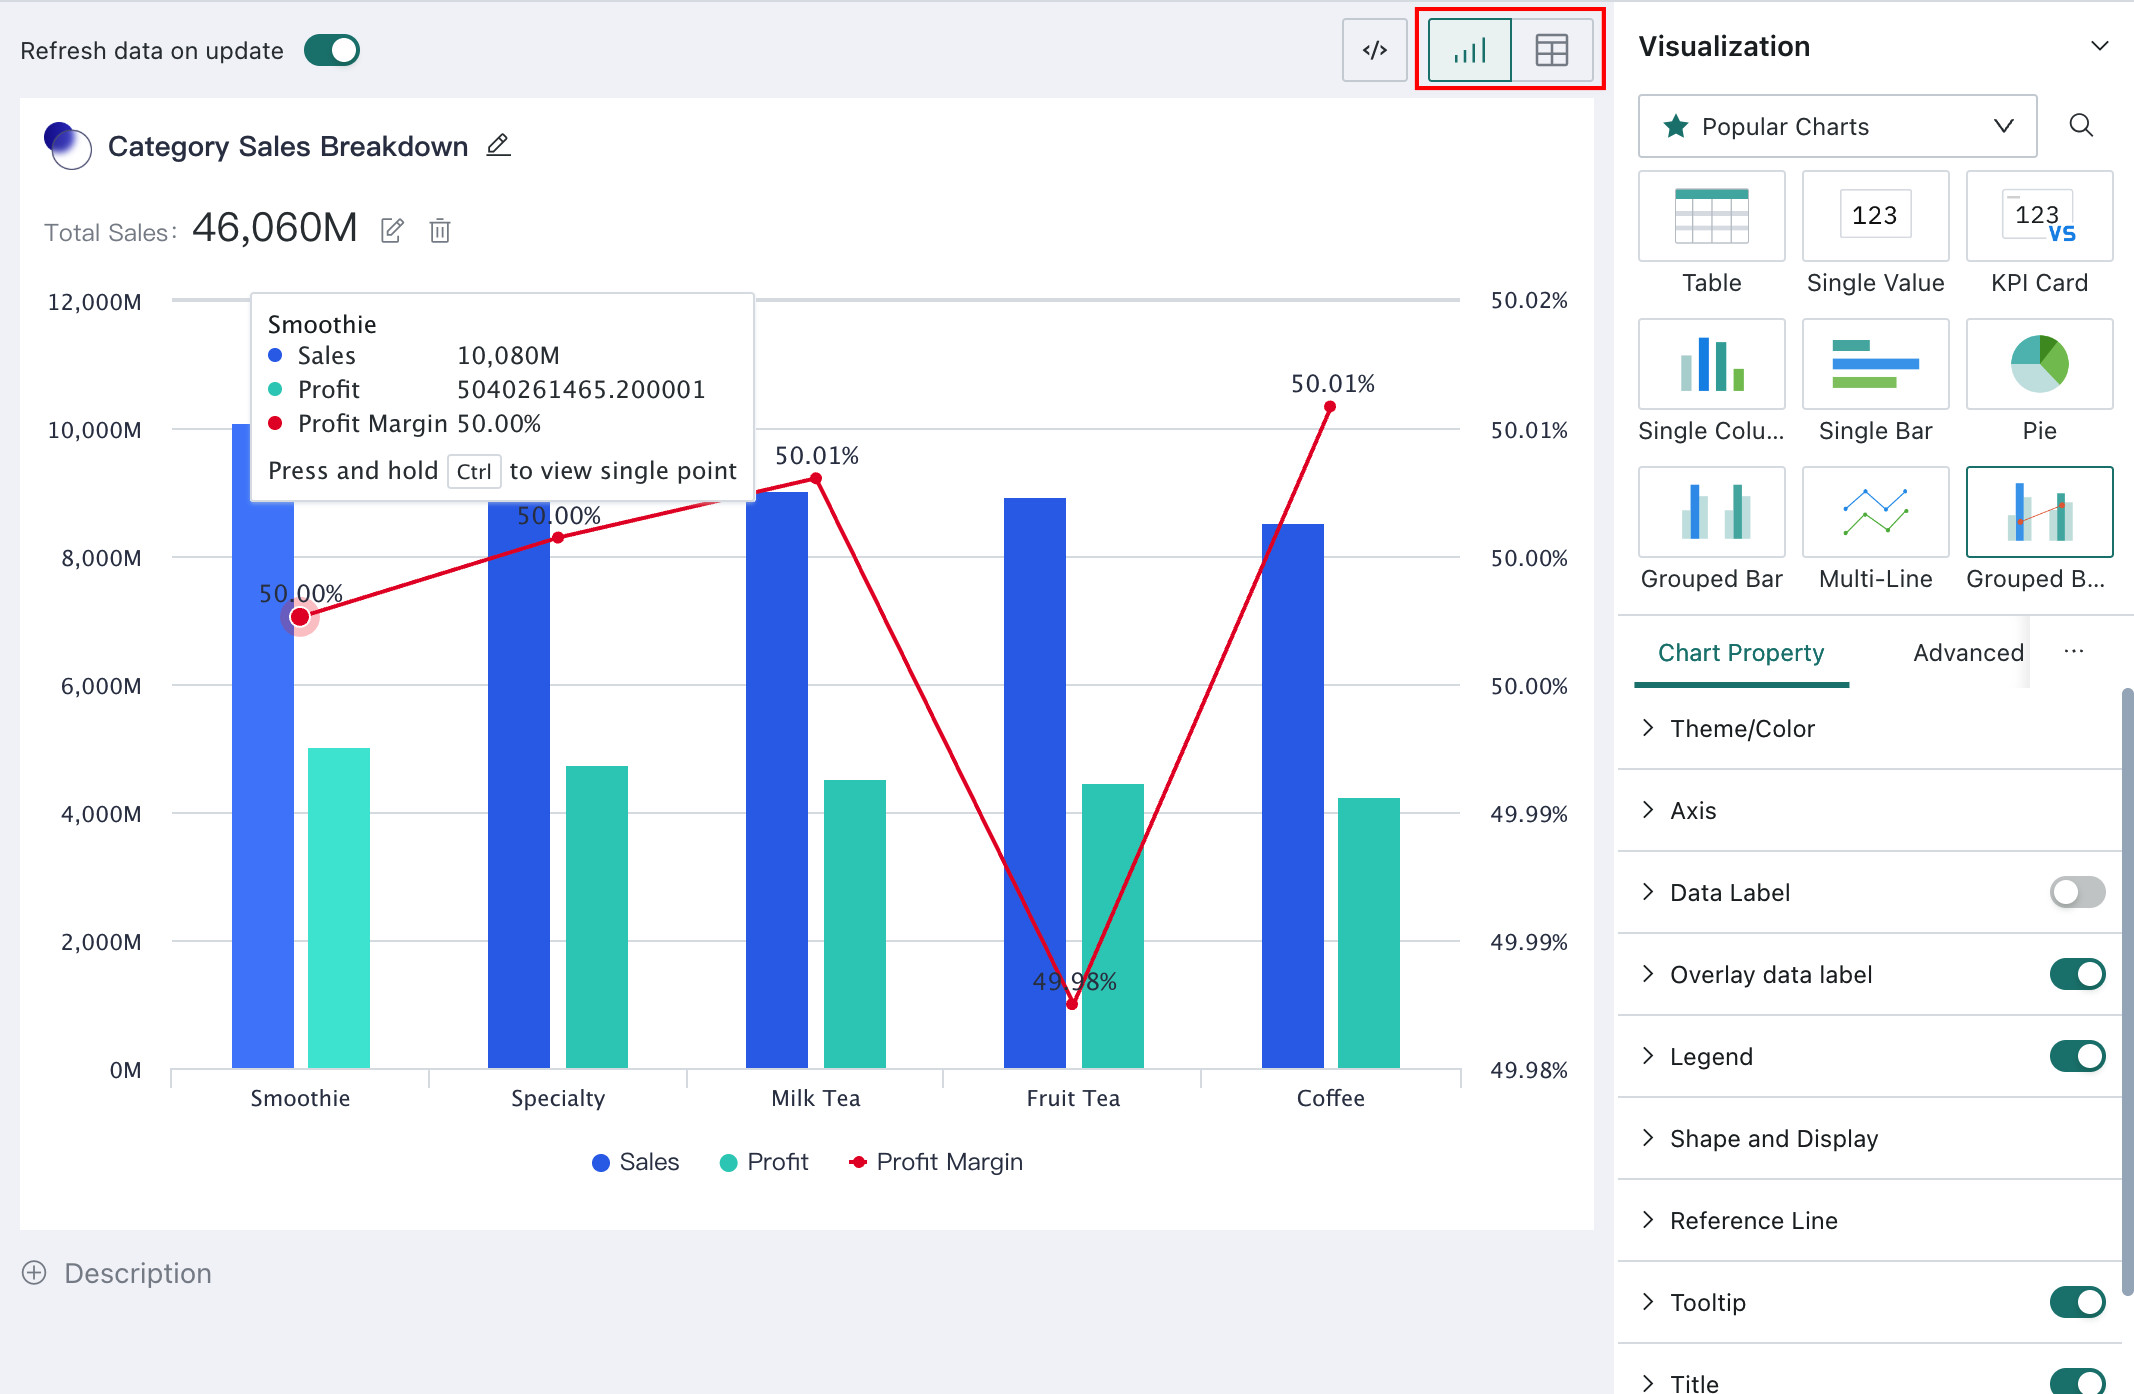
If you want to view the exact data contained in a chart during editing, you can switch the card from chart mode to data mode so that the data is presented in table form.
On the card editing page, click the table-shaped icon in the upper-right corner to switch from chart mode to data mode.
Adjust Column Width
Properly adjusting column width can make data display more organized and visually balanced.
On the card editing page, drag the table border directly to adjust column width. Click Reset Column Width to restore the default width.
In addition, table column width can also be adjusted directly on the dashboard. For details, see Card Management.
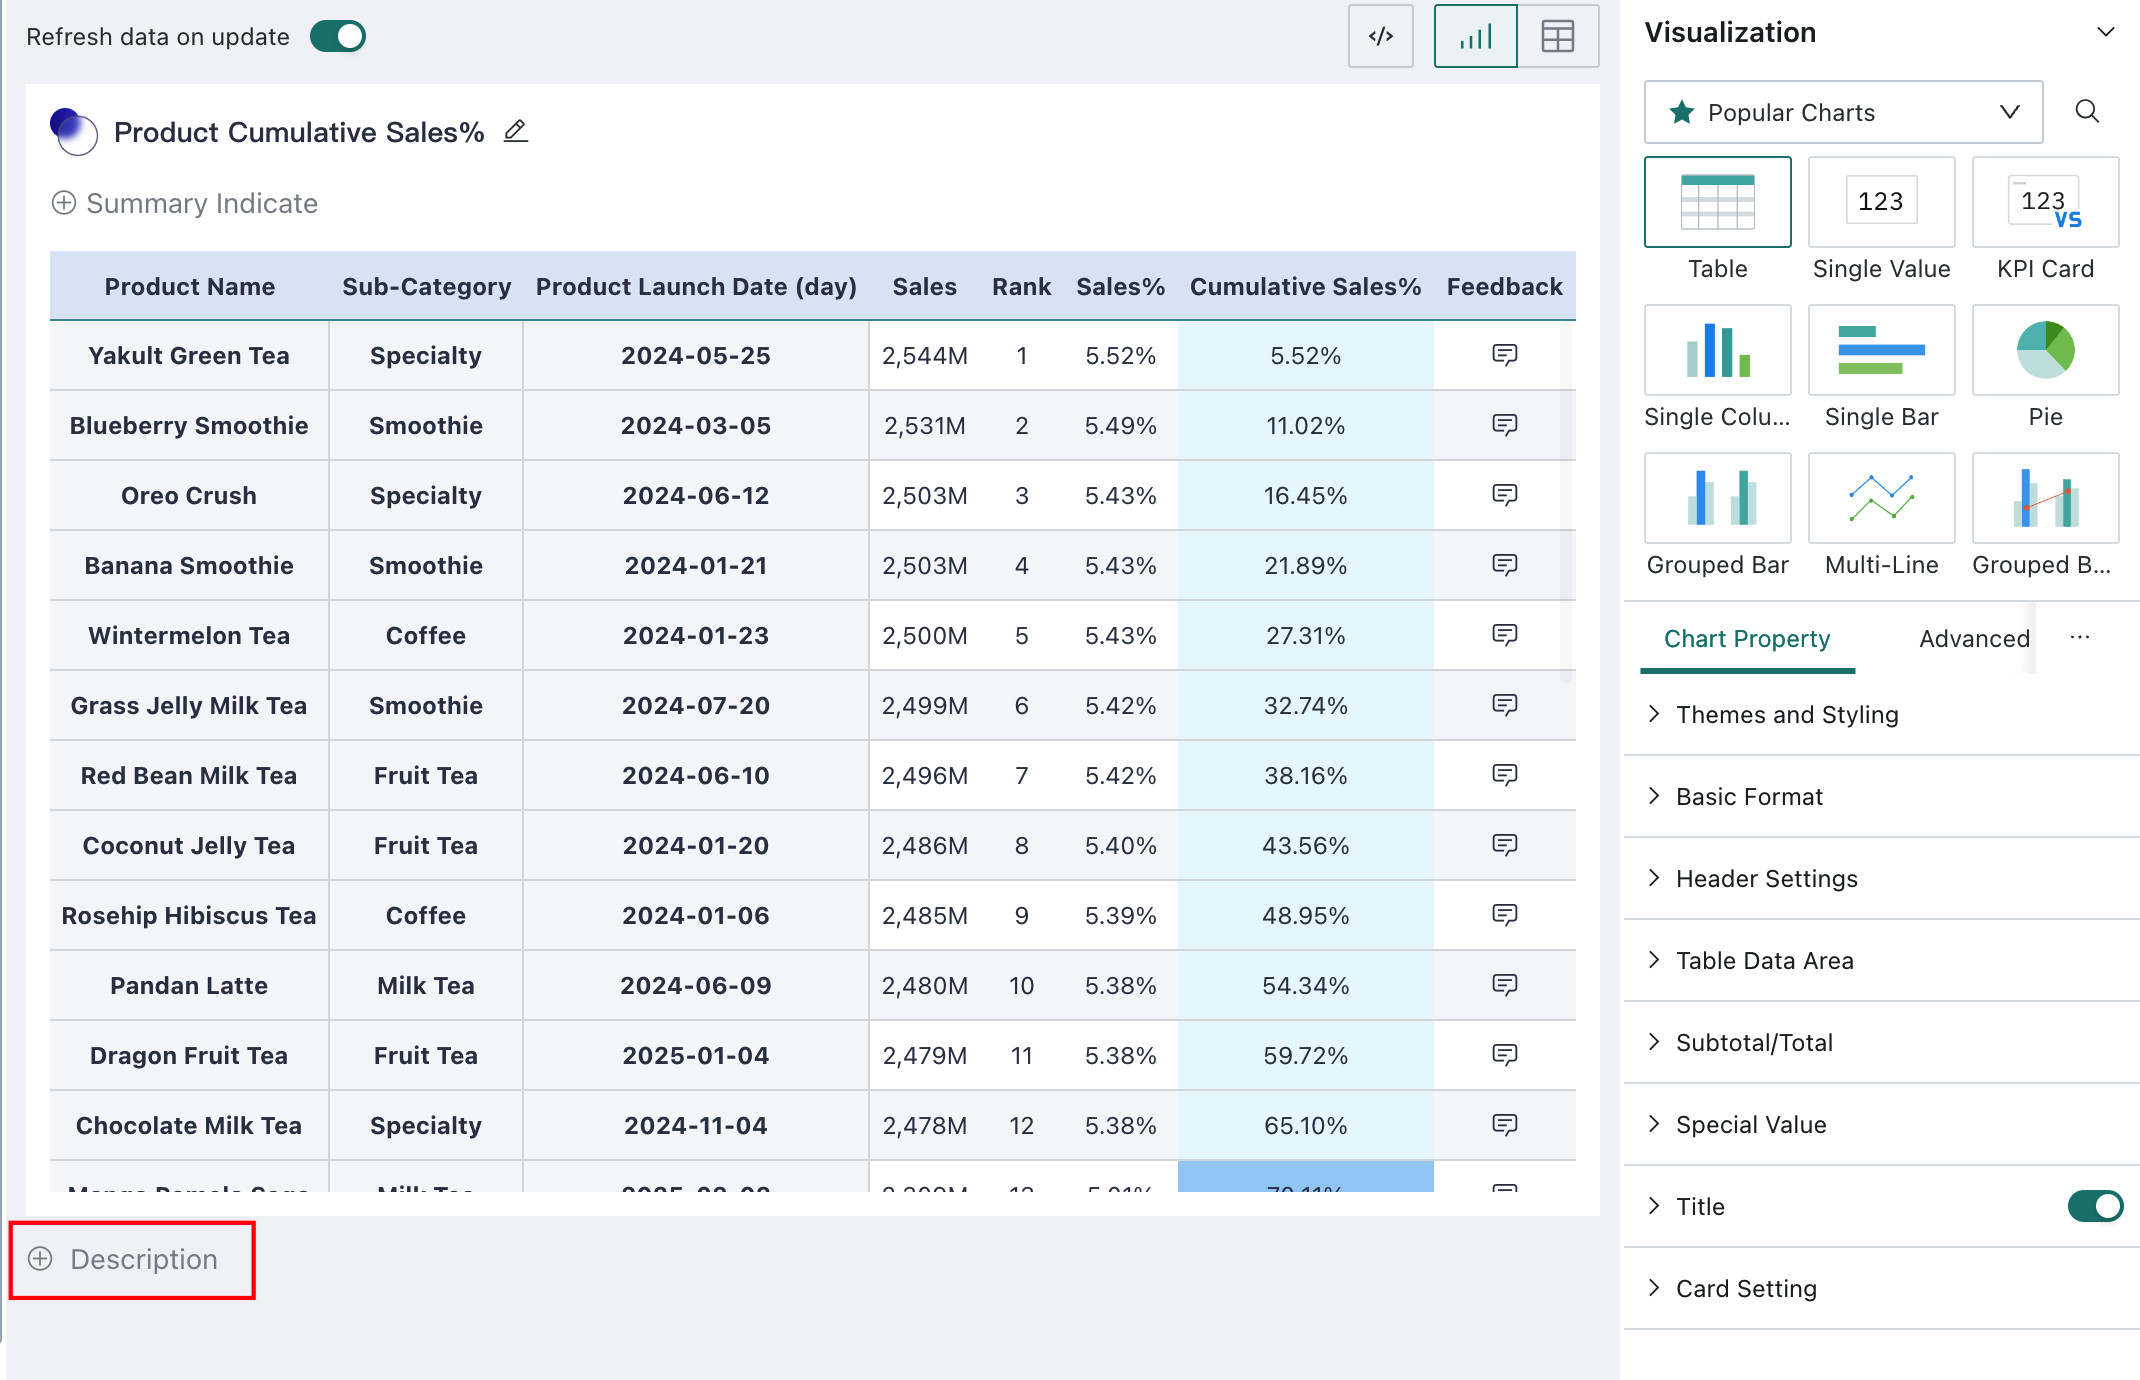
Chart Description
For charts with complex logic, you can add a description to explain the analytical purpose, calculation logic, or any other information that should be documented for later maintenance.
On the visualization editing page, you can add a description below the chart. Click + Description and enter the description text in the text box.
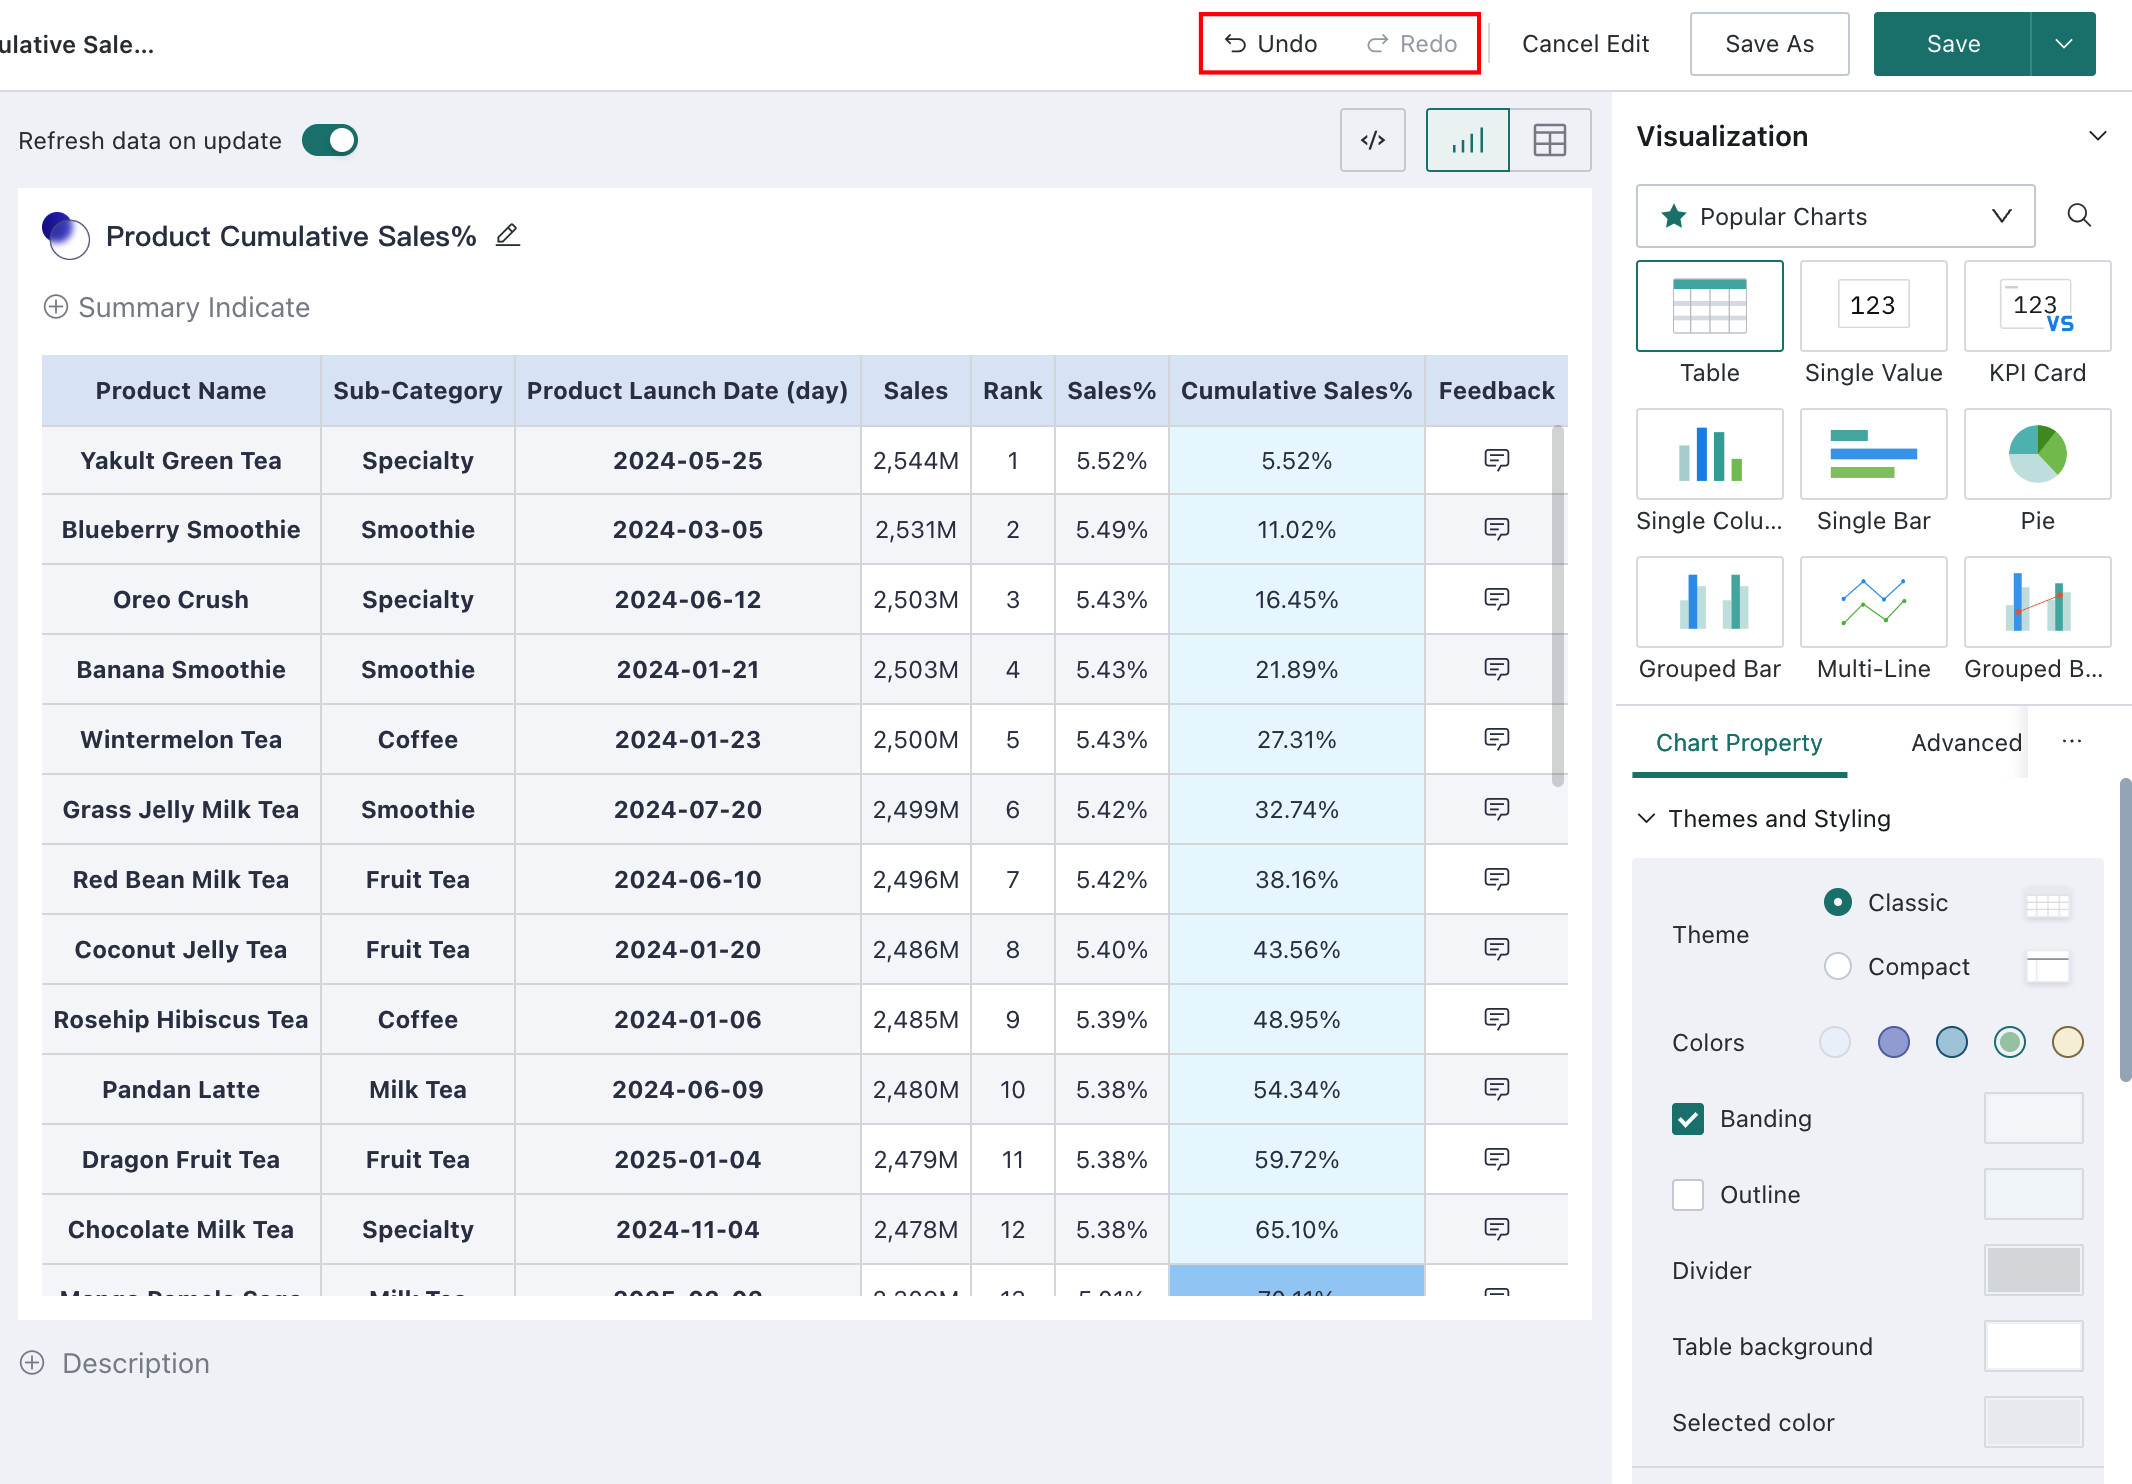
Save and Modify
Undo / Redo
When editing a chart, mistakes are inevitable. Guandata BI supports undo and redo operations to help you quickly restore the chart to a previous correct state.
Save Settings
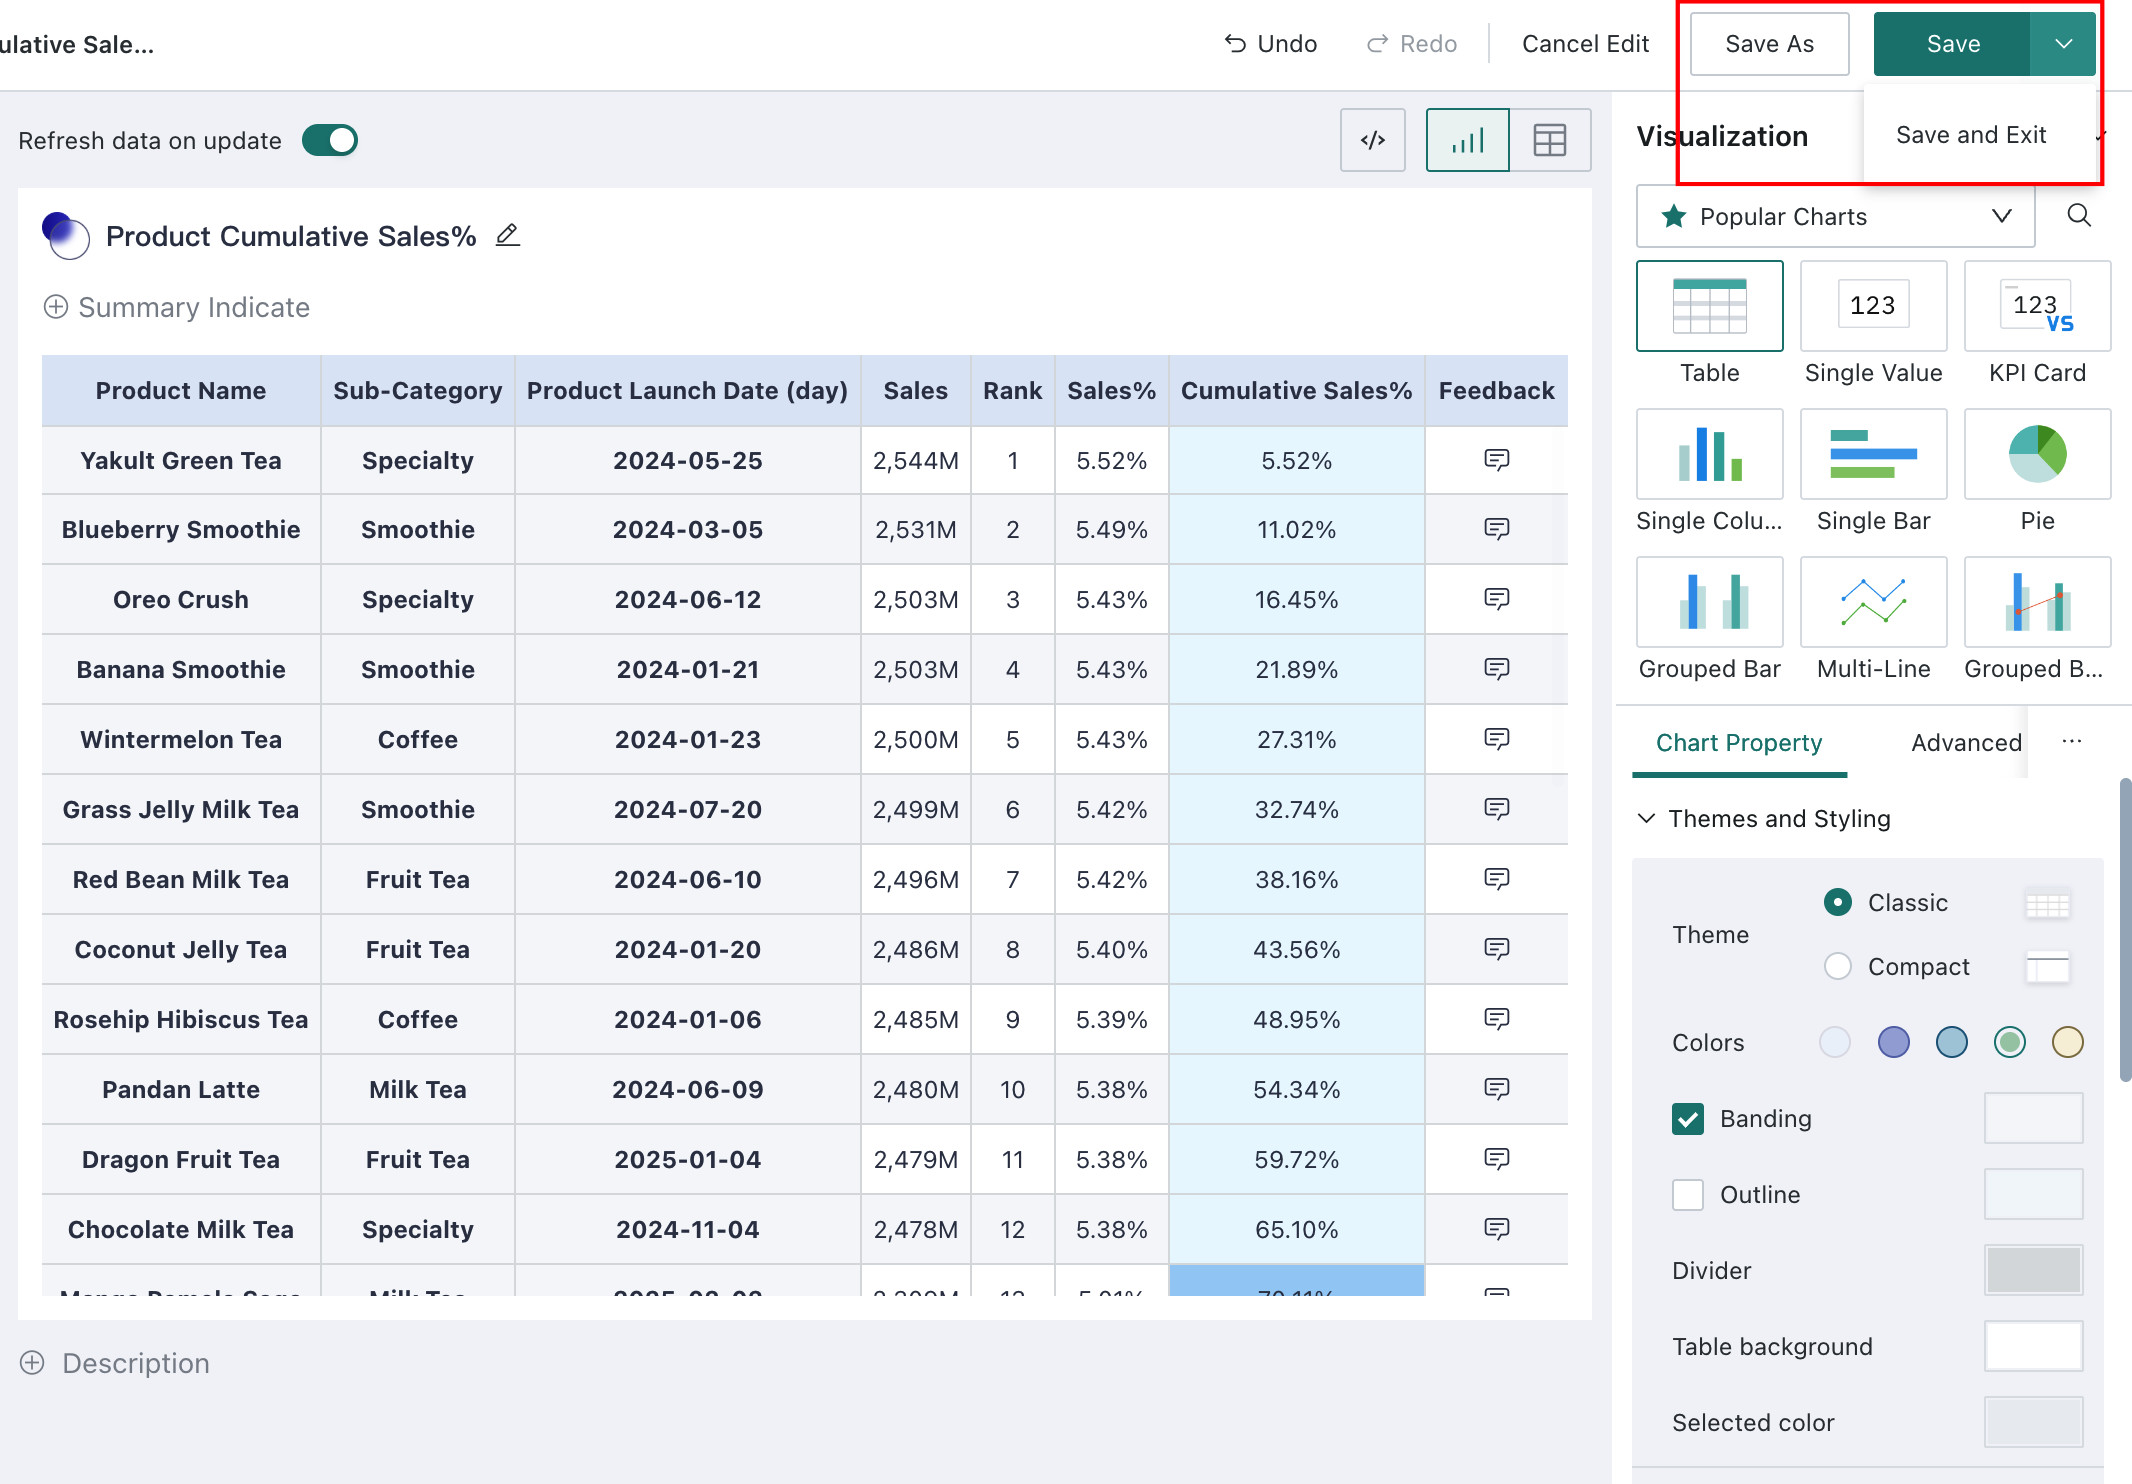
After finishing chart creation, you can save the current configuration.
On the card editing page, you can click Save or Save As to save the current card directly, or open the drop-down menu of the Save button and choose Save and Exit.