Create Derived Metrics
Concept
Derived metrics extend a single metric. They normally use an atomic or composite metric; period comparisons can also use metrics derived by Recent N Days, Cumulative Calculation, or Combined Derivation. For example, derive Net Profit YoY from Net Profit.
Quick Create Derived Metrics
Quick creation supports batch configuration of derived metrics based on multiple upstream metrics, reducing repeated operations. The currently supported upstream metric types and derivation type combinations are as follows:
| Upstream Metric Type | Supported Derivation Types |
|---|---|
| Atomic Metric | Cumulative Calculation, End Value |
| Derived Metric | YoY/MoM |
-
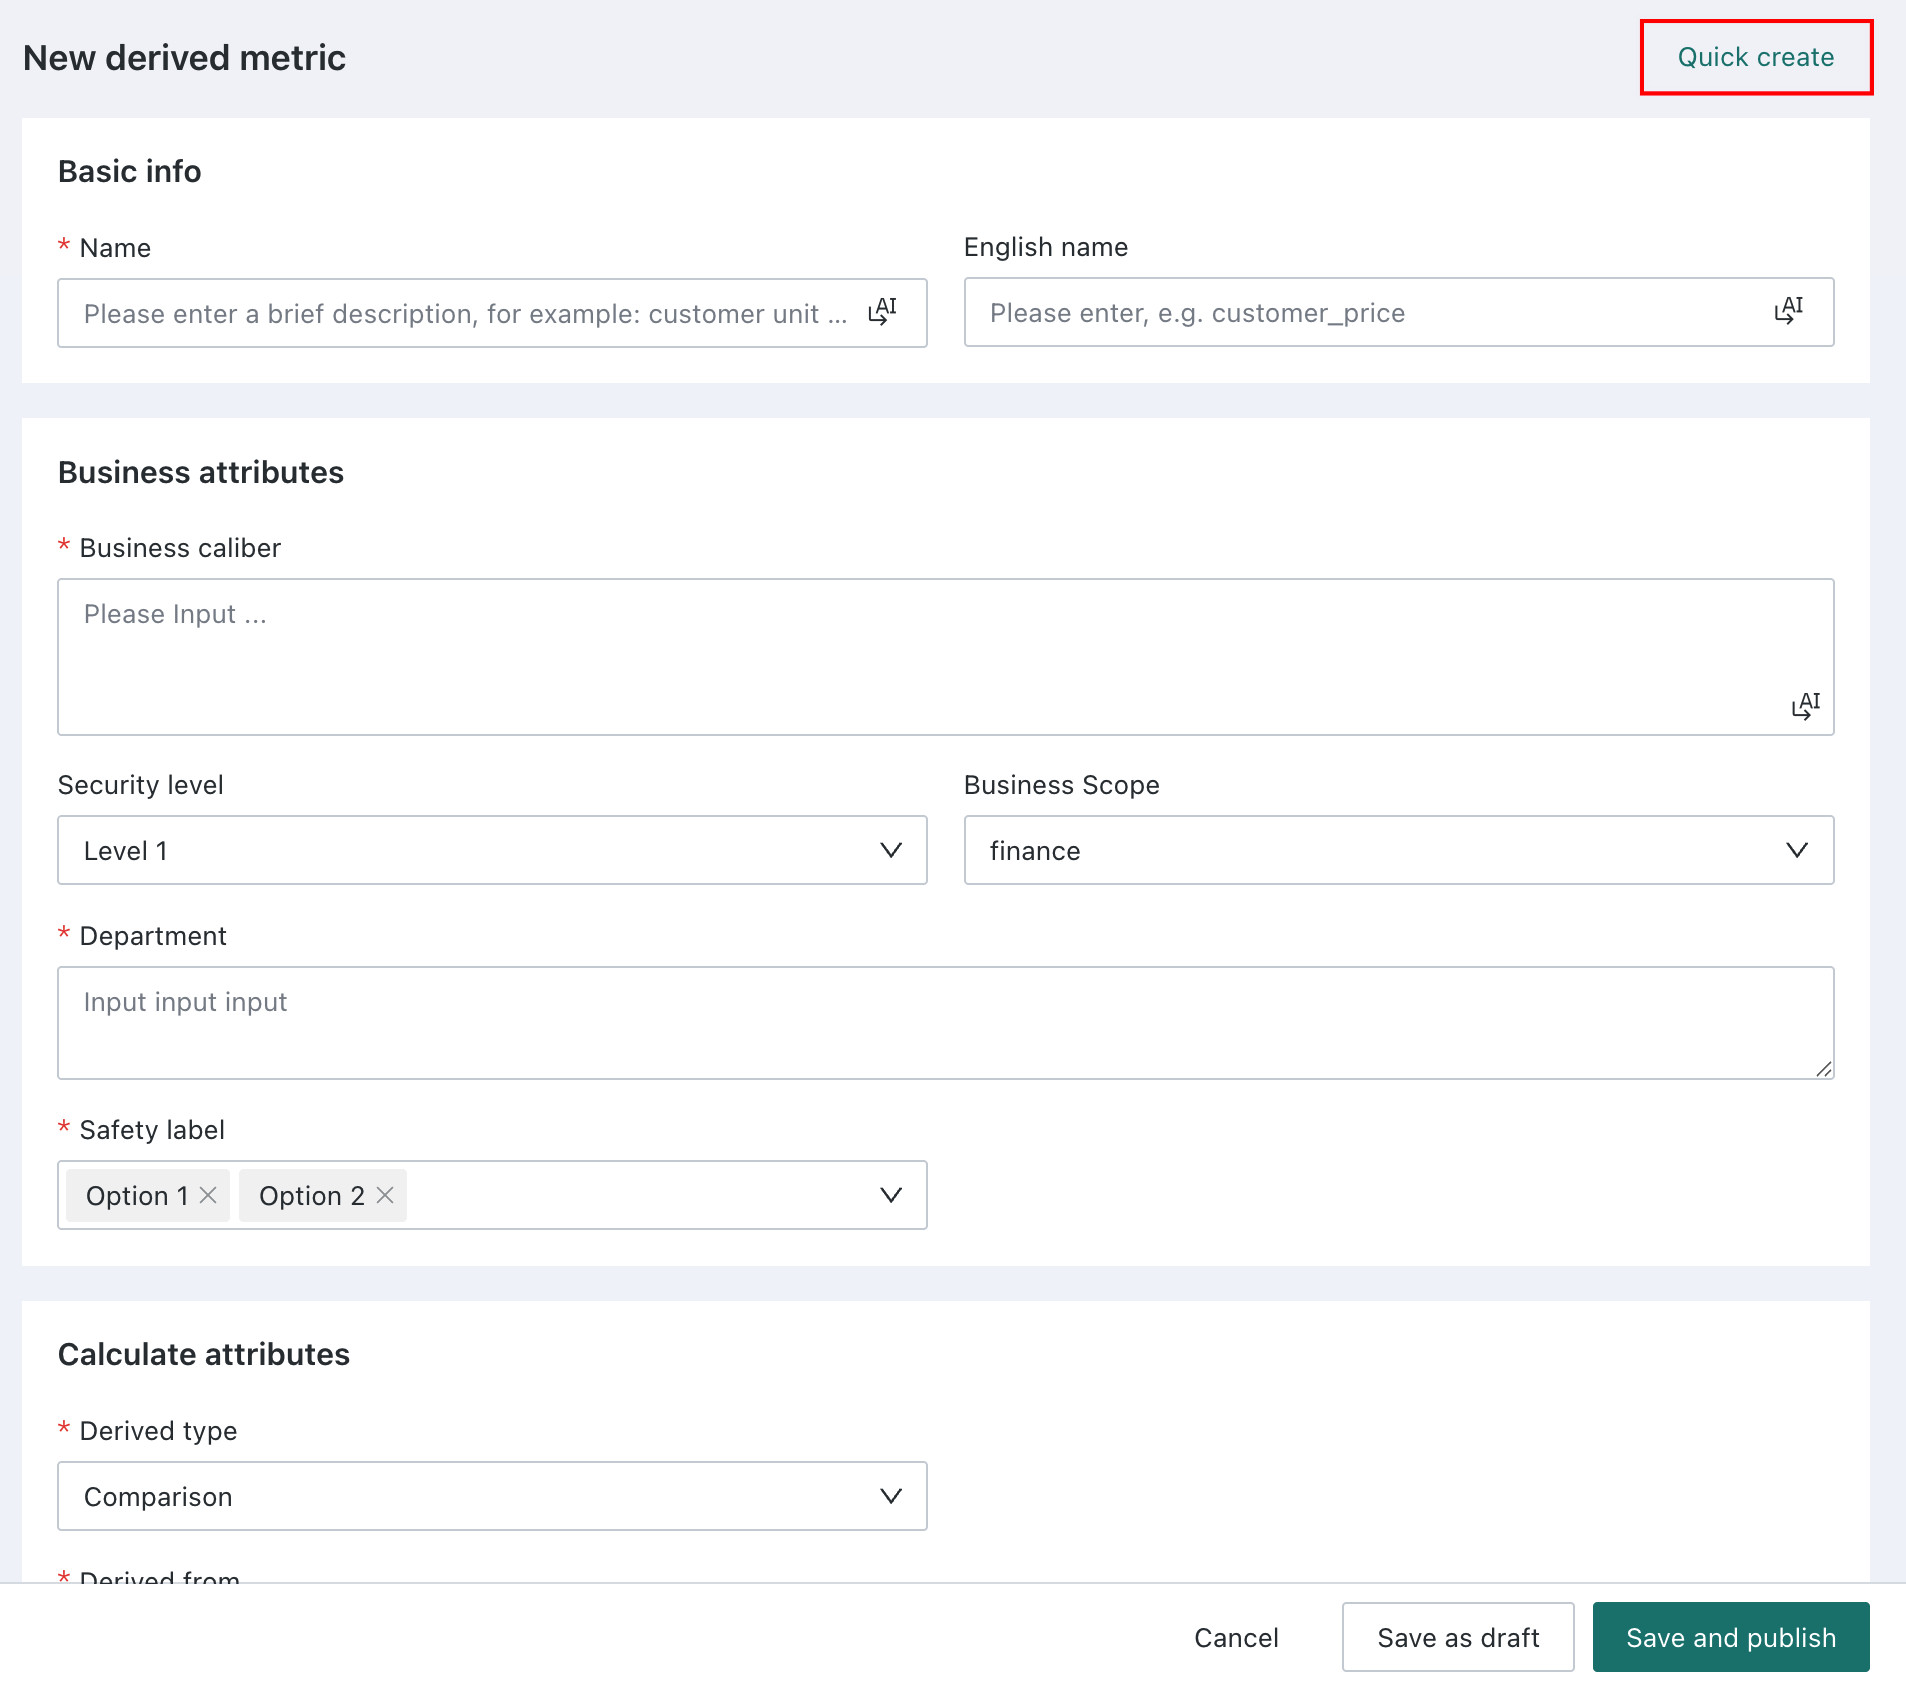
Go to Metric Center > Metric Management, select a topic, click Add Metric, and select Derived metric. On the creation page, click Quick Create in the upper-right corner.
-
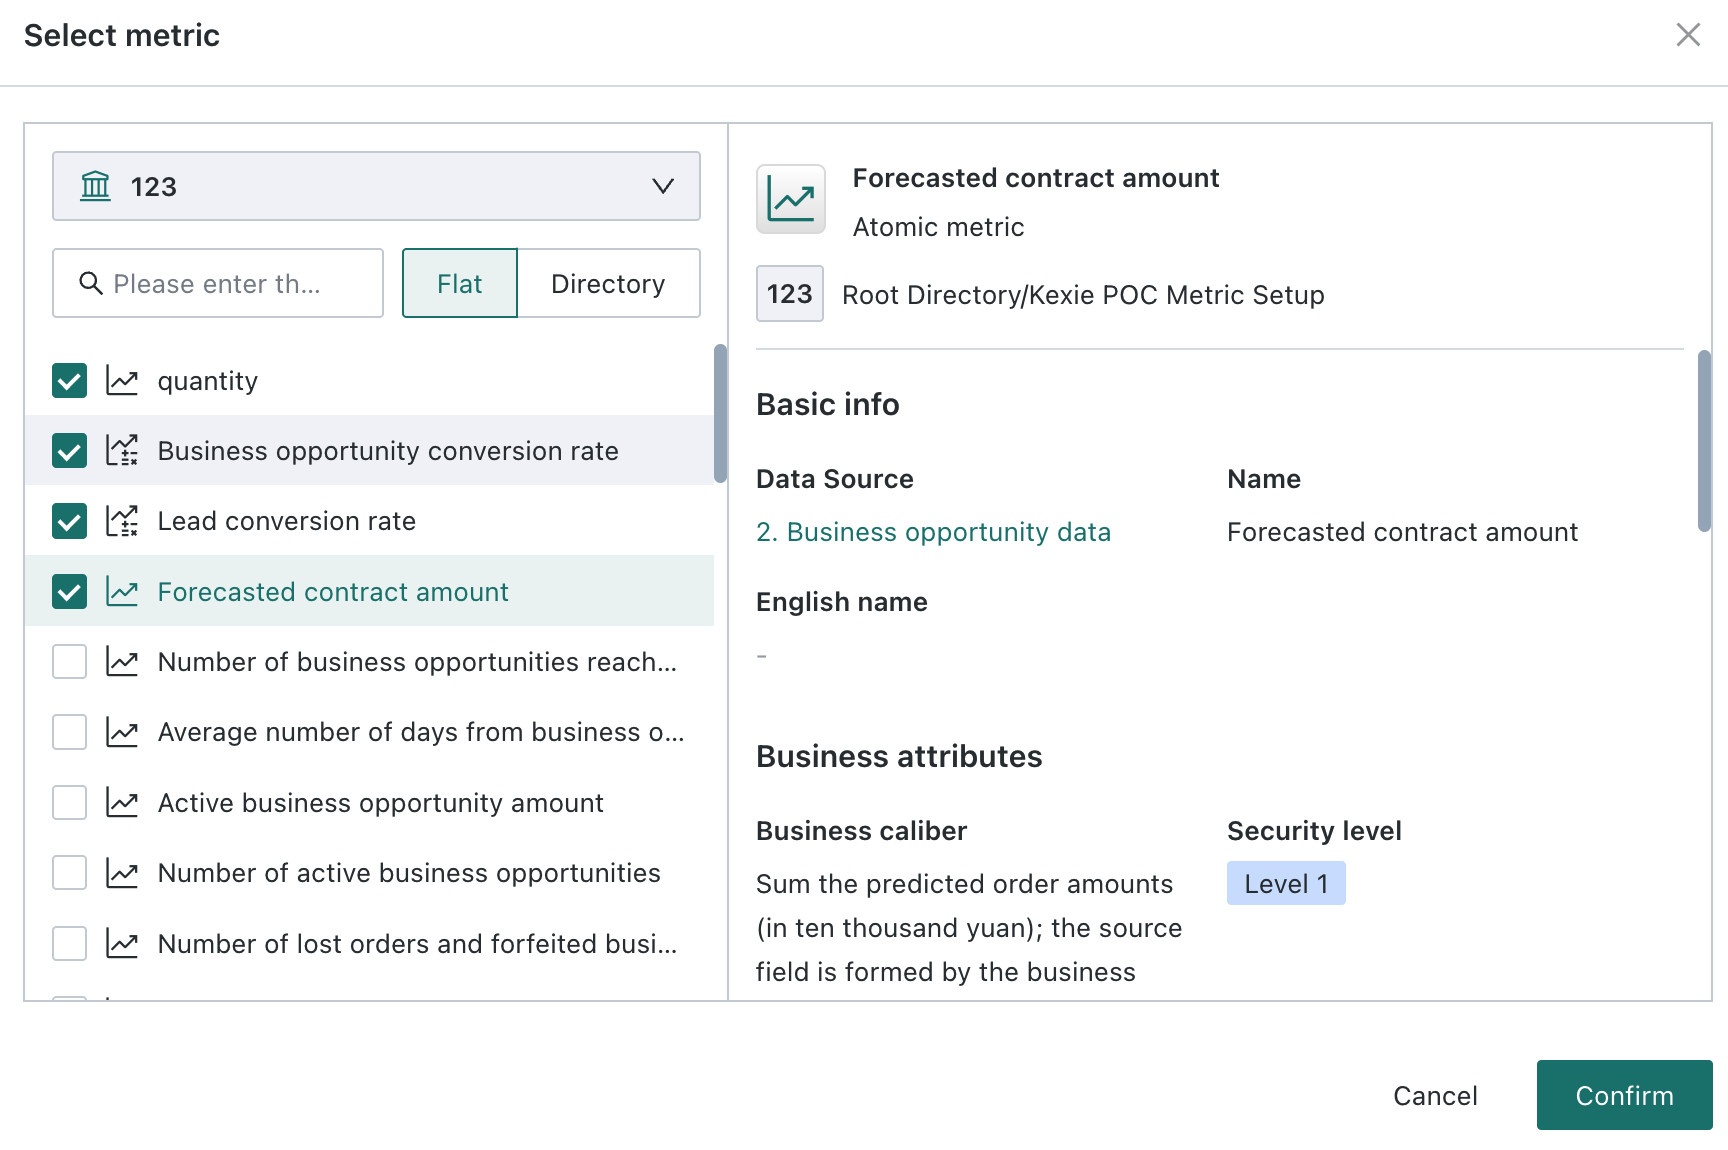
In the Select Metrics dialog, select one or more upstream metrics, then click OK to open batch configuration.
-
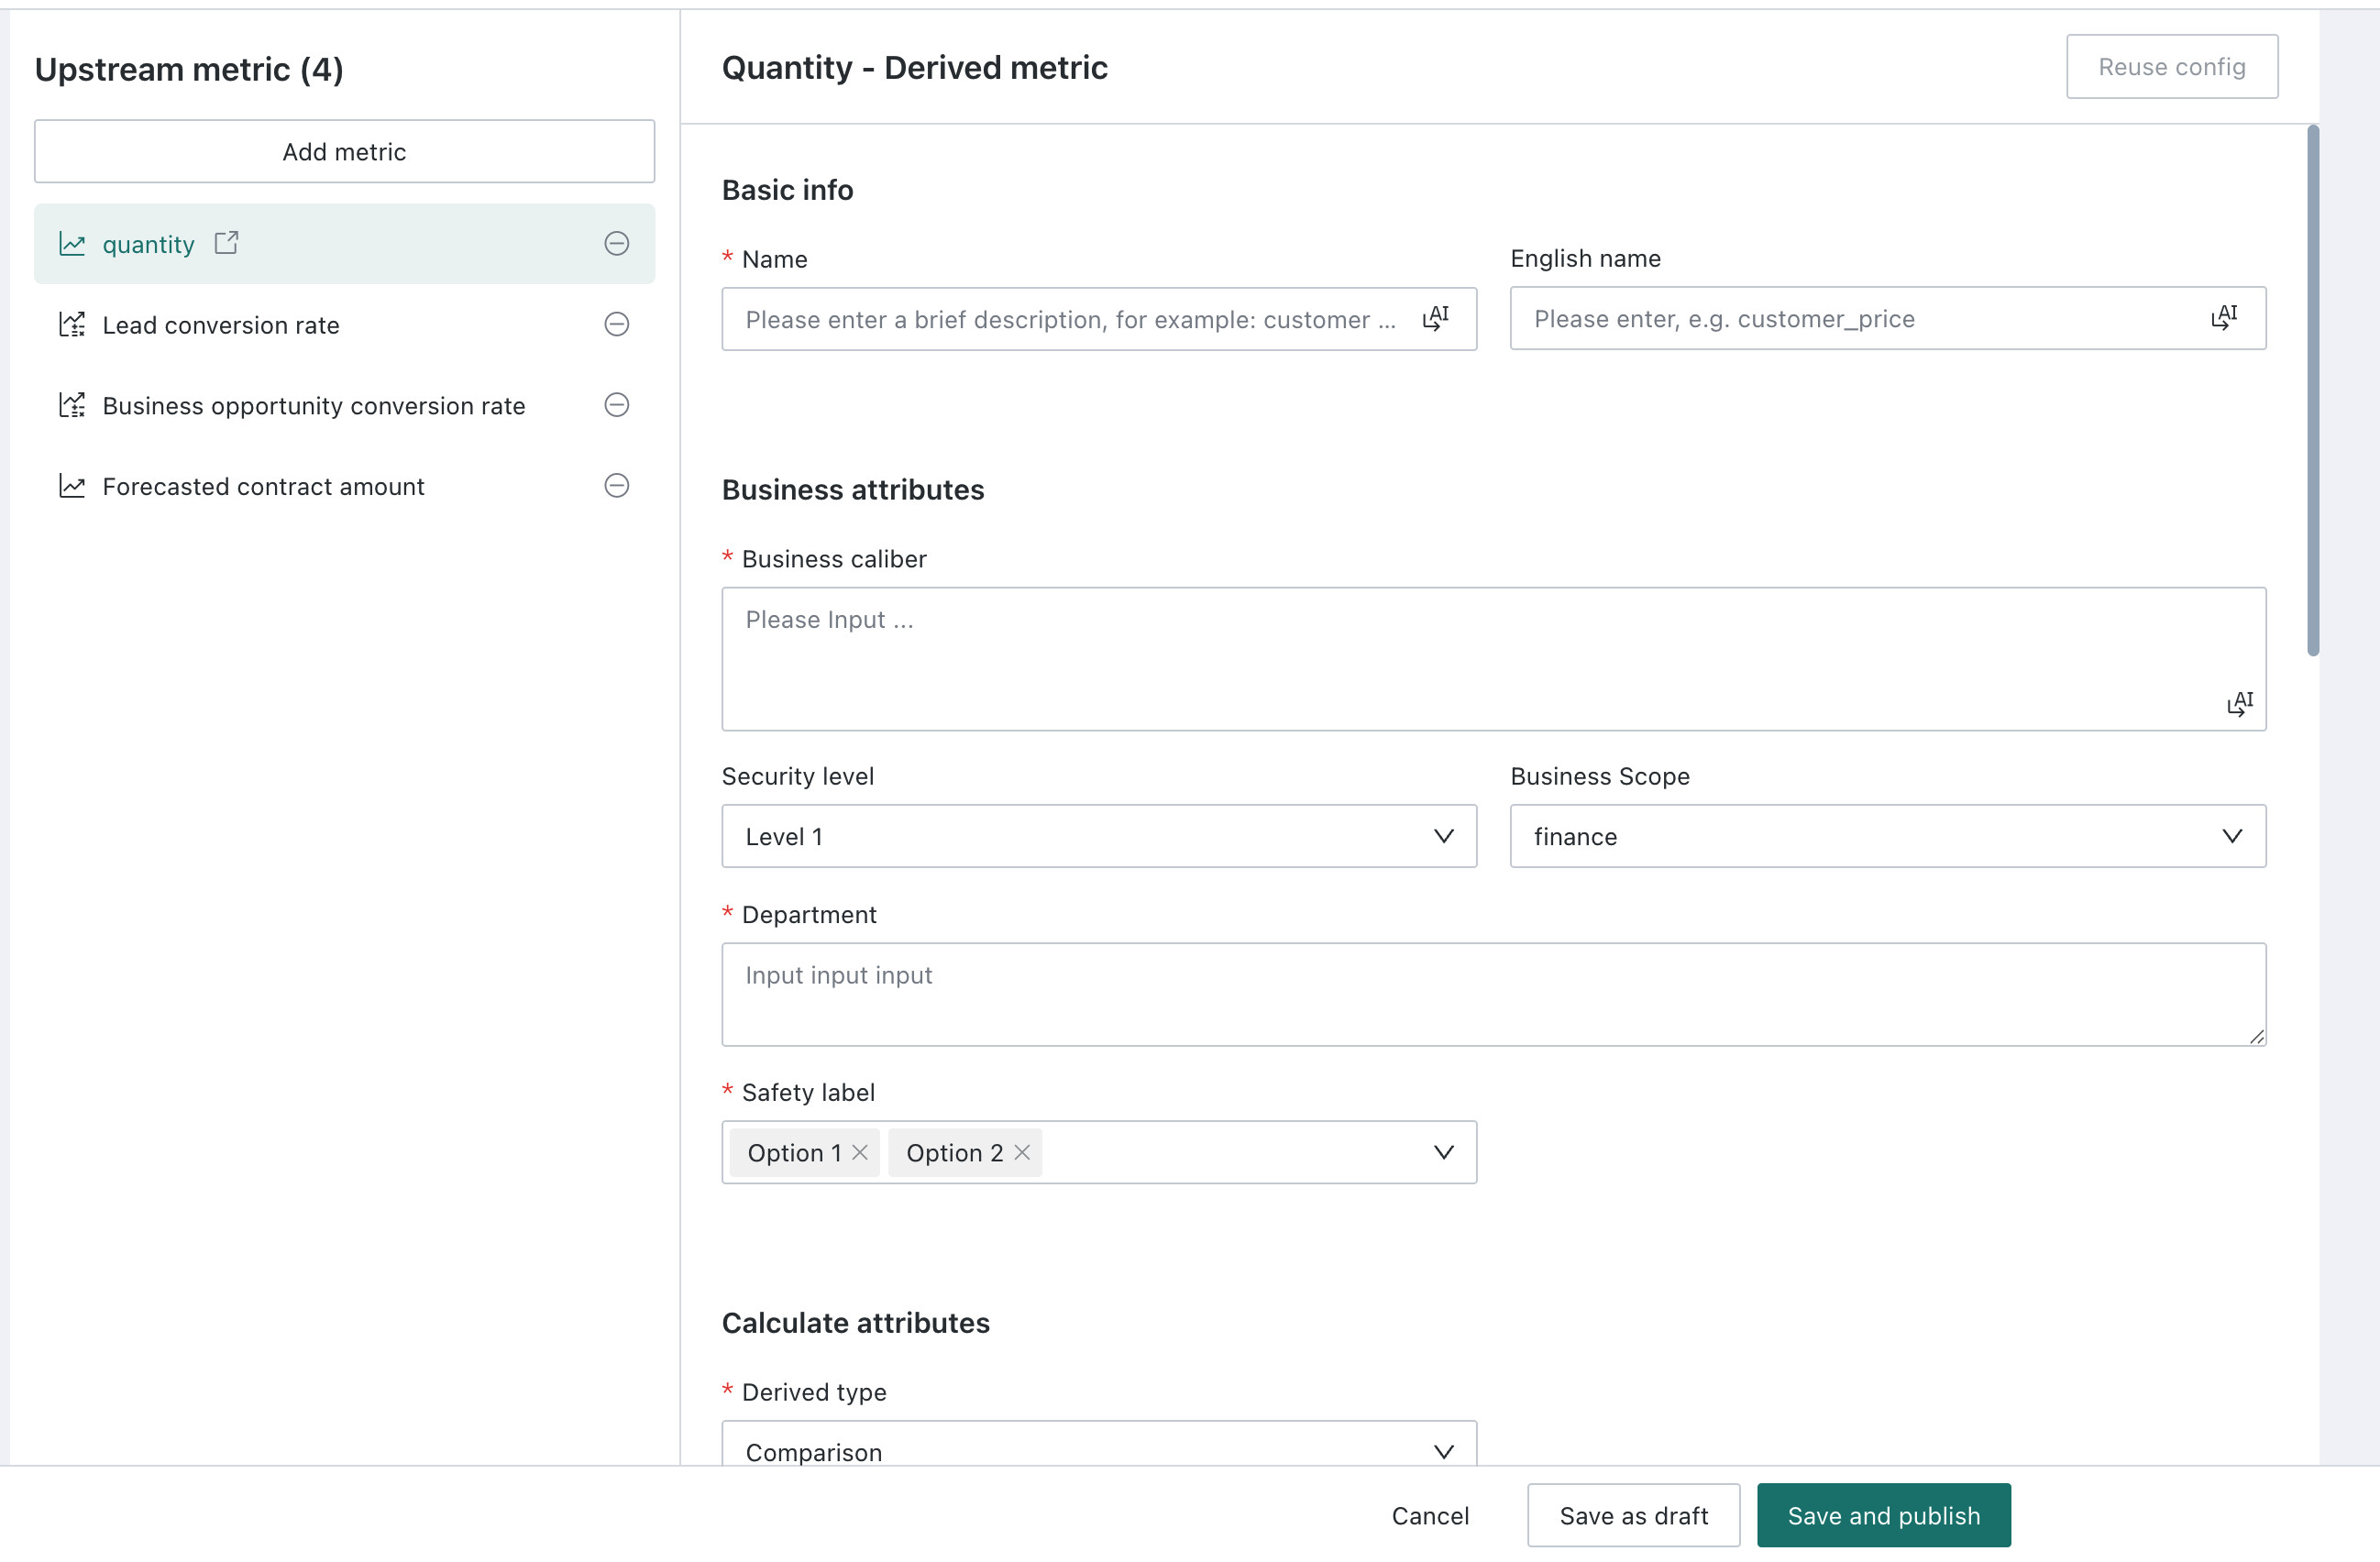
After entering the configuration page, the left side shows the selected upstream metric list. Clicking different metrics can switch the configuration details in the right panel; the right panel supports configuring parameters such as derivation type, time granularity, and calculation range.
After completing the current metric configuration, click Reuse Configuration in the upper right corner to apply the current configuration (except for business qualifications and business calibers) to all other metrics in batch.
-
After all metric configurations are completed, click Save and Go Live to launch the metrics.
Create a Derived Metric
- Go to Metric Center > Metric Management, select a topic, click Add Metric, and select Derived metric.
- Configure Basic info, Business attributes, Calculate attributes, and Management config.
Configure Basic Info
See Configure Basic Info for the settings shared with atomic metrics.
Configure Business Attributes
See Configure Business Attributes for the settings shared with atomic metrics.
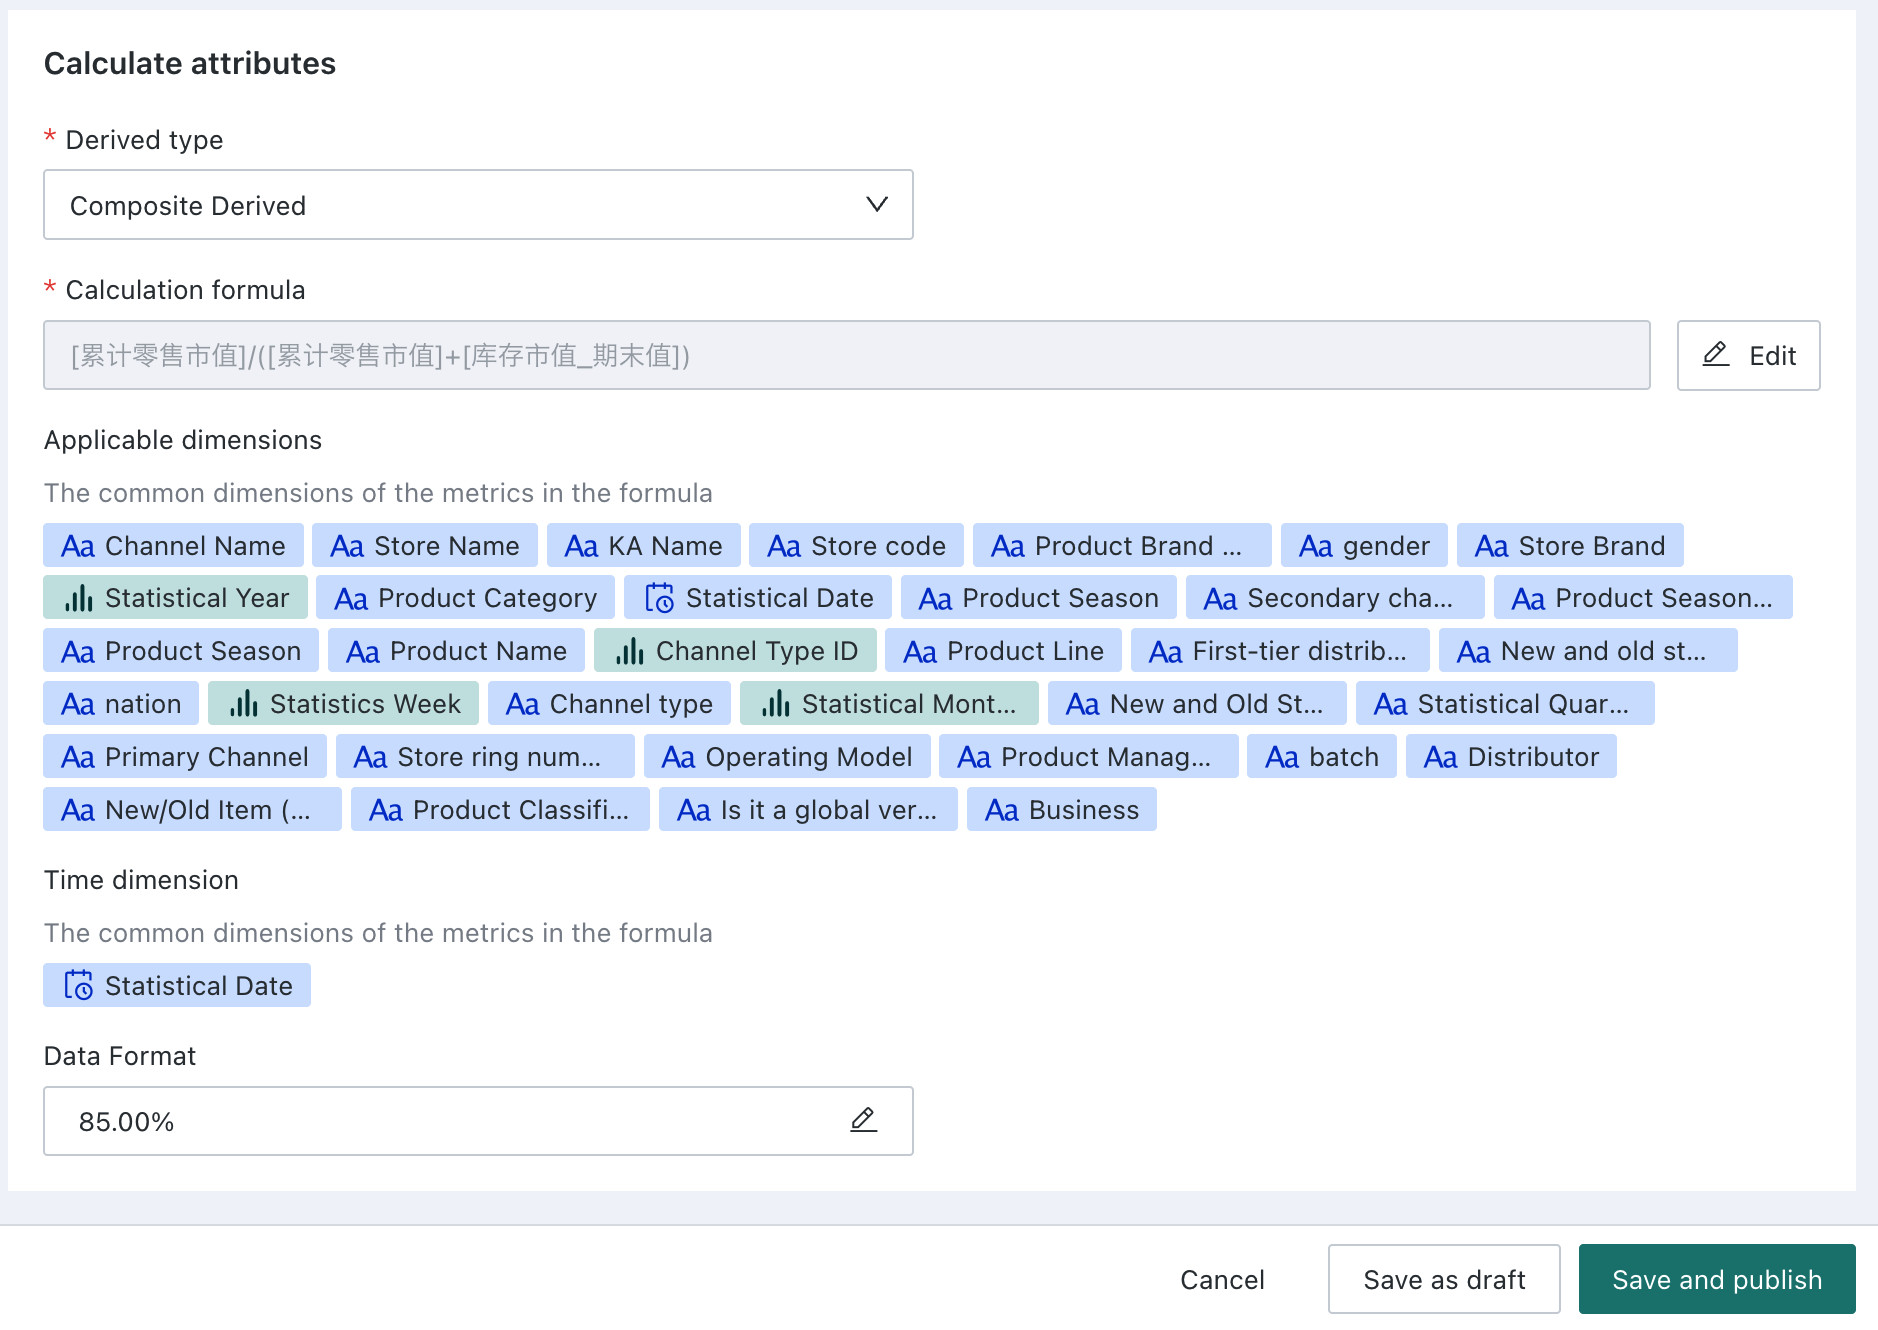
Configure Calculation Attributes
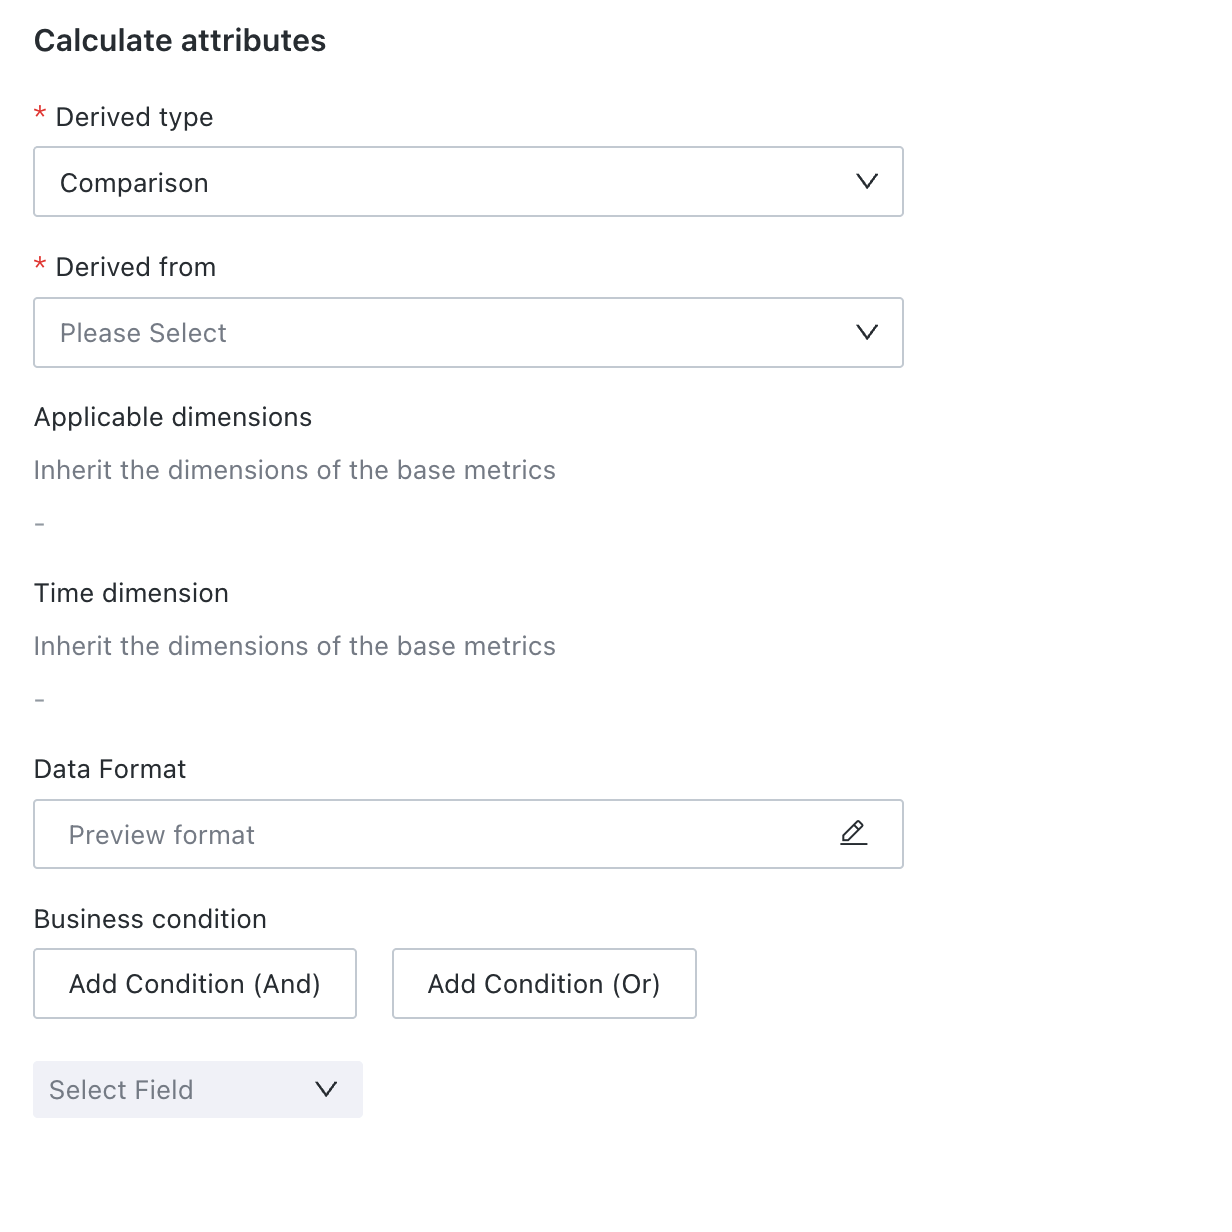
| Parameter | Description |
|---|---|
| Derived type | Select a calculation type: Comparison (YoY/MoM), recent periods, cumulative calculation, end value, or combined derivation. See YoY/MoM Metrics, Recent Period Metrics, Cumulative Calculation Metrics, End Value Metrics, and Combined Derived Metrics. |
| Derived from | Select a metric you have permission to use. For Comparison, you can also use metrics derived by Recent N Days, Cumulative Calculation, or Combined Derivation. Other types support only atomic or composite metrics. |
| Applicable dimensions | Inherited from the source metric and cannot be changed. Use them for dimensional analysis. |
| Time dimension | Inherited from the source metric and cannot be changed. For period comparisons, it determines the date field used in the calculation. |
| Data Format | Click the edit icon to set and preview the result format. |
| Business condition | Add filters to restrict the data included in the calculation. Use Add Condition (And) or Add Condition (Or) to combine conditions. |
Configure Management Properties
See Configure Management Properties.
Save the Metric
See Save the Metric for the save options shared with atomic metrics.
YoY/MoM Metrics
YoY/MoM metrics are two commonly used comparative analysis methods in data analysis. They help us evaluate changes in data over time series. YoY refers to the ratio of growth or decline compared to the same period last year. It is used to measure trends in data over time, especially in annual reports. MoM refers to the ratio of growth or decline compared to the previous period (such as last month, last quarter). MoM is usually used for short-term data comparison to help us understand recent changes in data.
When the Derived type is set to Comparison in the calculation properties, the following content needs to be configured:
| Parameter | Description |
|---|---|
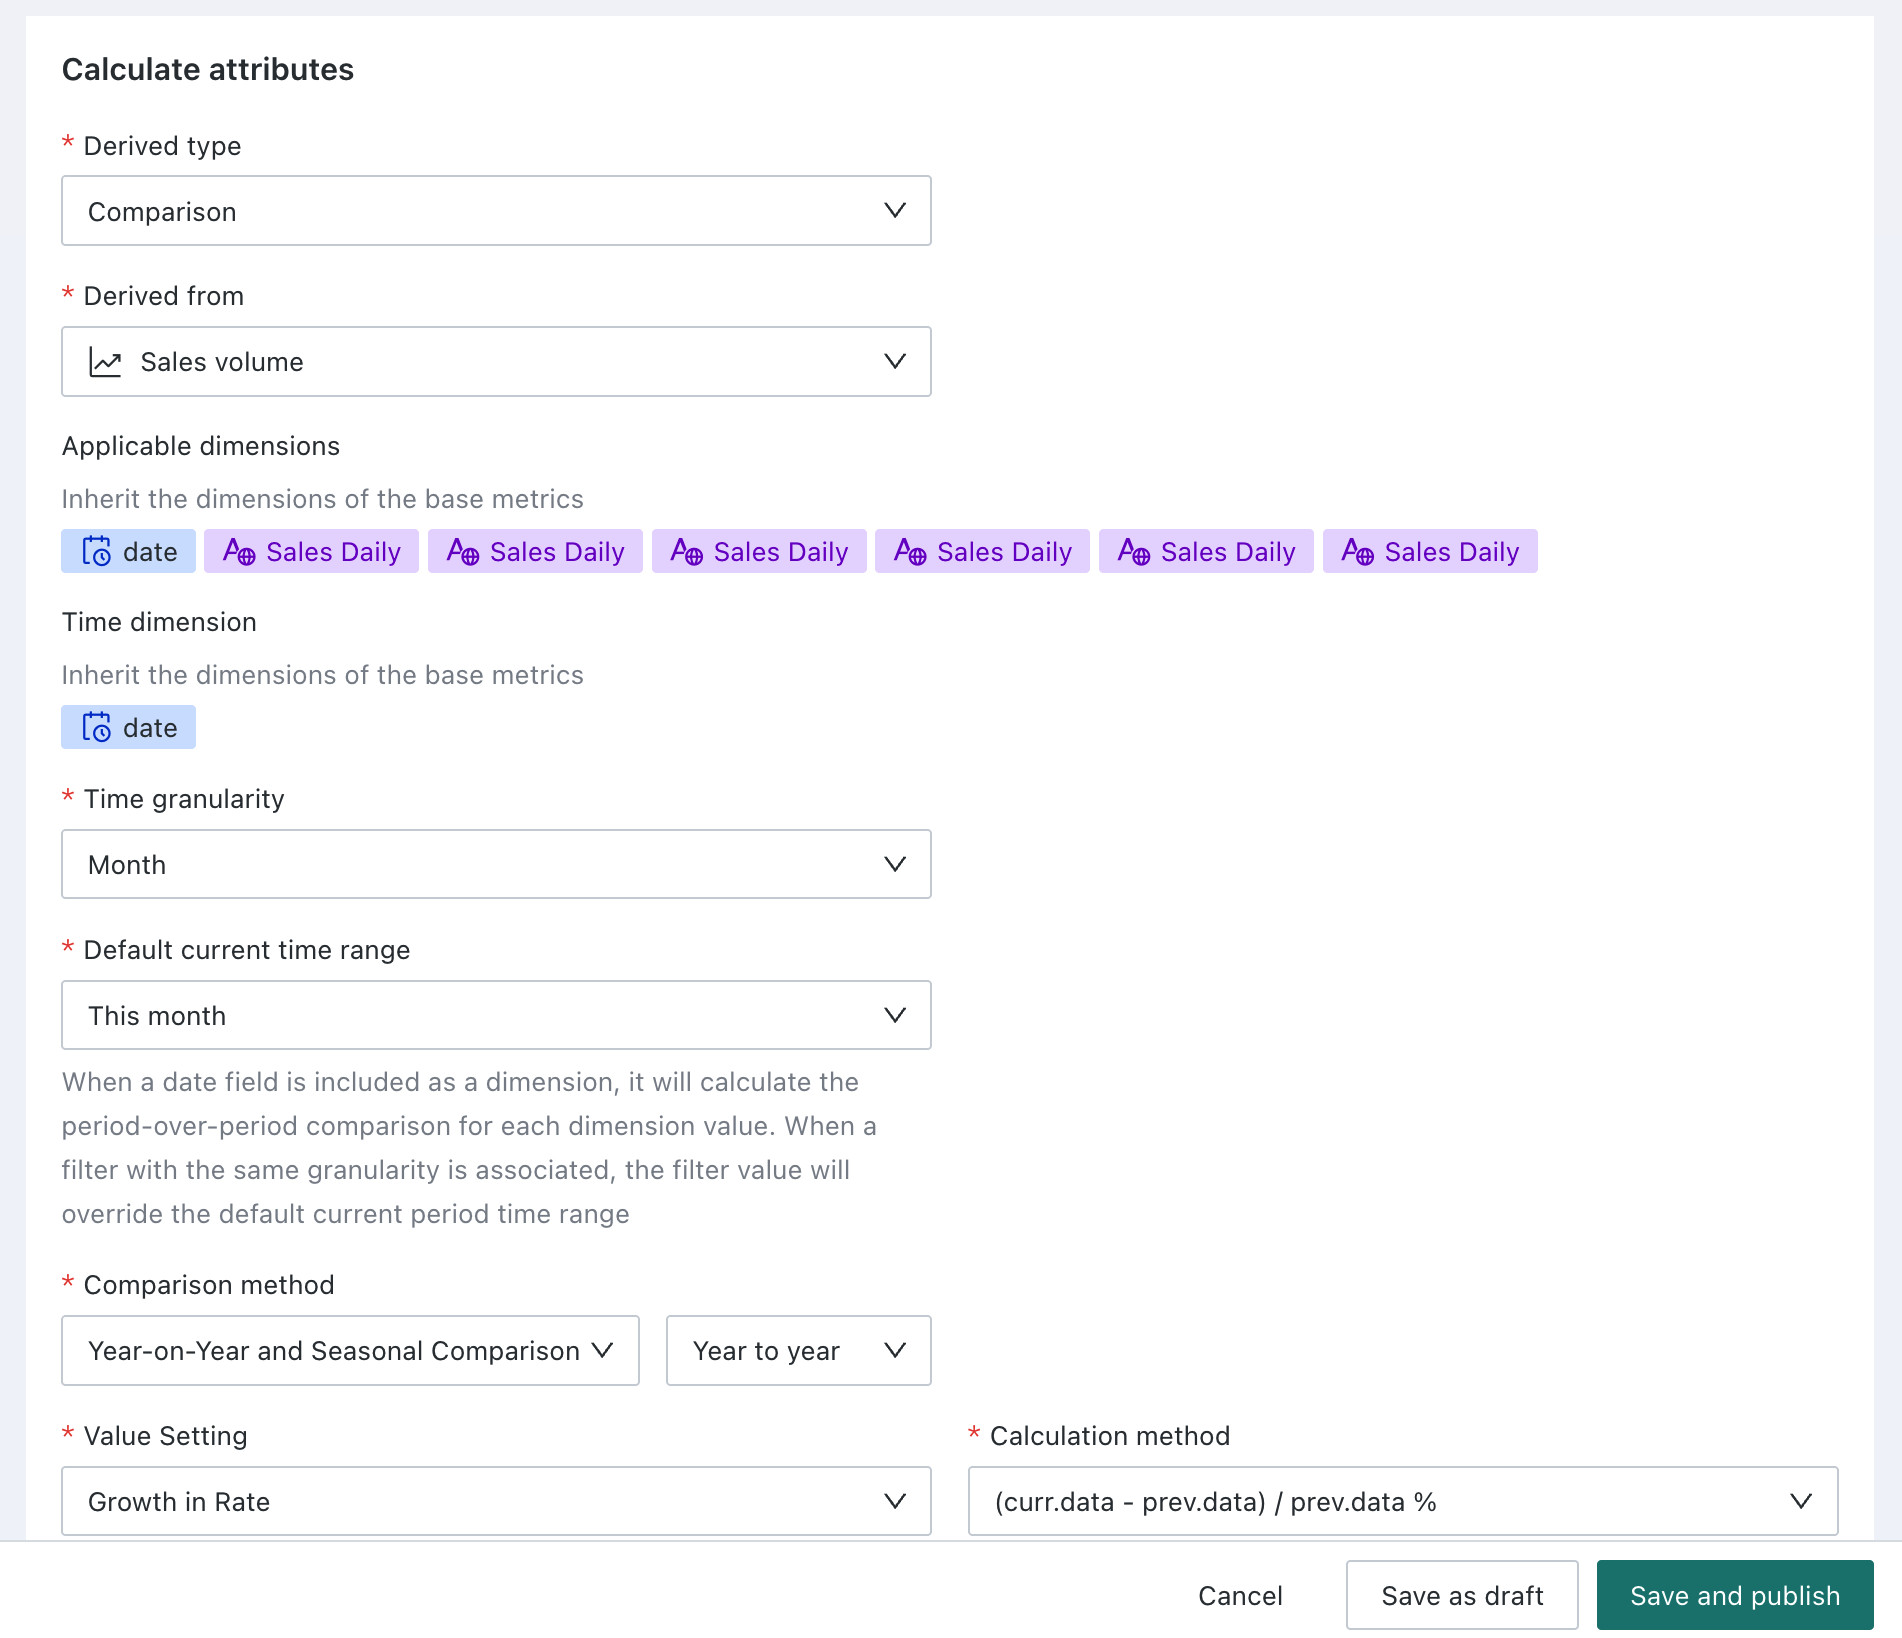
| Time Granularity | Supports calculating YoY/MoM under different time granularities: Year, Quarter, Month, Week, Day |
| Default Current Period Time Range | Refers to the data corresponding to the current period or time. For YoY/MoM by day granularity, provides richer configuration:
|
| Comparison Method | According to the configuration of time granularity and time range, supports different comparison types. The YoY/MoM calculations supported by different time granularities are shown in the table below:
|
| Previous Period Time Range | Refers to the data corresponding to the previous cycle or time. When the comparison method is a custom time range, you can specify a date or an interval. |
| Value Setting | Guandata provides three calculation types: Growth Value, Growth Rate, and Comparison Value. The detailed descriptions of the three calculation types are as follows:
|
YoY/MoM calculations supported by different time granularities:
| Time Granularity | Supported YoY/MoM Calculations |
|---|---|
| Year Granularity | Year MoM, Custom Offset |
| Quarter Granularity | Quarter MoM, Year YoY, End Value - End of Previous Year, Custom Offset |
| Month Granularity | Month MoM, Year YoY, End Value - End of Previous Quarter, End Value - End of Previous Year, Custom Offset |
| Week Granularity | Week MoM, Year YoY, Custom Offset |
| Day Granularity and Hour/Minute/Second | Day MoM, Week YoY, Month YoY, Quarter YoY, Year YoY, Custom Offset End Value - End of Previous Month, End Value - End of Previous Quarter, End Value - End of Previous Year, Custom Offset |
Specify Time Range YoY/MoM Derived Metrics
Users want to analyze metrics with text fields as dimensions, such as viewing the YoY growth of a metric for the current month of this year by the large region dimension. You can specify the time range of the current period data in the default current period time range configuration item.
Since the YoY/MoM calculation is a calculation over a time range, the current period time here is equivalent to adding a filter to the current YoY/MoM reference time field. Taking month granularity as an example, if "This Month" is selected here, it means the current period data is the data for the current month.
Dynamically Determine Time Range YoY/MoM Derived Metrics Based on Dimension Values
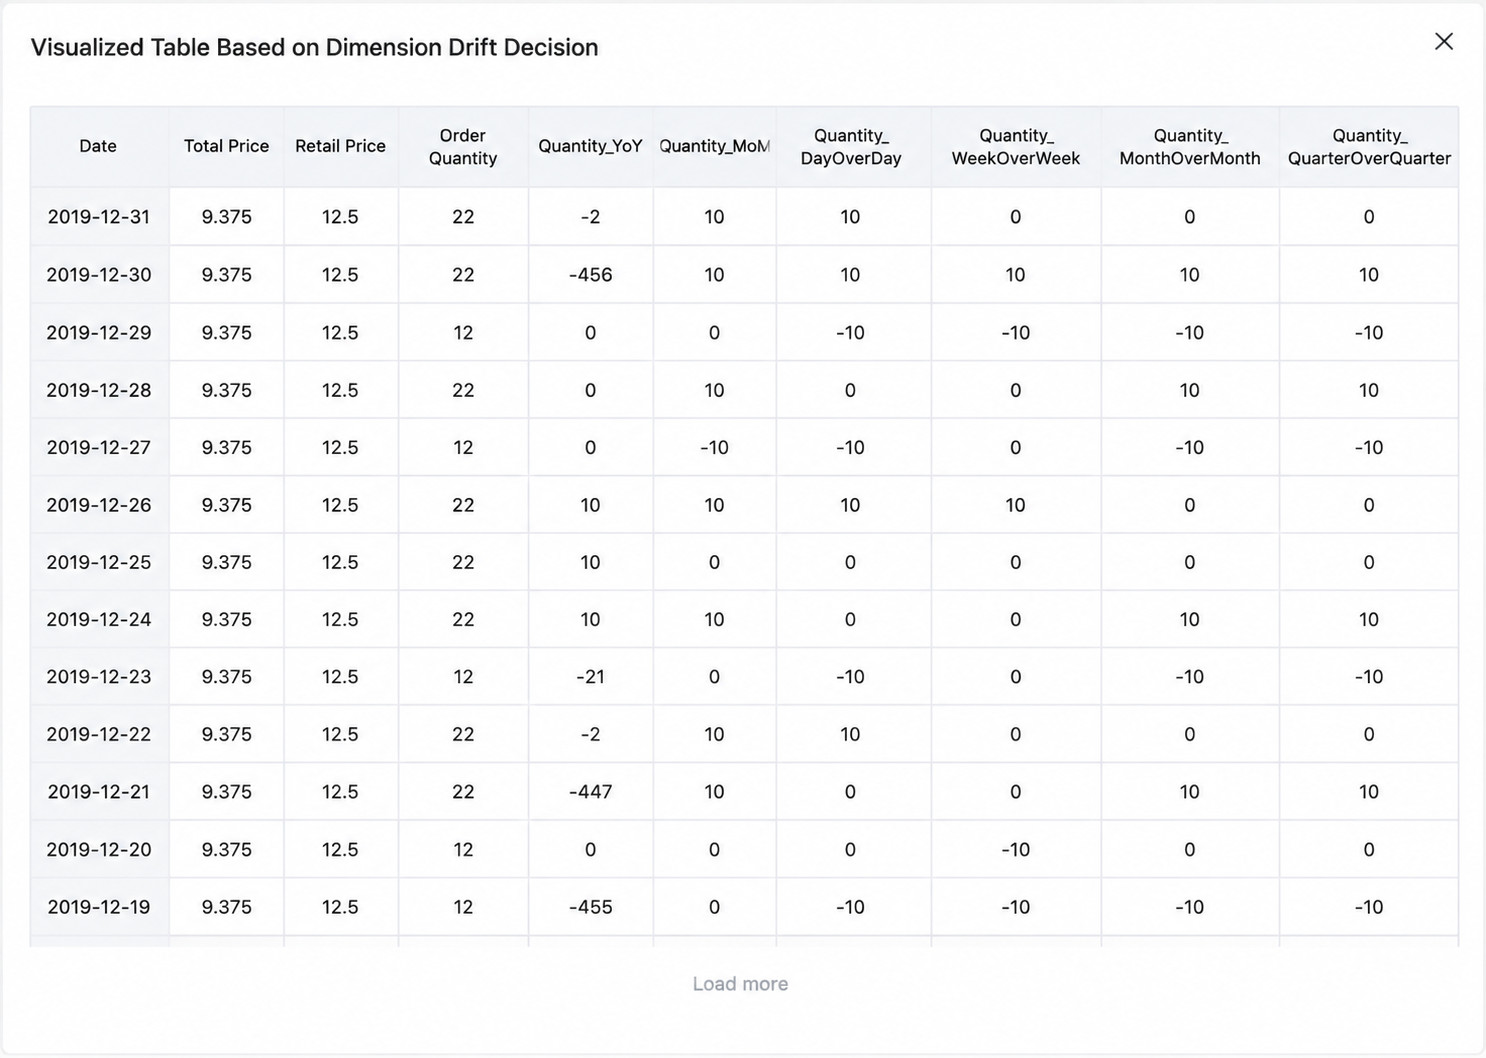
When users want to use time dimensions as the analysis dimension of metrics and dynamically calculate the values of derived metrics at different time points, they can drag the time dimension into the analysis dimension in the metric analysis card.
- The current period time range is determined by the corresponding time dimension value, which will overwrite the default value configured in the metric.
- The previous period time range is offset calculated according to the comparison type:
- The current period time range is the dimension value of each row of data, such as [July 10, 2024]
- Previous period time range:
- No configuration needed when selecting YoY/MoM. For example, if the comparison type is Month YoY, the previous period time range is [June 10, 2024]
- Configuration needed when selecting End Value. Specify End of Previous Month / End of Previous Quarter / End of Previous Year. For example, if the comparison type is End Value - End of Previous Month, the previous period time range is [June 30, 2024]
- Configuration needed when selecting Custom Offset. Use the corresponding unit to offset, configure the interval between the current period and the previous period as x days/weeks/months/years. For example, if the interval between the current period and the previous period is 3 days, the previous period time range is [July 7, 2024].
Dynamically Determine Time Range YoY/MoM Derived Metrics Based on Filters
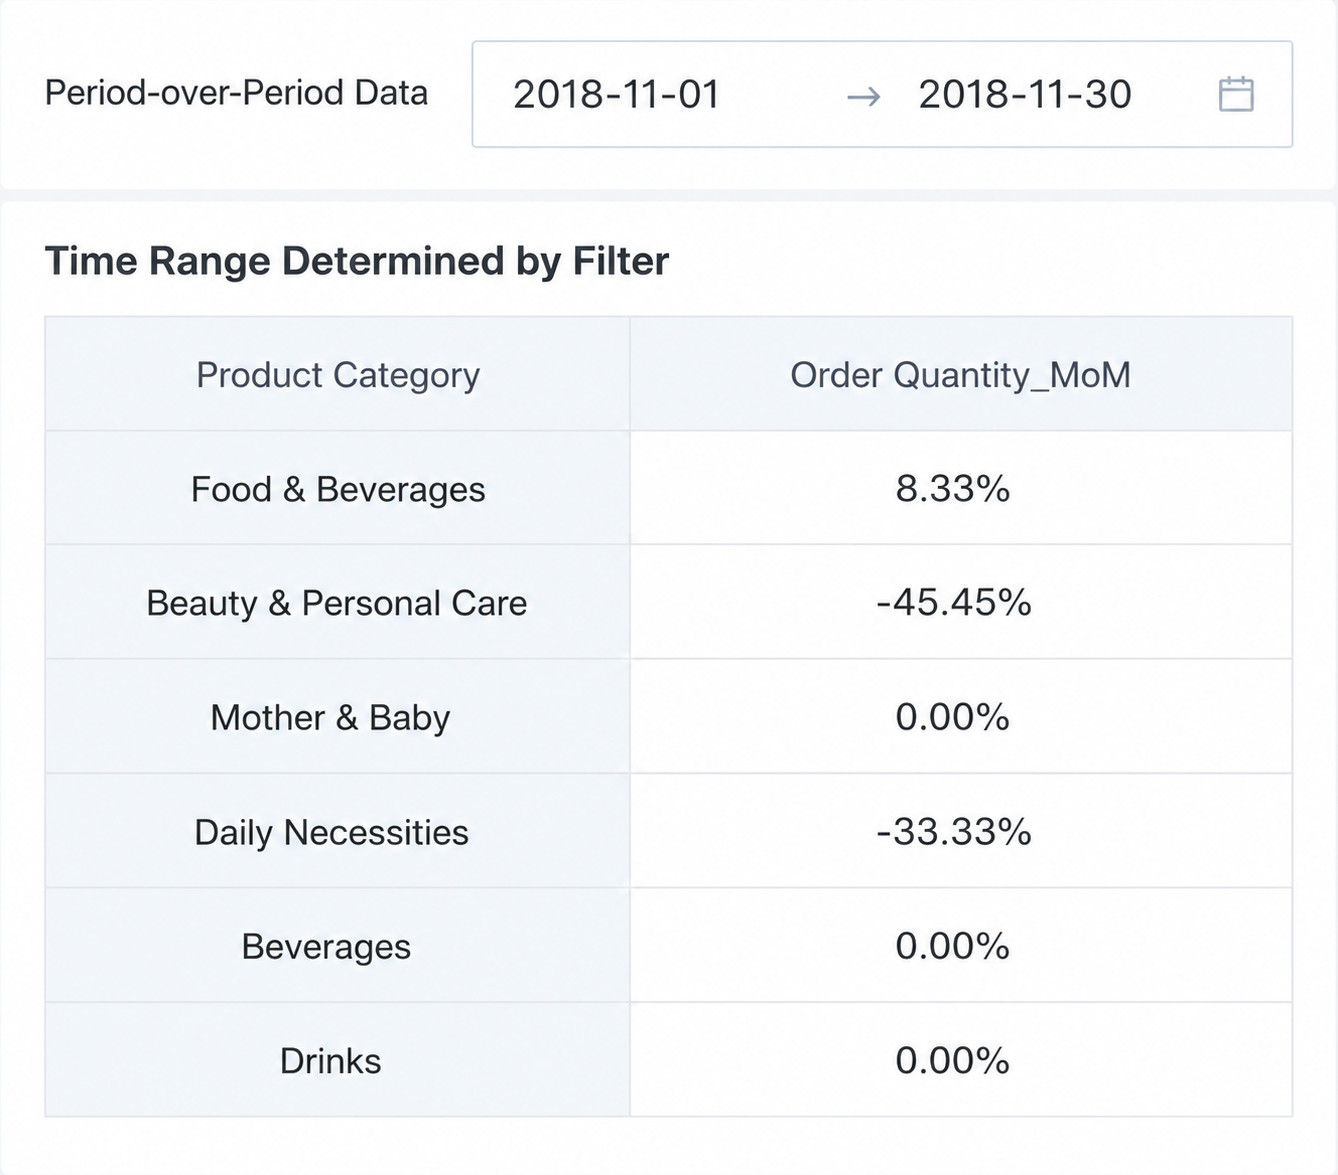
Users want to analyze metrics with text fields as dimensions and view the comparison between current period data and previous period data through filters. In this scenario, the analysis cannot include a date field as a dimension, and there needs to be a date filter in the analysis page. The date field in the filter is linked with the time dimension field of the YoY/MoM configured metric.
- The current period time range is passed by the time filter during analysis, which will overwrite the default value configured in the metric.
- The previous period time range is offset calculated according to the comparison type. Taking the date filter selecting [July 10, 2024 - July 31, 2024] as an example:
- The current period time range is [July 10, 2024 - July 31, 2024]
- Previous period time range:
- No configuration needed when selecting YoY/MoM. For example, if the comparison type is Month YoY, the previous period time range is [June 10, 2024 - June 30, 2024].
- Configuration needed when selecting Custom Offset. Use the corresponding unit to offset, configure the interval between the current period and the previous period as x days/weeks/months/years. For example, if the interval between the current period and the previous period is 3 days, the previous period time range is [July 7, 2024 - July 28, 2024].
- Configuration needed when selecting Custom Date. Configure a custom date/range and manually set the specific range of the previous period data.
Recent N Days/Weeks/Months/Quarters/Years Metrics
"Recent N days/weeks/months/quarters/years" metrics are usually used to capture short-term fluctuations and changes in the business, so as to quickly respond to market changes or internal operational issues, for quick response and decision-making scenarios. For example:
- Sales Amount: By monitoring the change in sales amount in the recent N days, you can find the rise or fall of sales trends in a timely manner, so as to adjust sales strategies, such as promotion activities, product pricing, etc.
- User Activity: Changes in user activity reflect the degree of user interest in the product or service. By monitoring user activity in the recent N days, you can understand user retention, thereby optimizing user experience and improving user stickiness.
- Conversion Rate: Conversion rate is an important metric to measure the effectiveness of marketing activities. By monitoring the conversion rate in the recent N days, you can evaluate the effectiveness of marketing activities and adjust marketing channels and strategies in a timely manner.
When the metric derivation method is Recent N days/weeks/months/quarters/years, it refers to the continuous N days/weeks/months/quarters/years time range counting back from the current date. The recent N days here are the most recent N days of the natural calendar.
The following content needs to be configured:
| Content | Description |
|---|---|
| Time Granularity | That is, the granularity of the time range, which can be configured as Day/Week/Month/Quarter/Year. |
| Calculation Range | The calculation range of data, supports quick setting according to time granularity. When the time granularity is Day, it supports Recent 3 days, Recent 7 days, Recent 14 days, Recent 30 days, Recent 7 days up to Yesterday, Recent 14 days to Recent 7 days, Custom. Except for custom mode, the start and end times are automatically calculated according to the selection. Taking today as [2024.12.31] as an example:
|
| Base Date | Base date indicates which day to start calculating the recent N days/weeks/months/quarters/years from. Optional end time of date filter / start time of date filter. When the date dimension is used during analysis, the base date takes the date corresponding to the date dimension value; when the date dimension is not used during analysis, the configuration here takes effect. |
| Start Date | Automatically filled/custom filled according to the calculation range. Such as recent 3 days, the start date is automatically filled as N=3, and the end date is automatically filled as N=0. Supports custom start time. |
| End Date | Automatically filled/custom filled according to the calculation range. Such as recent 3 days, the end date is automatically filled as N=0. |
| Calculation Method | When the date dimension is used during analysis, the metric is first aggregated and then calculated according to the aggregation logic of the atomic metric; when the date dimension is not used during analysis, the atomic metric calculation method is directly adopted. The calculation method can select Sum, Average, Max, Min. Note: When the atomic metric is Sum or Average, defining the secondary calculation here is meaningful. For example: To calculate the average sales amount per day within 1 month, you can first define the atomic metric Sales Amount with aggregation method Sum, derive the metric time range configured as Recent 1 Month, and the calculation method here is Average, which will first calculate the sum of daily sales amounts, then add these sums and finally divide by 30 (number of days in the month). |
The logic for custom configuration of start and end times is as shown in the table below:
| Date Granularity | Example Configuration | Rule Description |
|---|---|---|
| Day |
| Taking [2024.12.11] as an example Left closed right closed [2024.12.9, 2024.12.10] |
| Day |
| Taking [2024.12.11] as an example Left closed right closed [2024.12.9, 2024.12.11] |
| Week |
| Taking [December 11, 2024 (Wednesday)] as an example 2 weeks ago: Find the Wednesday of the week before last November 27, 2024 1 week ago: Find the Wednesday of last week December 4, 2024 Left open right closed (November 27, 2024, December 4, 2024] |
| Week |
| Taking [December 11, 2024 (Wednesday)] as an example Left open right closed (November 27, 2024, December 11, 2024] 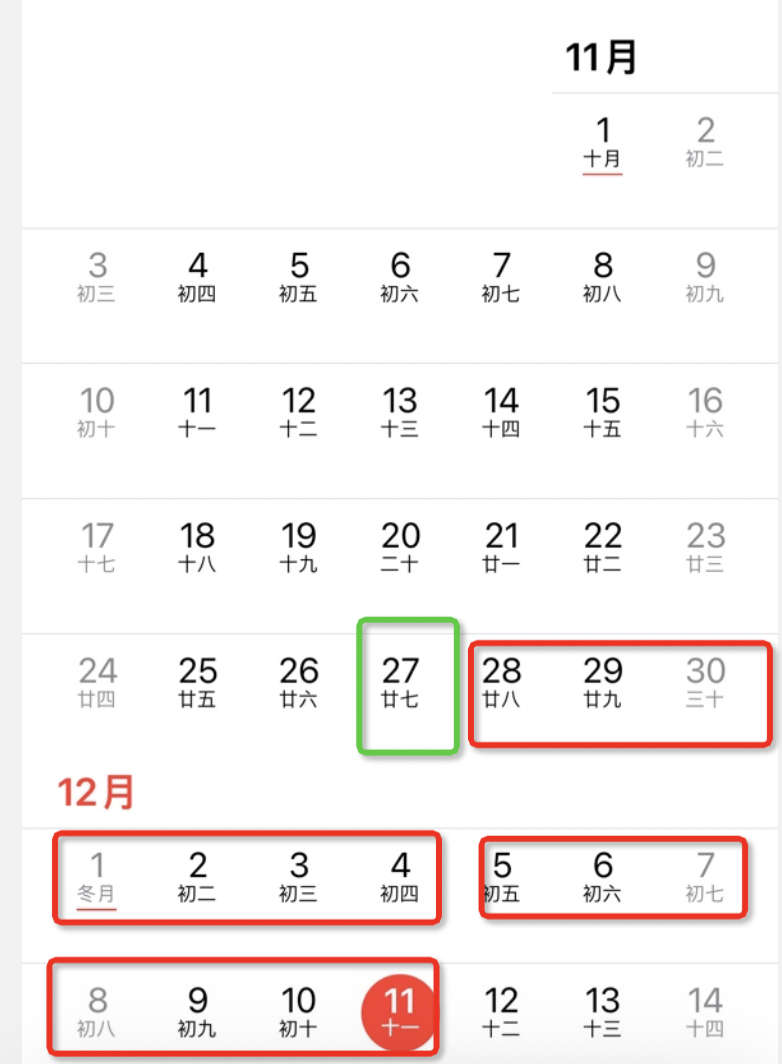 |
| Month |
| Taking [December 11, 2024] as an example 2 months ago: October 11, 2024 1 month ago: November 11, 2024 Left open right closed (October 11, 2024, November 11, 2024] |
| Month |
| Taking [December 11, 2024] as an example Left open right closed (October 11, 2024, December 11, 2024]  |
| Quarter |
| Taking [December 11, 2024] as an example 2 quarters ago: Find the 11th of 6 months ago June 11, 2024 1 quarter ago: Find the 11th of 3 months ago September 11, 2024 Left open right closed (June 11, 2024, September 11, 2024] |
| Quarter |
| Taking [December 11, 2024] as an example Left open right closed (June 11, 2024, December 11, 2024] |
| Year |
| Taking [December 11, 2024] as an example 2 years ago: Find December 11 of the year before last December 11, 2022 1 year ago: Find December 11 of last year December 11, 2023 Left open right closed (December 11, 2022, December 11, 2023] |
| Year |
| Taking [December 11, 2024] as an example Left open right closed (December 11, 2022, December 11, 2024] |
Taking the configuration of the recent 7-day metric of the GMV metric as an example, you can configure it as follows, with calculation range selecting Recent 7 days and calculation method selecting Sum:
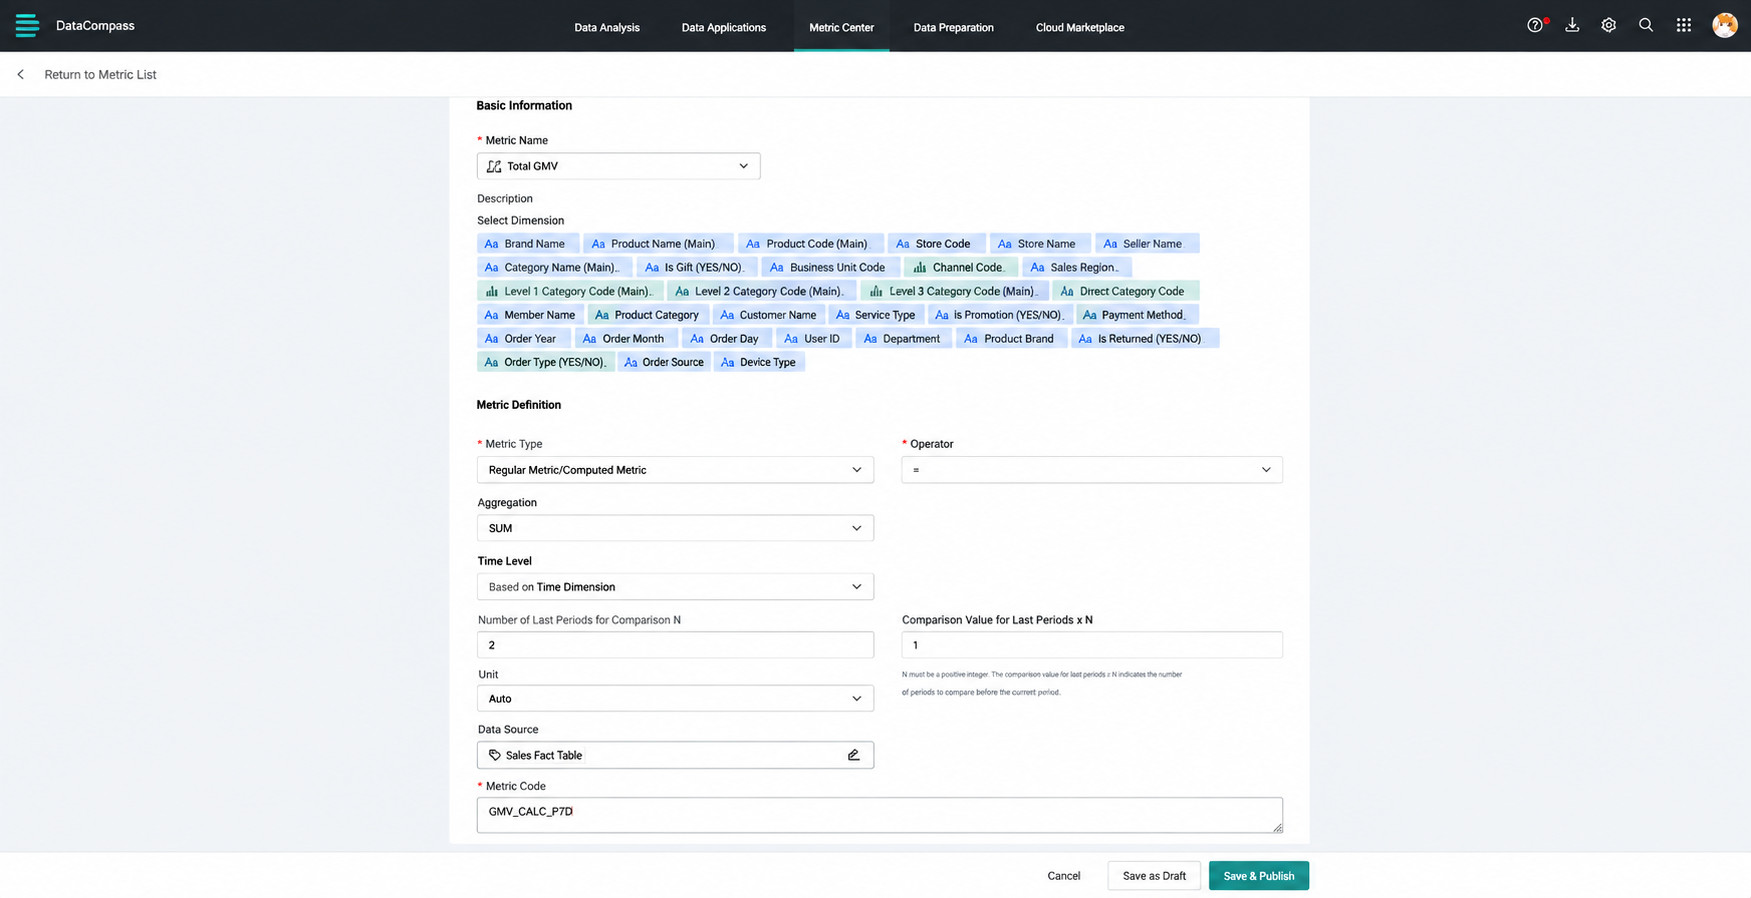
(1) When the time dimension of the analysis card is used as a dimension, the base date of each row is determined by the corresponding time dimension value.
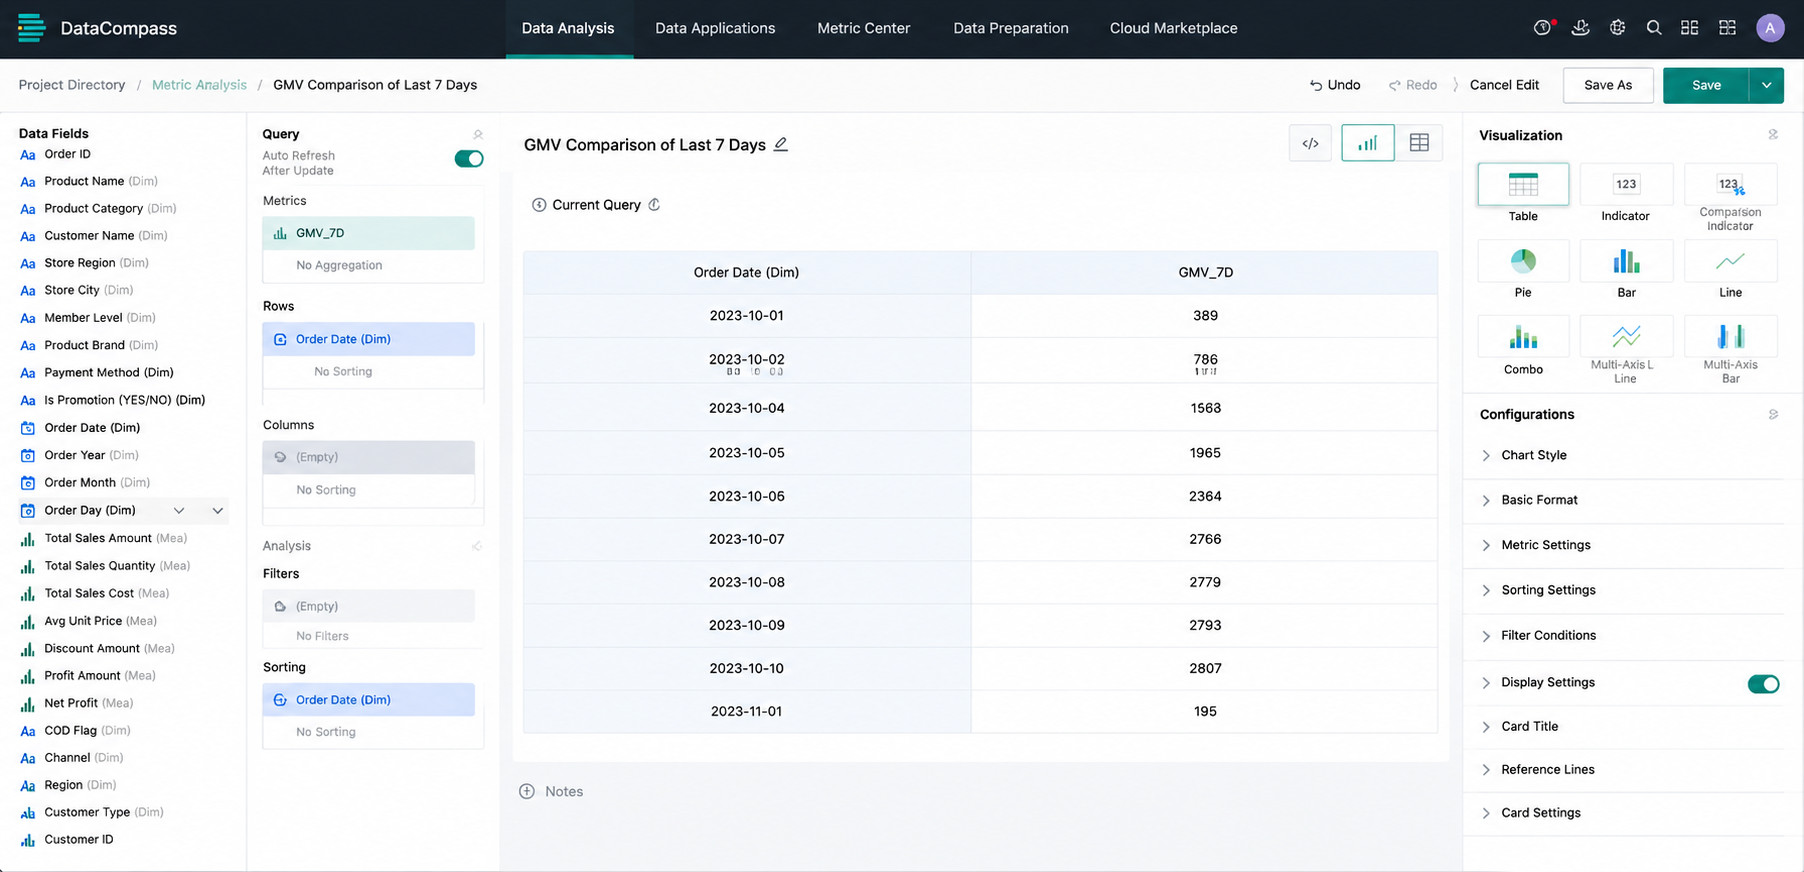
The calculation logic is as follows:
| Business Date (Day) | Recent 7 Days |
|---|---|
| 20231101 | 20231026GMV + 20231027GMV + ... + 20231101GMV |
| 20231102 | 20231027GMV + 20231028GMV + ... + 20231102GMV |
| ... | ... |
(2) When there is a date filter in the analysis page and there is no time dimension as the analysis dimension, the filter is linked with the metric's time dimension field. Taking the date filter selecting [October 10, 2023 - November 10, 2023] as an example:
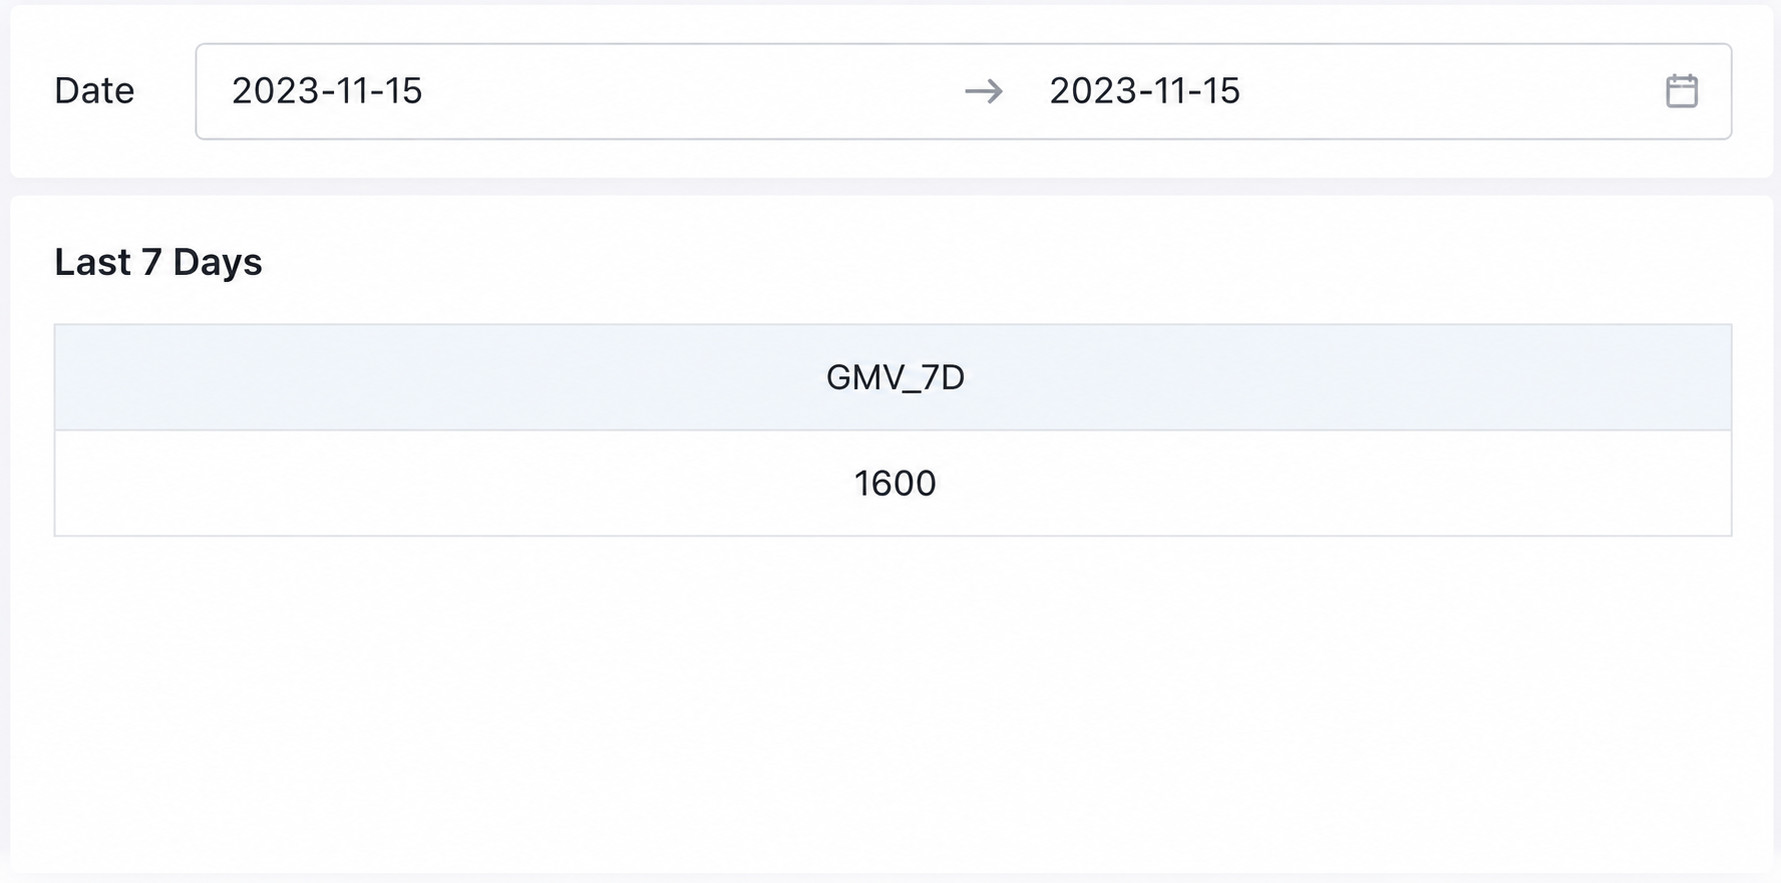
- When the metric base date is configured as "End time based on date filter", the calculation logic is as follows:
| GMV_ Recent 7 Days |
|---|
| 20231104GMV + 20231105GMV + ... + 20231110GMV |
- When the metric base date is configured as "Start time based on date filter", the calculation logic is as follows:
| GMV_ Recent 7 Days |
|---|
| 20231004GMV + 20231005GMV + ... + 20231010GMV |
Cumulative Calculation Metrics
Cumulative calculation metrics focus on reflecting the cumulative performance of the business over a longer period of time, helping enterprises grasp the overall trend and speed of business growth. The advantage of cumulative metrics is their stability and reliability, which can reflect the overall performance of the business over a longer period of time. For example:
- Monthly Cumulative: By calculating the cumulative value of a business metric within a month, you can clearly see the trend of the metric within that month. For example, monthly cumulative sales can reflect the sales performance of the enterprise in that month, helping the enterprise understand the sales growth situation and formulate sales targets for the next month.
- Annual Cumulative: Annual cumulative metrics are used to evaluate the overall business performance of the enterprise in a year. By calculating the cumulative value of a metric within a year, you can comprehensively understand the business status of the enterprise in that year, such as annual sales, annual profit, etc. These metrics help enterprises formulate long-term development strategies and plan future development directions.
When the metric derivation method is Cumulative Calculation, it supports cumulative summation by time dimension based on atomic metrics or composite metrics. When creating cumulative calculation metrics based on composite metrics, the system first calculates the composite metric result by day, then accumulates the results according to the selected cumulative range.
When creating cumulative calculation metrics, the following content needs to be configured:
| Content | Description |
|---|---|
| Calculation Range | Calculation range of cumulative data
|
| Base Date | Base date indicates the right endpoint of the cumulative time range, that is, up to which day to accumulate. Optional end time of date filter / start time of date filter. When the date dimension is used during analysis, the base date takes the date corresponding to the date dimension value; when the date dimension is not used during analysis, the configuration here takes effect. |
| Start Date | Determined by the cumulative method to echo the first day of the month/week/quarter/year/historical data. |
| End Date | Optional whether to include the current value of the base date. If not checked, accumulate to the day before the base date. |
Taking the configuration of monthly cumulative / quarterly cumulative / annual cumulative metrics of the GMV metric as an example, you can configure it as follows, with calculation range selecting monthly cumulative / quarterly cumulative / annual cumulative respectively:
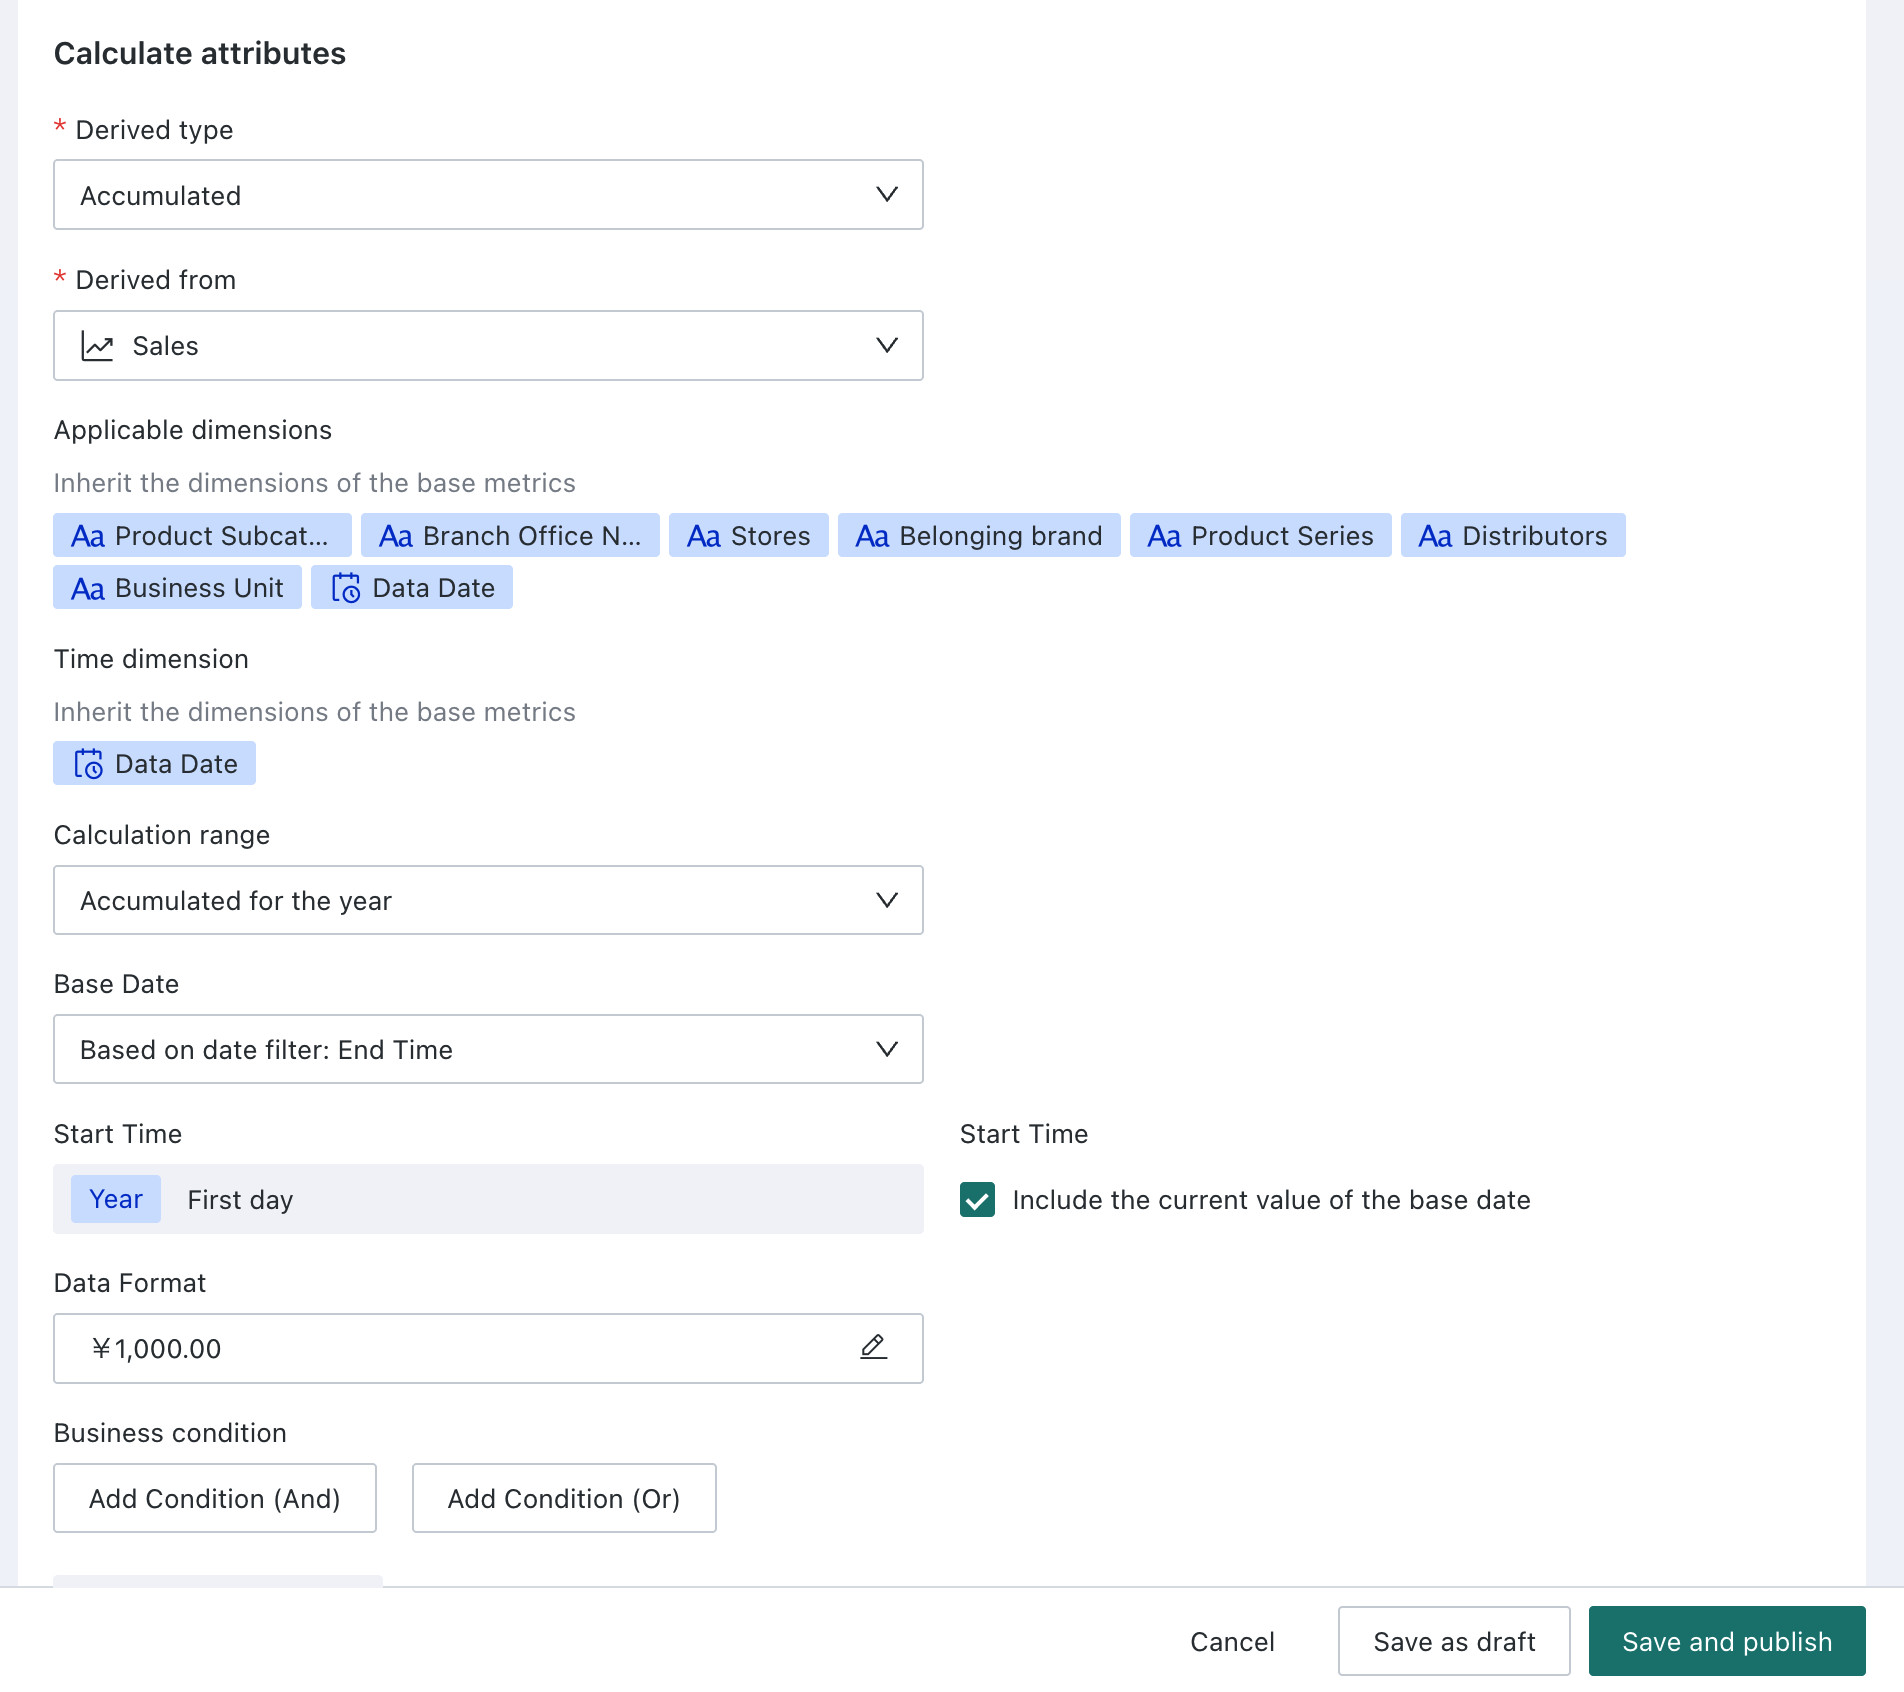
(1) When the time dimension of the analysis card is used as a dimension, the base date of each row is determined by the corresponding time dimension value.
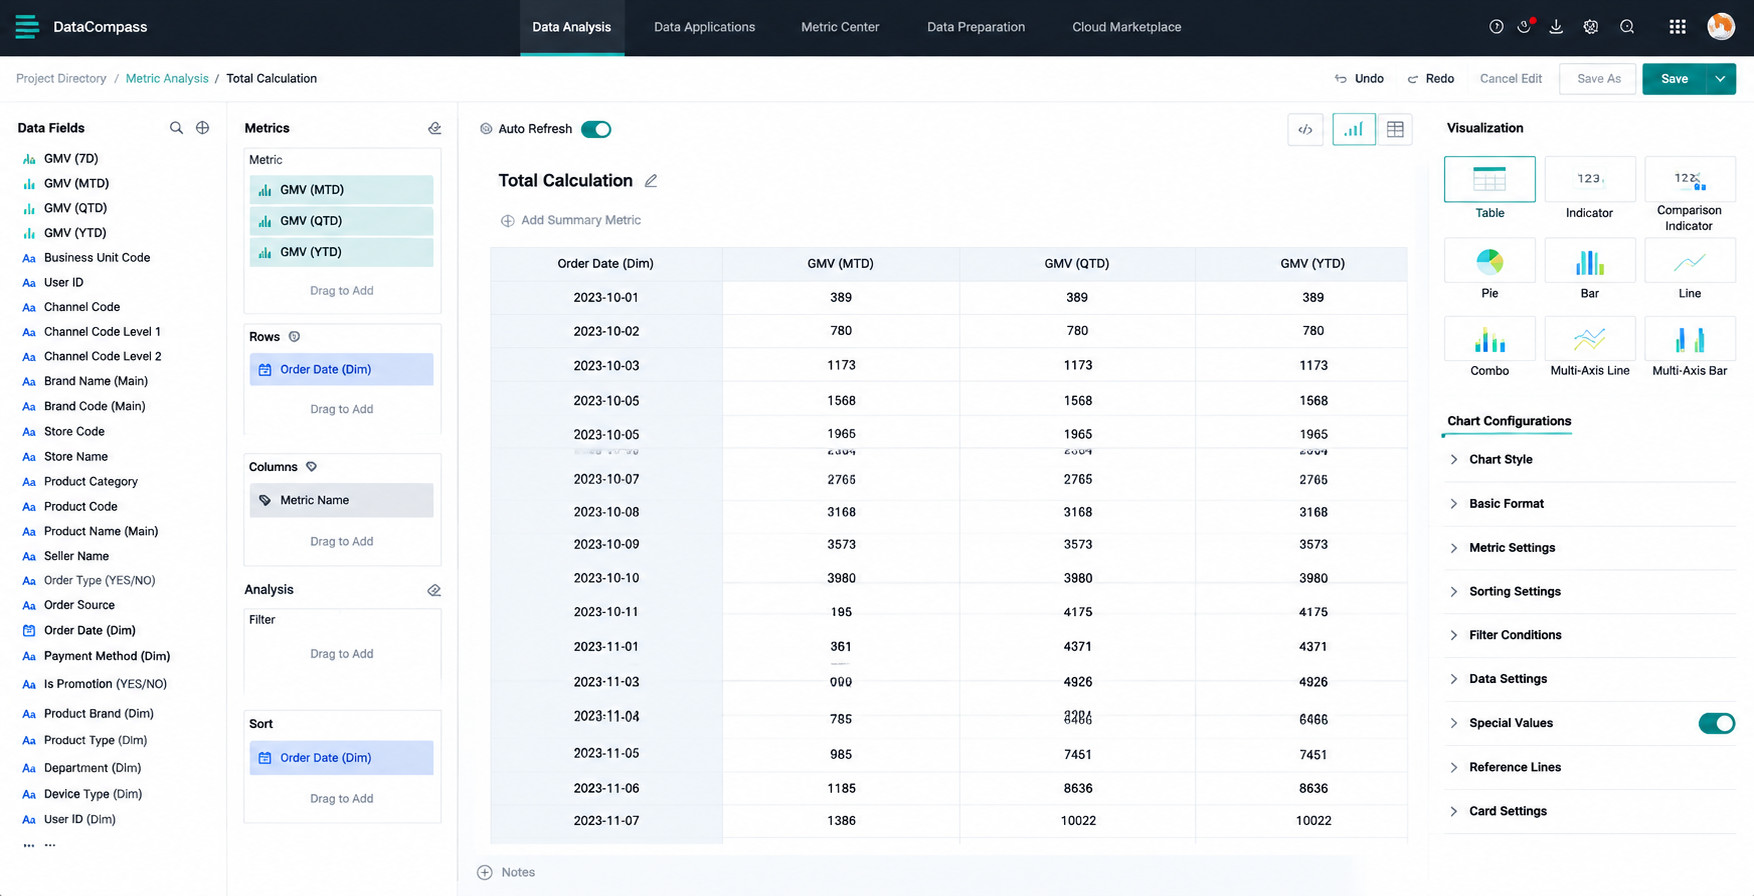
The calculation logic is as follows:
| Business Date (Day) | GMV_MTD | GMV_QTD | GMV_YTD |
|---|---|---|---|
| 20231101 | 20231101GMV | 20231001GMV + 20231002GMV + ... + 20231101GMV | 20230101GMV + 20230102GMV + ... + 20231101GMV |
| 20231102 | 20231101GMV + 20231102GMV | 20231001GMV + 20231002GMV + ... + 20231101GMV + 20231102GMV | 20230101GMV + 20230102GMV + ... + 20231101GMV + 20231102GMV |
| ... | ... | ... | ... |
(2) When there is a date filter in the analysis page and there is no time dimension as the analysis dimension, the filter is linked with the time dimension field of the cumulative calculation metric. Taking the date filter selecting [October 10, 2023 - November 10, 2023] as an example:
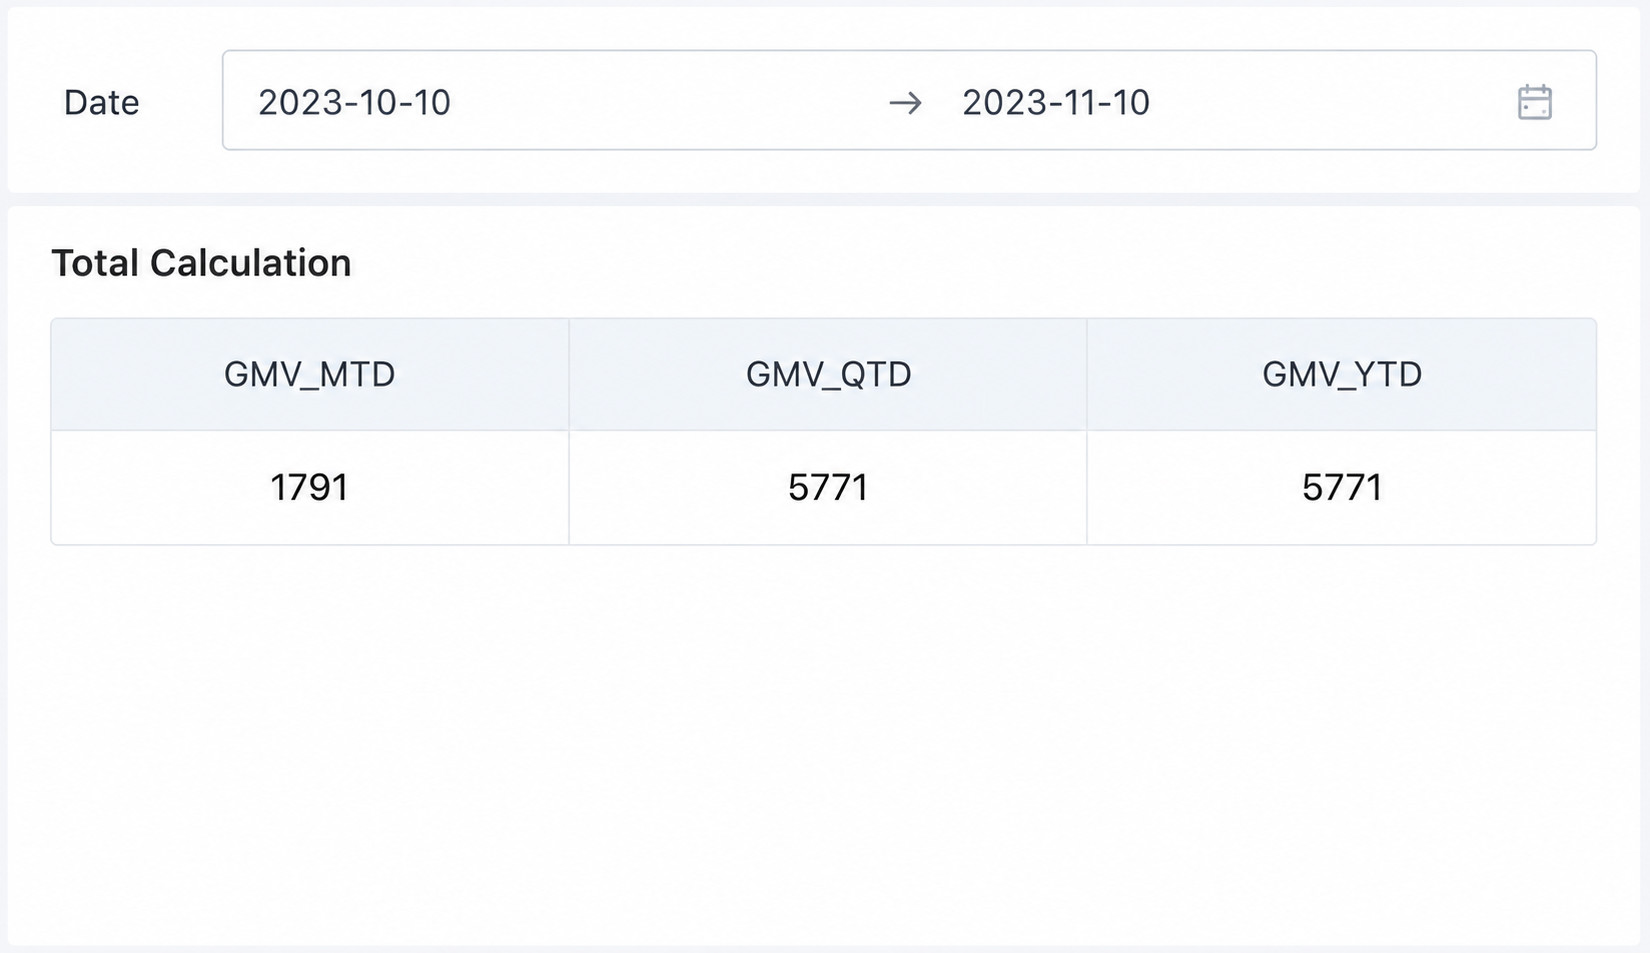
- When the metric base date is configured as "End time based on date filter", the calculation logic is as follows:
| GMV_MTD | GMV_QTD | GMV_YTD |
|---|---|---|
| 20231101GMV + 20231102GMV + ... + 20231110GMV | 20231001GMV + 20231002GMV + ... + 20231110GMV | 20230101GMV + 20230102GMV + ... + 20231110GMV |
- When the metric base date is configured as "Start time based on date filter", the calculation logic is as follows:
| GMV_MTD | GMV_QTD | GMV_YTD |
|---|---|---|
| 20231001GMV + 20231002GMV + ... + 20231010GMV | 20231001GMV + 20231002GMV + ... + 20231010GMV | 20230101GMV + 20230102GMV + ... + 20231010GMV |
End Value Metrics
End value refers to the value of assets or liabilities held at the end of a period. It is mainly used to define inventory-like metrics, usually referring to the specific value of the metric at a specific time point (such as end of month, end of year, etc.). For example:
- Financial Field: In the financial field, end value usually refers to the value of an investment portfolio or account at the end of a specific period. For example, when calculating the rate of return on investment or evaluating investment strategies, end value needs to be used as a reference.
- Accounting Field: In the accounting field, end value usually refers to the asset and liability status of a company at the end of a specific accounting period. End value is usually used to prepare financial statements and evaluate the company's financial status.
- Inventory Management: In inventory management, end value refers to the value of inventory items at the end of a specific period. Management can evaluate inventory liquidity and demand by comparing the opening value and end value, thereby formulating more effective inventory management strategies.
When the metric derivation method is End Value, you need to first select the calculation logic, and support taking the end value of data by time dimension and date filter.
| Calculation Logic | Description |
|---|---|
| Natural Last Day | Take the last day of the date filter/date dimension. For example, if the date range is May → take May 31, return null if no data. |
| Last Available Value | Within the date range specified by the date filter/date dimension, take the data of the last valid date that has data. For example, if the date range is May, and there is no data on May 31 but data on May 30 → take May 30. (If a card analyzes multiple metrics simultaneously, the last available data is taken for each metric separately, and the dates may not be aligned) |
Historical metrics/cards all use "End Value - Natural Last Day" calculation logic. After upgrading to version 8.3, the existing end value derived metrics and end values in card advanced calculations still calculate according to "End Value - Natural Last Day" by default, to ensure unchanged historical results.
End Value - Natural Last Day
(1) When the time dimension of the analysis card is used as a dimension, it will be calculated according to the date granularity of the time dimension dragged into the dimension bar.
For example, if the time level dragged into the dimension bar is Year - Month, the calculation result of the last day of each month will be taken.
| Business Date (Year - Month) | GMV End Value |
|---|---|
| 202311 | 20231130GMV |
| 202312 | 20231231GMV |
| ... | ... |
(2) When there is a date filter in the analysis page and there is no time dimension as the analysis dimension, the filter is linked with the time dimension field of the end value metric.
- When the filter selects data for a certain day, the value of that day is taken as the calculation result.
- When the filter selects data for a certain month, the value of the last day of that month is taken as the calculation result.
- When the filter selects data for a certain year, the value of the last day of that year is taken as the calculation result.
- When the filter selects a date range, the value of the last day of that period is taken as the calculation result. Taking the date filter selecting [October 10, 2023 - November 10, 2023] as an example, take the result of November 10, 2023.
End Value - Last Available Value
(1) When the time dimension of the analysis card is used as a dimension, according to the date granularity of the time dimension dragged into the dimension bar, take the data of the last valid date that has data within the corresponding time range.
For example, if the time level dragged into the dimension bar is Year - Month, and there is no data on November 30, 2023 but data on November 29, take 20231129GMV.
| Business Date (Year > Month) | GMV End Value |
|---|---|
| 202311 | 20231129GMV |
| 202312 | 20231231GMV |
| ... | ... |
(2) When there is a date filter in the analysis page and there is no time dimension as the analysis dimension, the filter is linked with the time dimension field of the end value metric, and take the data of the last valid date that has data within the date range specified by the filter. Taking the date filter selecting [October 10, 2023 - November 10, 2023] as an example, if there is no data on November 10 but data on November 9, take the result of November 9, 2023.
Combined Derived Metrics
Combined derivation supports configuring calculation formulas on derived metrics to perform addition, subtraction, multiplication, and division operations on multiple derived metrics. For example:
Inventory Turnover Days = (12-month average inventory market value / 12-month average retail market value) * 30.
Only other derived metrics can be referenced in the calculation formula. The derivation type must be Recent N Days / Cumulative Calculation / End Value. Only addition, subtraction, multiplication, and division logic can be configured, and functions are not supported.