Metric Tree
Function Description
Metric Tree is the core functional module of the metric platform, which decomposes and displays complex business metrics hierarchically and structurally in a tree structure, supporting dimension decomposition, metric decomposition, intelligent interpretation, and attribution analysis, helping enterprises clearly present metric relationships, decompose strategic goals, and locate data problems. It serves metric managers, business departments, and data analysts.
Core Value
- Clearly present metric relationships and build a systematic metric system;
- Support the layered decomposition of macro goals into refined sub-metrics;
- Provide multi-dimensional data interpretation and attribution analysis to quickly locate the root cause of problems;
- Generate actionable suggestions based on business scenarios to tap the value of metric data.
Glossary
- Dimension Decomposition: Hierarchically split by the applicable dimensions of metrics (such as region, channel), and display the metric data under different dimensions;
- Metric Decomposition: Split by the logical or computational relationships between metrics, and construct hierarchical relationships between metrics;
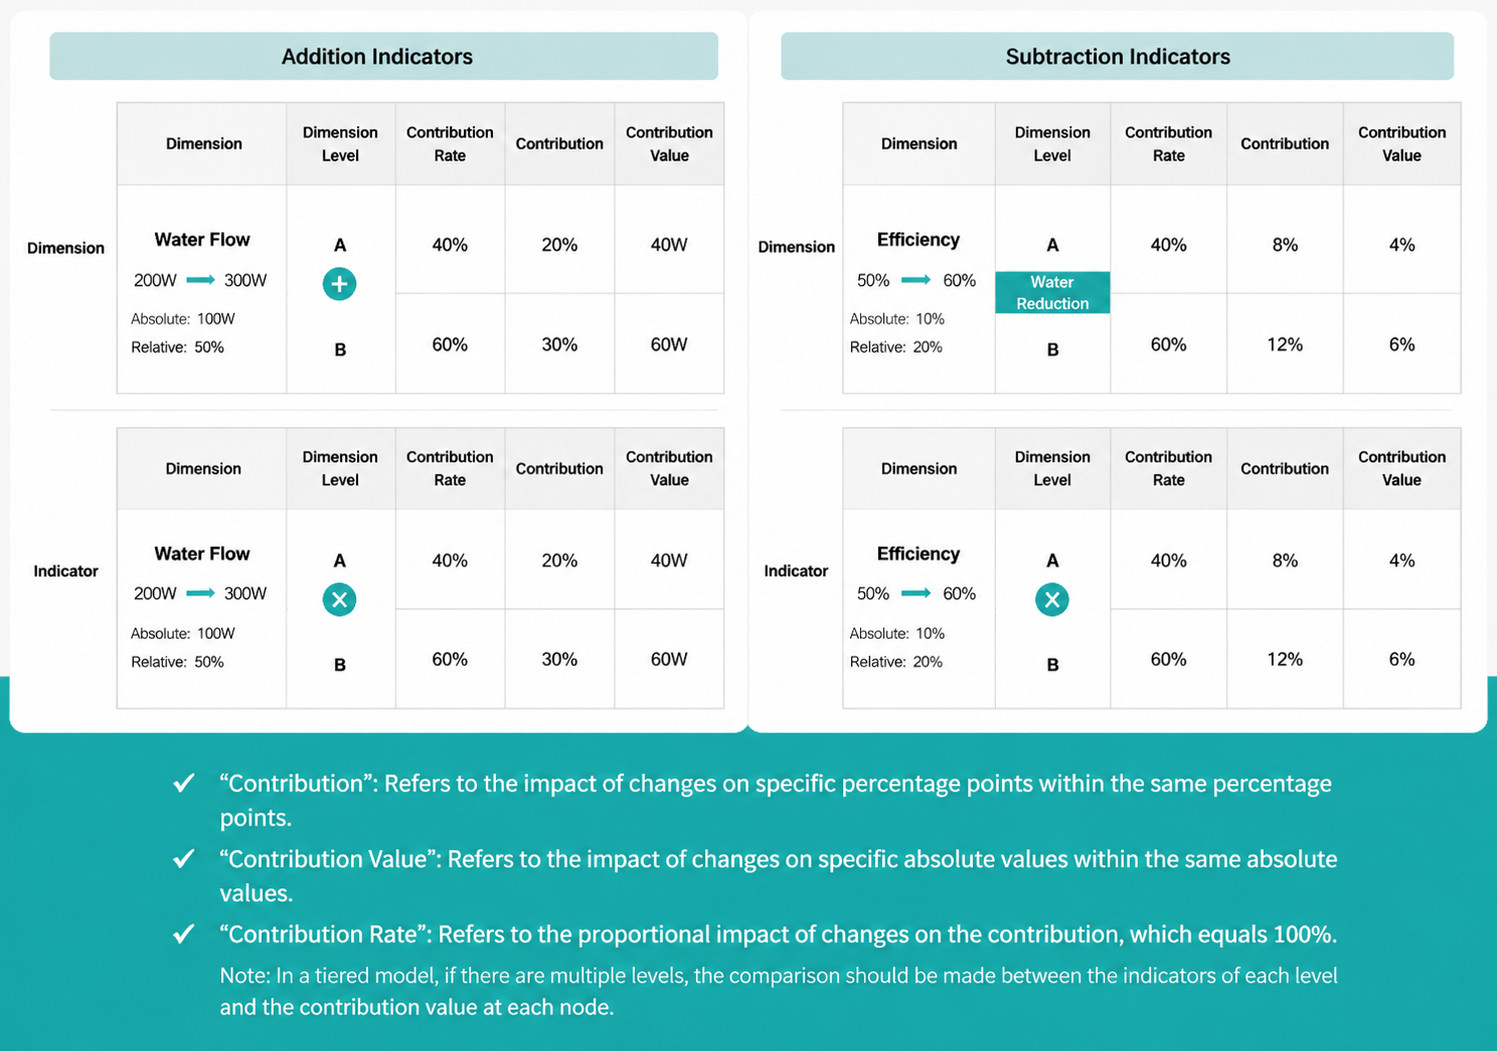
- Contribution Value: In the absolute change value, the absolute value impact brought by the influencing factor;
- Contribution Percentage Point: In the YoY change percentage point, the percentage point impact brought by the influencing factor;
- Contribution Rate: The proportion of the impact factor's contribution to the change, and the sum of all impact factor contribution rates is 100%.
Permission Description
- View Permission: Users who have Owner/User permissions for the root metric of the current metric tree can view the metric tree structure and metric values;
- Edit Permission: Only users with edit permissions on the metric platform can create and edit metric trees; each node metric of the metric tree can only select metrics for which the user has Owner/User permissions.
Metric Tree Creation and Viewing
Metric Tree Entry
After logging in to the metric platform, enter the module through the first-level directory "Metric Tree". By default, the list of metric trees under the root directory is displayed.
Dimension Decomposition Tree Configuration and Operation
Left Global Settings
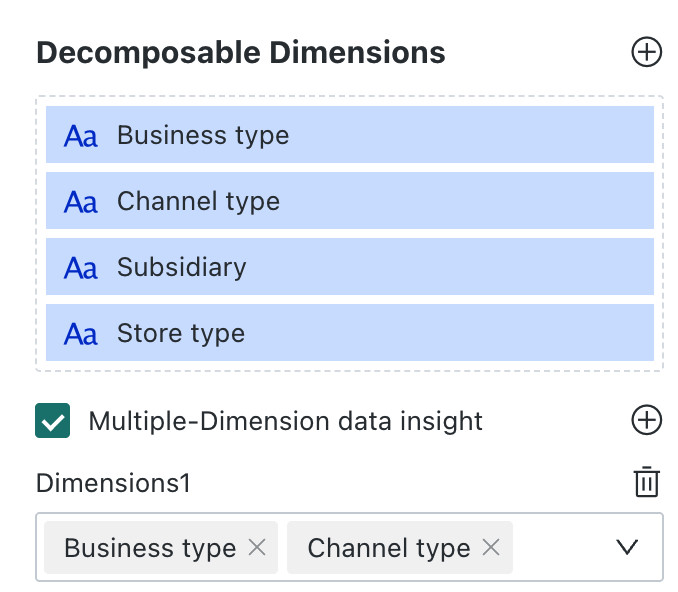
Decomposition Dimensions
Used to control the dimension range that each node in the metric tree can drill down and decompose. It includes basic dimensions and cross-dimensions, and supports adding and deleting.
- Basic Dimensions: Select dimensions that can be decomposed in the current metric tree from the applicable dimensions of the metric;
- Cross-Dimensions (Combined): Select two or more basic dimensions from the applicable dimensions of the metric for logical concatenation (such as: City - Product Category) to form a virtual dimension.
Display Settings
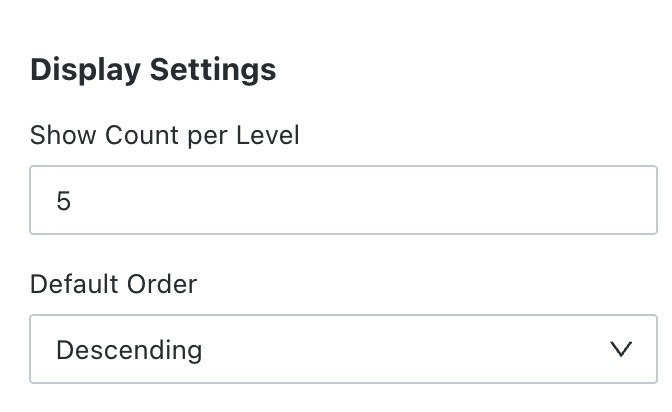
Control the number and order of nodes displayed by default on the right canvas
- Number of displays per level: Set the default number of nodes displayed per level;
- Display order: Drop-down to select ascending/descending order, control the display order of level nodes;
Time Settings
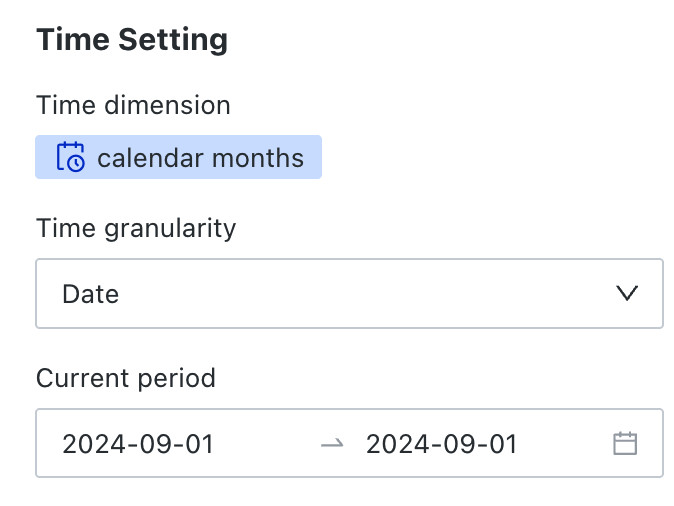
- Only supports metric configuration with time dimensions.
- Time Granularity: Select Day/Week/Month/Quarter/Year; select the time granularity of the metric statistics time for each node of the metric tree.
- Current Period: Select the statistical time of the metric for each node of the metric tree.
Comparison Settings
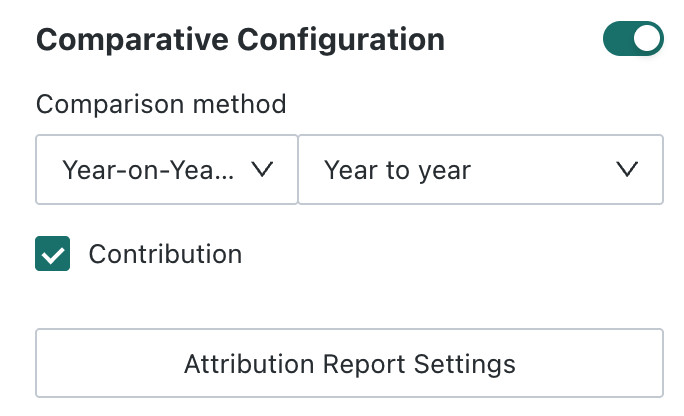
After enabling the toggle, you can configure the comparison method. After enabling, each node will calculate the change value compared with the comparison time.
-
Comparison Method: Single selection. According to the time granularity, it shows Day MoM/Week YoY/Month YoY/Quarter YoY/Year YoY; when there is no time dimension or the main metric is a YoY/MoM derived metric, comparison cannot be calculated.
-
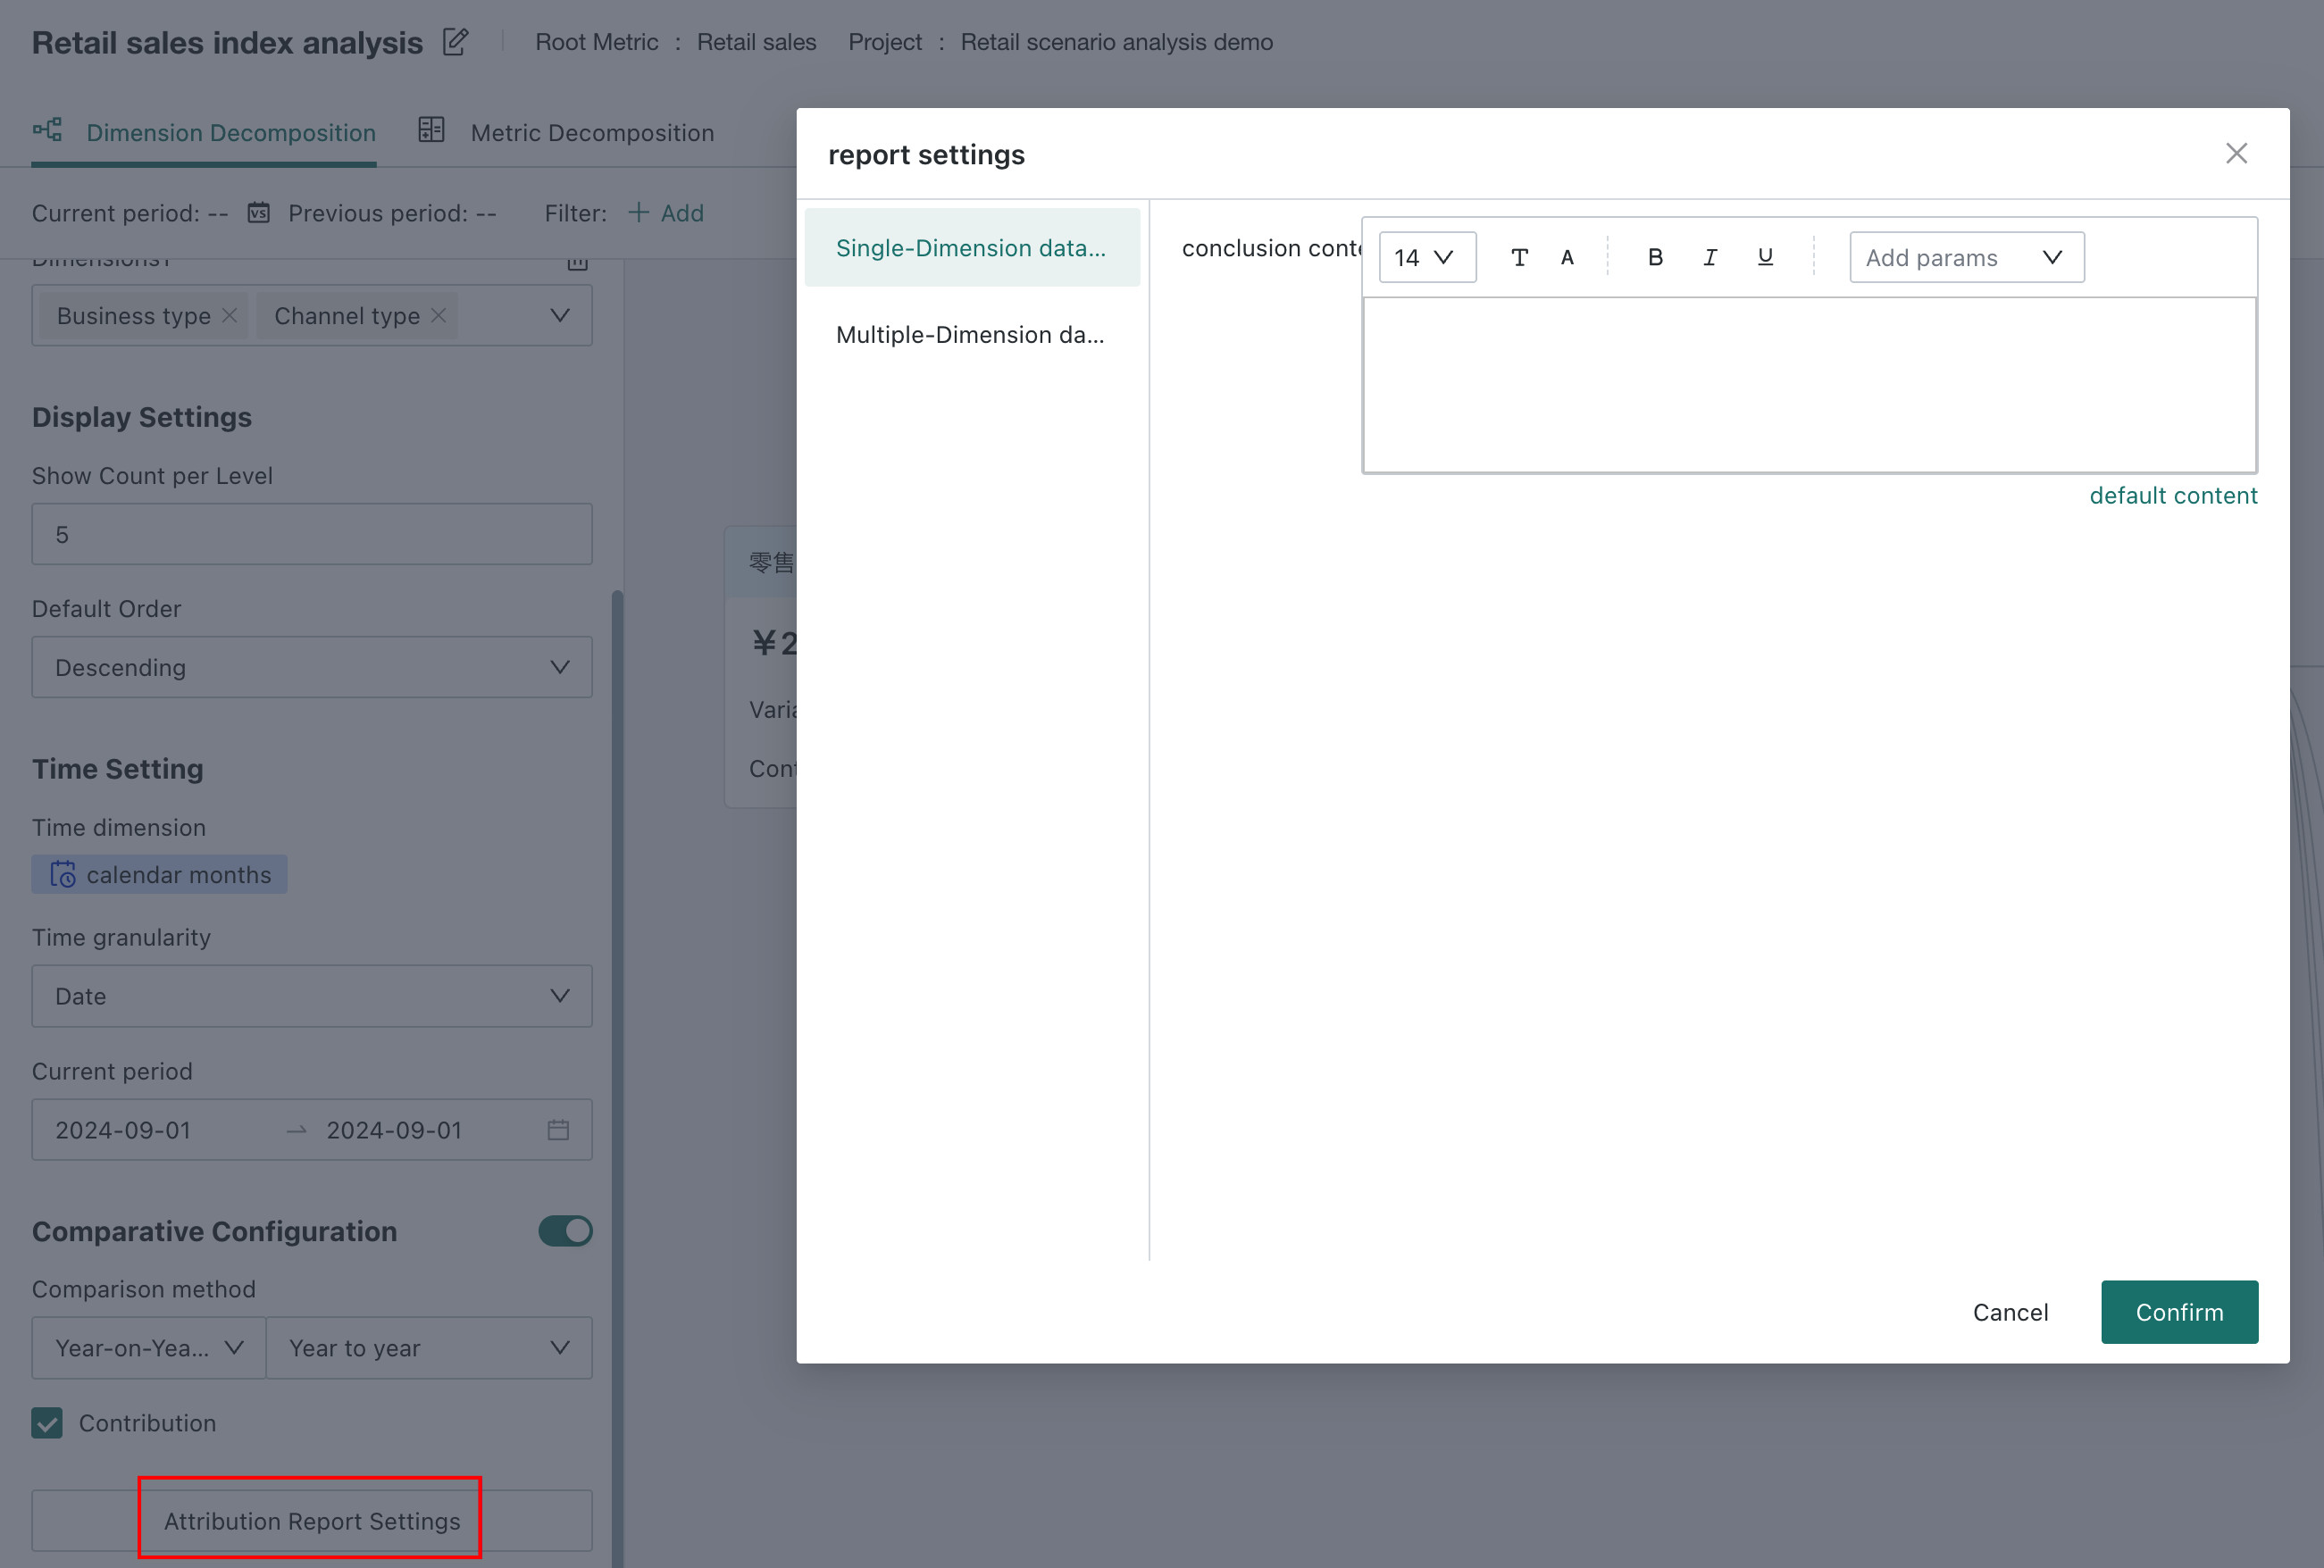
Contribution: Enabled by default. After enabling, the system will automatically calculate the contribution rate of each dimension to the change; you can also click "Attribution Report Settings" to customize the content of the attribution report.
NoteOnly when Contribution is enabled, Attribution Details can be viewed; when Contribution is disabled, the Attribution Details button will be grayed out and cannot be clicked.
Right Canvas Configuration
-
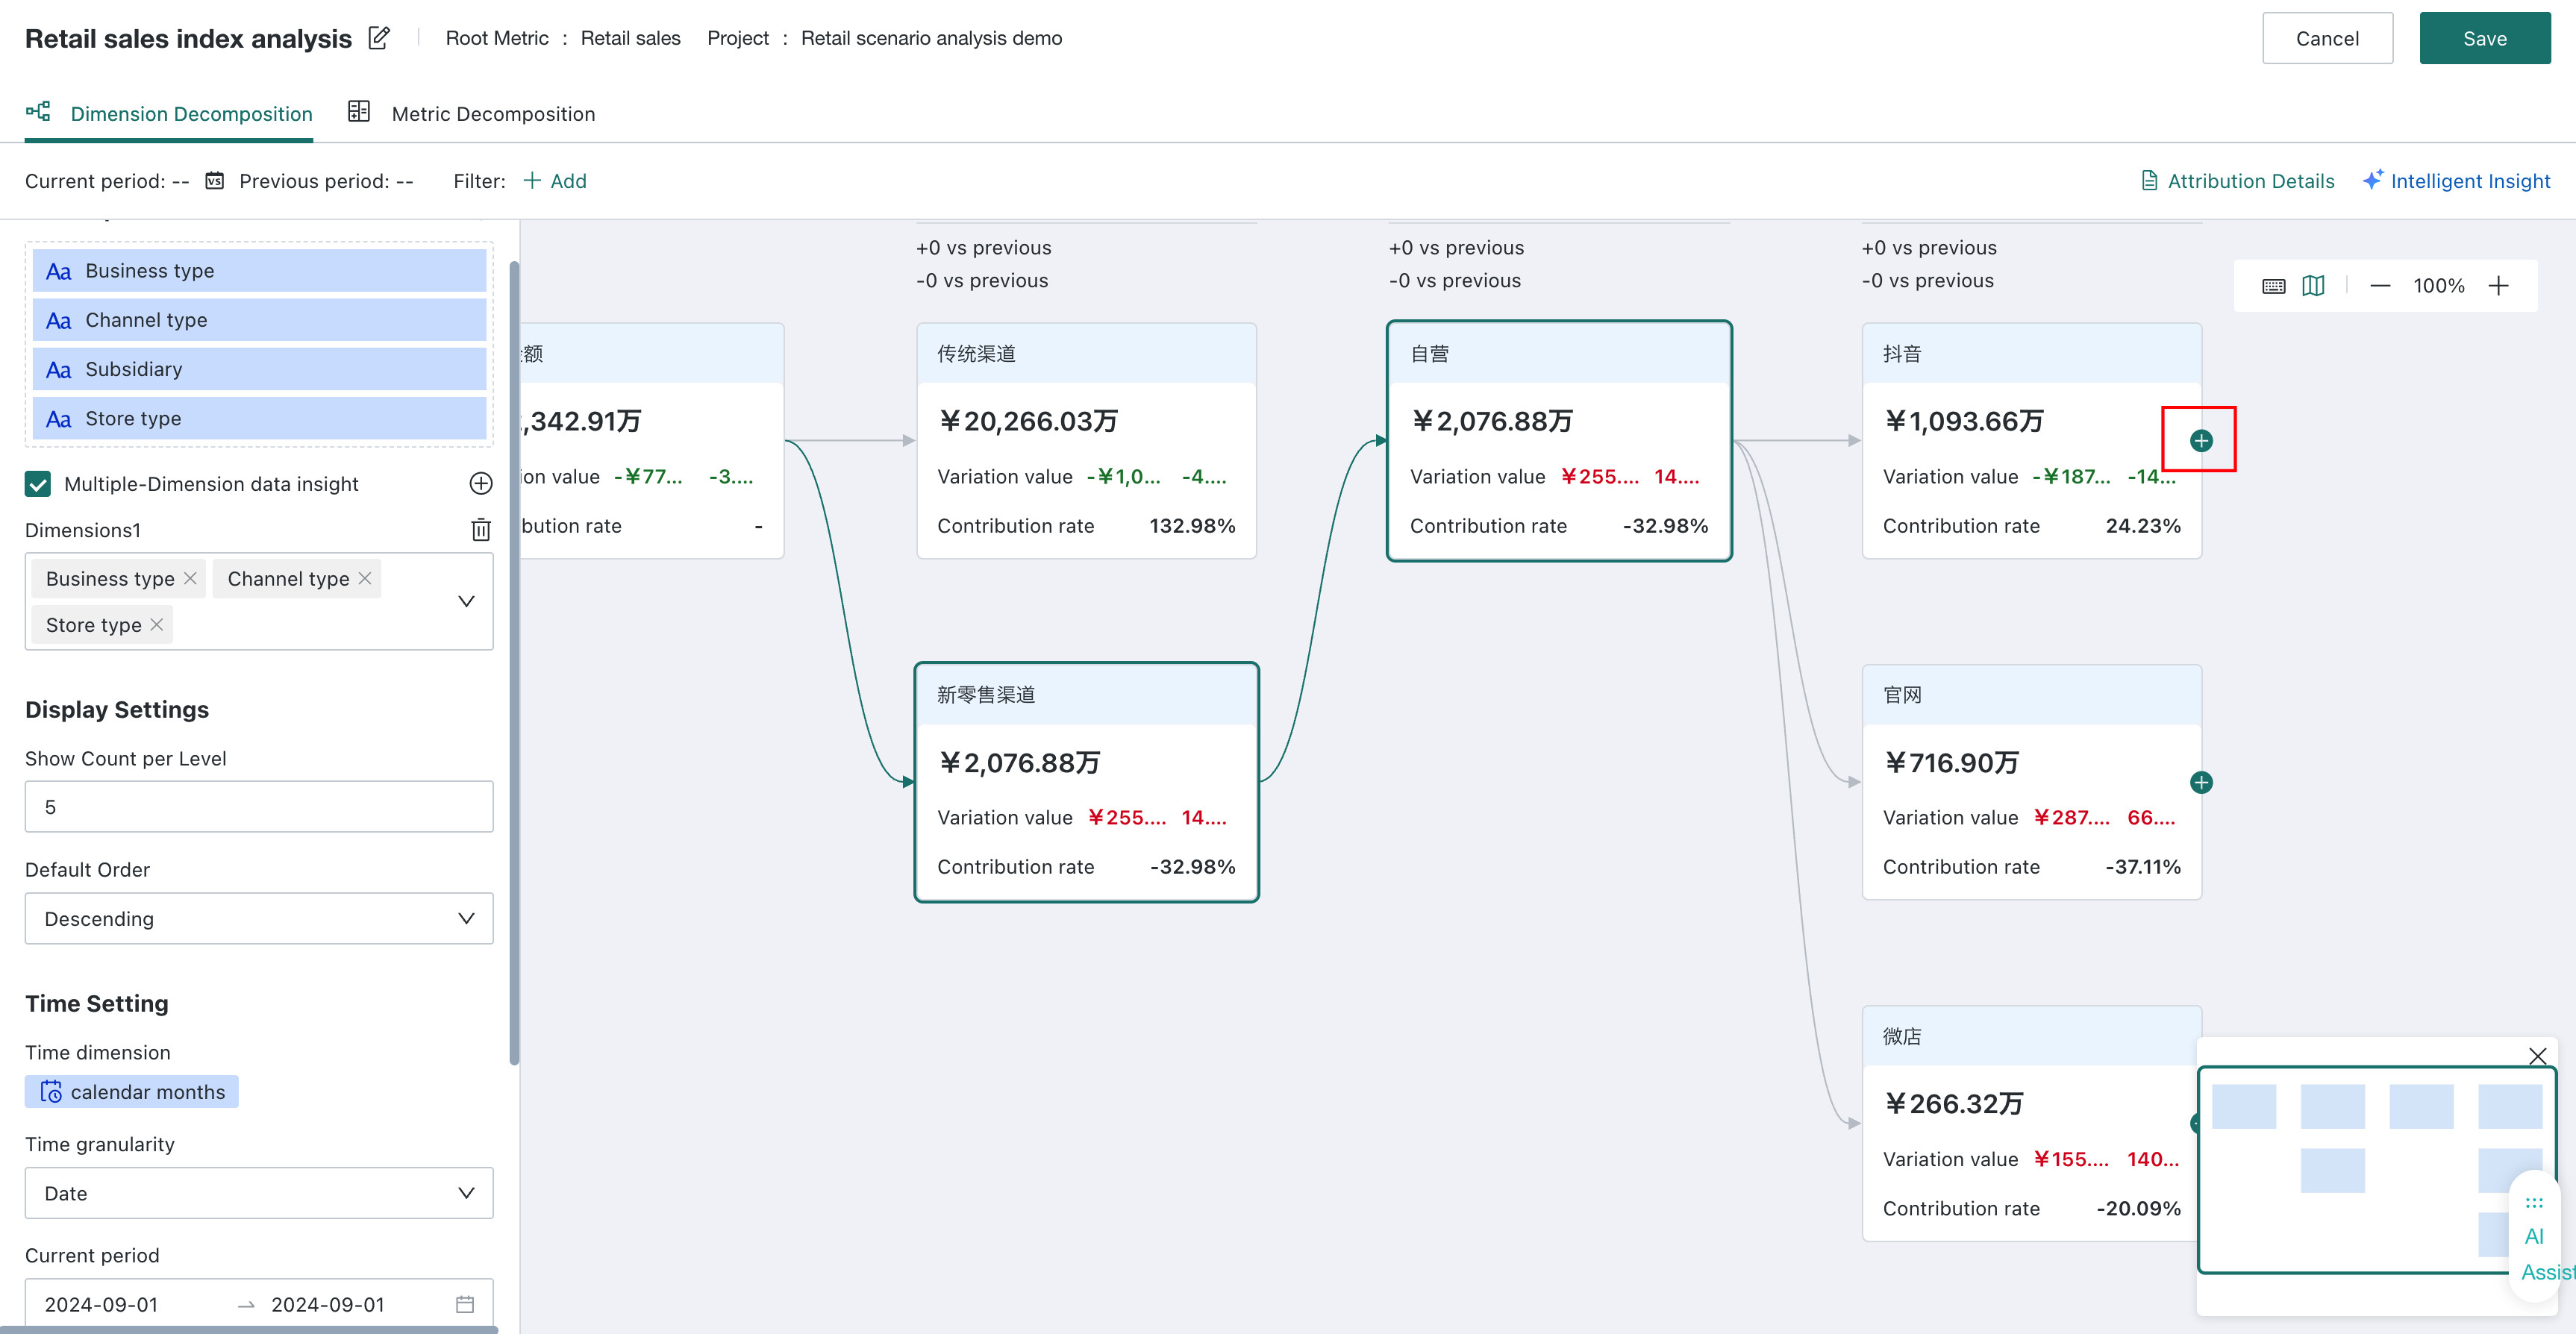
Node Creation: The canvas defaults to displaying the main metric node. Click the "+" sign in the node, select the decomposition dimension of the next level, and automatically generate child nodes
-
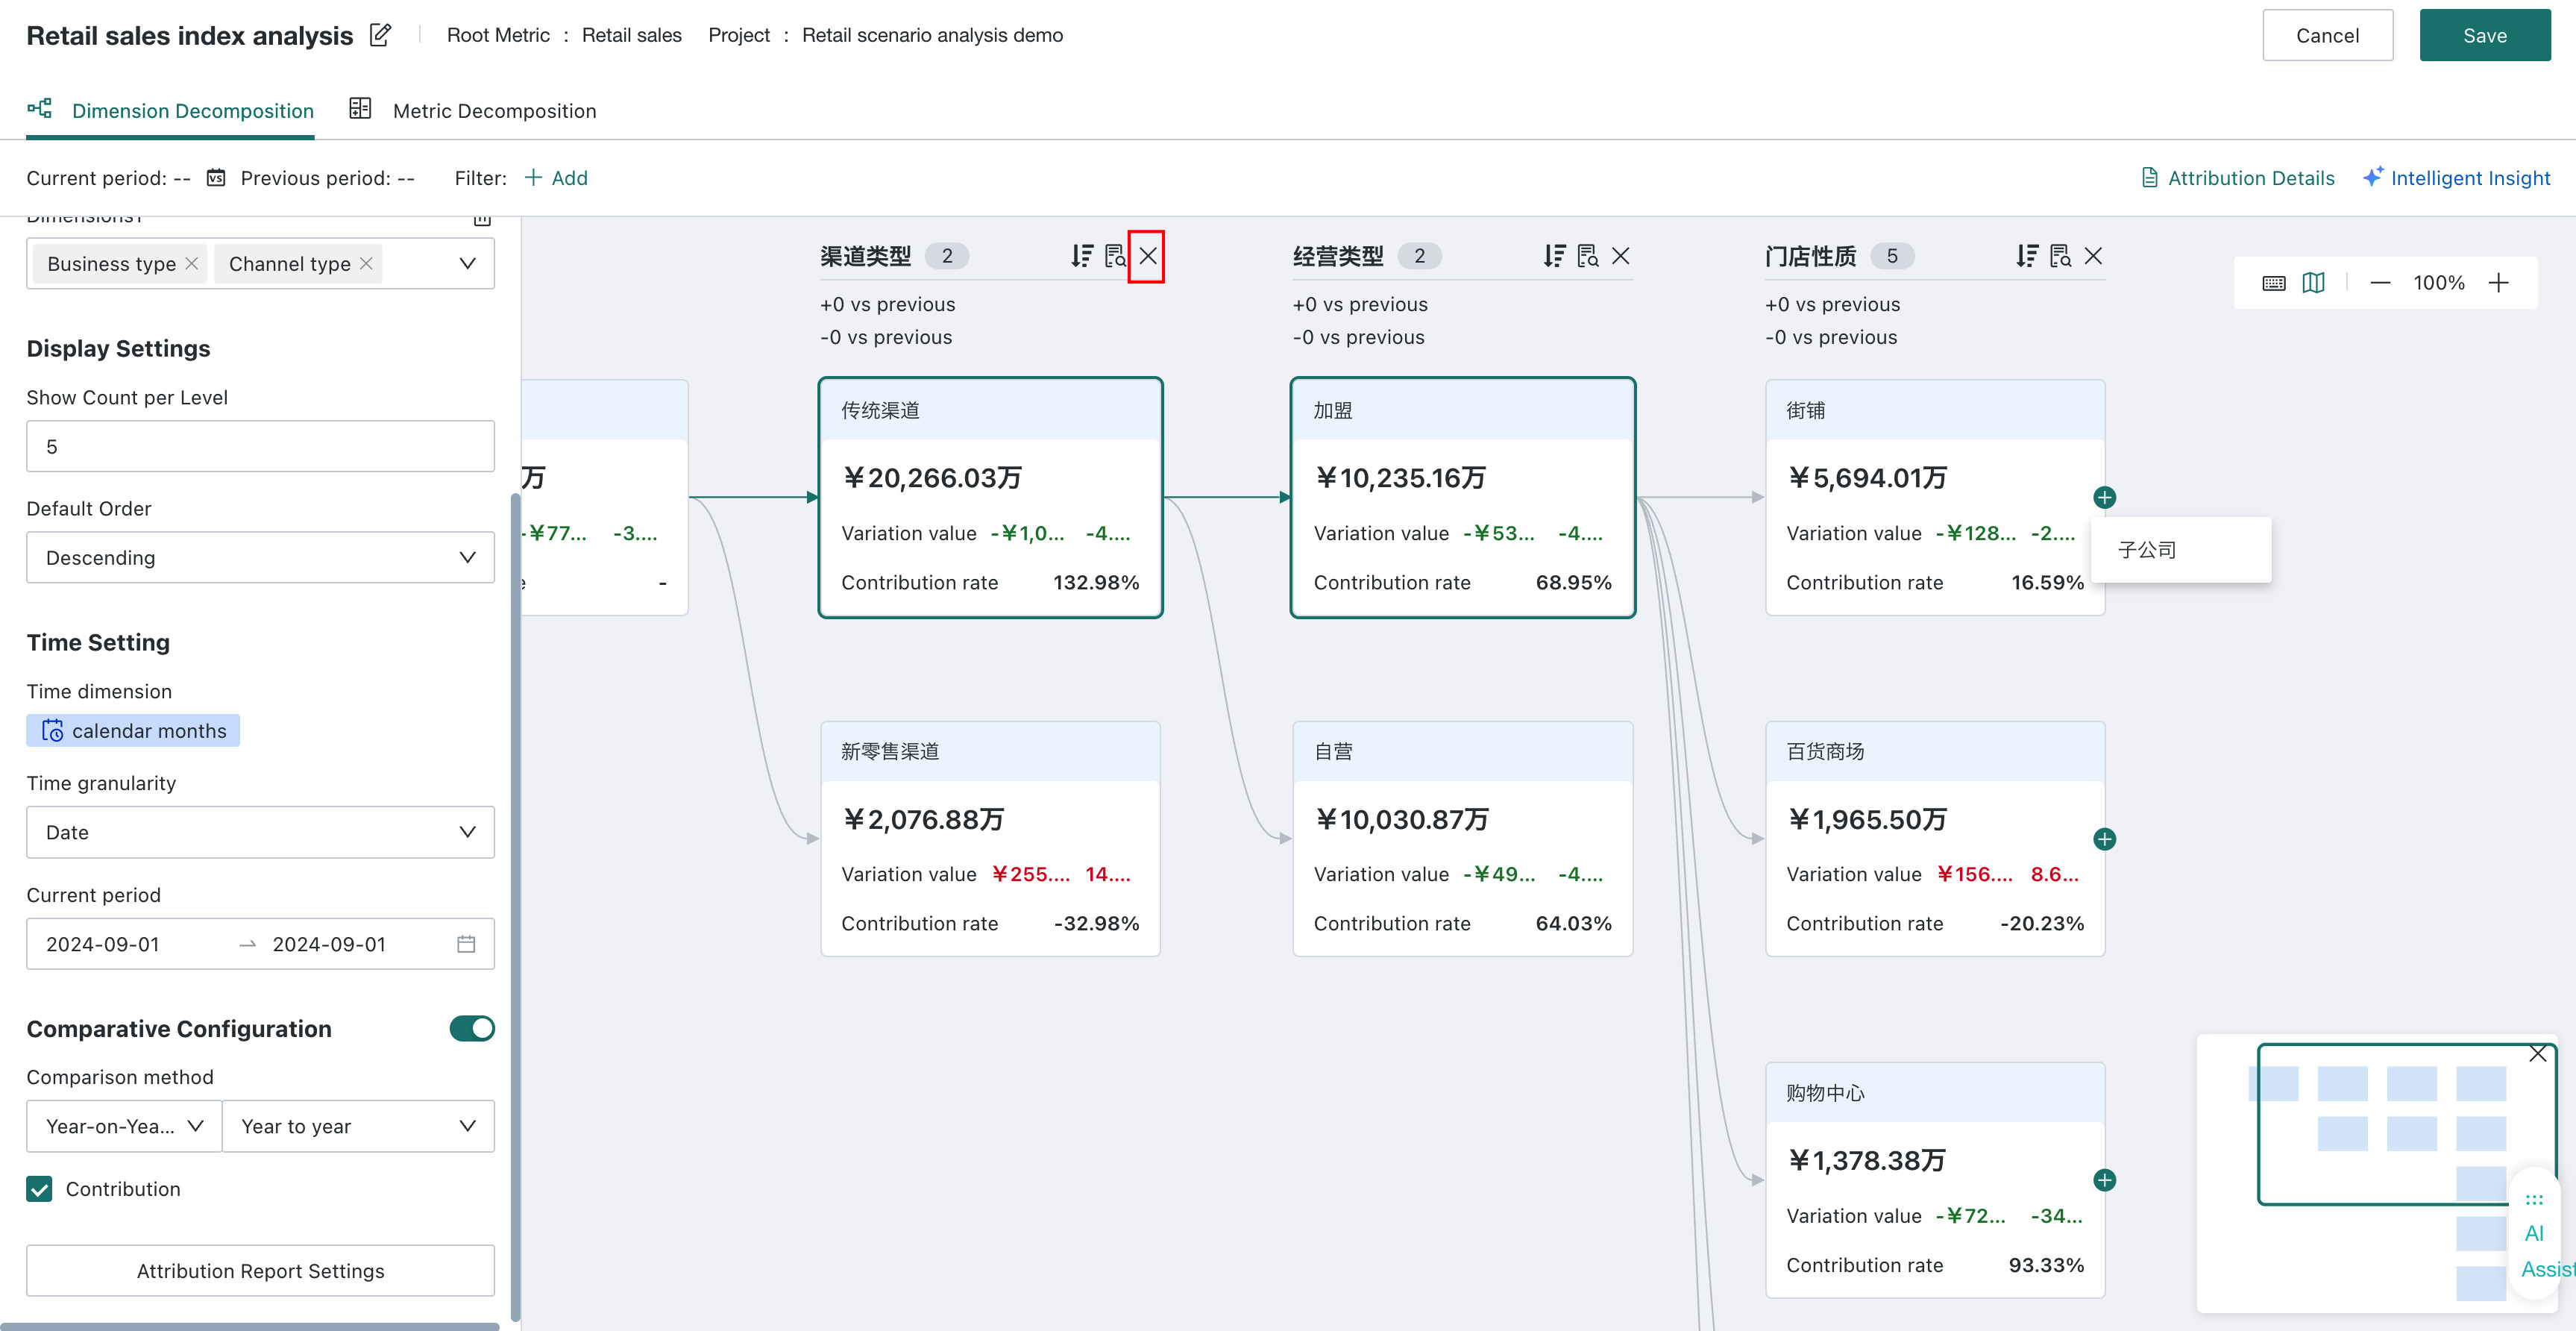
Node Deletion: Right-click the node and select "Remove Association", which will delete all downstream metrics of that node. The canvas must retain at least one original node;
-
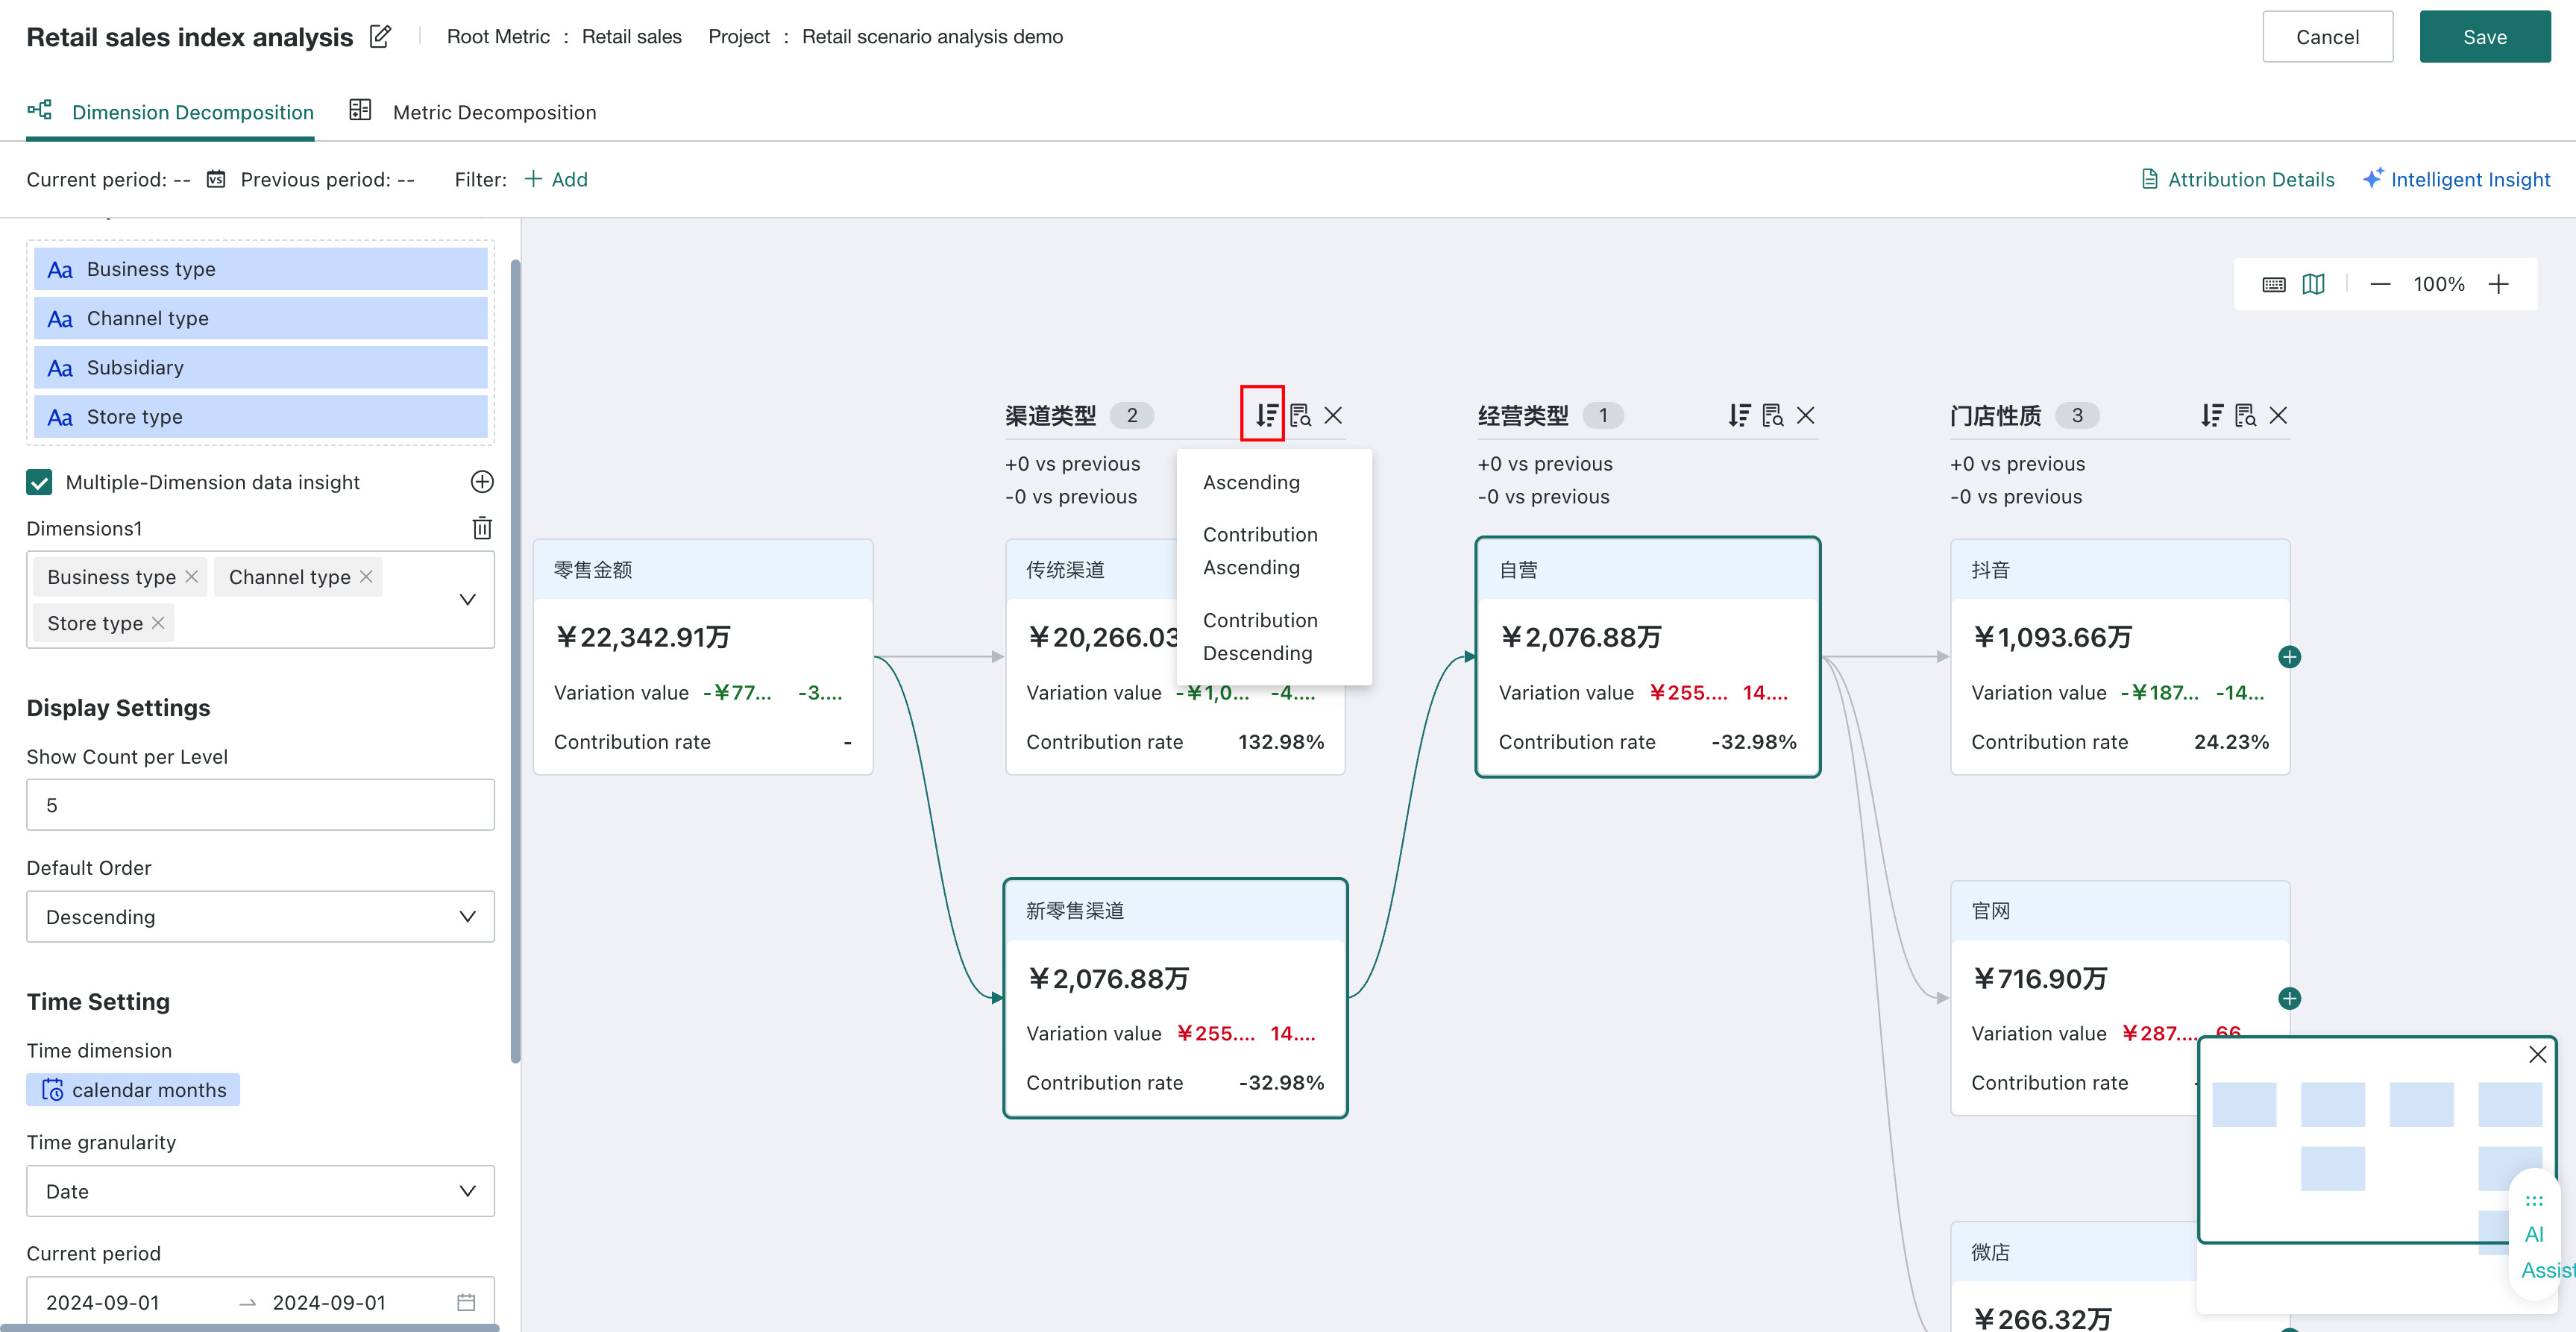
Level Sorting: Each level supports separate sorting rules, optional by metric ascending/descending, contribution ascending/descending;
-
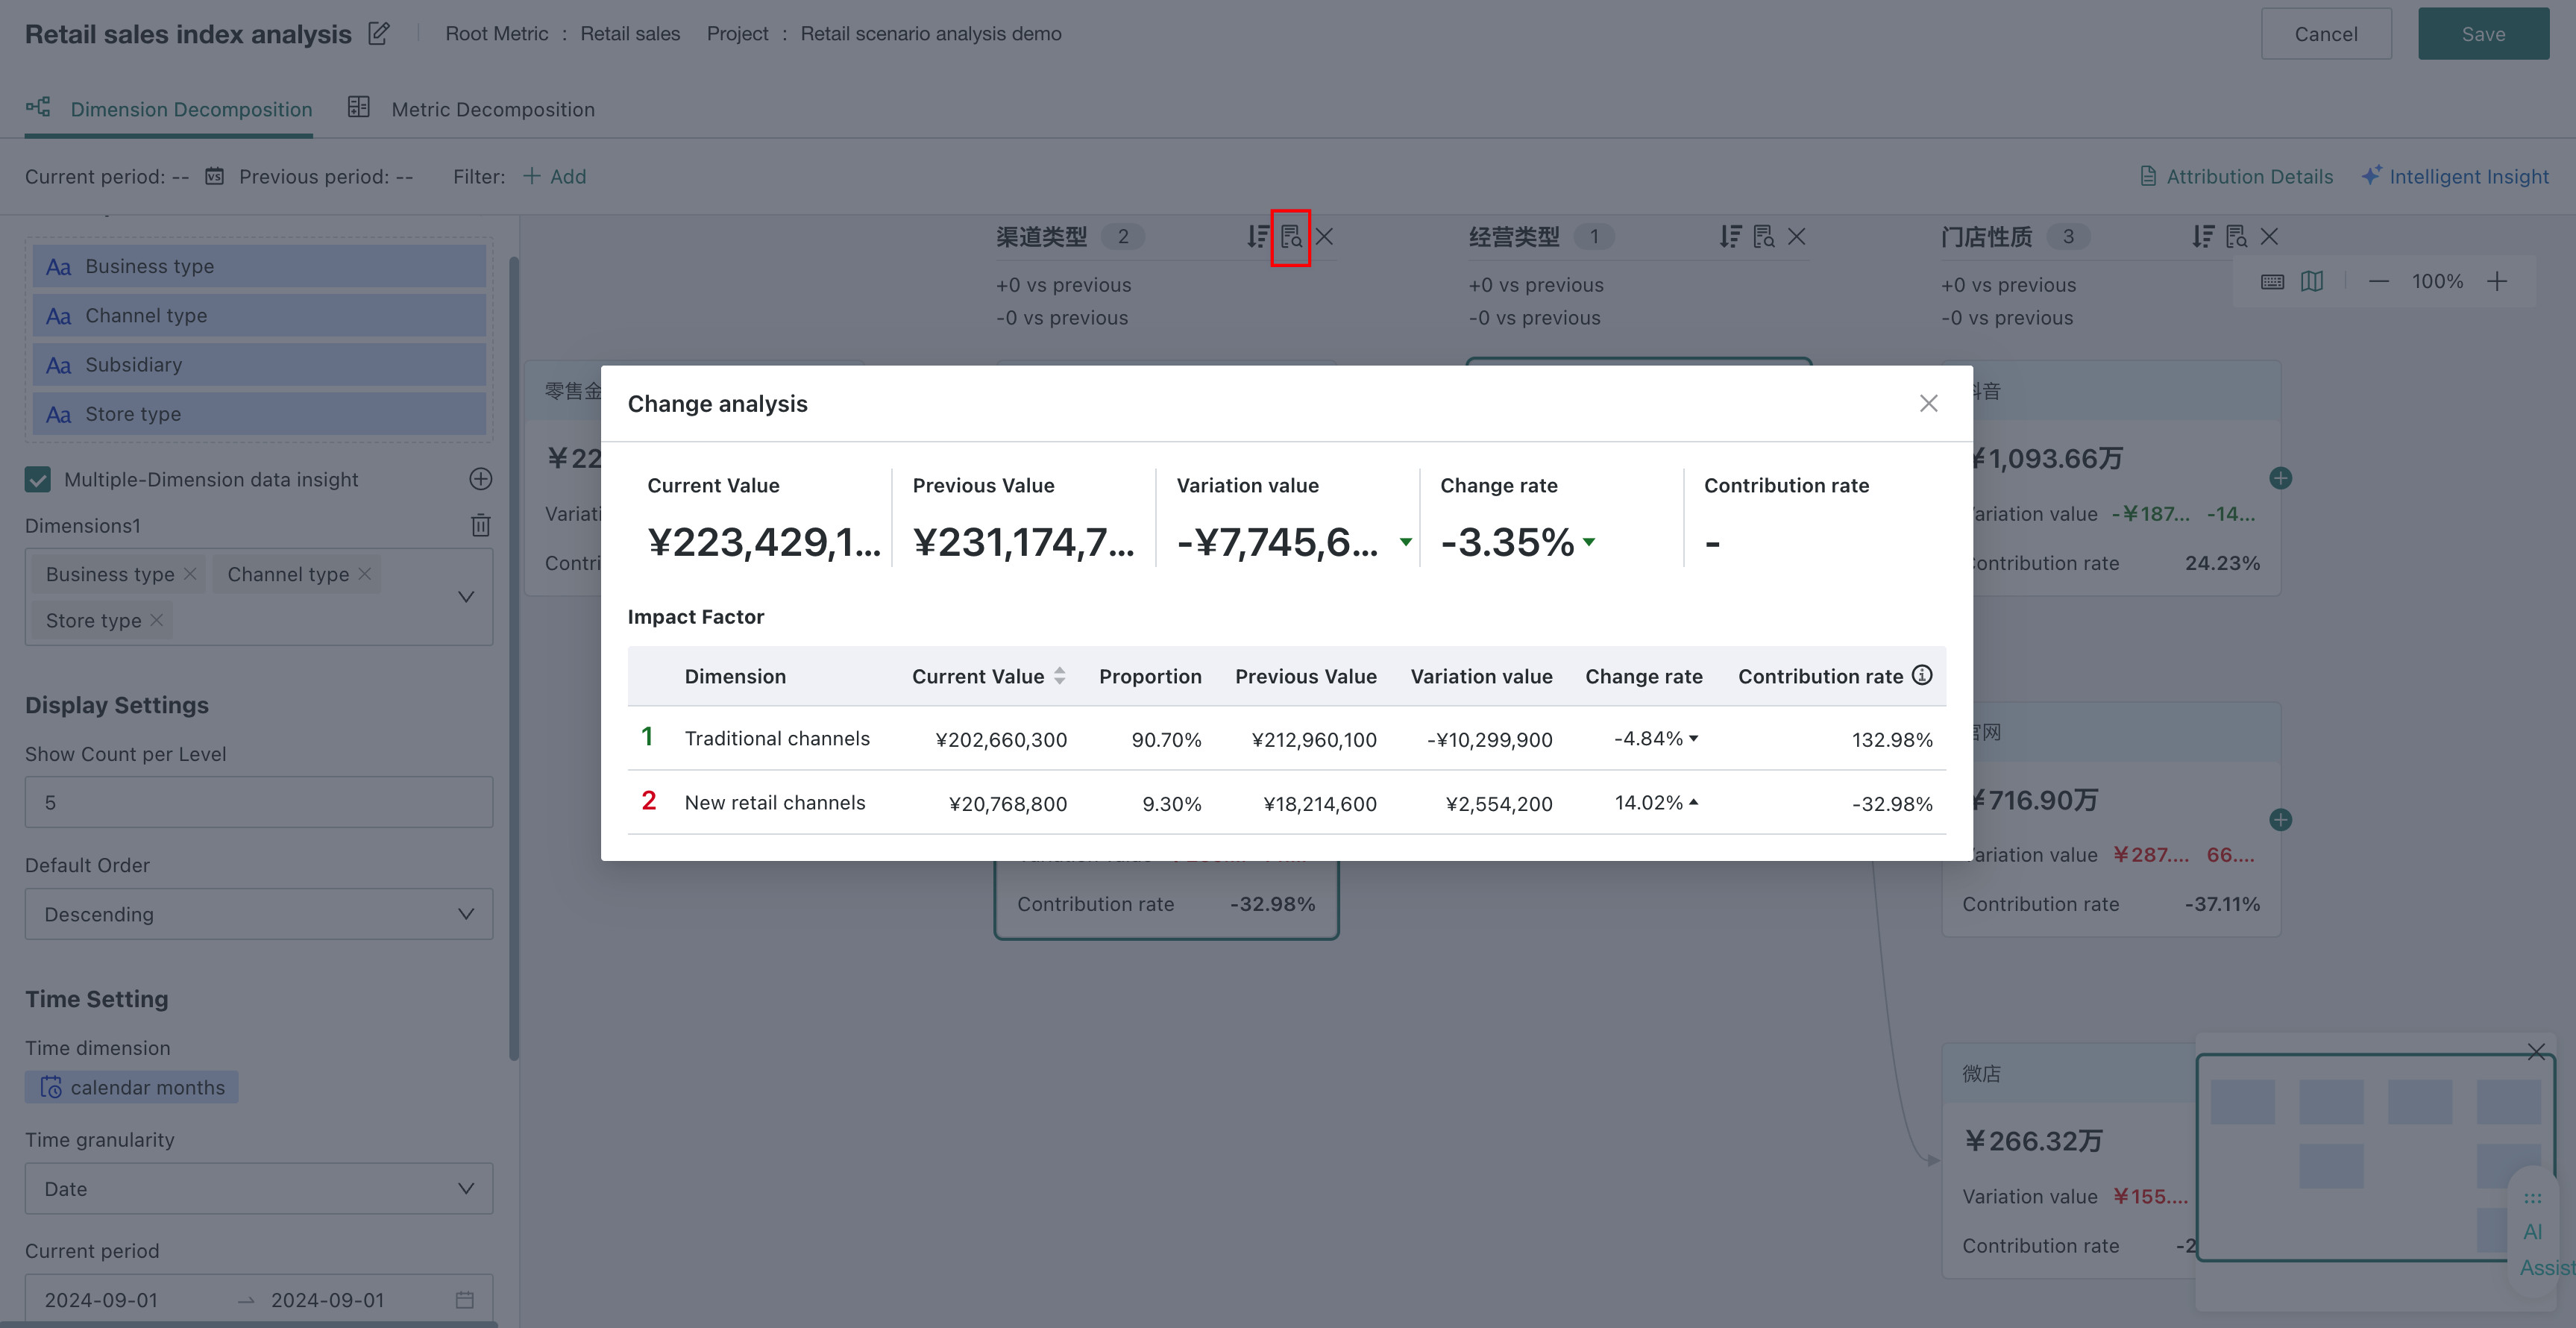
Movement Analysis: Click the node to pop up a dialog box, showing the cross-dimension attribution table (same as the intelligent attribution function).
Details View
-
Filter Bar Operation:
- Current Period and Previous Period Time: Modify the current period and previous period time to calculate the metric values and change values of each node
- Filter: Set filter conditions according to the configured dimensions (such as "Channel = Online")
-
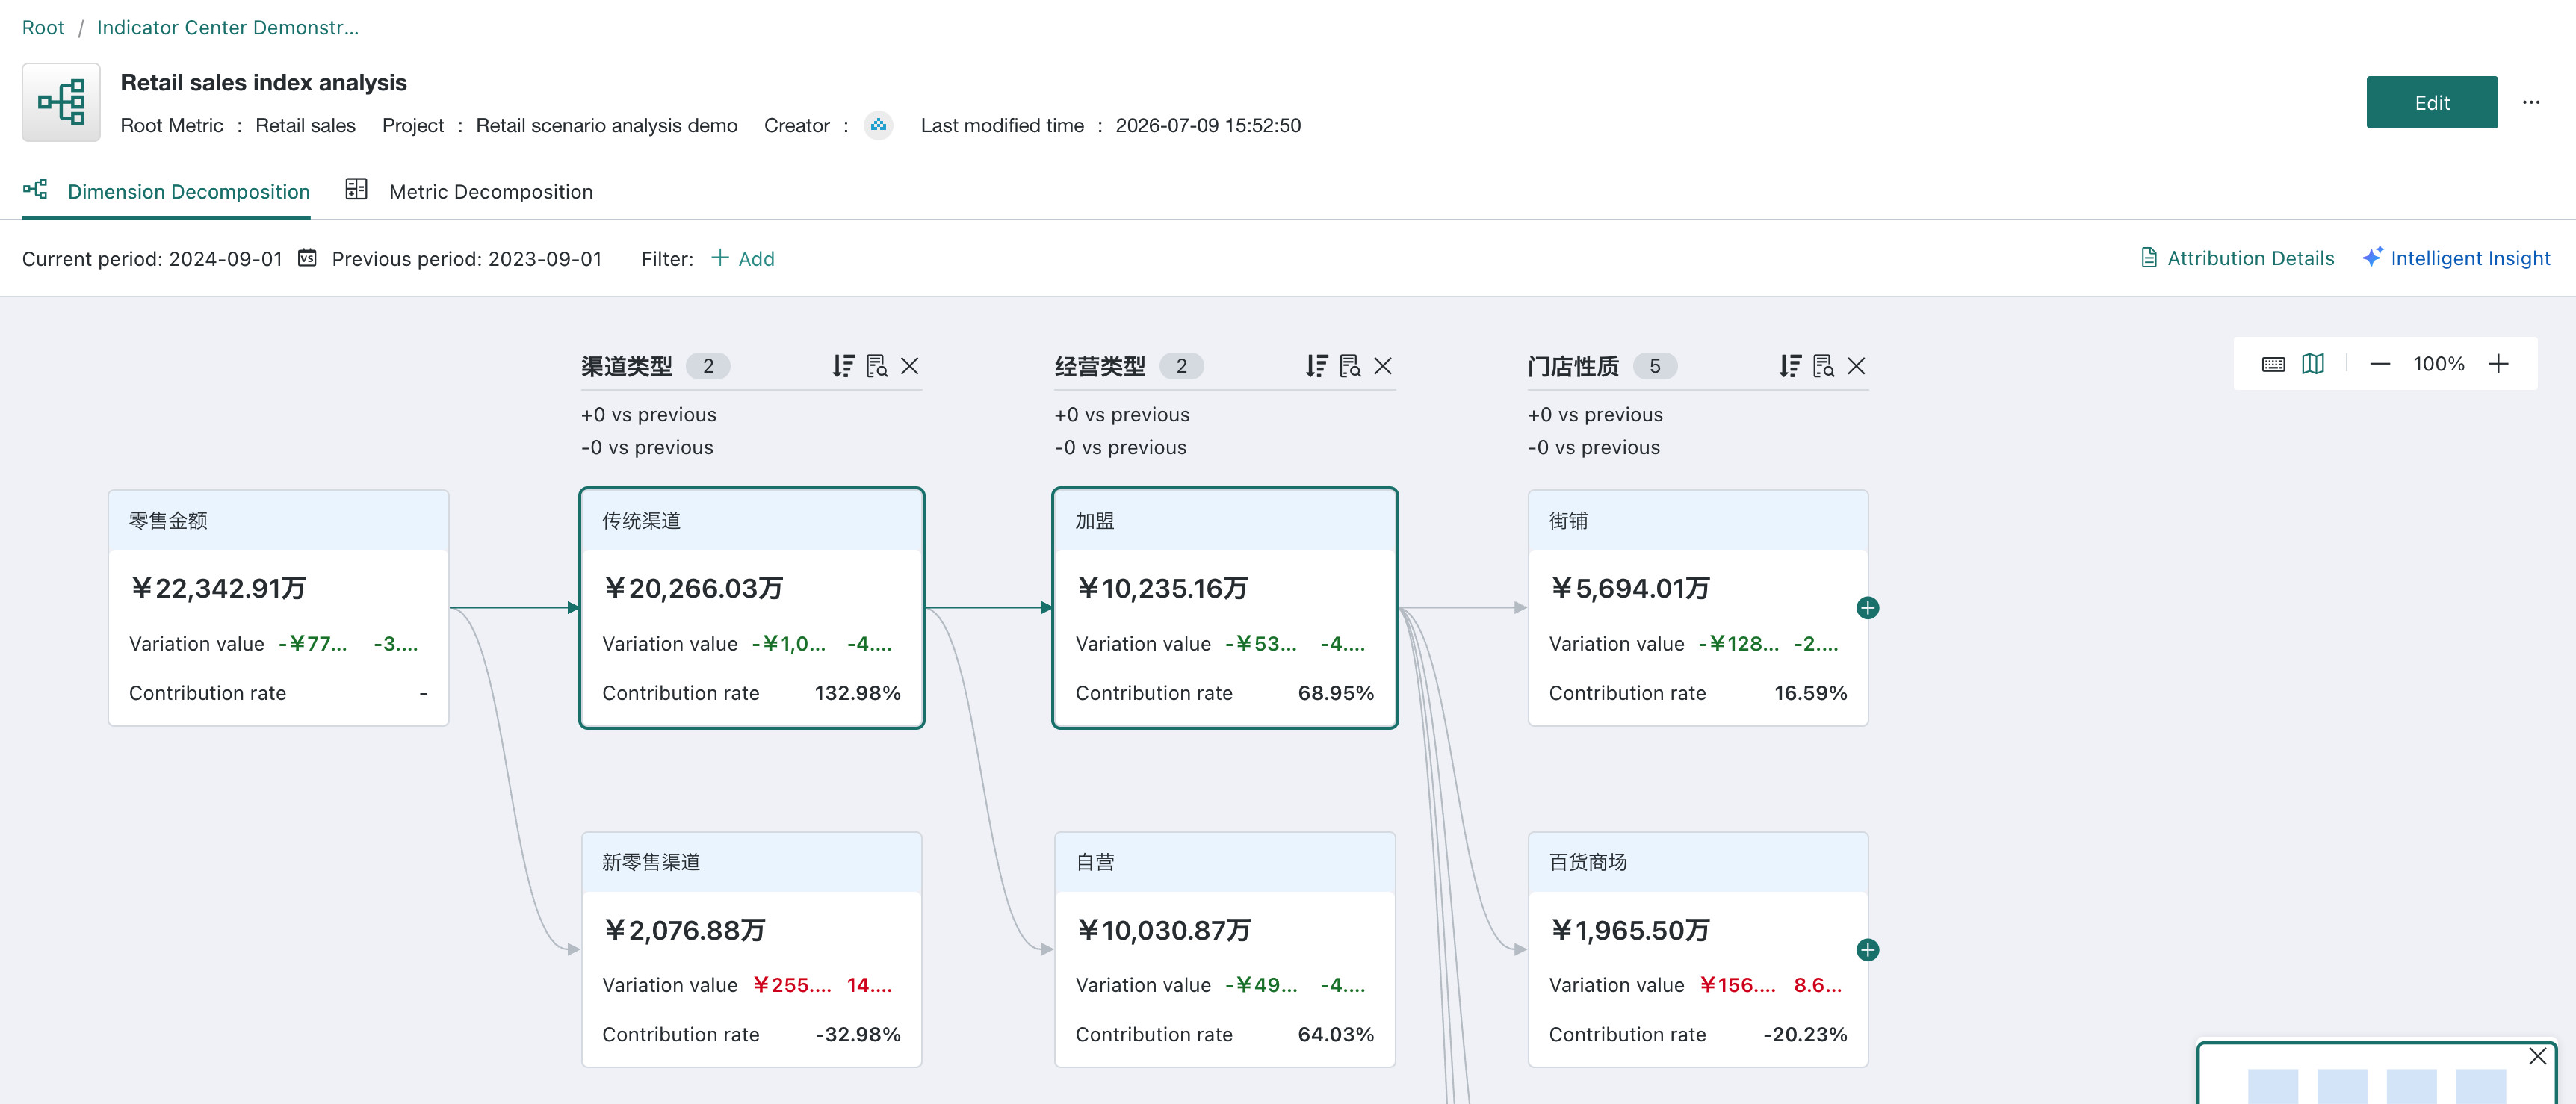
Canvas Operation: Support zoom in, zoom out, and auto layout, clearly view node metric names, metric values, YoY growth values and growth rates (default red for rising, green for falling)
Metric Decomposition Tree Configuration and Operation
Global Settings
- Time Settings: Consistent with the time setting rules of the dimension decomposition tree; metrics without time dimensions cannot be configured;
- Comparison Settings: Consistent with the rules of the dimension decomposition tree. After enabling, each node will calculate the change value compared with the comparison time
- Support enabling/disabling the comparison function. When there is no time dimension or the main metric is a YoY/MoM derived metric, it cannot be enabled;
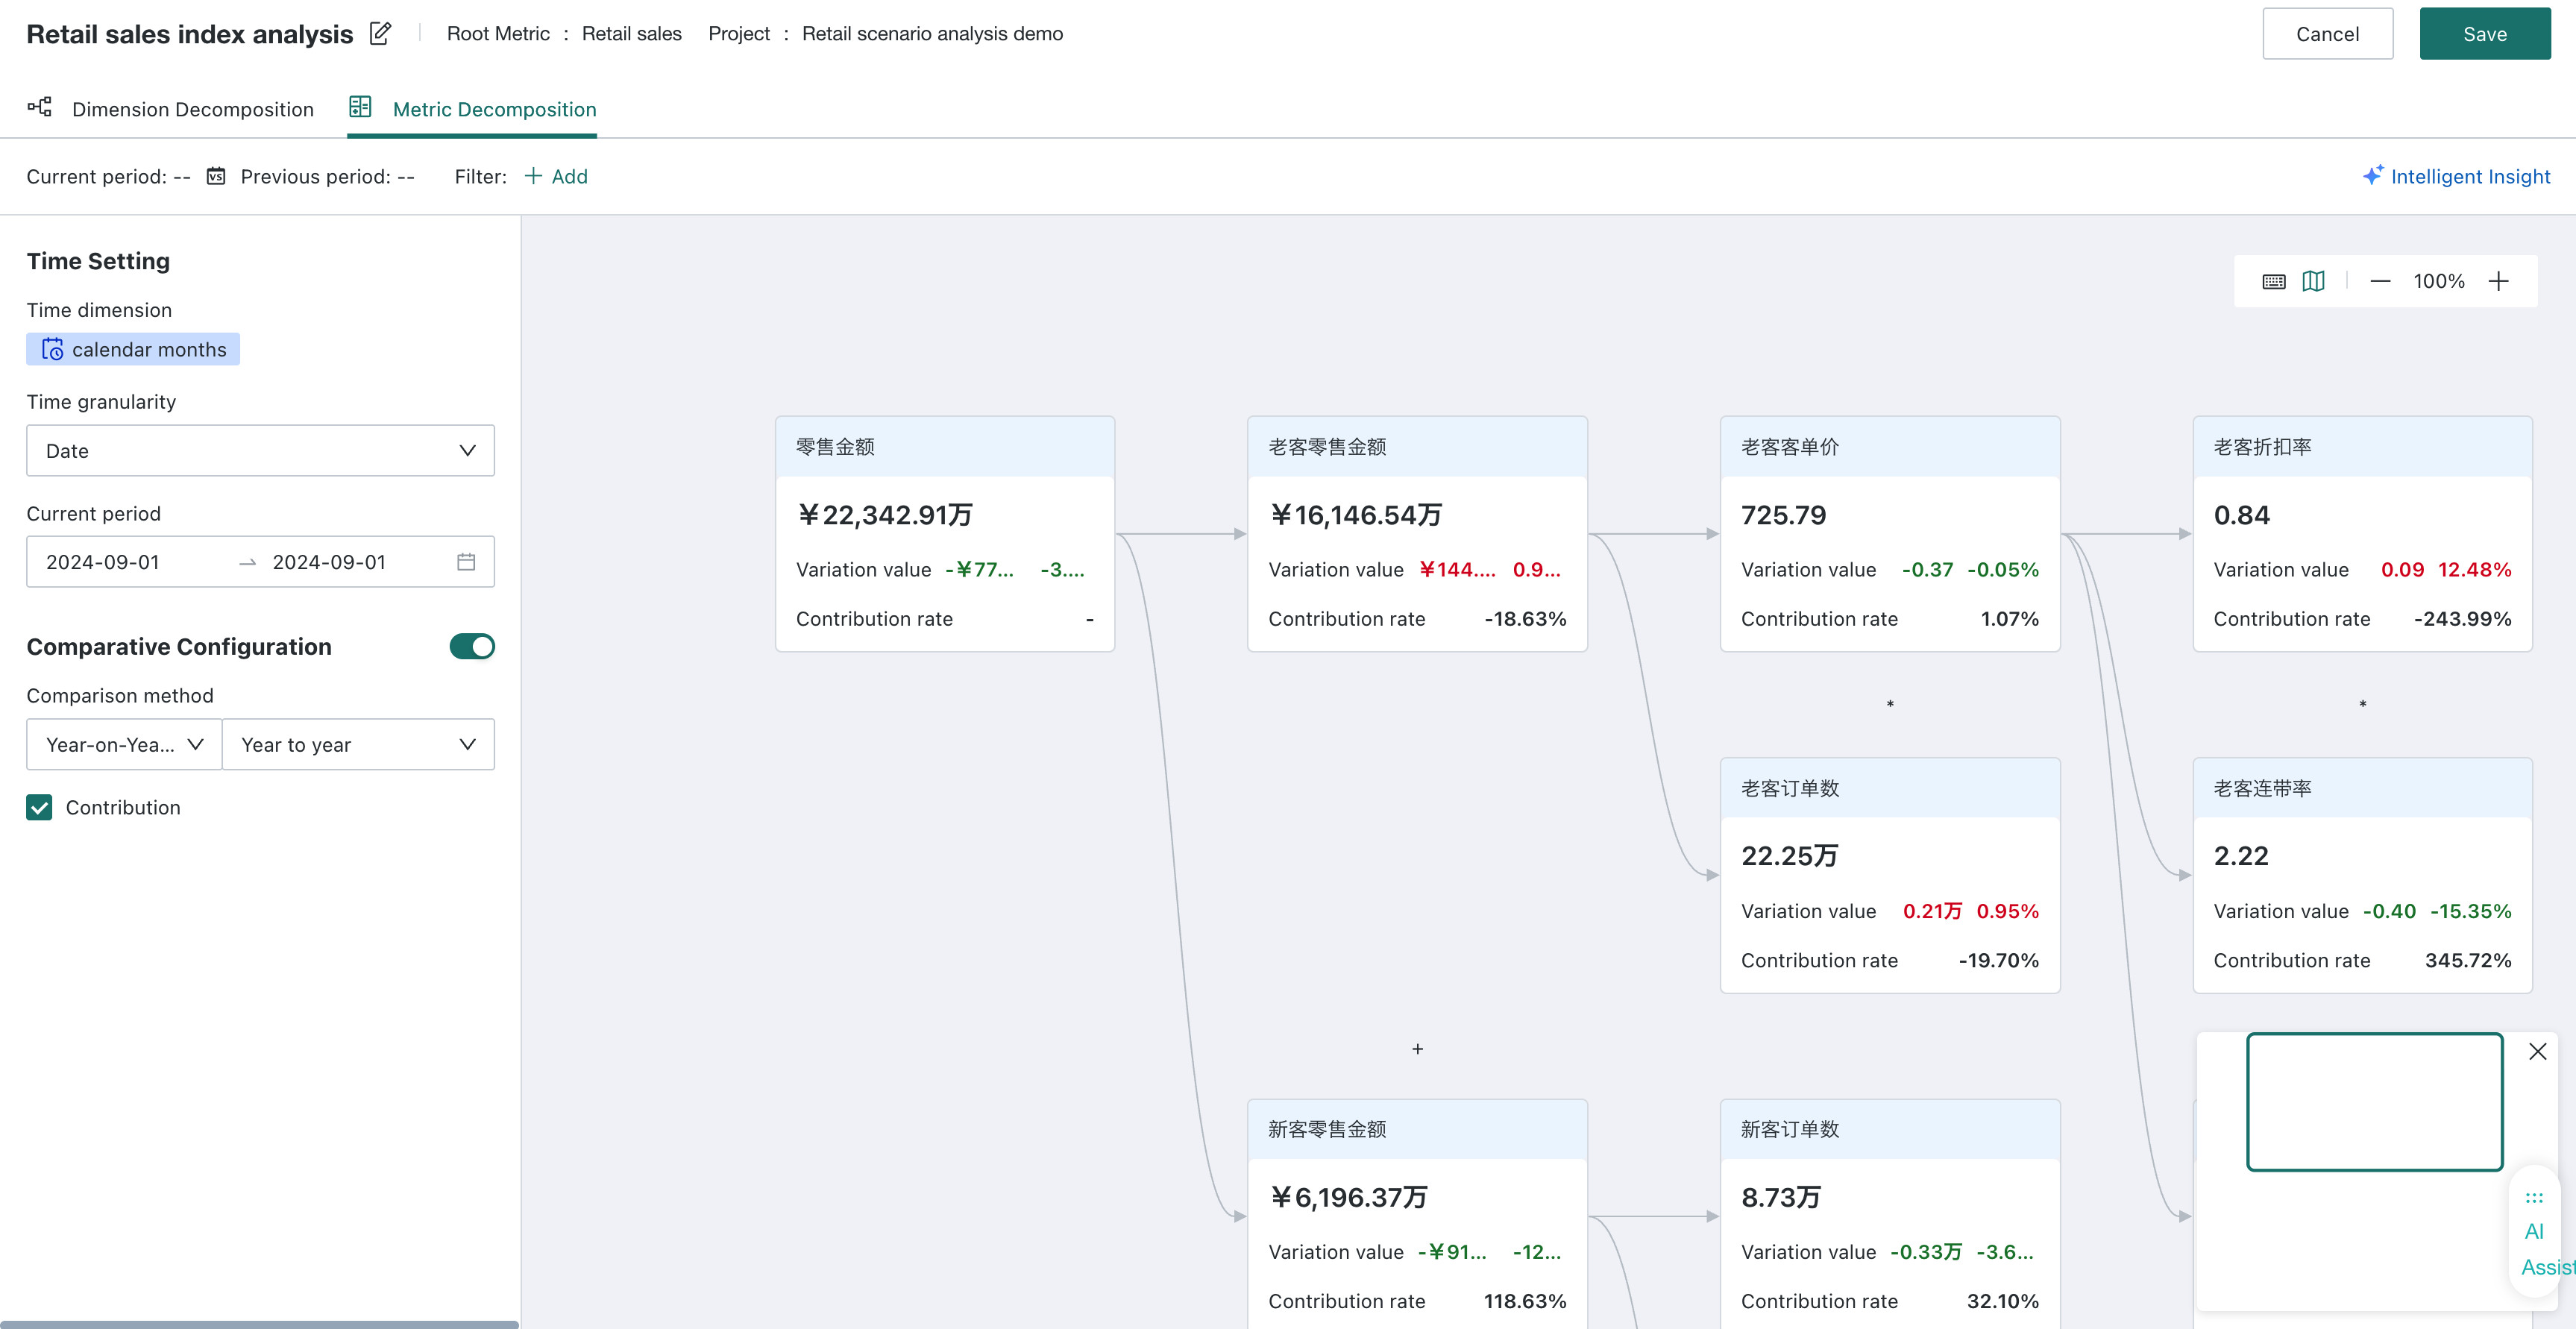
- Contribution Rate: Enabled by default, automatically calculate the contribution rate of each lower-level metric to the upper-level node metric.
Node Configuration
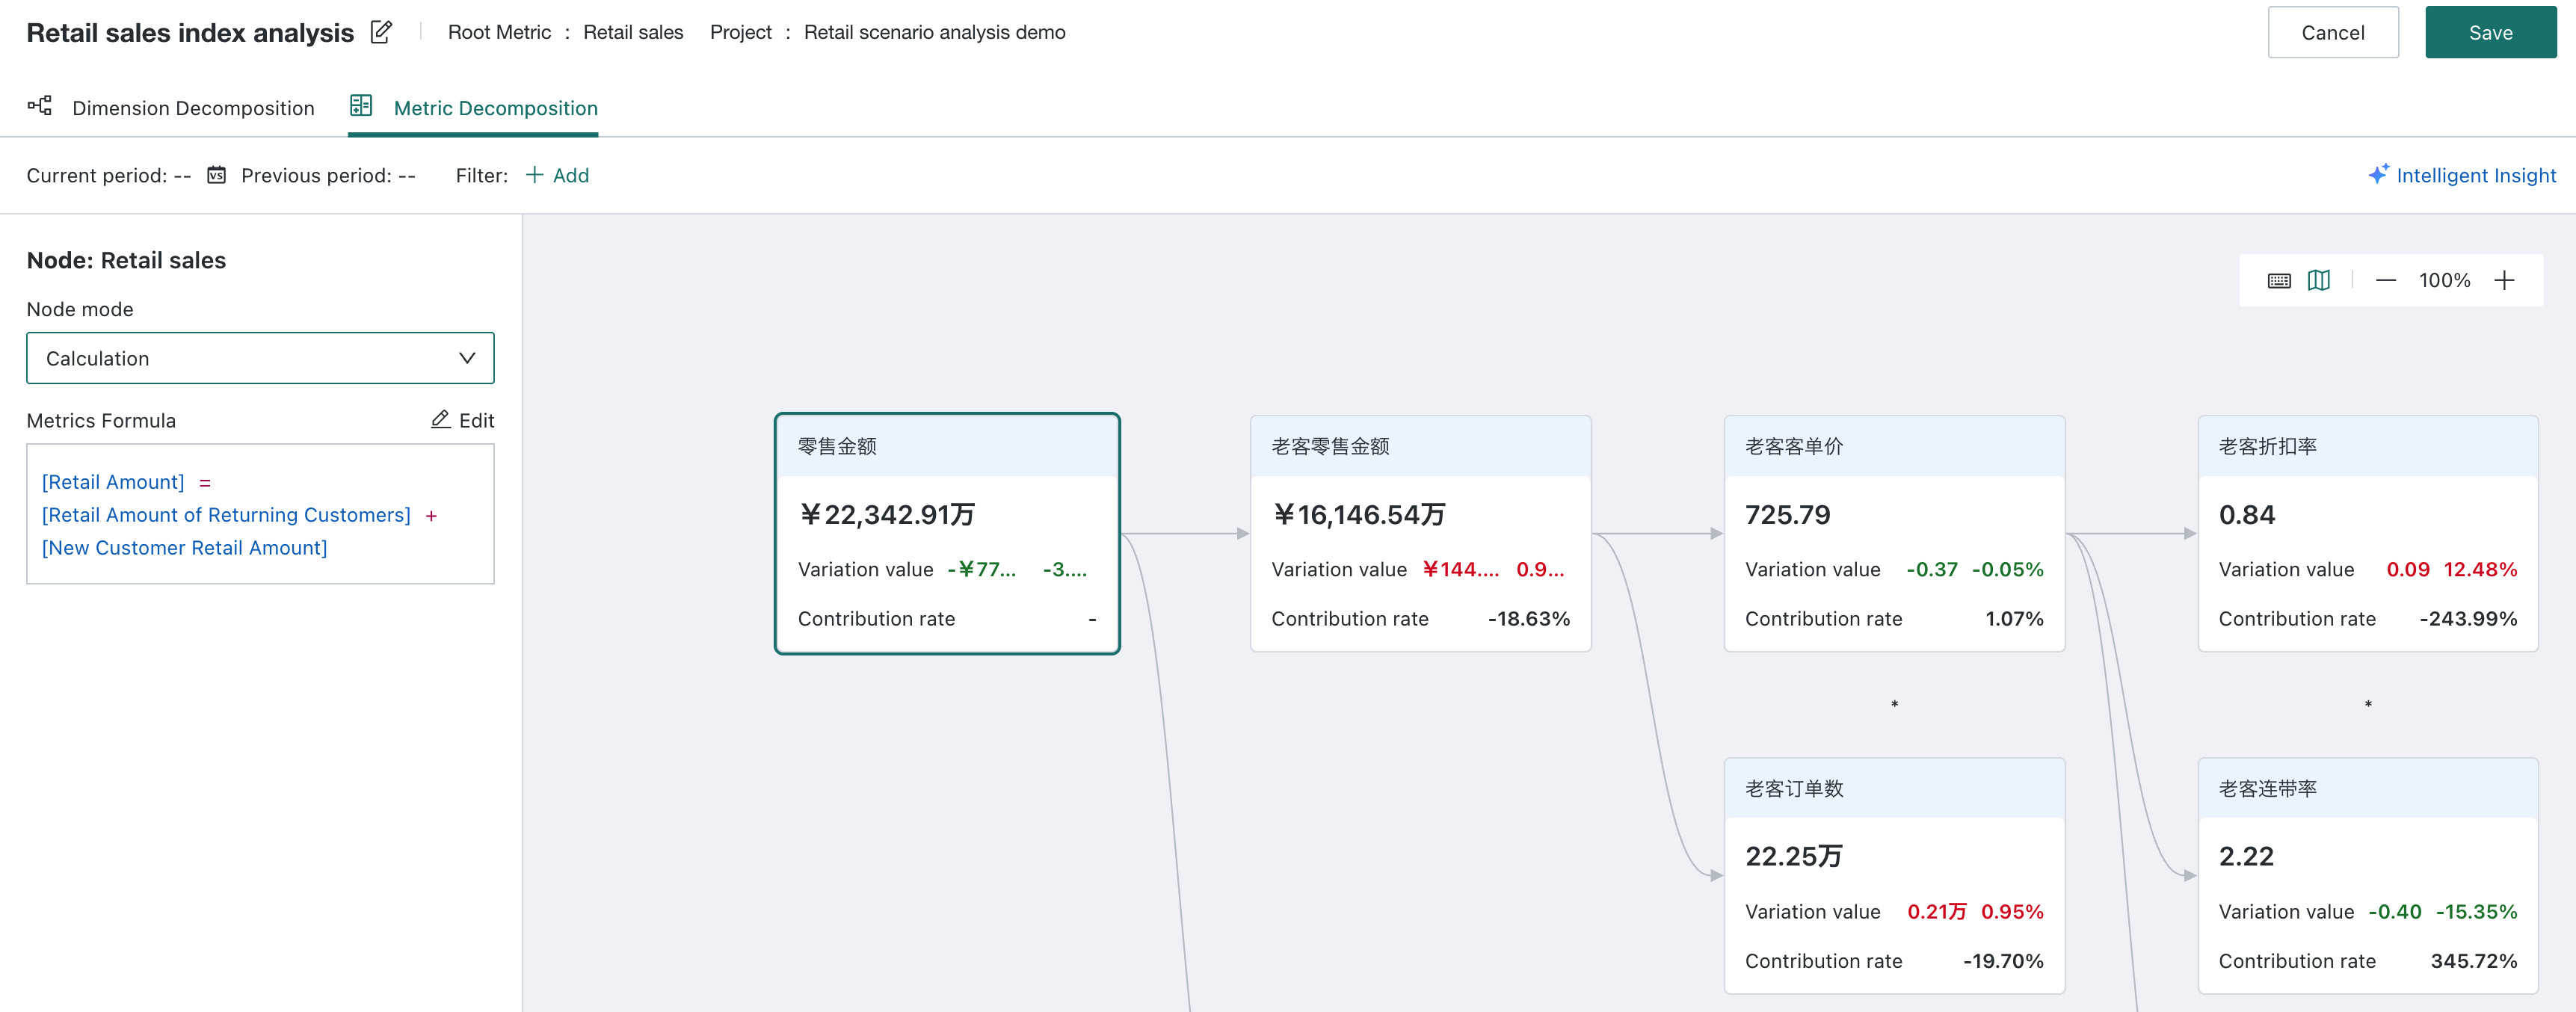
- Node Creation: The canvas defaults to displaying the main metric node. Click the node to pop up node configuration
- Lower-Level Mode:
- Relationship Mode: When "Relationship" is selected, select downstream metrics from the same topic to establish associations;
- Calculation Mode: When "Calculation" is selected, maintain the metric formula (only +, -, *, / are supported);
- Node Display: Each node displays the metric name, metric value, YoY growth value and growth rate (default rule: red for rising, green for falling).
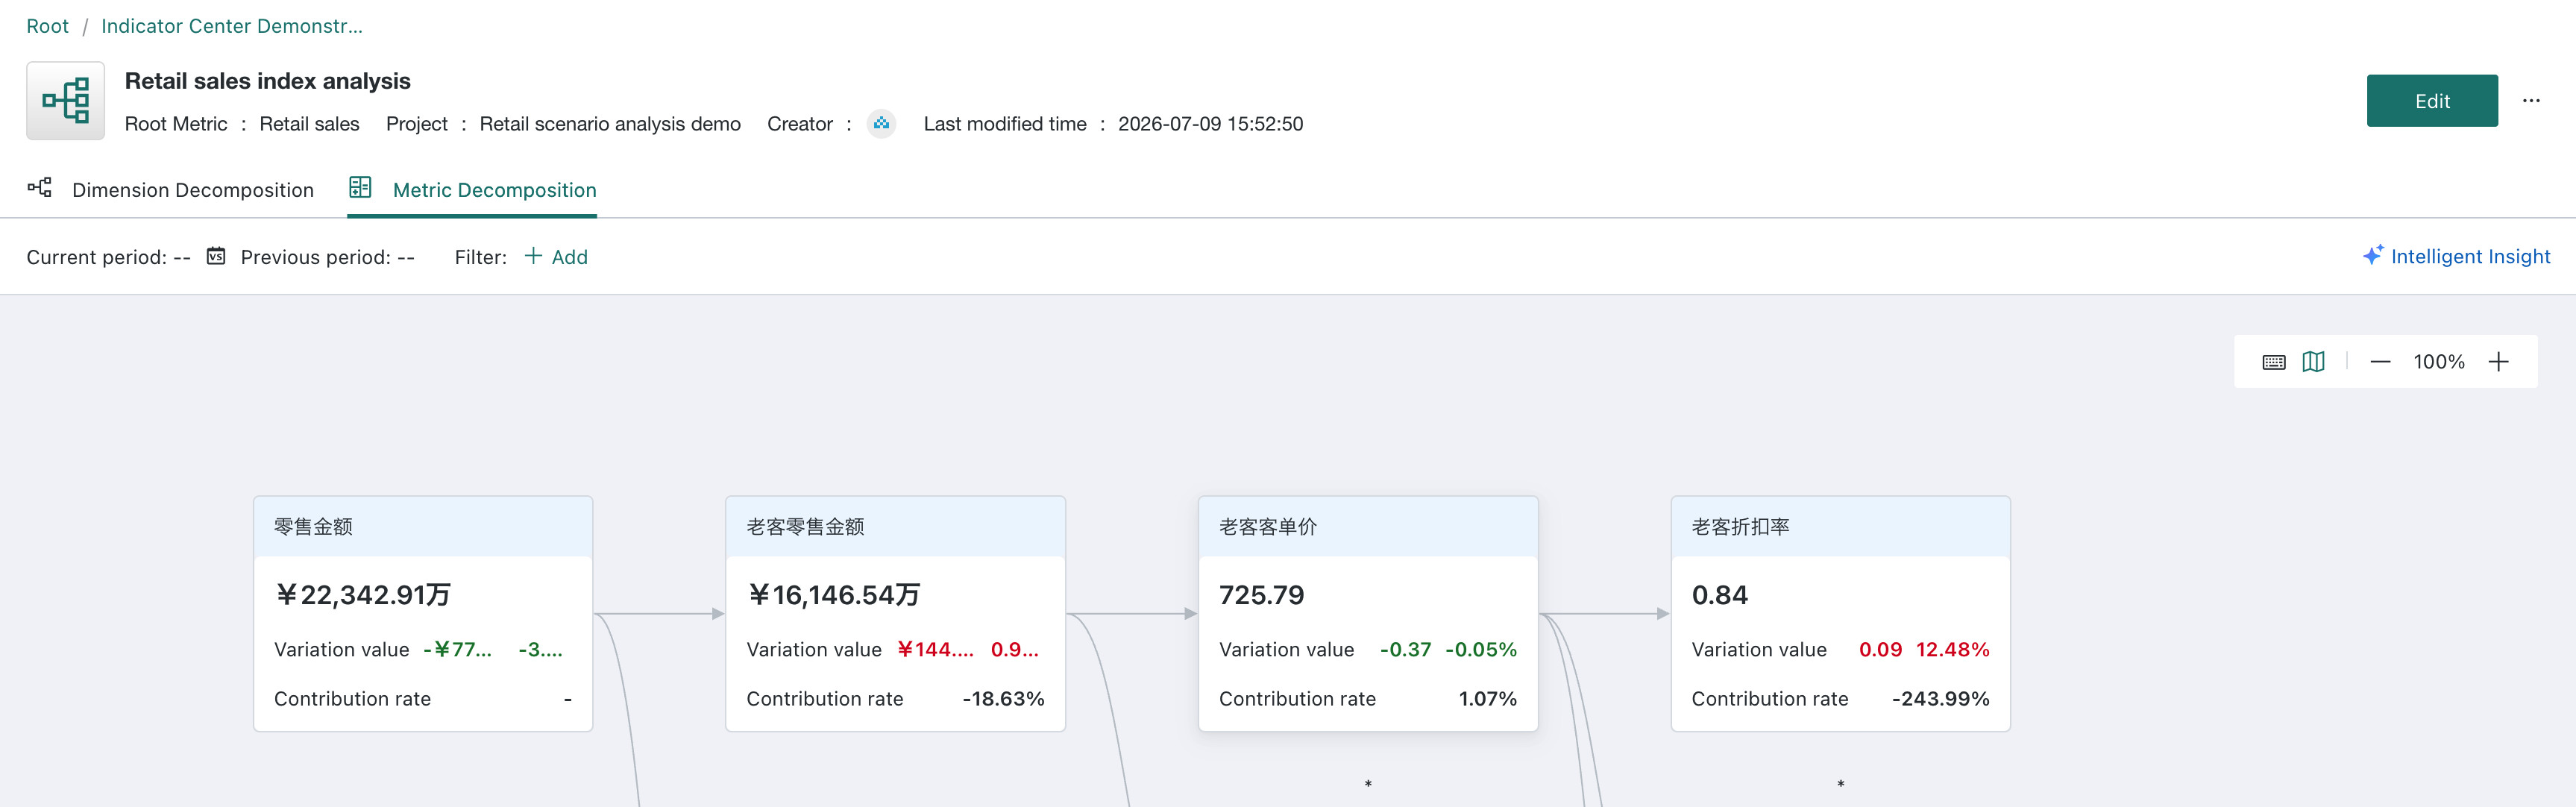
Details View
- Filter Bar Operation: Supports time range modification, comparison method selection, and public dimension filtering (such as channel, region, etc.);
- Canvas Operation: Support zoom in, zoom out, and auto layout, view the hierarchical structure and data of the metric tree;
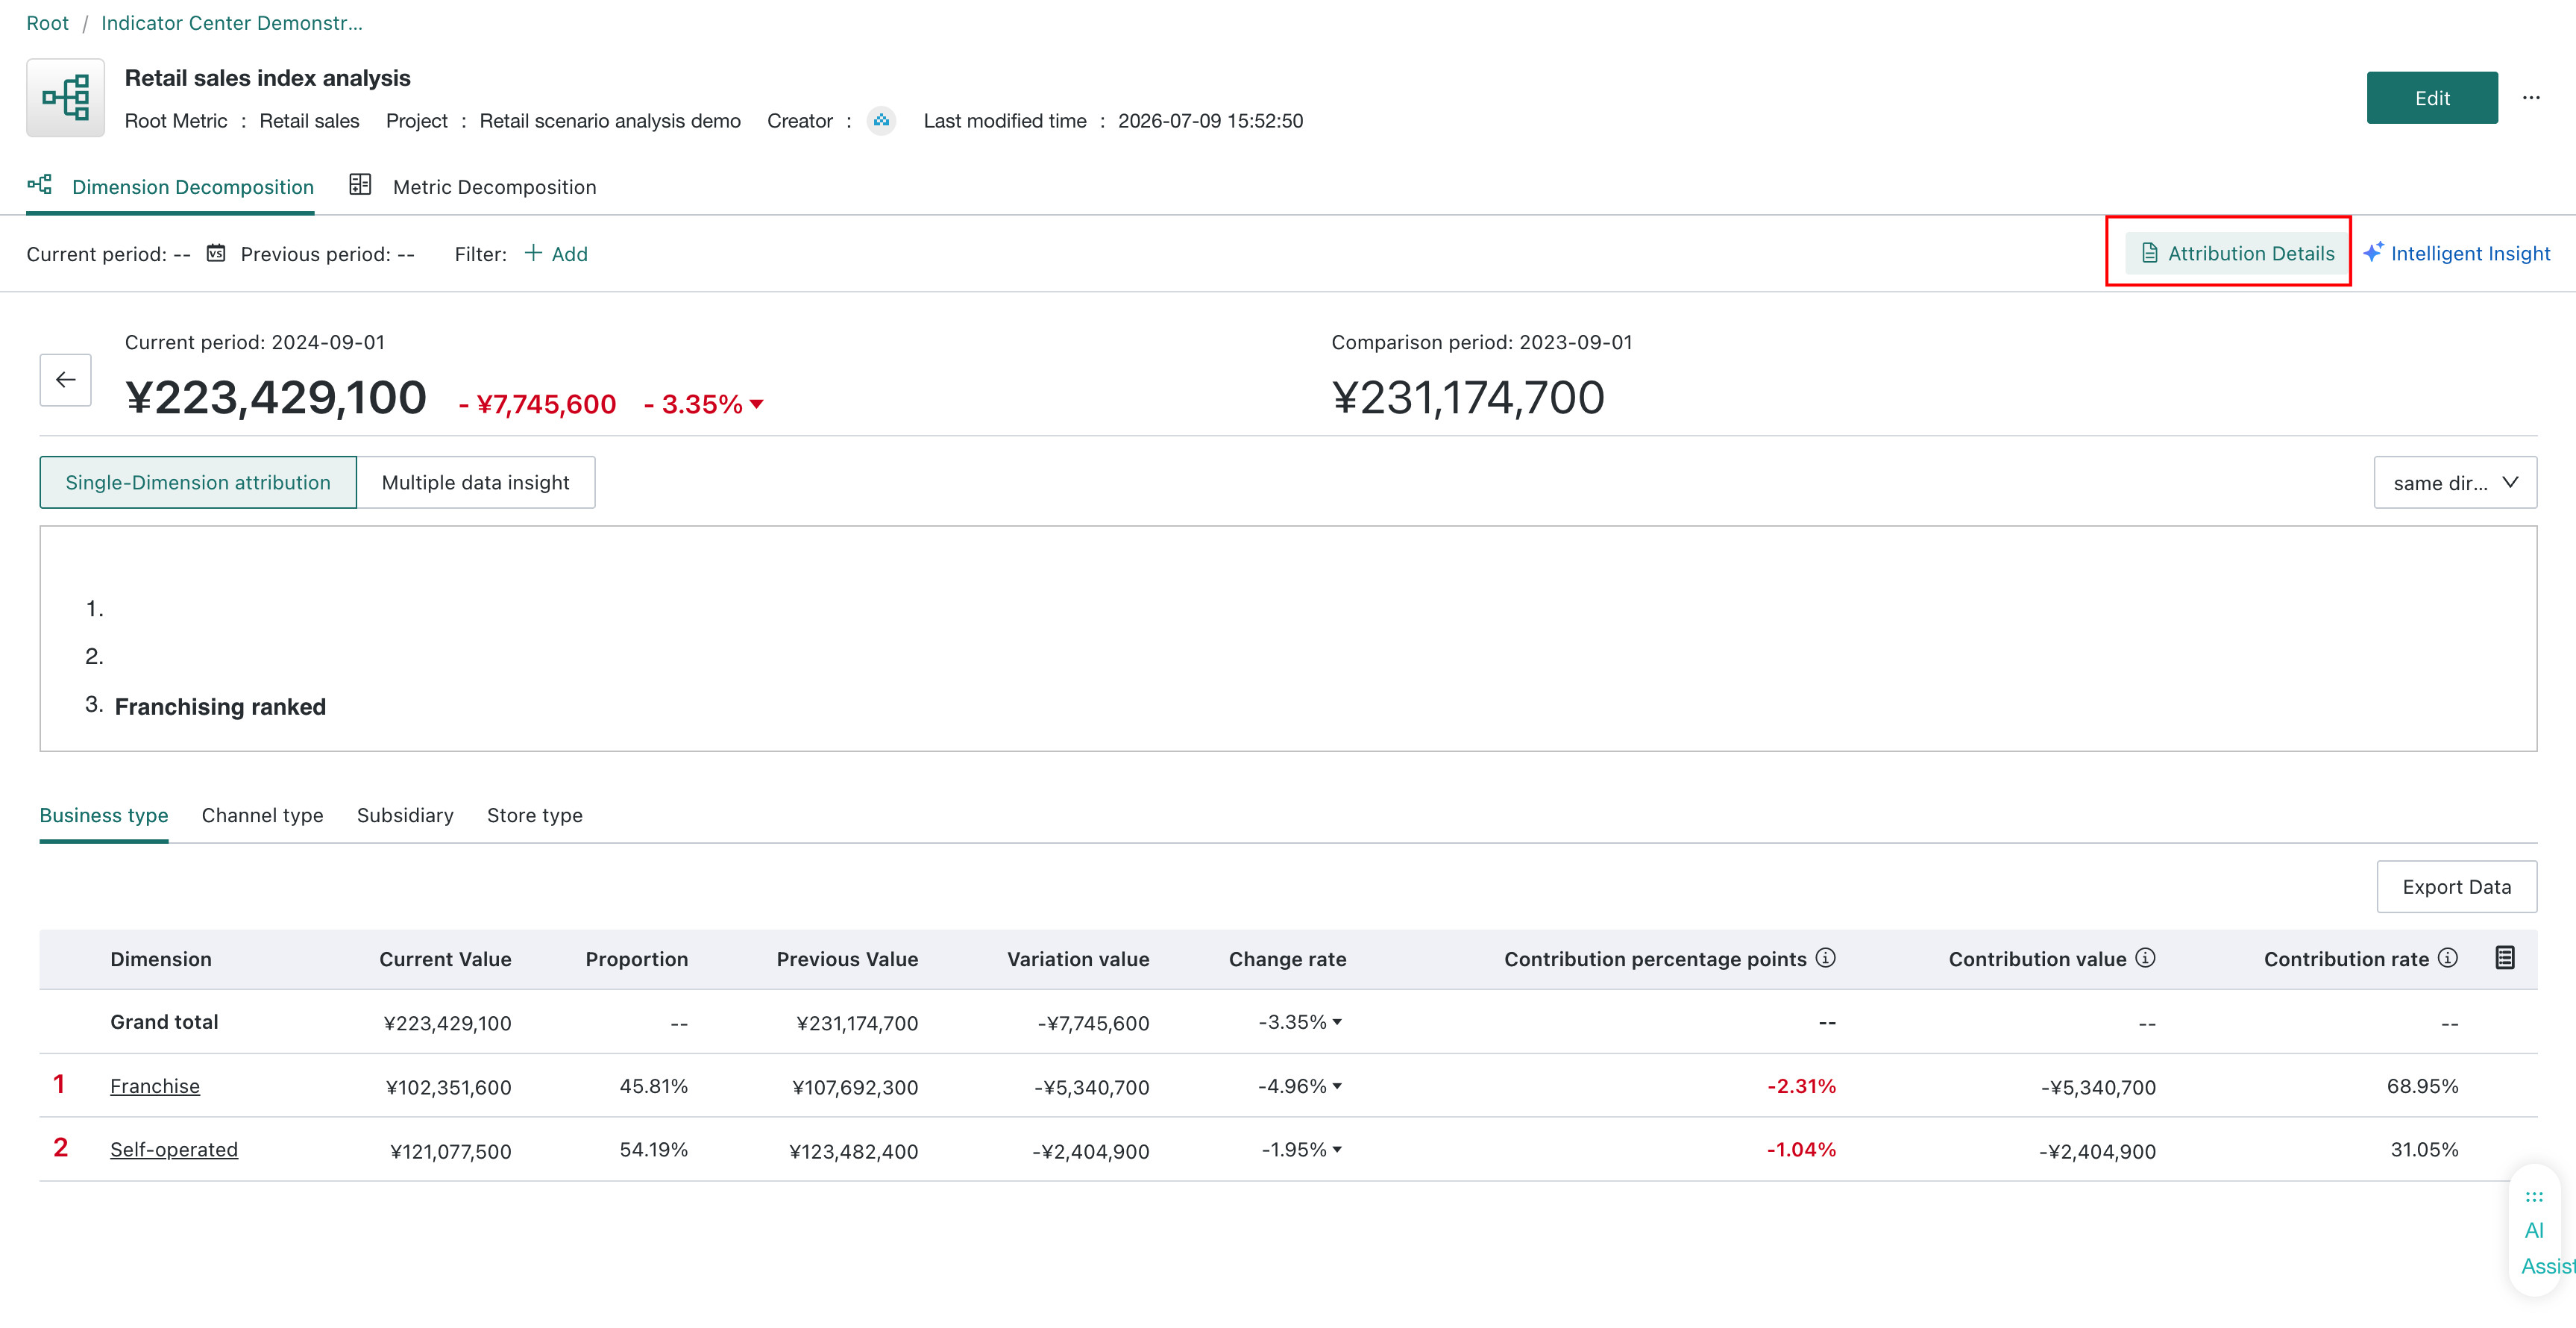
Attribution Details
Prerequisite: The Contribution switch has been turned on in Dimension Decomposition Tree Configuration and Operation.
Click "Attribution Details" at the top of the detail page to view the contribution analysis of the current metric after dimension decomposition.
Supports "Single Dimension Attribution" and "Cross Dimension Attribution"; before using cross-dimension attribution, you need to configure cross-dimensions in Left Global Settings.
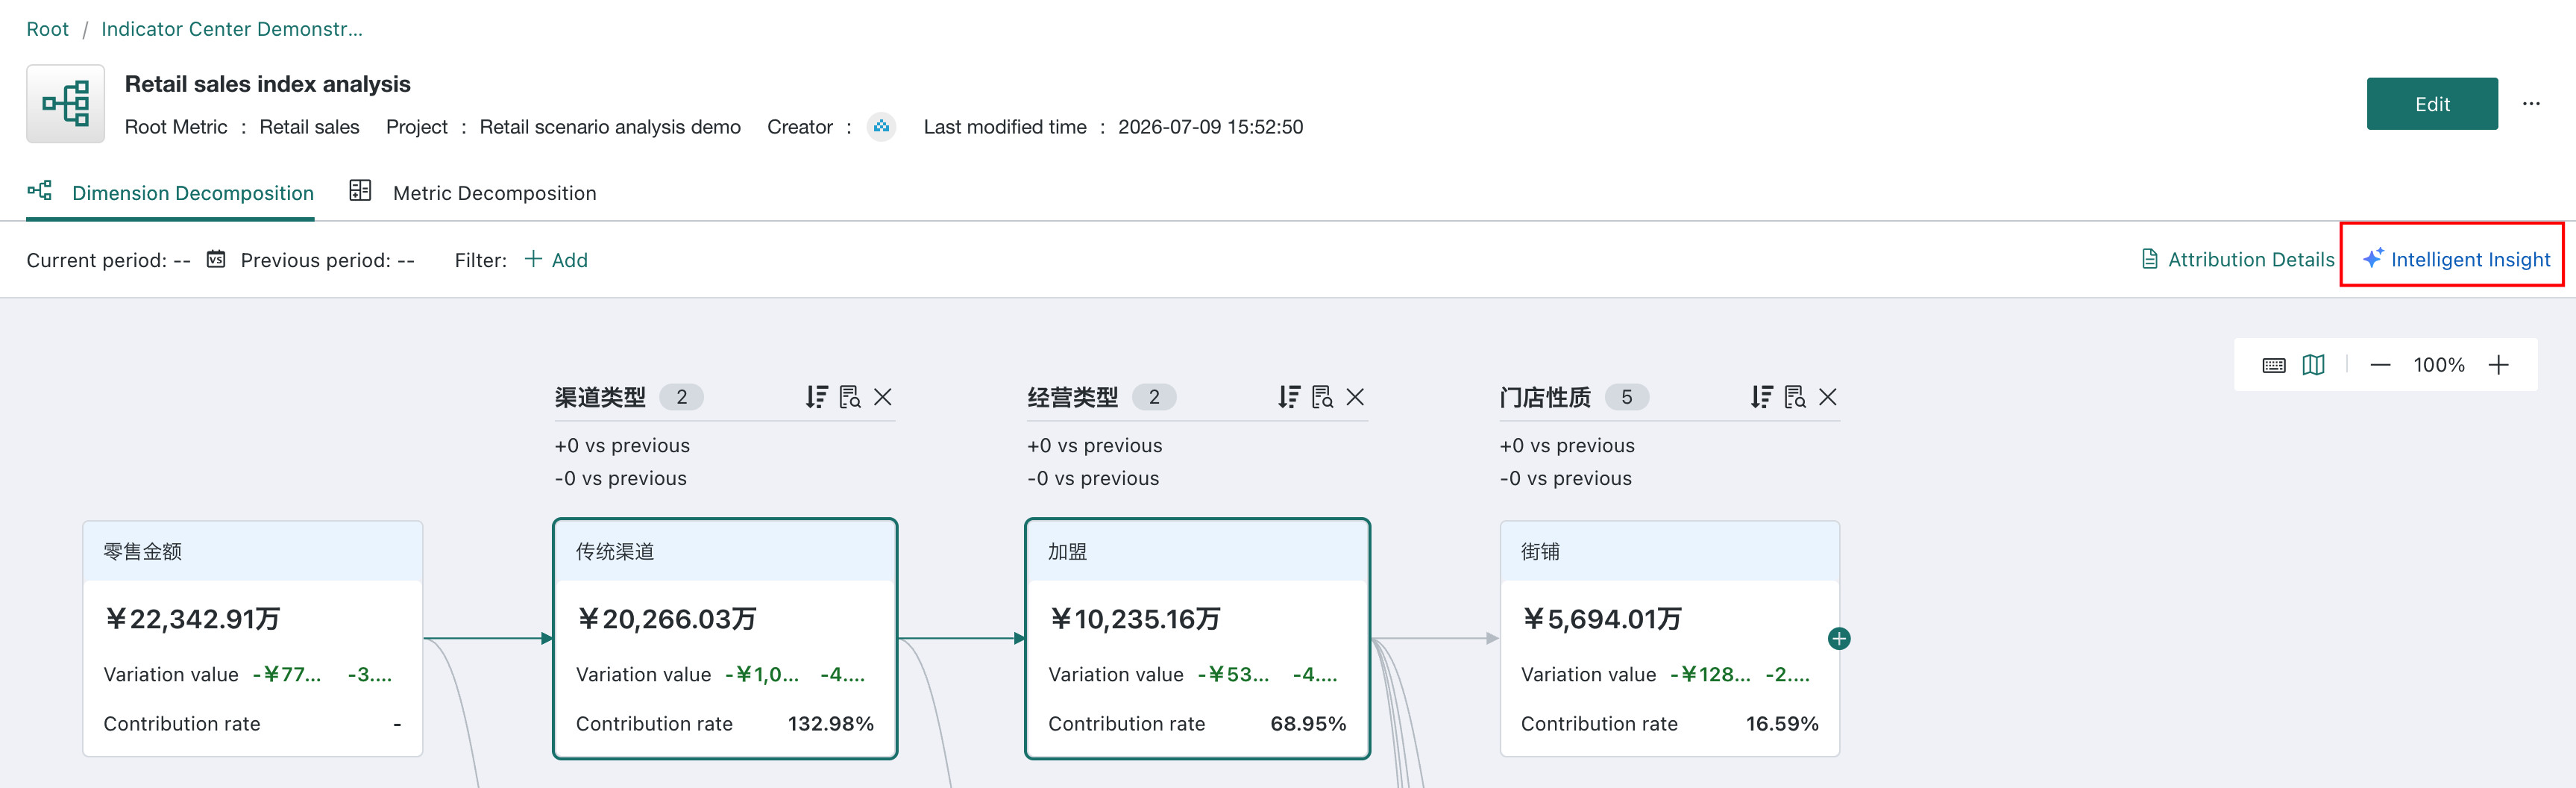
Intelligent Insight
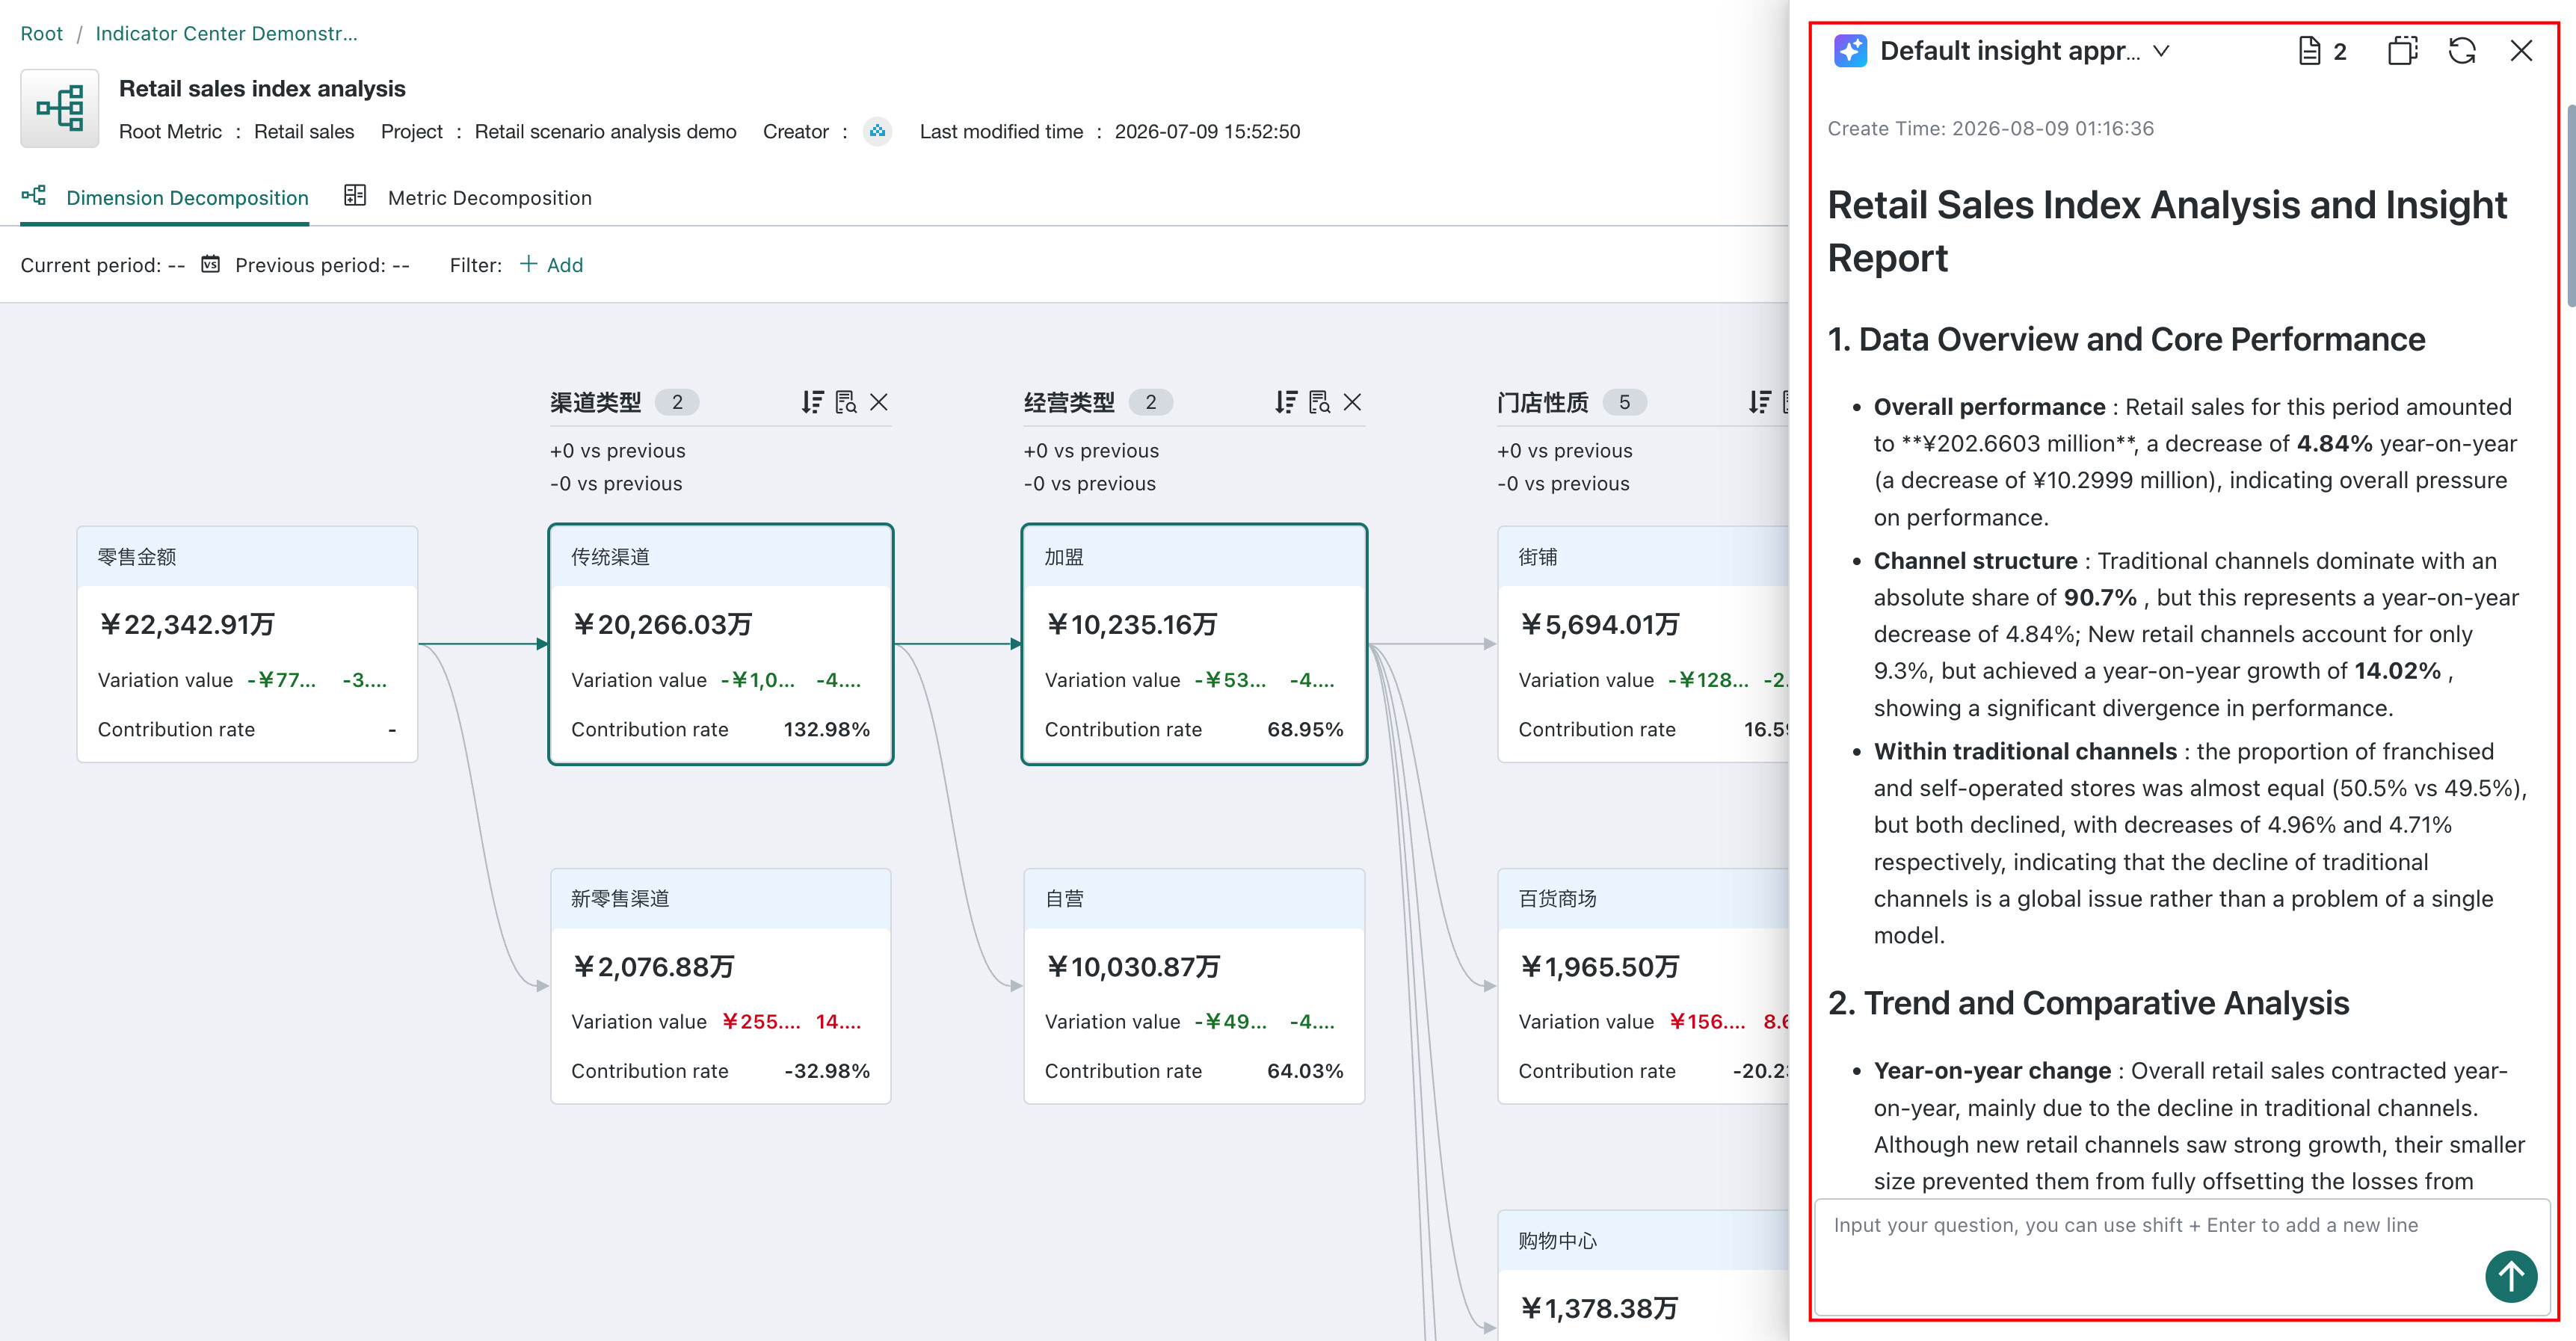
Click "Intelligent Insight" to pop up an insight report, view the analysis conclusions and suggestions based on full data.
This feature is a paid add-on module. You need to purchase Dashboard Insight. If you need to use it, please contact the sales team for purchase.
Metric Attribution Contribution Calculation Description
Overall Description
Dimension Decomposition Attribution
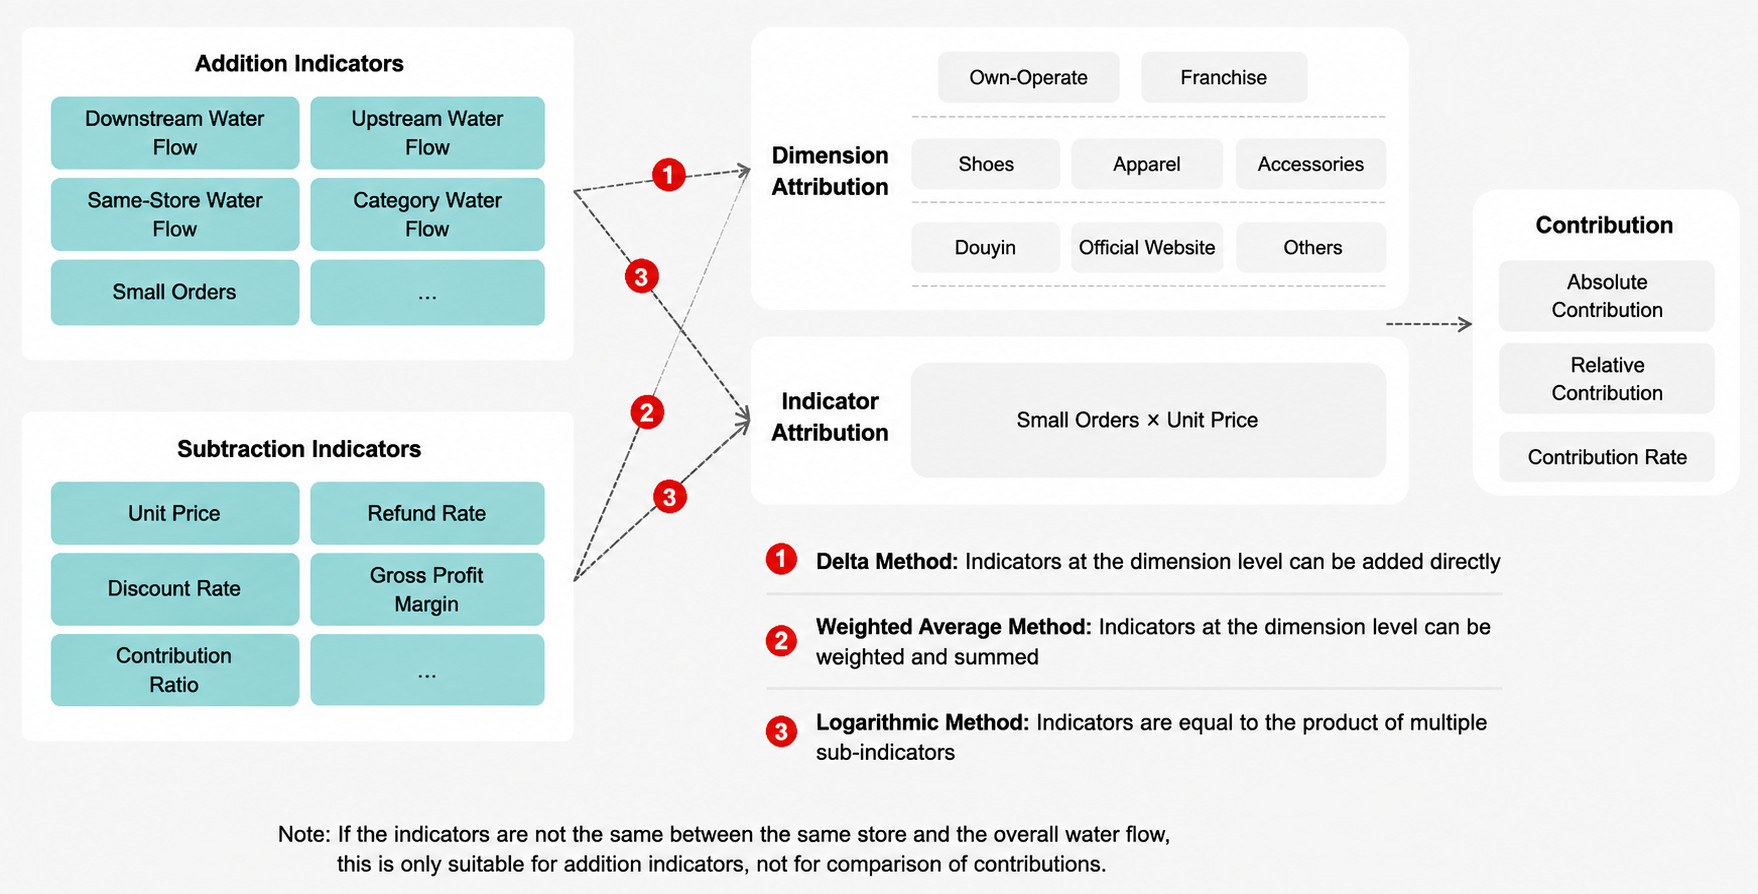
The dimension decomposition tree supports dimension attribution, that is, calculating dimension contributions
| Metric Type | Contribution Calculation Logic | Contribution Calculation Method |
|---|---|---|
| Atomic Metric | Select algorithm according to the aggregation method of the atomic metric | |
| Derived Metric | Derivation method: YoY/MoM, Combined Derivation | Attribution not supported |
| Derivation method: End Value, Recent N Days, Cumulative Calculation Select algorithm according to the aggregation method of the source metric | ||
| Composite Metric | Select algorithm according to the addition, subtraction, multiplication, and division of the calculation formula and the aggregation method of the atomic metric | Example: |
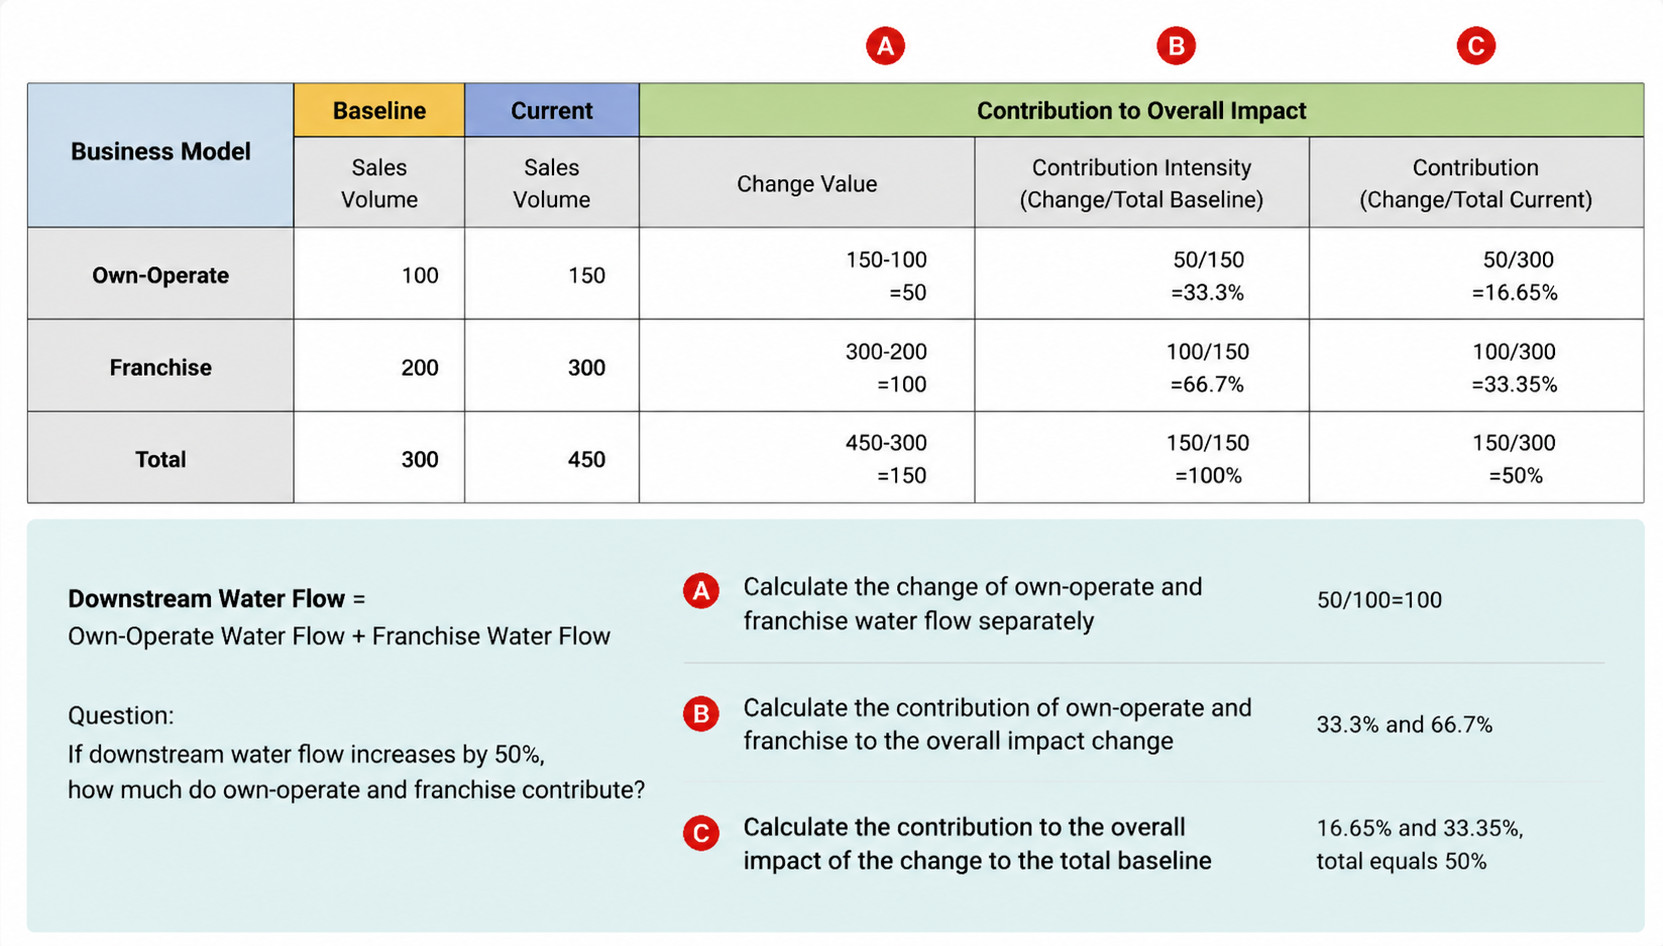
Example 1: Addition Algorithm
Atomic Metric Sales Volume = sum (Field Sales Volume)
Sales Volume = Self-Operated Sales Volume + Franchise Sales Volume
Example 2: Division Algorithm
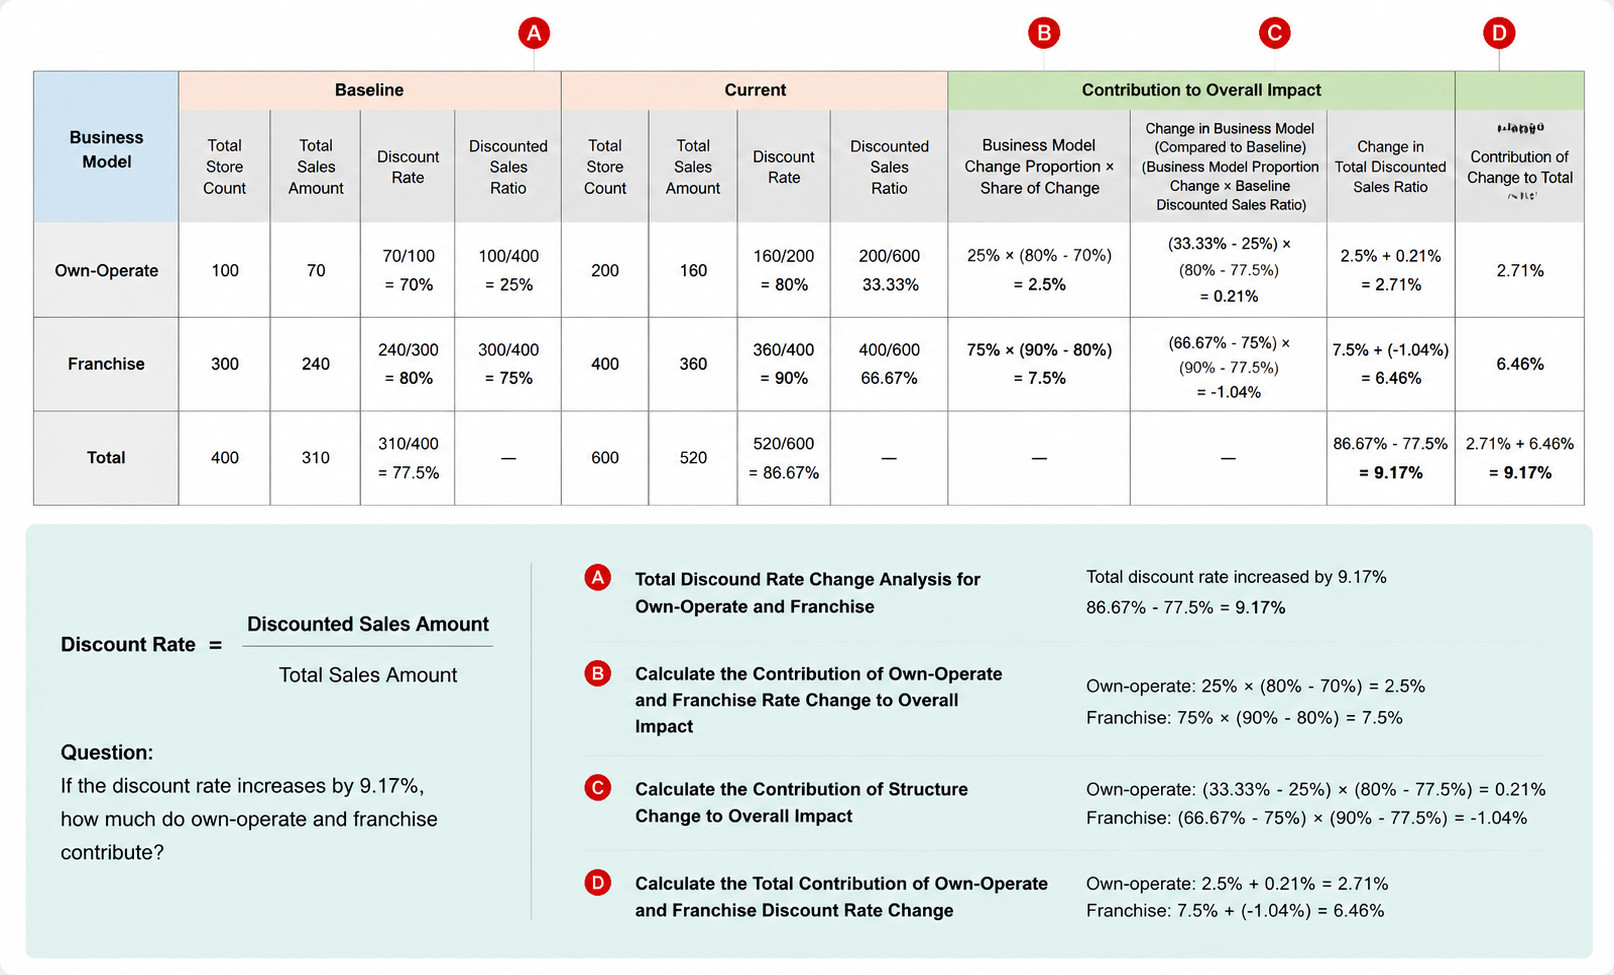
Composite Metric Discount Rate = Atomic Metric Total Sales Amount / Atomic Metric Total Tag Price Amount
Metric Decomposition Attribution
- Metric decomposition trees with calculation relationships support metric attribution, that is, calculating metric contributions
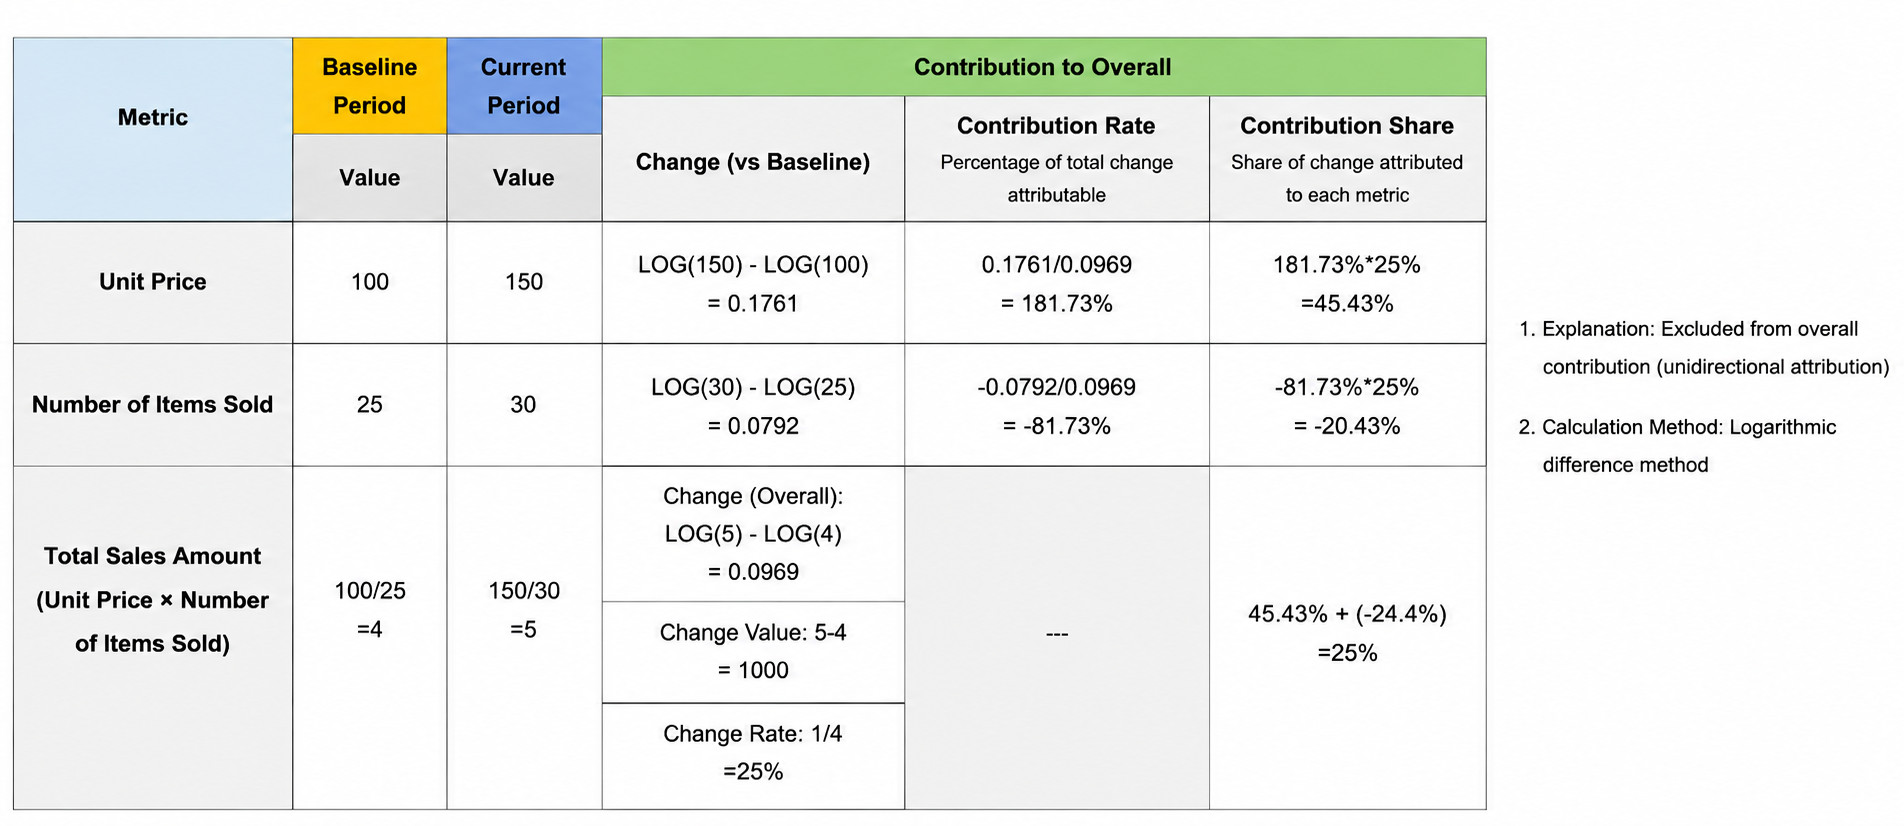
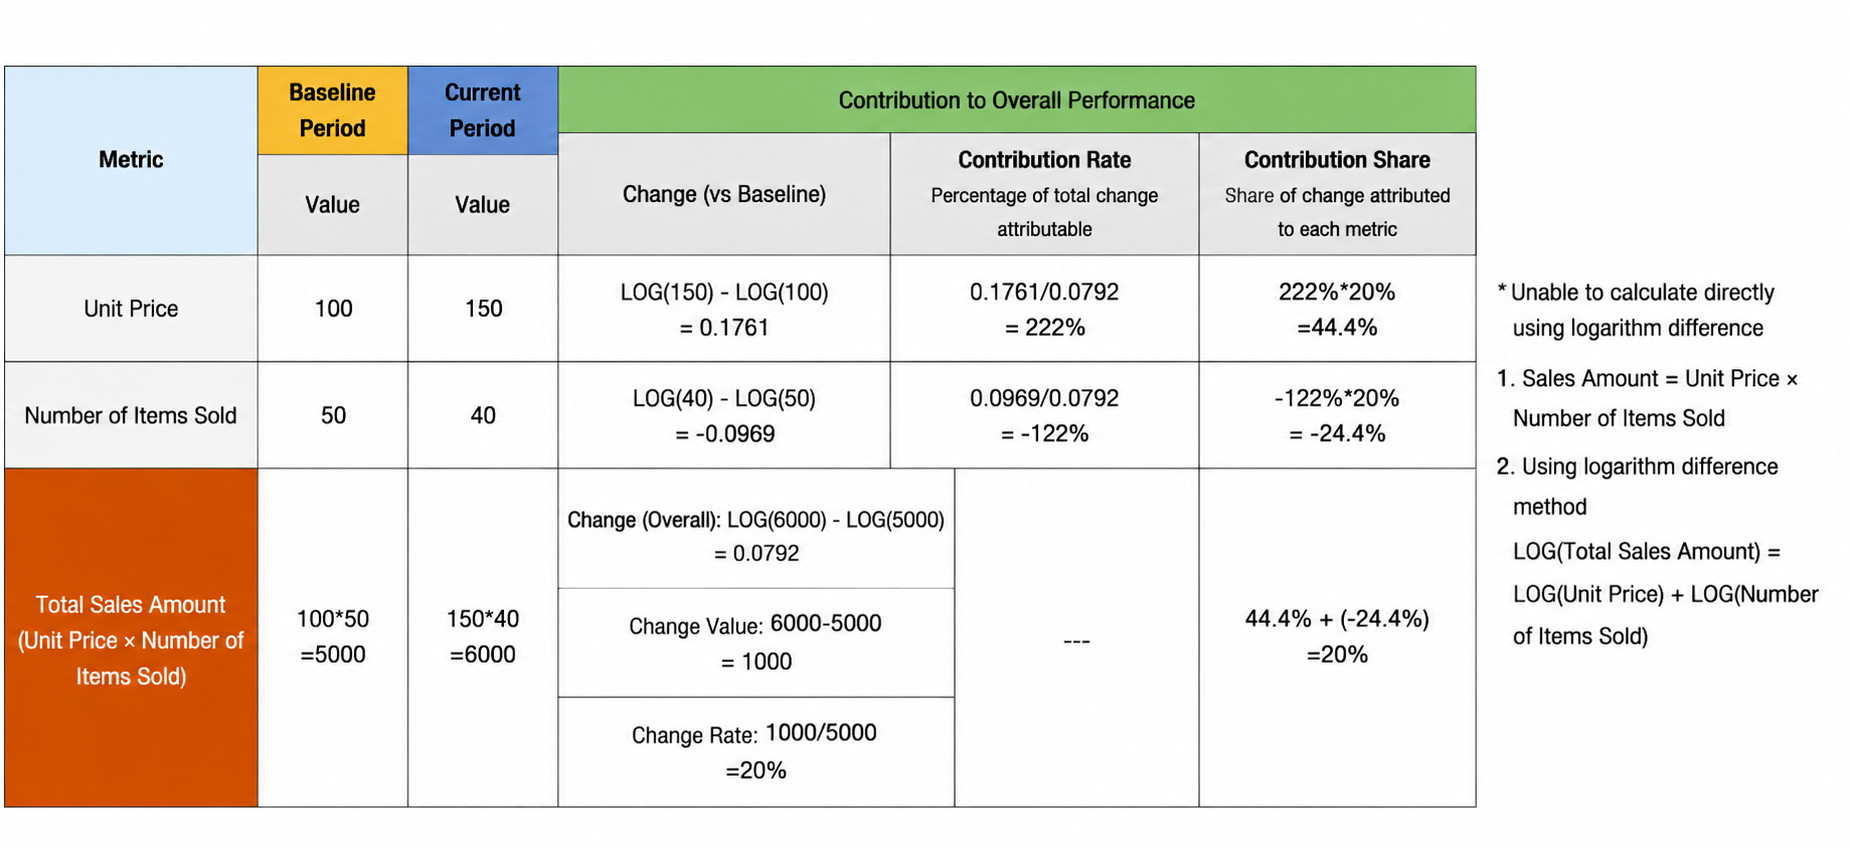
- According to the maintained calculation formula to determine the attribution algorithm, +- uses the addition algorithm, */ uses the logarithmic method
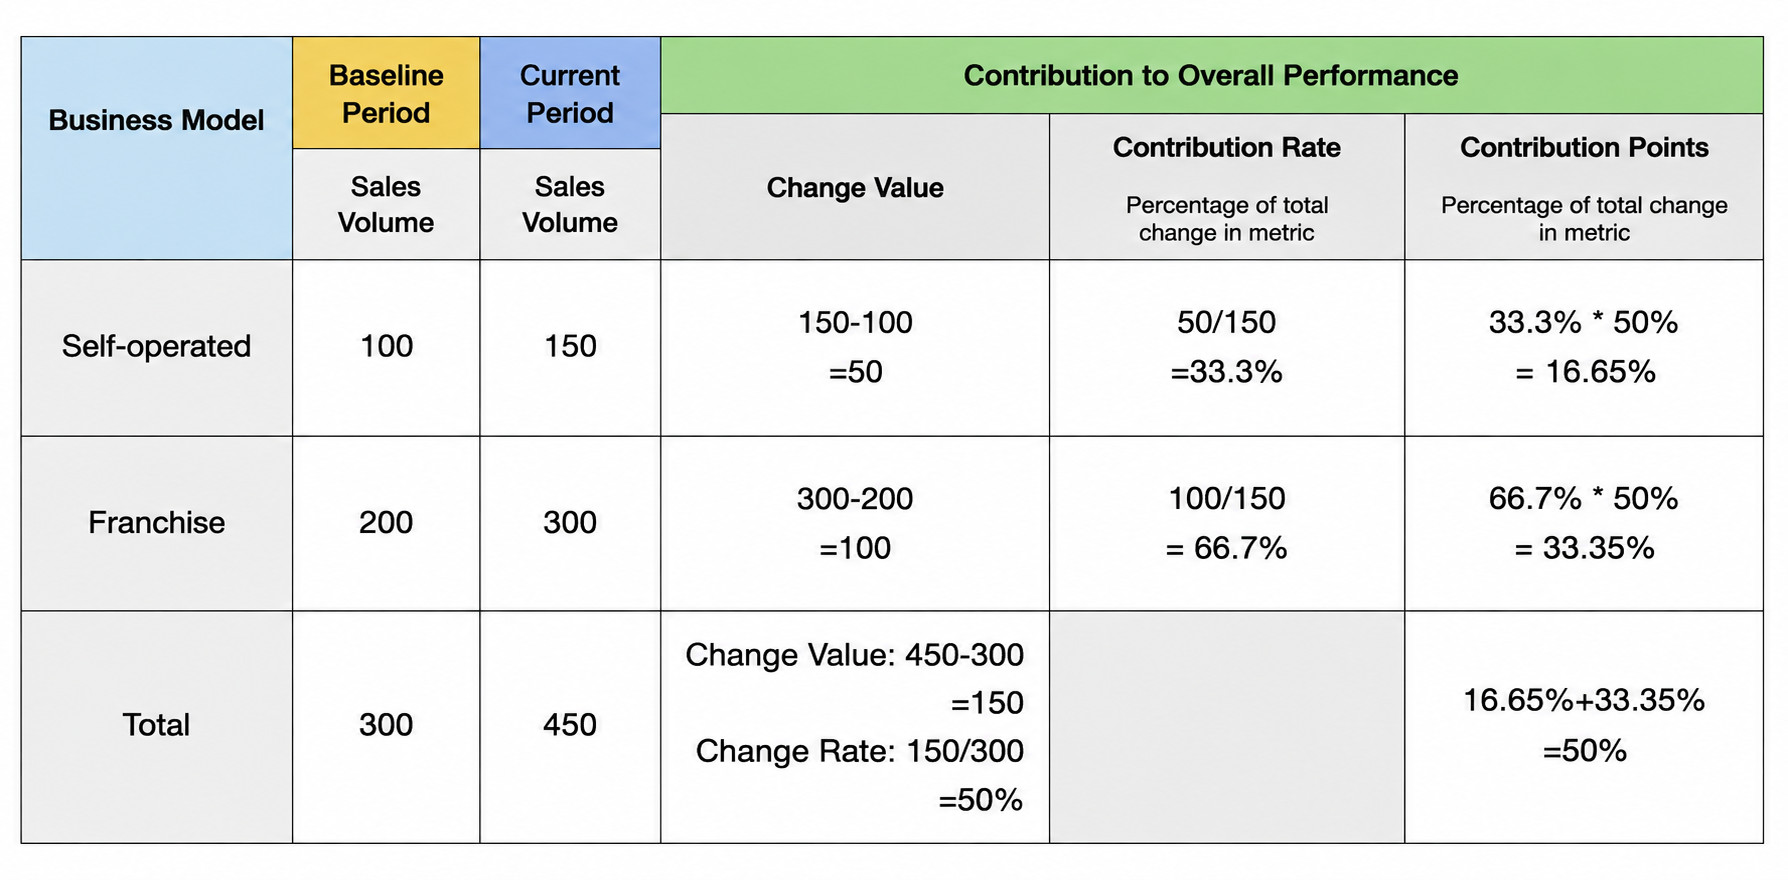
Example 1: Addition Algorithm
Sales Volume = Self-Operated Sales Volume + Franchise Sales Volume
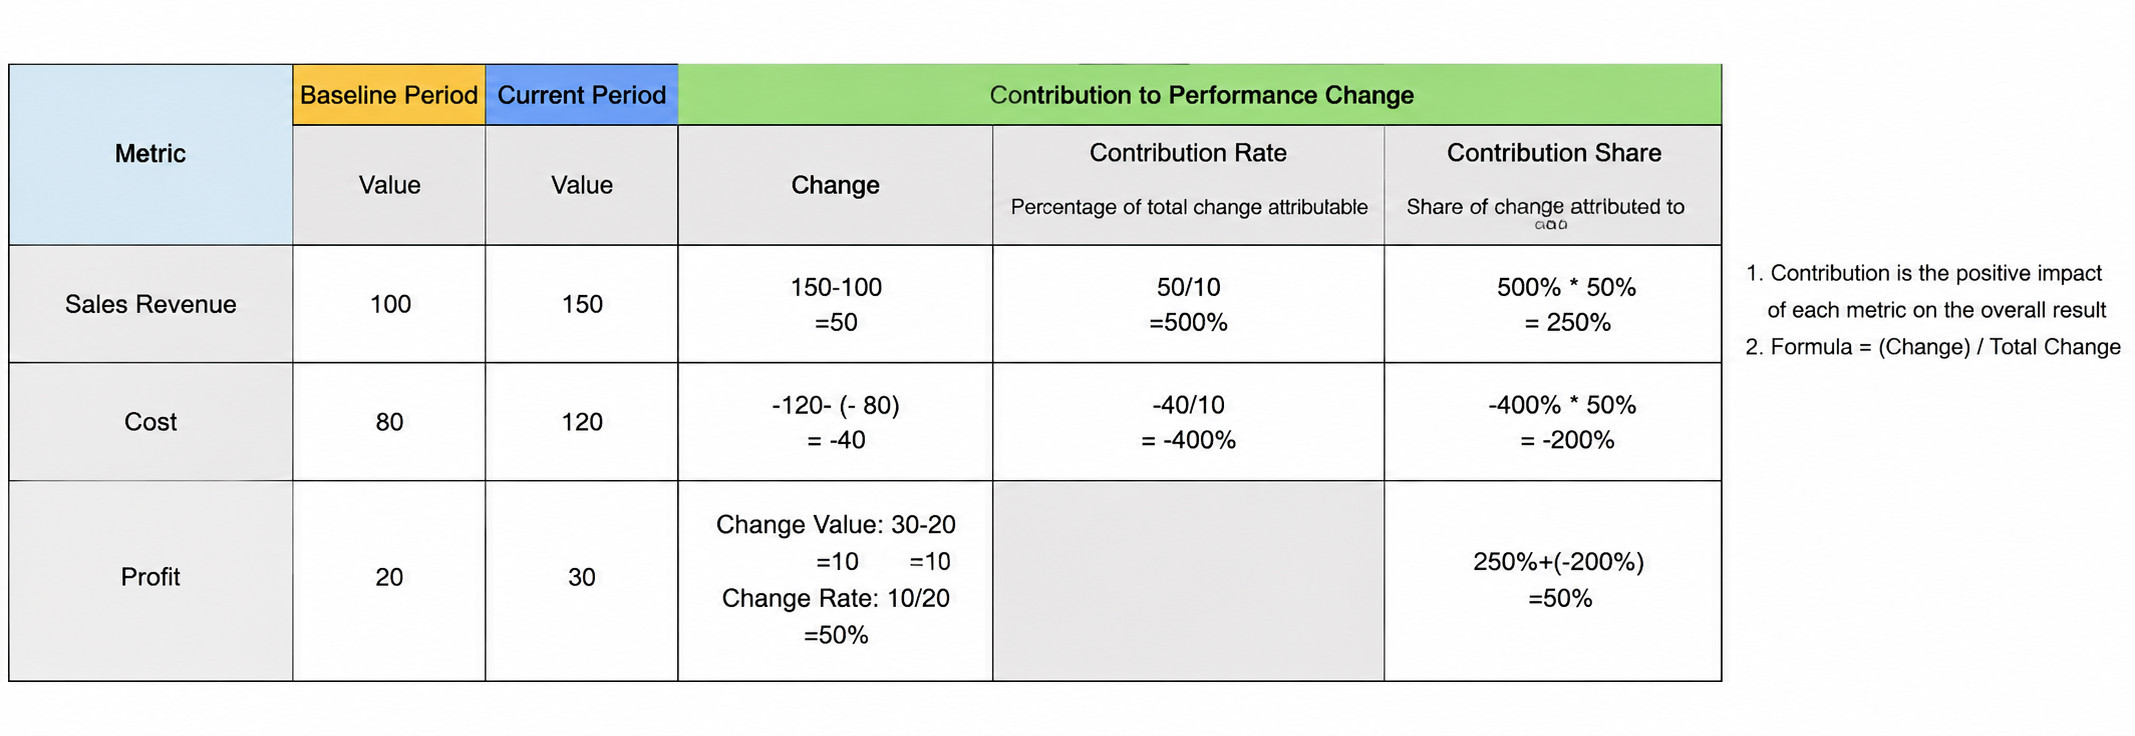
Profit = Sales Amount - Cost
Example 2: Division Algorithm
Sales Amount = Unit Price * Ticket Count
Unit Price = Sales Amount / Ticket Count