Metric Analysis
Overview
Guandata Metric Center is integrated with Guandata BI. Relying on the powerful visualization capability of BI data analysis, it supports directly creating metric analysis cards and Chinese-style reports on the data analysis page. Users can build dashboards through simple metric drag-and-drop operations, reducing the development time from metrics to dashboards and improving the efficiency of business dashboard building.
Create Metric Analysis Card
-
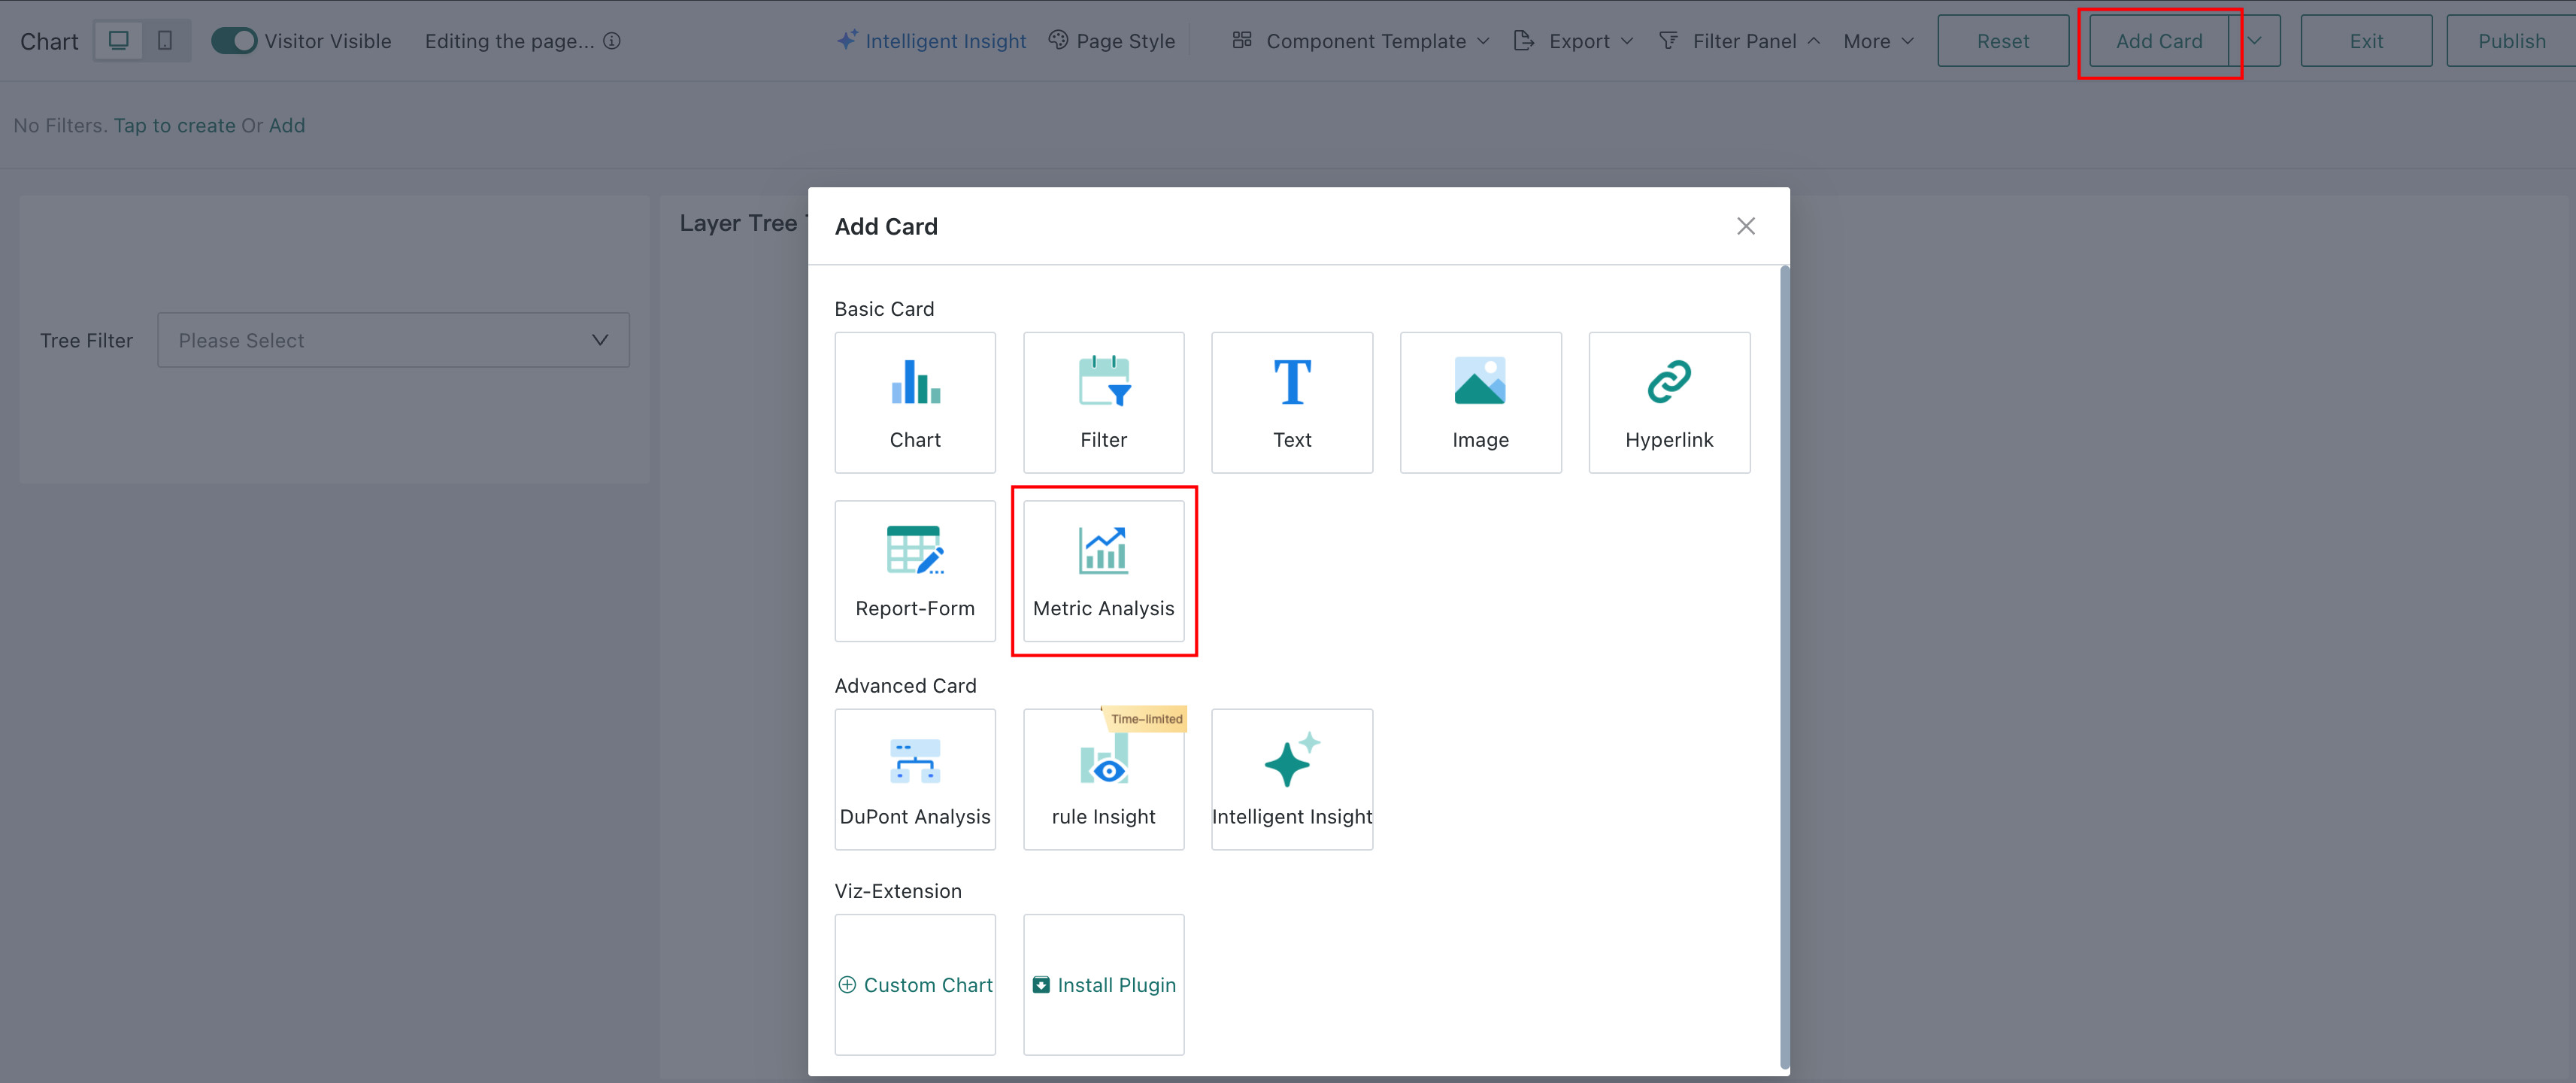
Enter the "Data Analysis" module, select the appropriate directory and page, click the "New Card" button in the upper right corner, and select the "Metric Analysis" card.
-
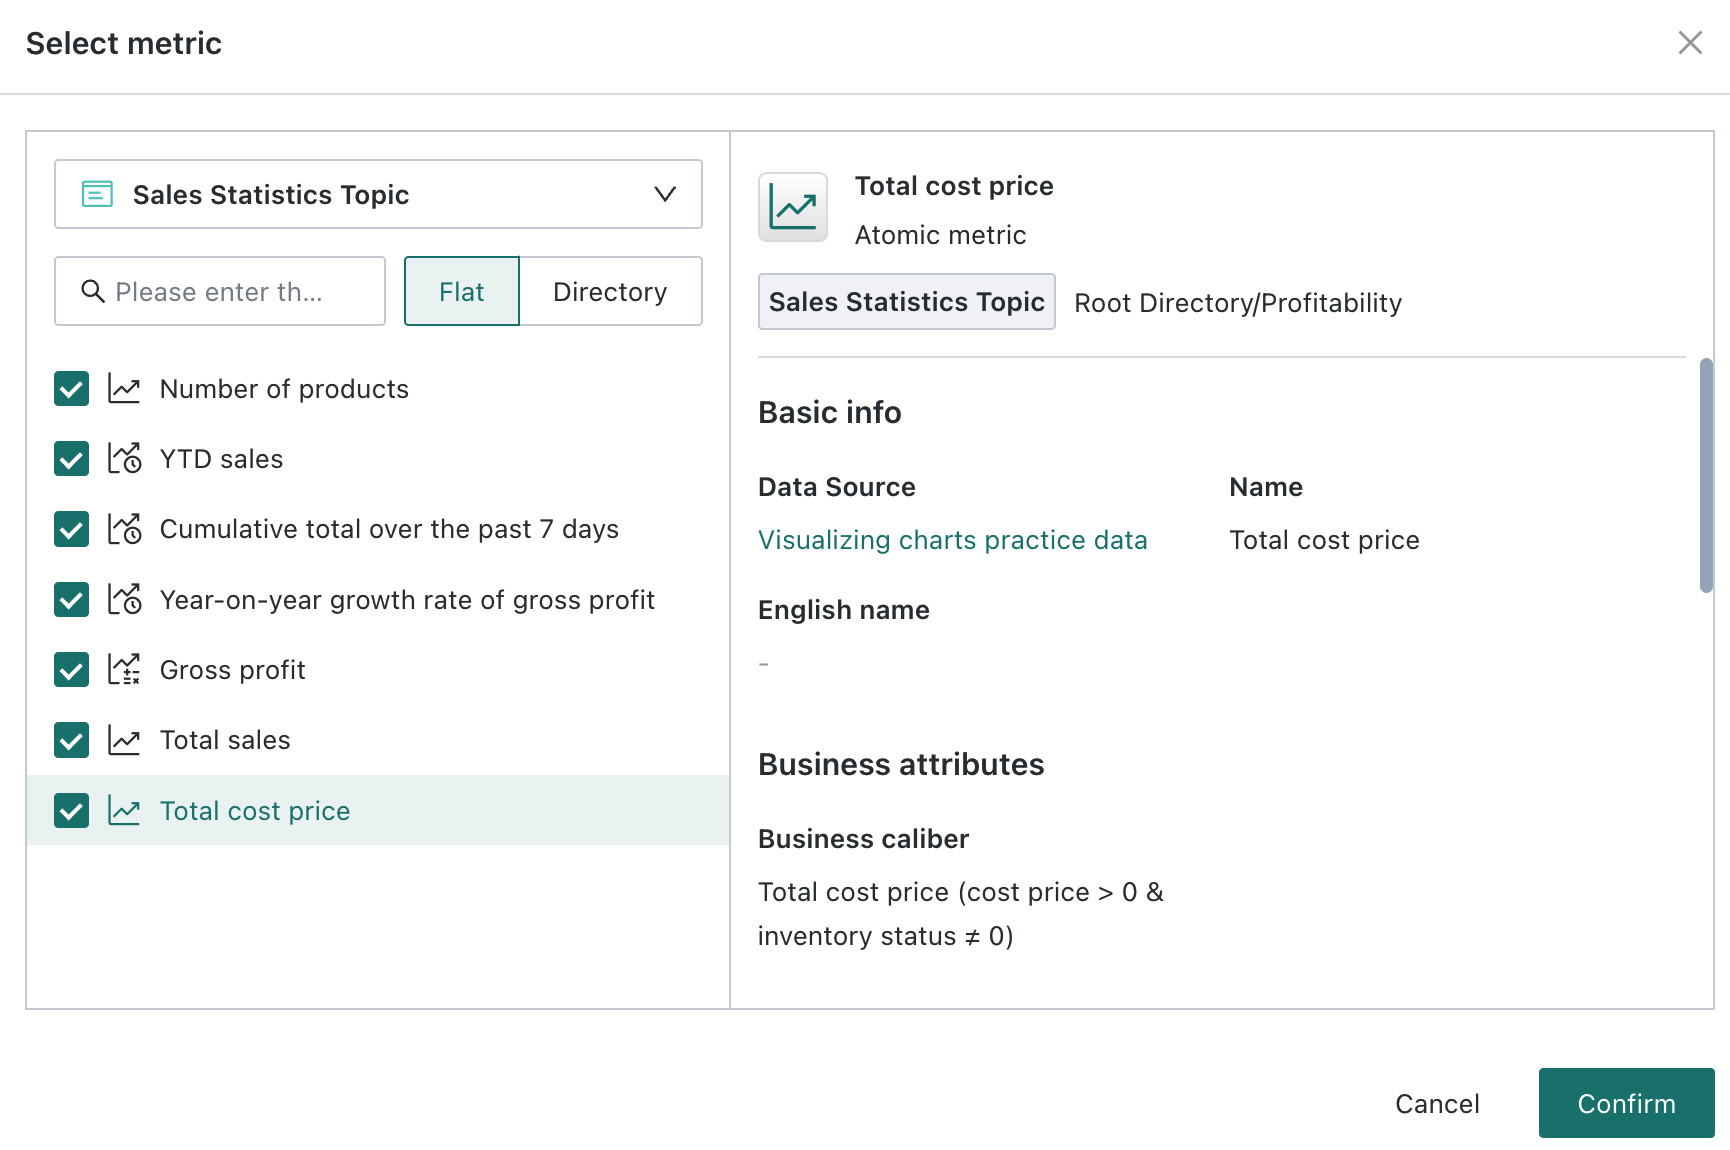
Select the metrics that need to be analyzed in the metric analysis card. You can filter by topic, and only metrics that the current user has permission can be selected.
 Note
NoteThe card editing page supports selecting multiple metrics.
-
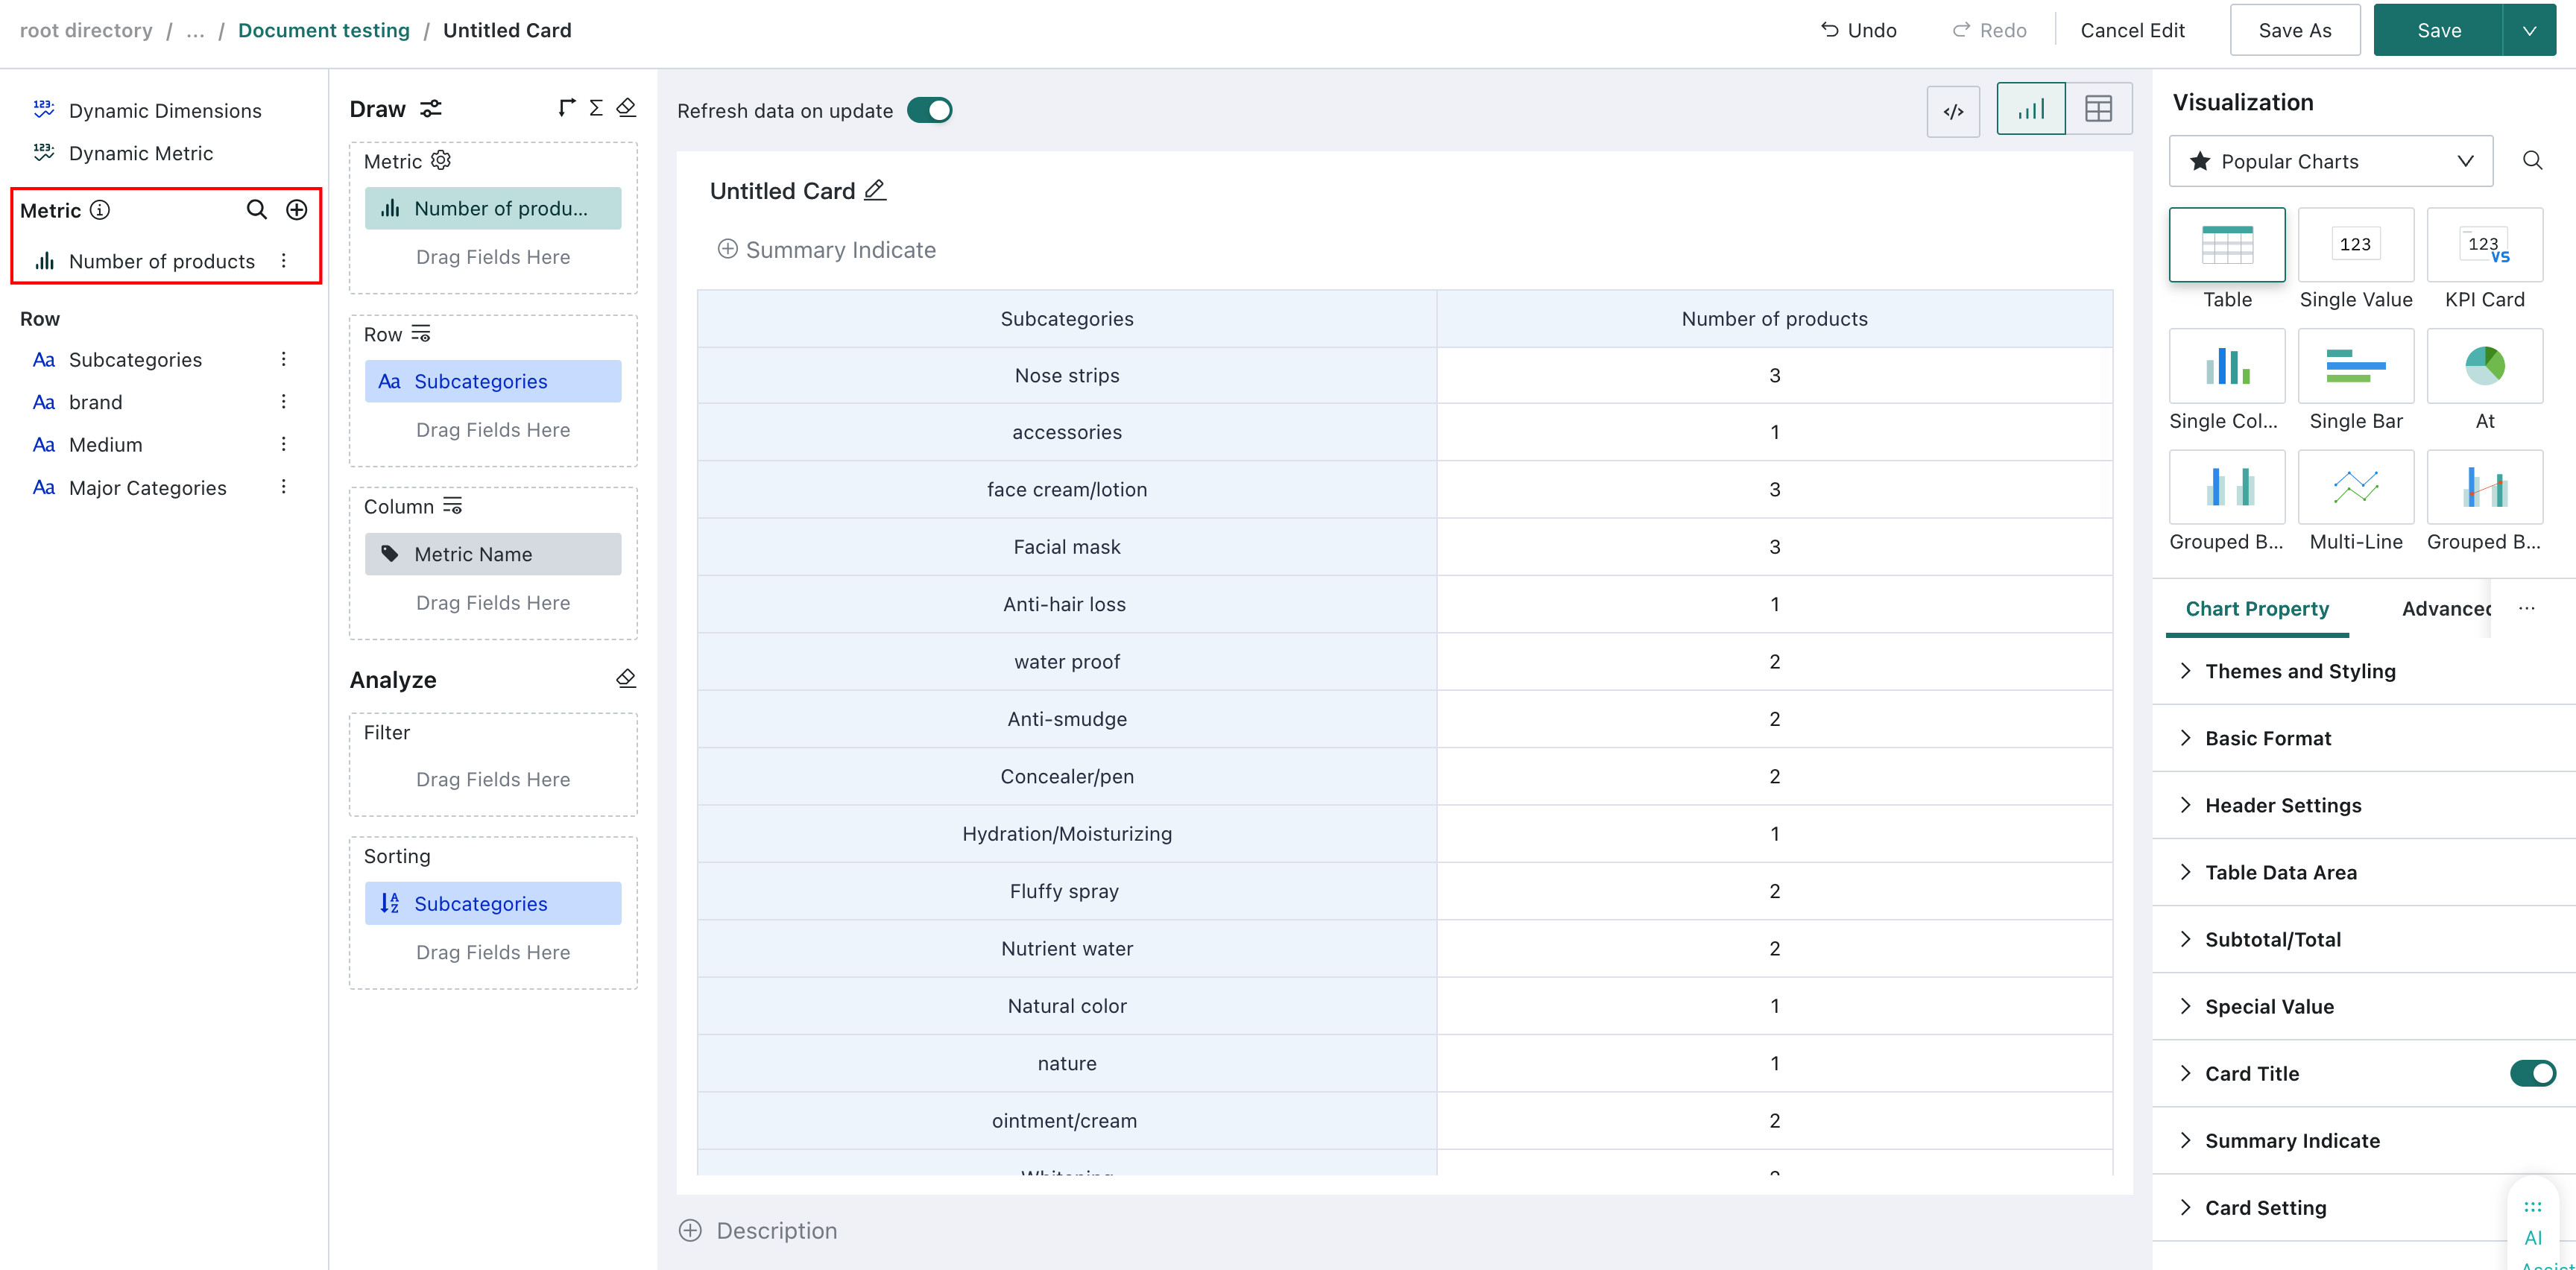
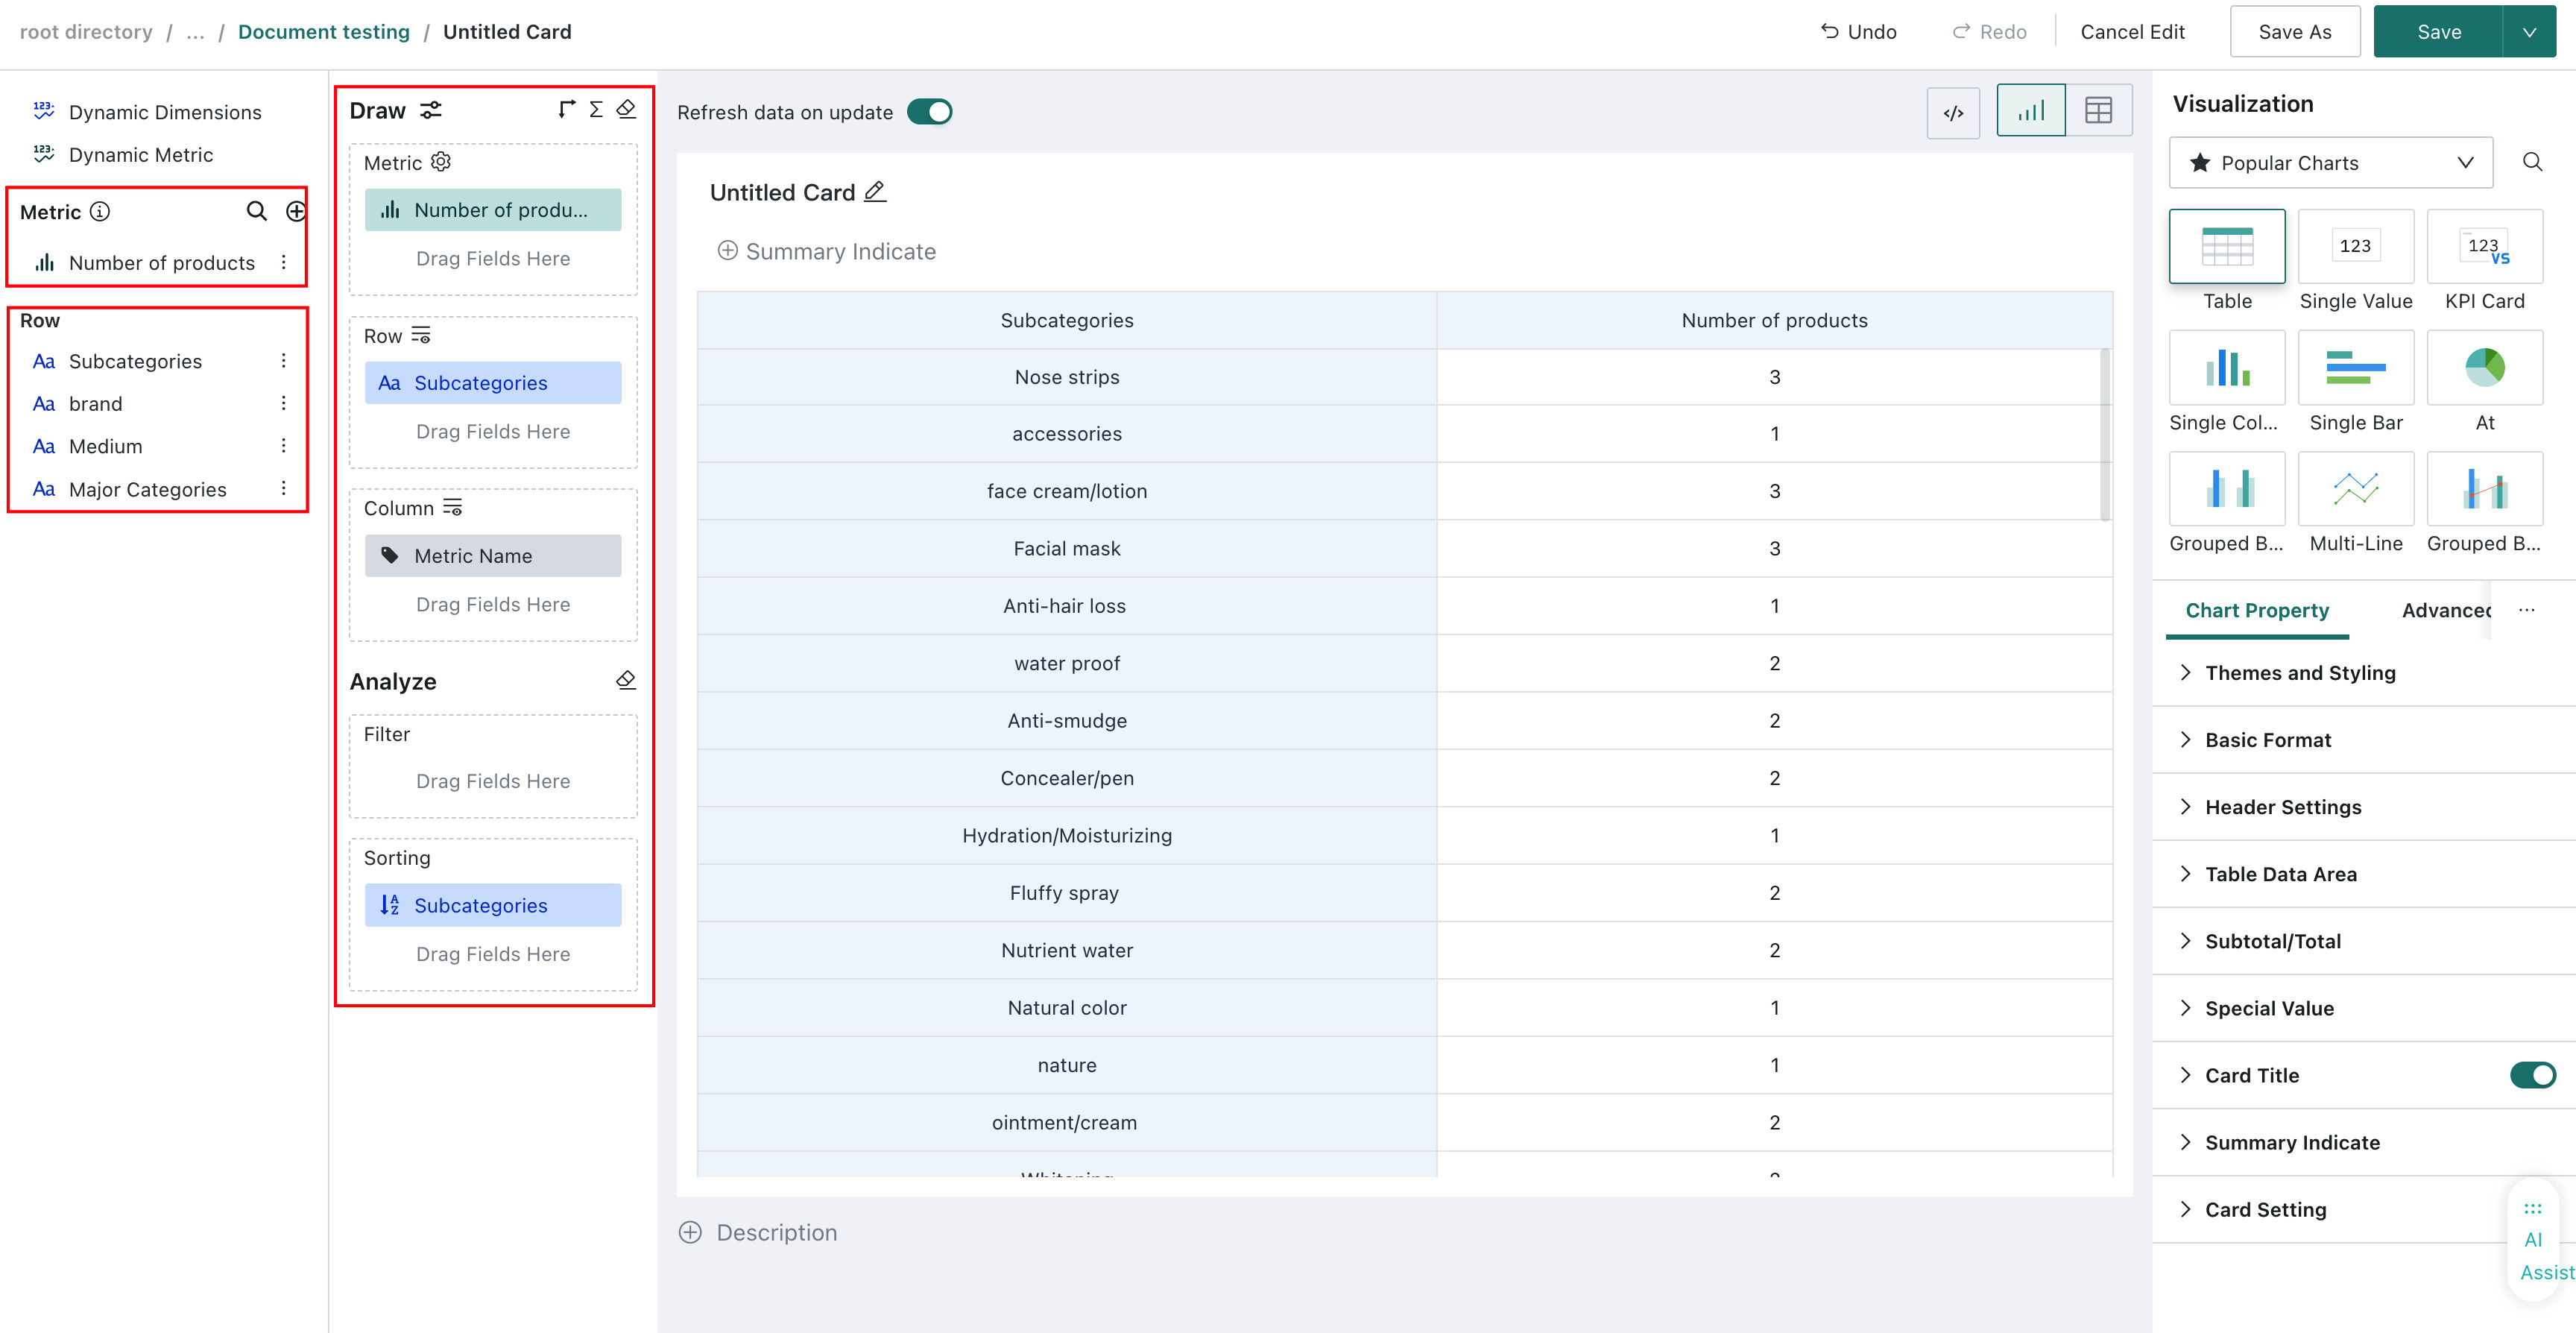
Select the appropriate visualization chart display method, and configure metric and dimension information.
-
Visualization Configuration Description: Metric analysis supports a variety of visualization charts. For detailed usage, see Chart Configuration.
-
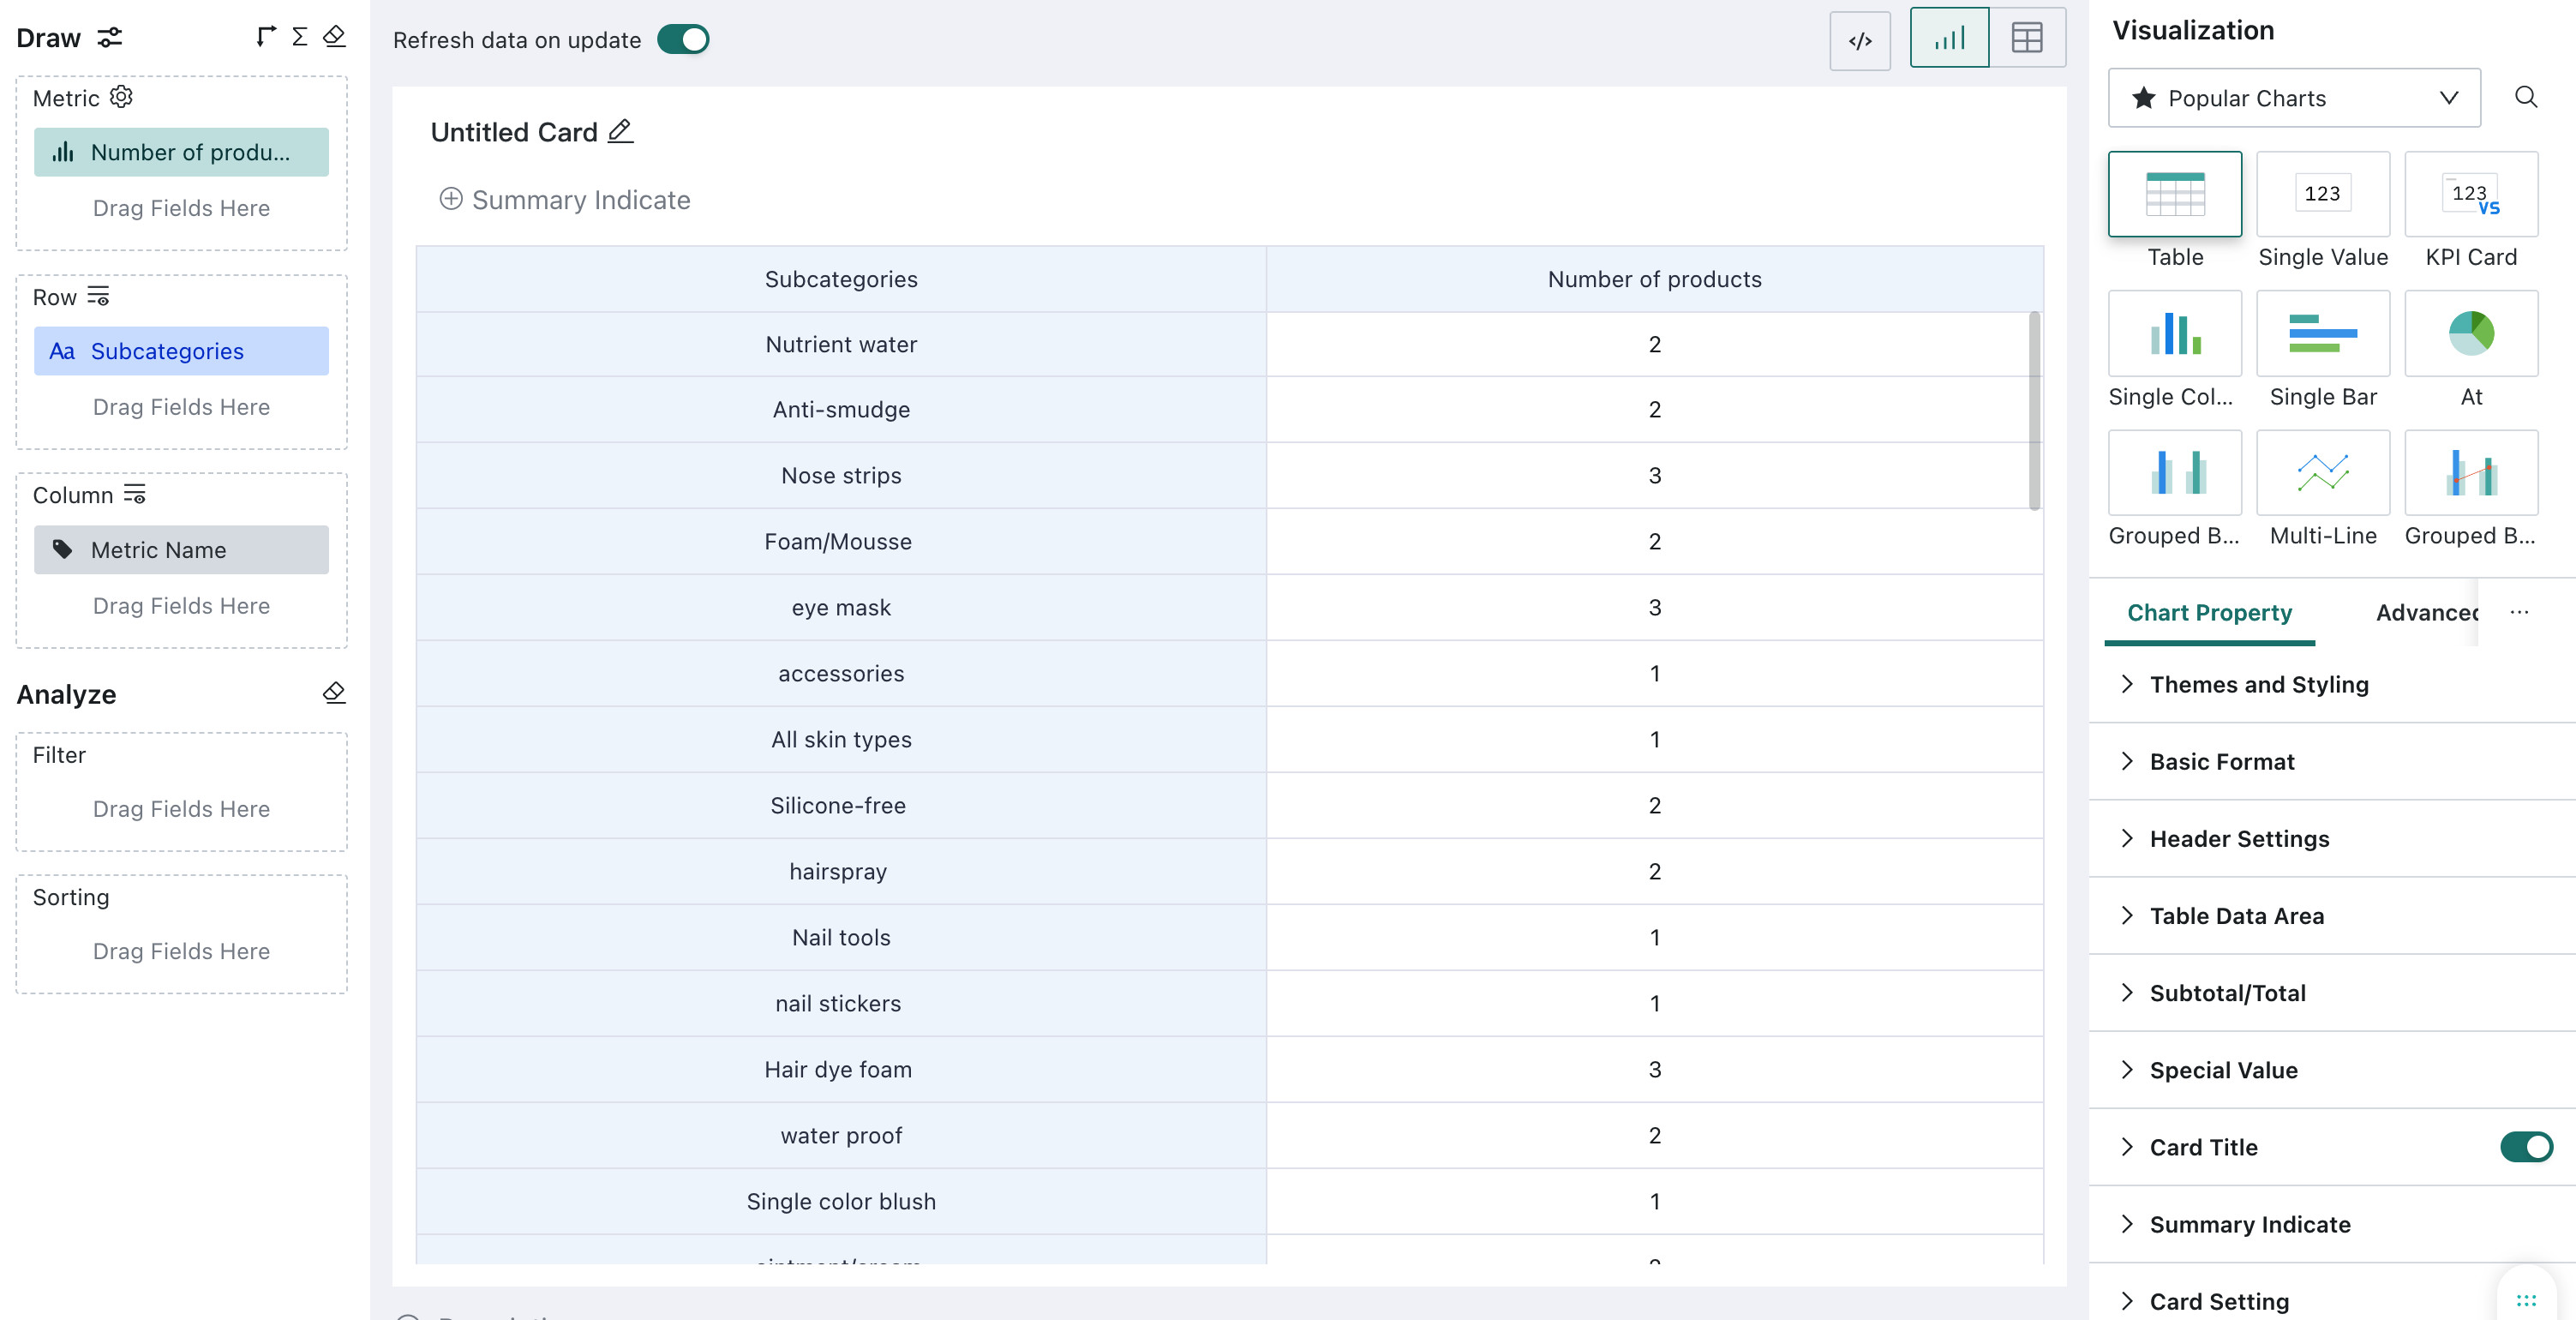
Table
Table visualization supports selecting multiple metrics for joint analysis. Metric analysis currently only supports ordinary tables. The attribute configuration capability reuses BI capability.
-
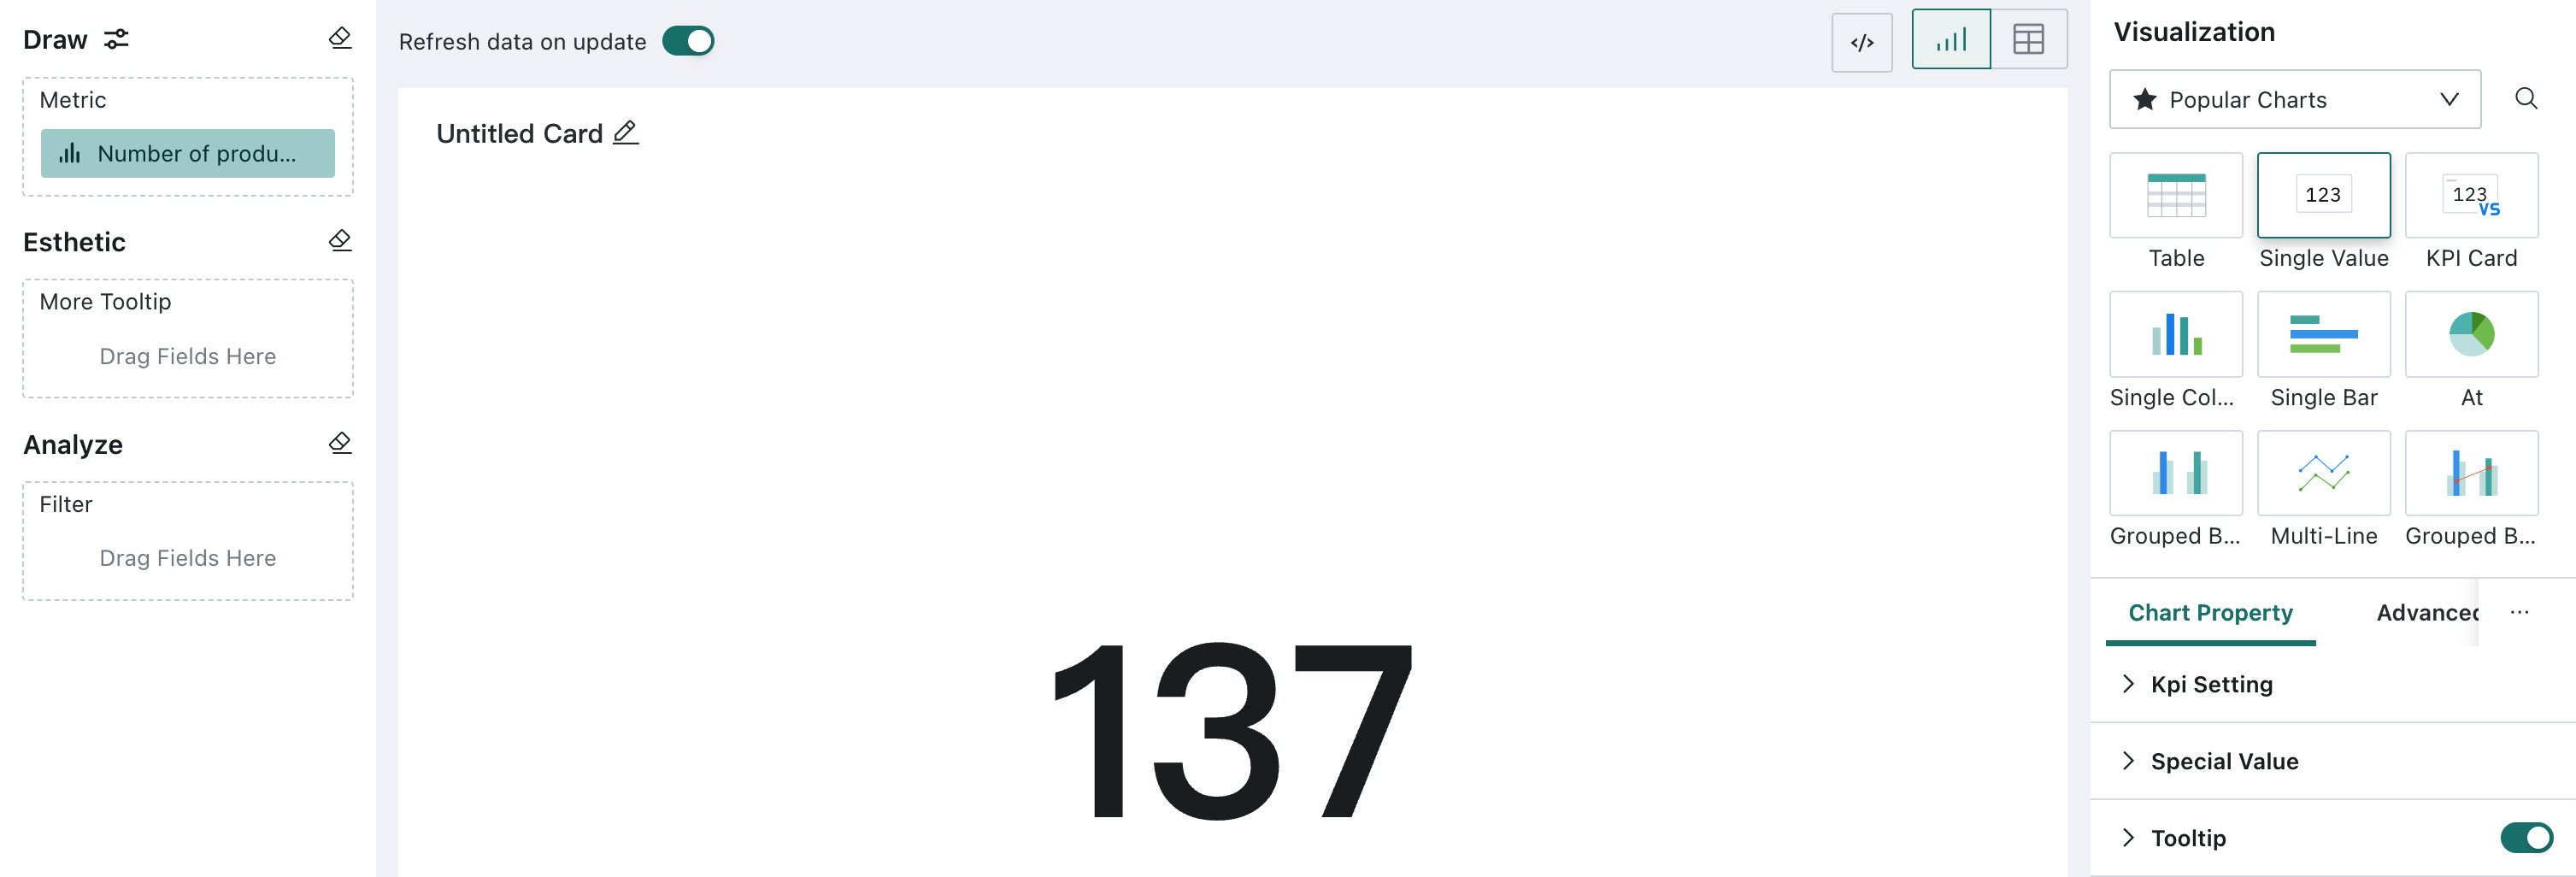
Single Value
Metric cards are suitable for displaying common metric items. According to the prompts in the page, drag the corresponding metric to the drawing area, and set the metric card size, label, icon, etc. in the chart attribute area.
-
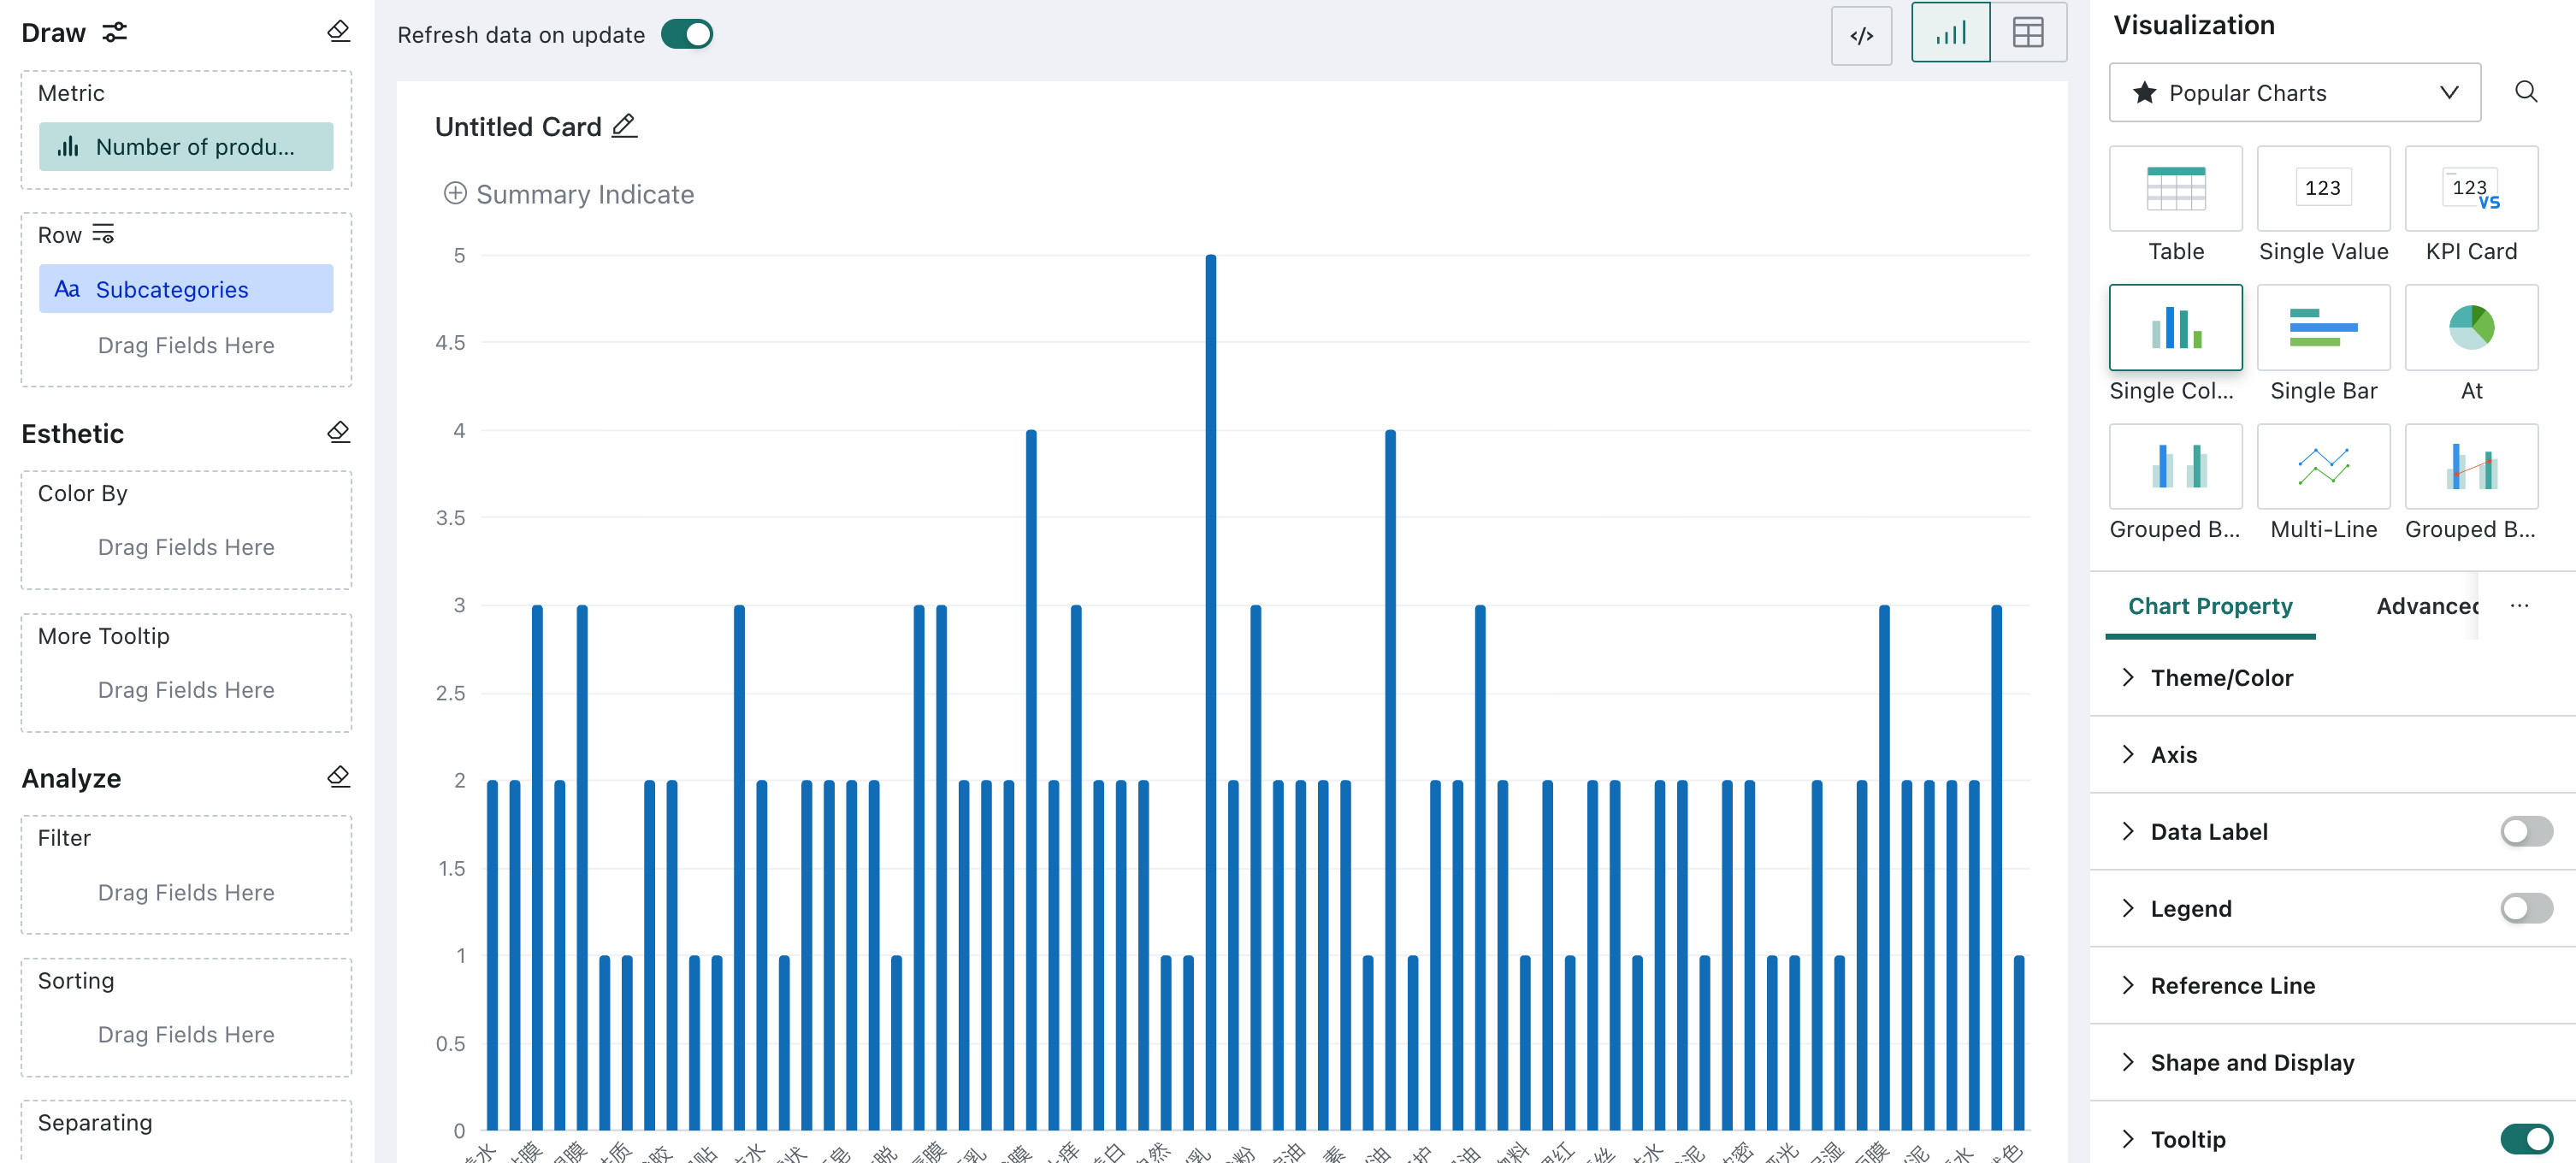
Single Bar Chart
Bar charts are used to emphasize the change of metric data over time or other conditions. You can select one metric and one dimension. According to the suggested visualization drawing prompts, drag the corresponding dimension and metric to the drawing area.
-
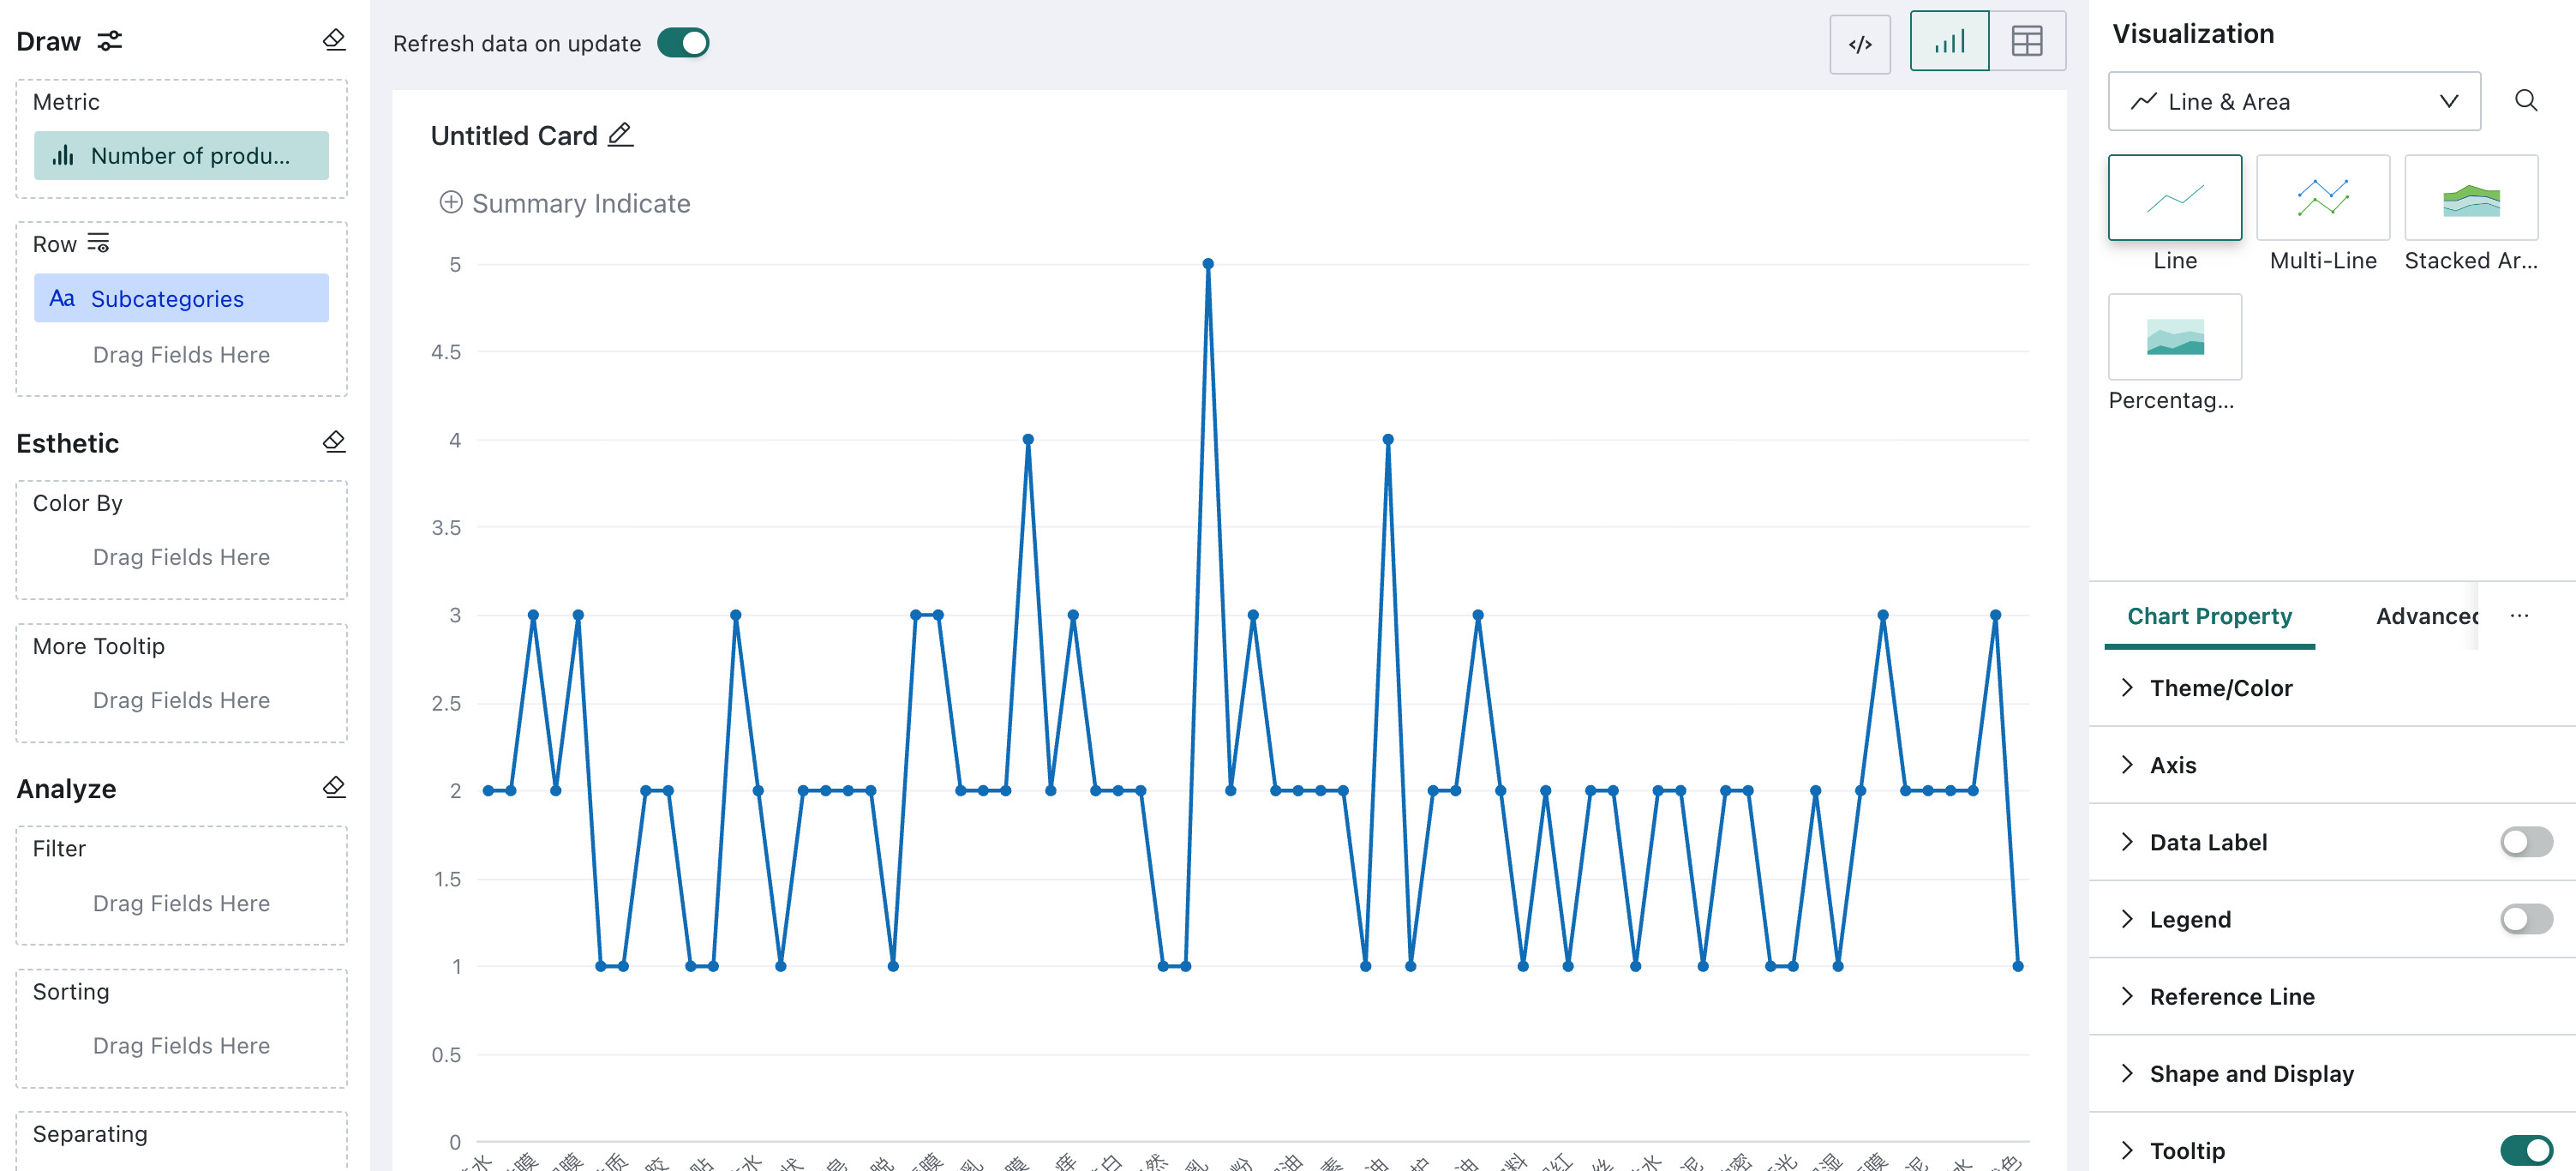
Single Line Chart
Single line charts are used to emphasize the trend of metric data over time or other conditions. You can select one metric and one dimension. According to the suggested visualization drawing prompts, drag the corresponding dimension and metric to the drawing area.
-
Other Charts Metric analysis also supports a variety of visualization charts, such as progress bar, bubble chart, single bar chart, butterfly chart, etc.
-
-
Dimension Configuration Description: If multiple metrics are selected, only the common dimensions of the selected metrics can be used as analysis dimensions for visualization. Some independent dimensions of metrics can only be used as filter conditions.
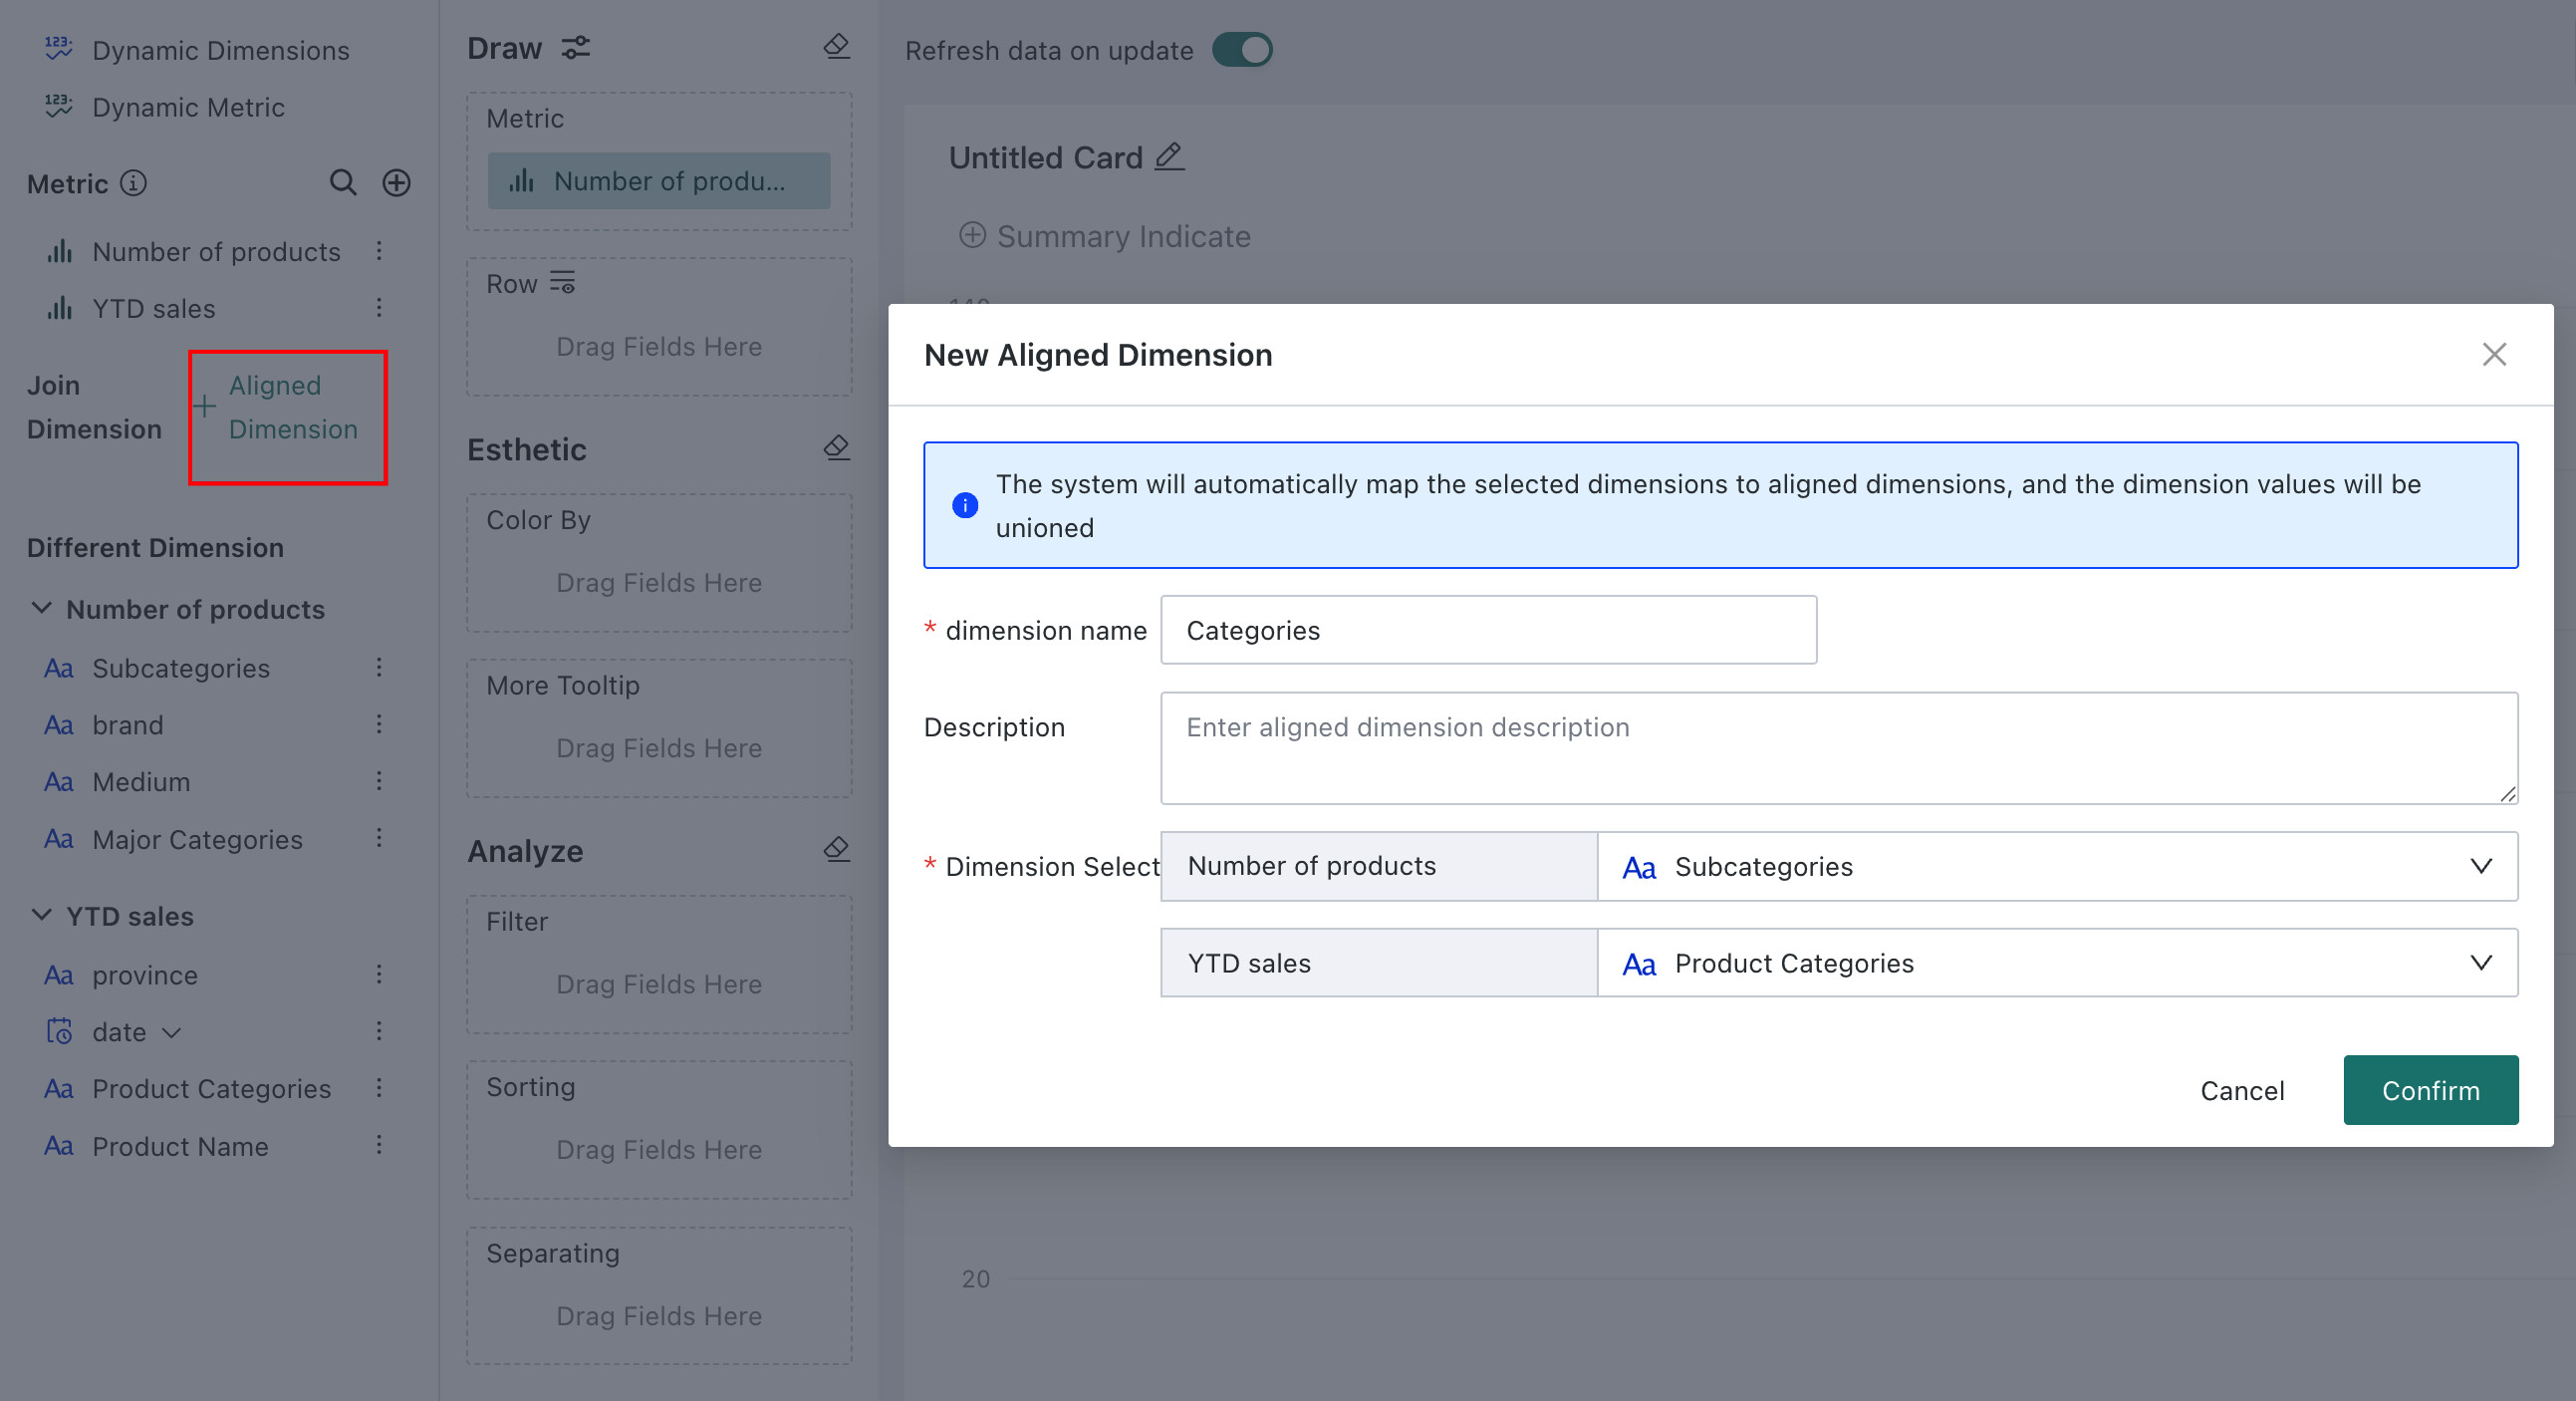
Supports creating "Alignment Dimensions" to map selected dimensions to alignment dimensions, using alignment dimensions as temporary visualization analysis dimensions.
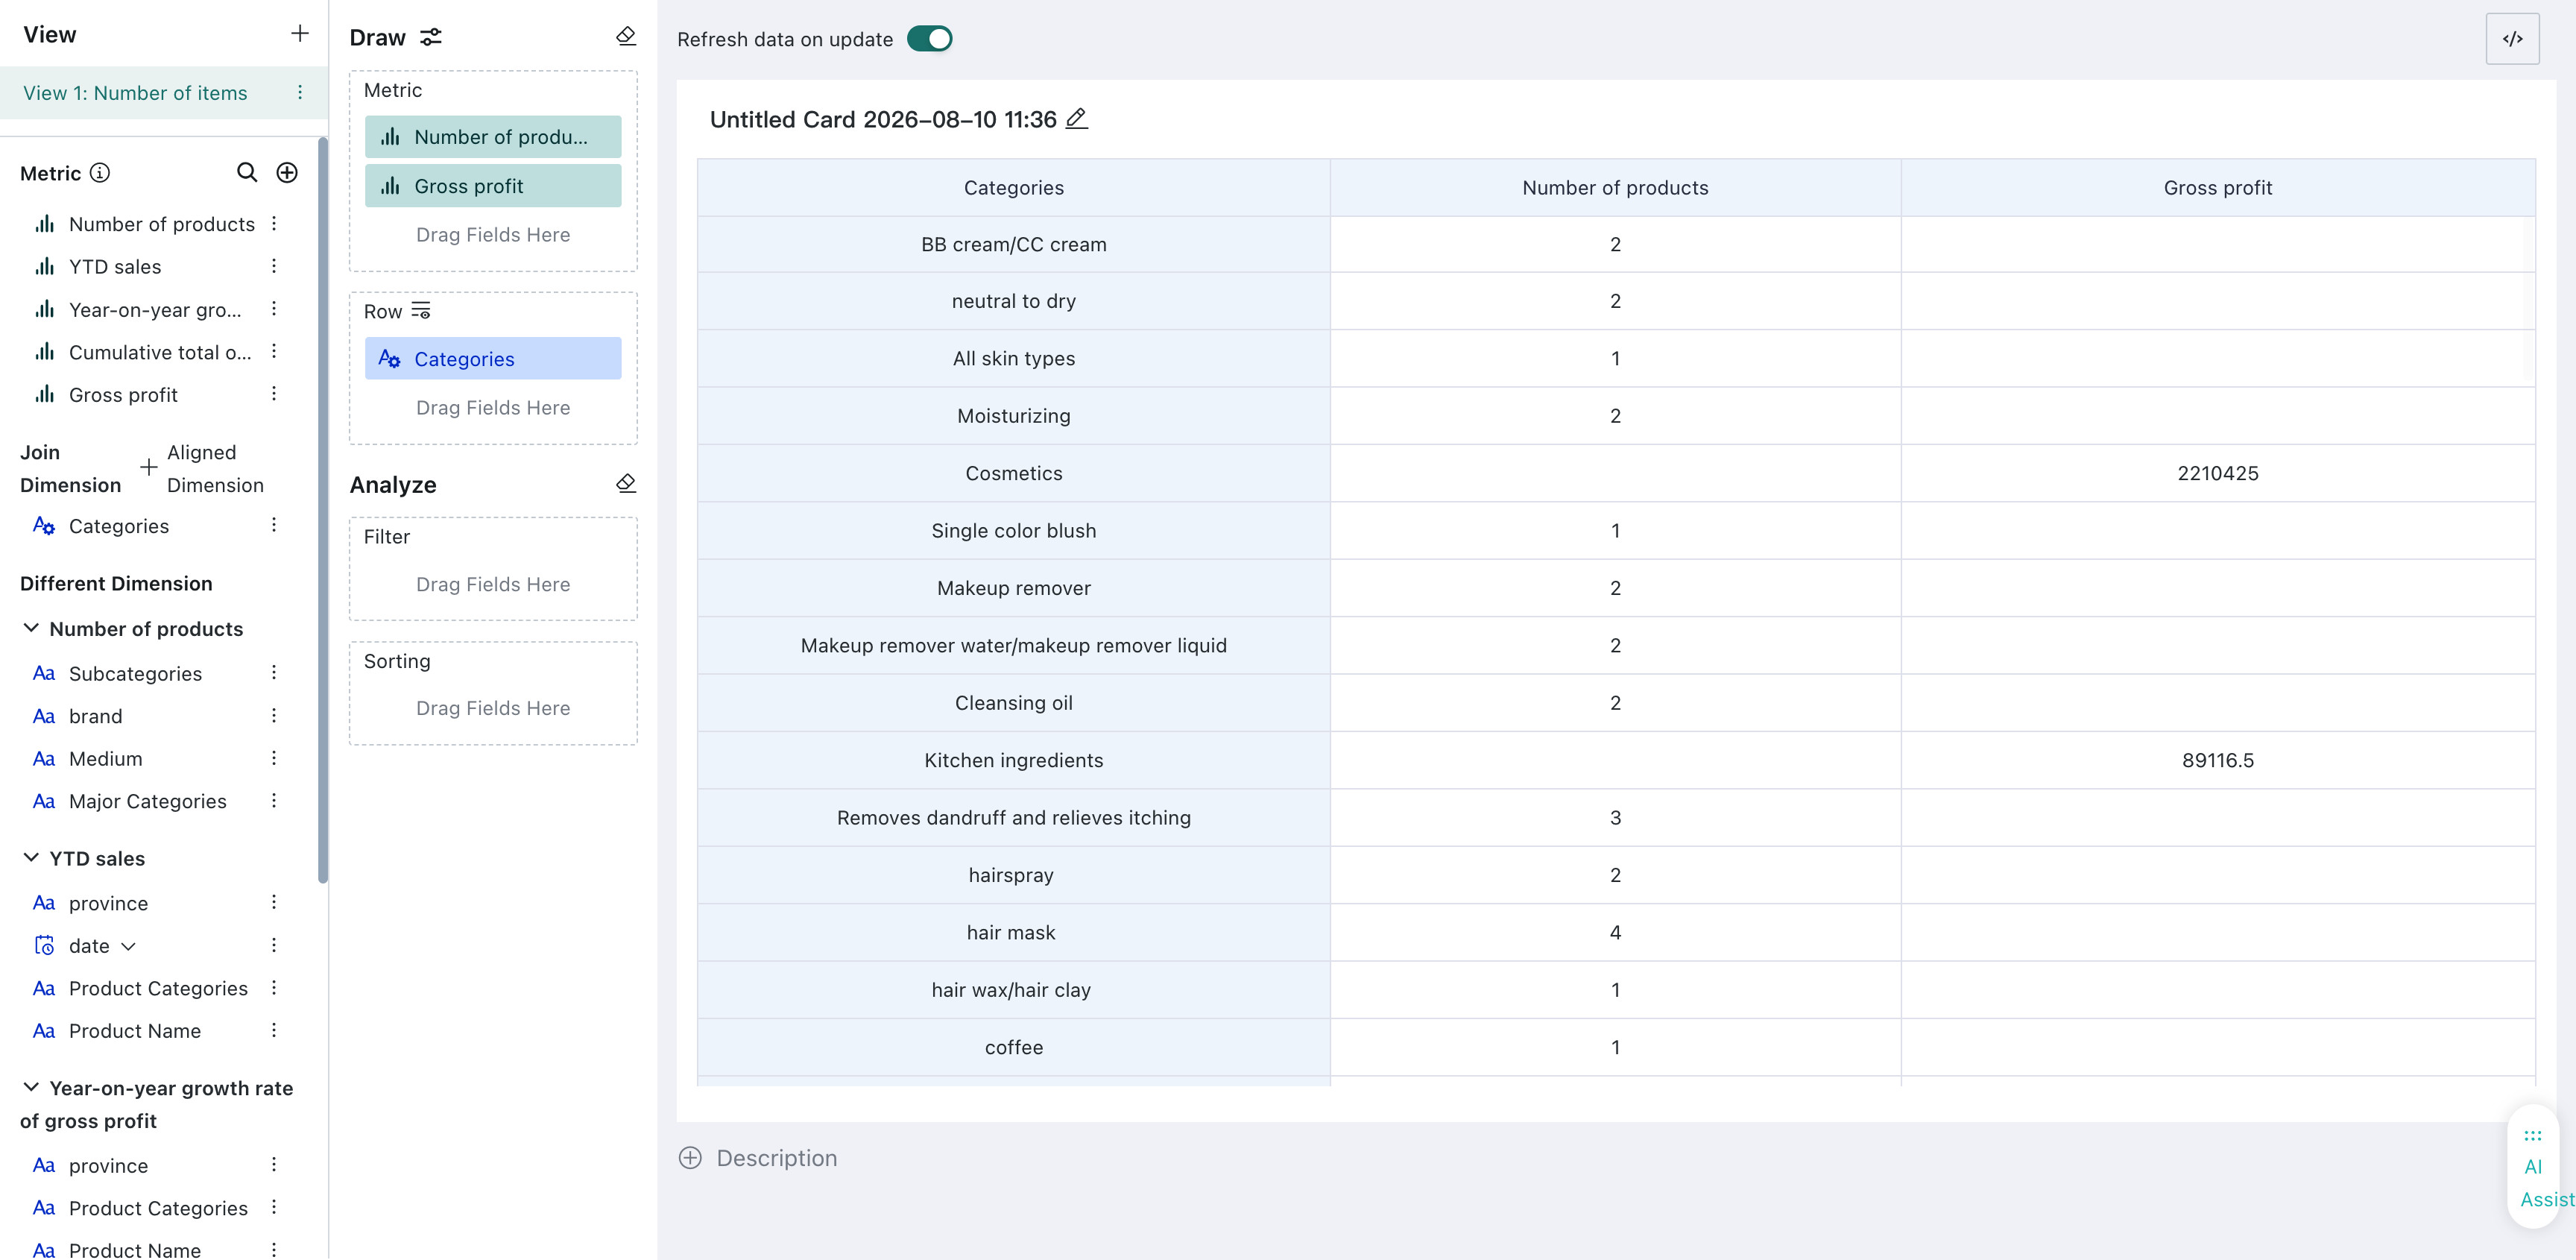
For example, when analyzing two metrics — Number of products and YTD sales — create an aligned dimension named Categories and map each metric to its corresponding dimension:
- Number of products → Subcategories
- YTD sales → Product Categories
The system automatically maps the selected dimensions to the aligned dimension and unions the dimension values. When the aligned dimension is used as an analysis dimension, each metric is calculated based on its own mapped dimension.
-
Create Chinese-style Reports
-
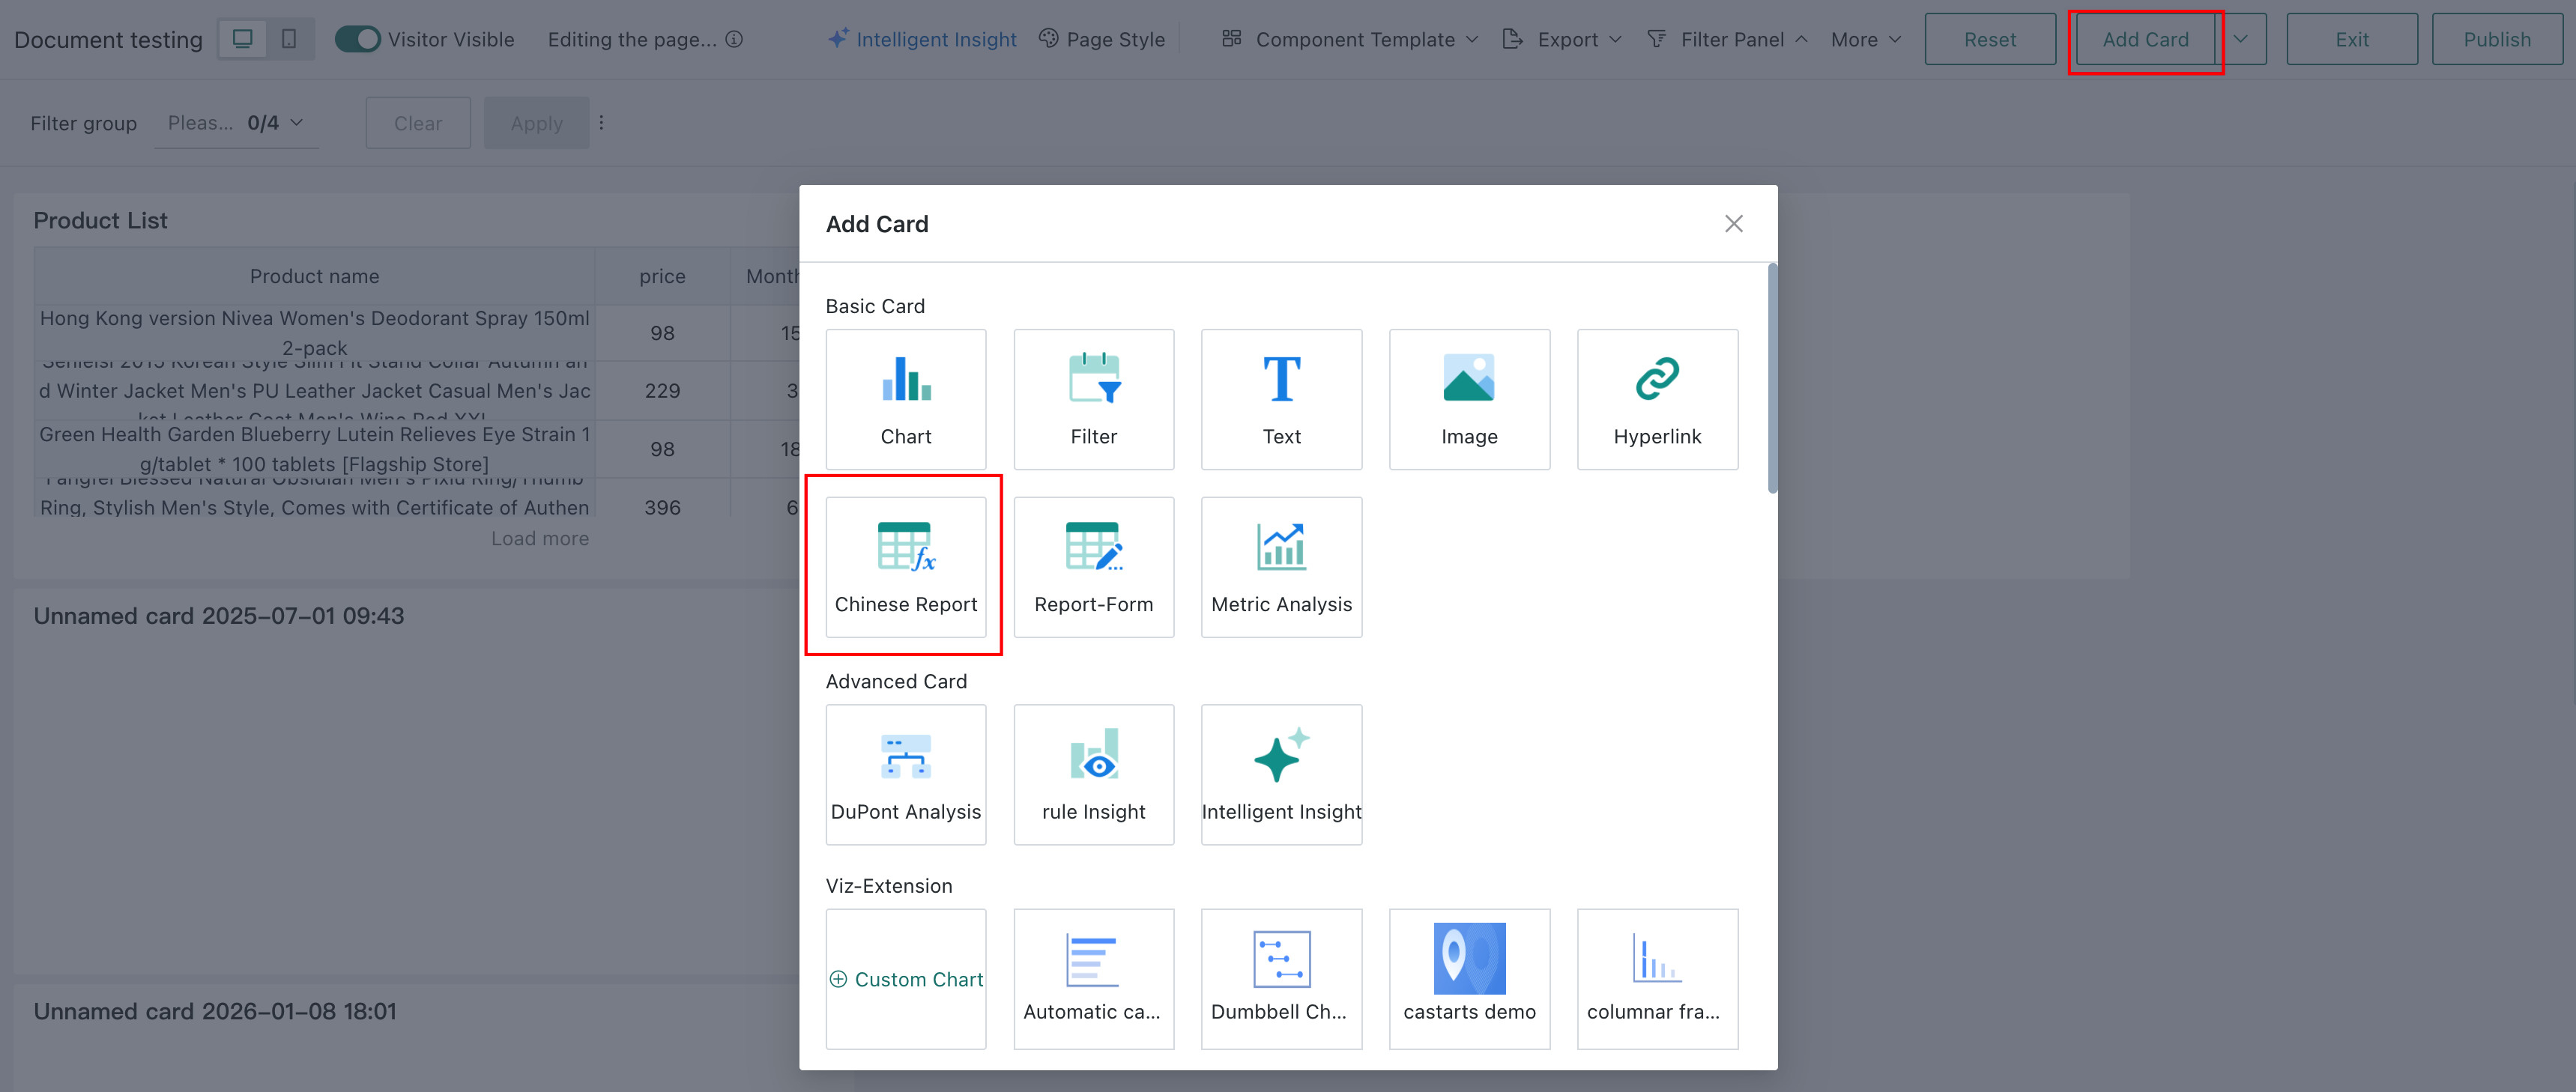
Enter the data analysis module, click the "New Card" button in the upper right corner of the page, and select the "Chinese-style Report" card. Only Chinese-style Report Pro supports connecting metrics.
-
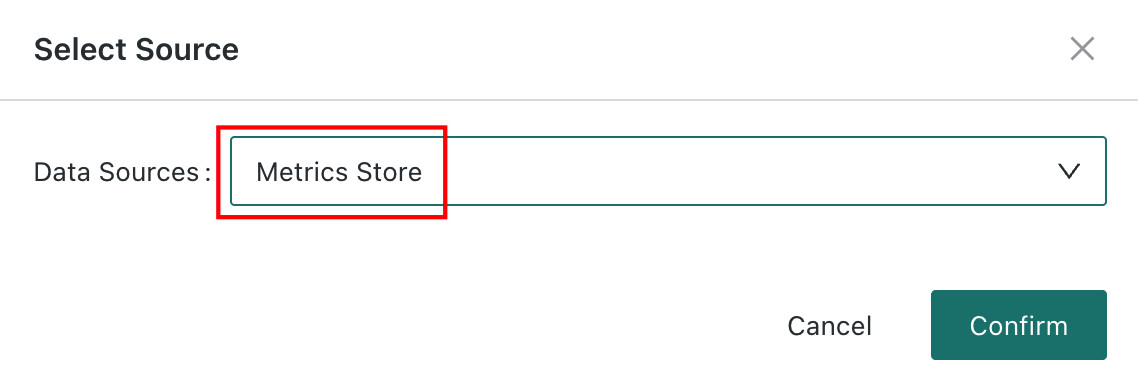
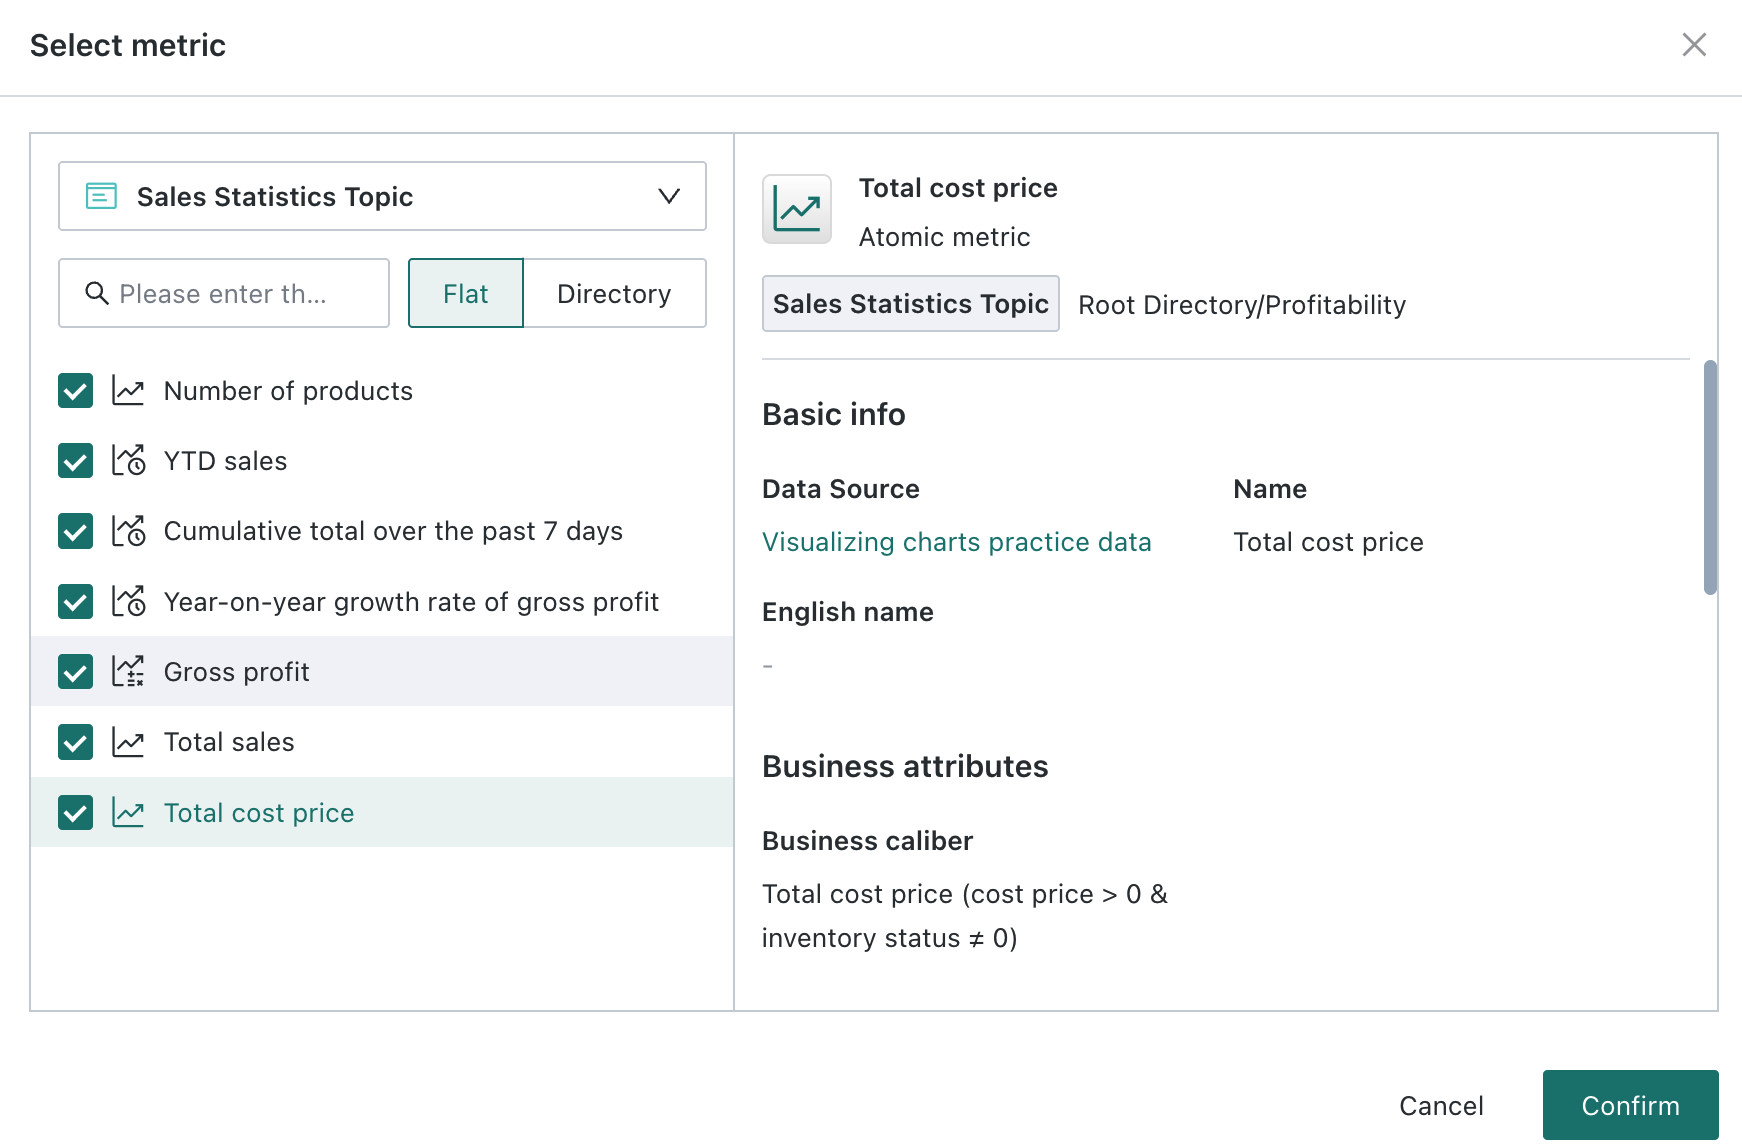
Select metrics for the data source, select the metrics that need to be analyzed in the Chinese-style report. You can filter by topic, and only metrics that the current user has permission can be selected.
-
Data Preparation
Let the user prepare the data needed for the report (build a virtual card). A view can select one dataset/multiple metrics
-
Template Editing
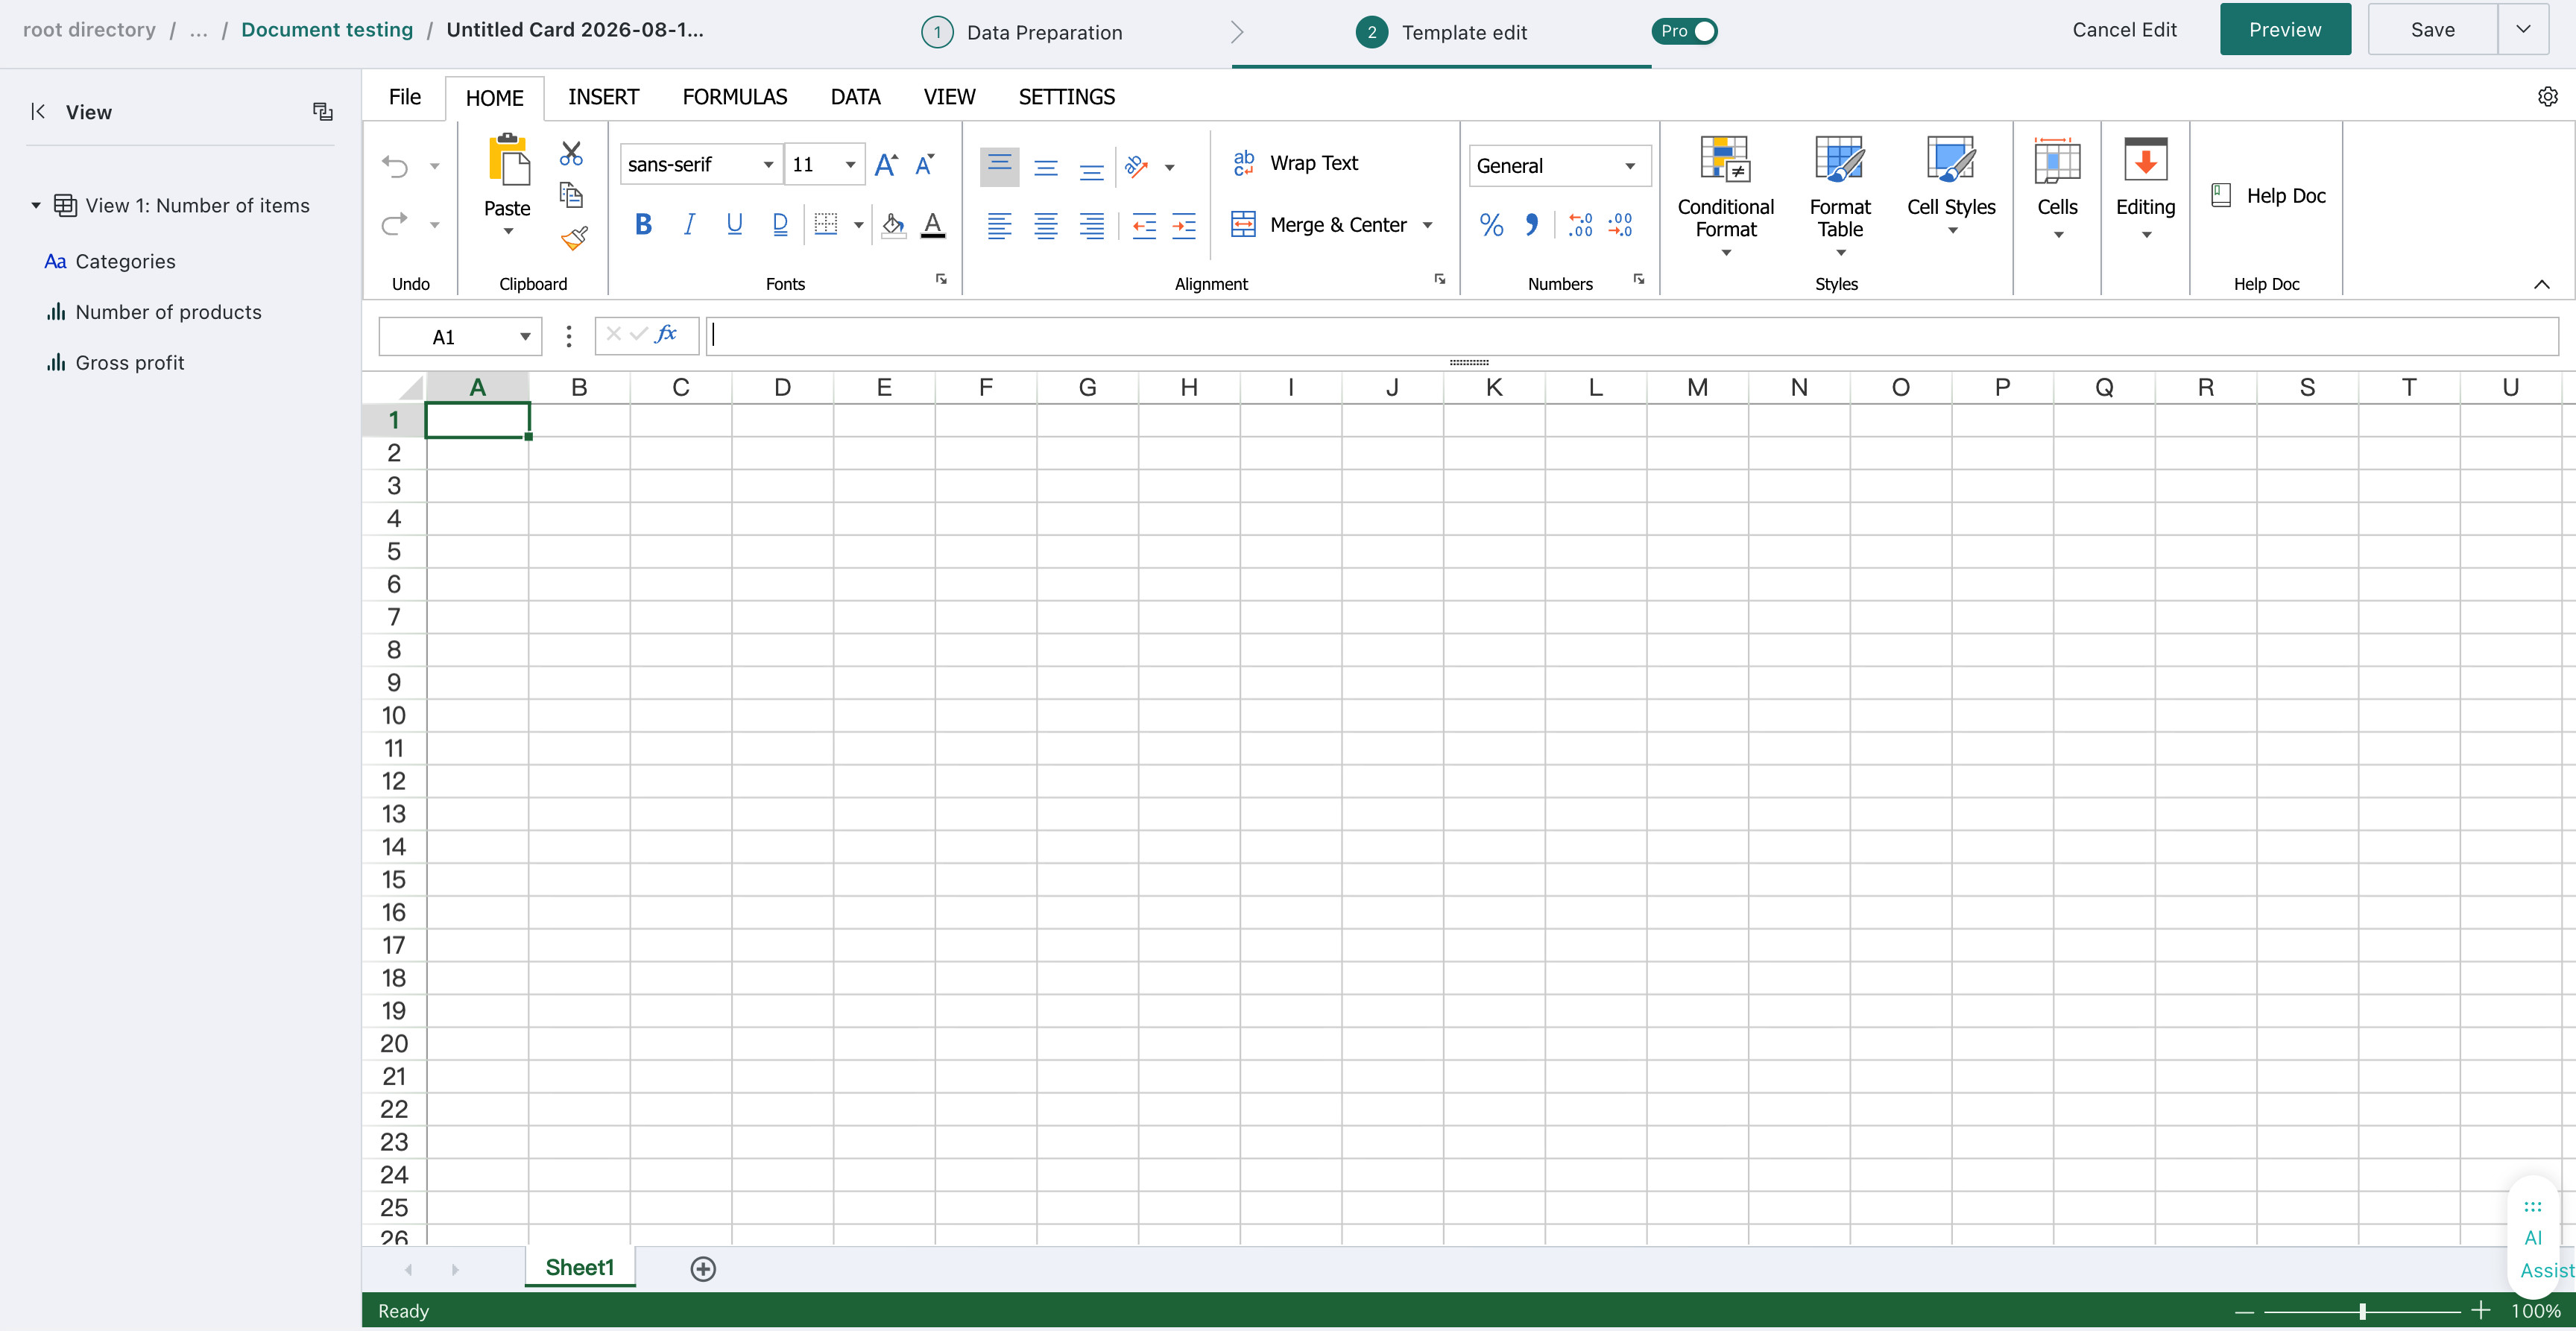
Based on the connected view data, edit and create a Chinese-style report online. Supports dragging fields, metrics, and dimensions to Excel. The editing function is the same as the original Chinese-style report.
For more details on Chinese-style Report Pro usage, see Chinese-style Reporting Pro Feature Overview.