Card Insights
Overview
Card Insights uses AI to automatically analyze data from different modules on a dashboard and provide deep, actionable conclusions beyond visualization. Compared with traditional visual charts, it gives users immediate analytical interpretation and practical guidance while they view the data, seamlessly connecting data analysis with business decision-making and significantly improving analytical efficiency and decision accuracy.
Applicable Scenarios
In enterprise analytics scenarios, Card Insights uses AI to uncover and present data value more deeply, overcoming the static limitations of traditional visual dashboards and providing automated, actionable decision support. Typical use cases include the following:
| Scenario | Business Pain Point | How Card Insights Helps | Business Value |
|---|---|---|---|
| More efficient operations analysis | |||
| Frontline business enablement | data summary + attribution analysis + action recommendations | ||
| Intelligent system enhancement | Outputs Smart Insights through APIs and embeds them into business systems or applications |
Prerequisites
-
Upgrade to version
7.3or later to use Card Insights.NoteA matching hotfix version is also required for Card Insights to work properly. If you are unsure whether your current version supports it, contact your Guandata sales representative or customer success manager.
-
License activation and LLM service configuration have been completed.
Dashboard Editors
Create a Card Insights Card
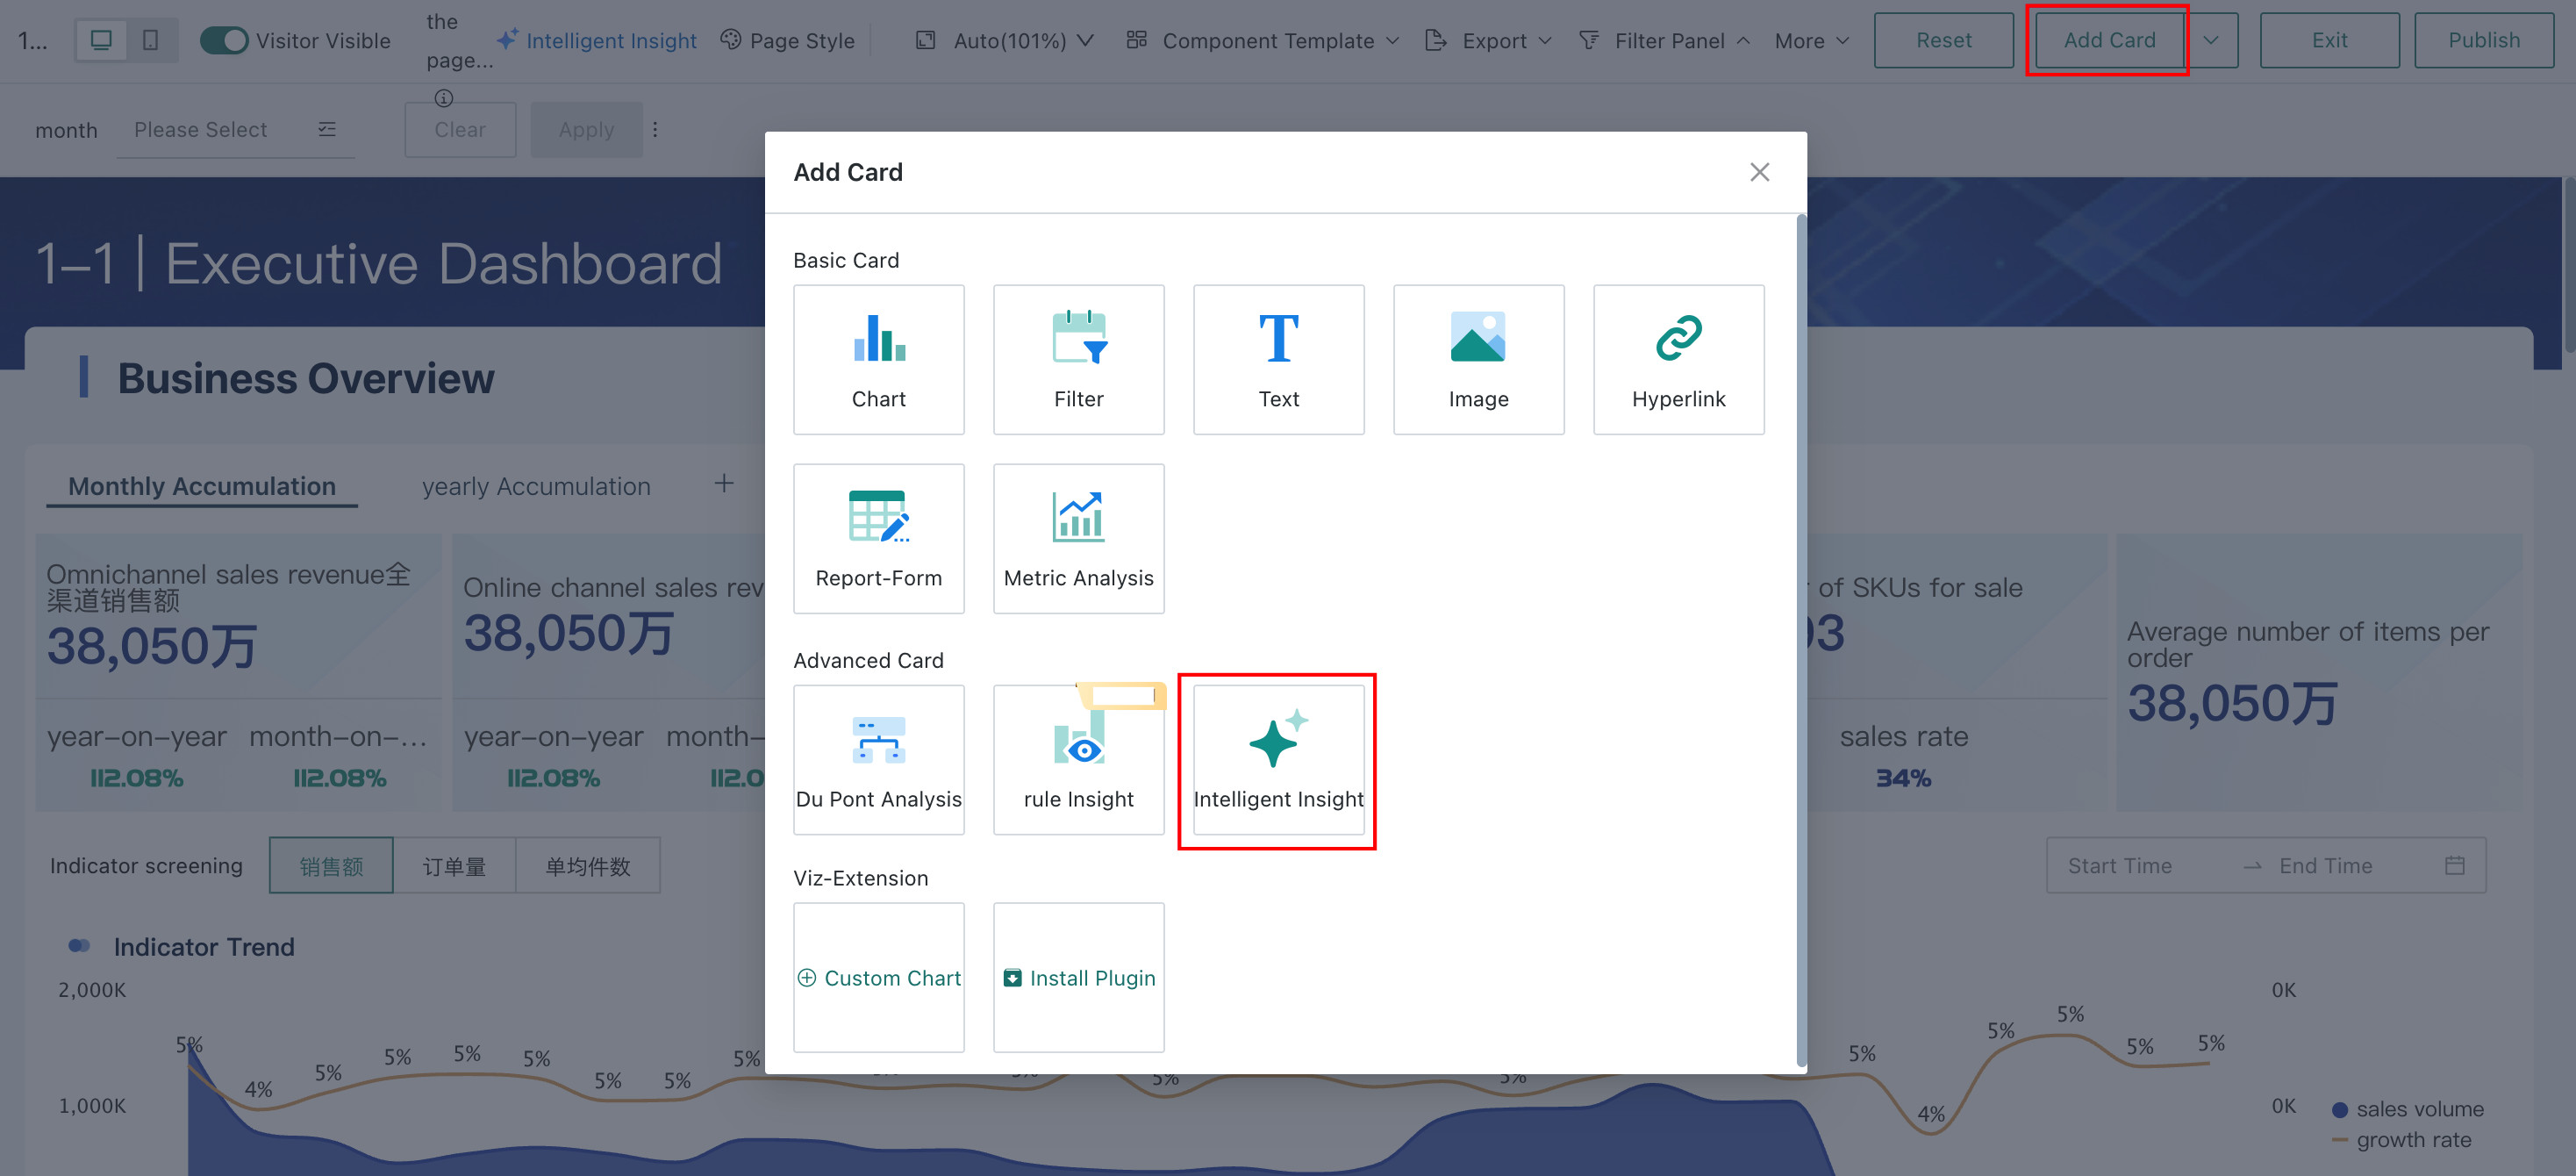
On the dashboard editing page, click Add Card > Intelligent Insight to add a new insight card to the current dashboard page.
Configure Card Insights
Desktop
Steps
-
Select the insight scope. Choose the cards to be included in Smart Insights. Supported card types include visual charts, text, China-Style Reports, Spreadsheet-style Data Entry, metric analysis, DuPont analysis charts, rule-based insights, and custom charts. Filters, images, and external links are excluded.
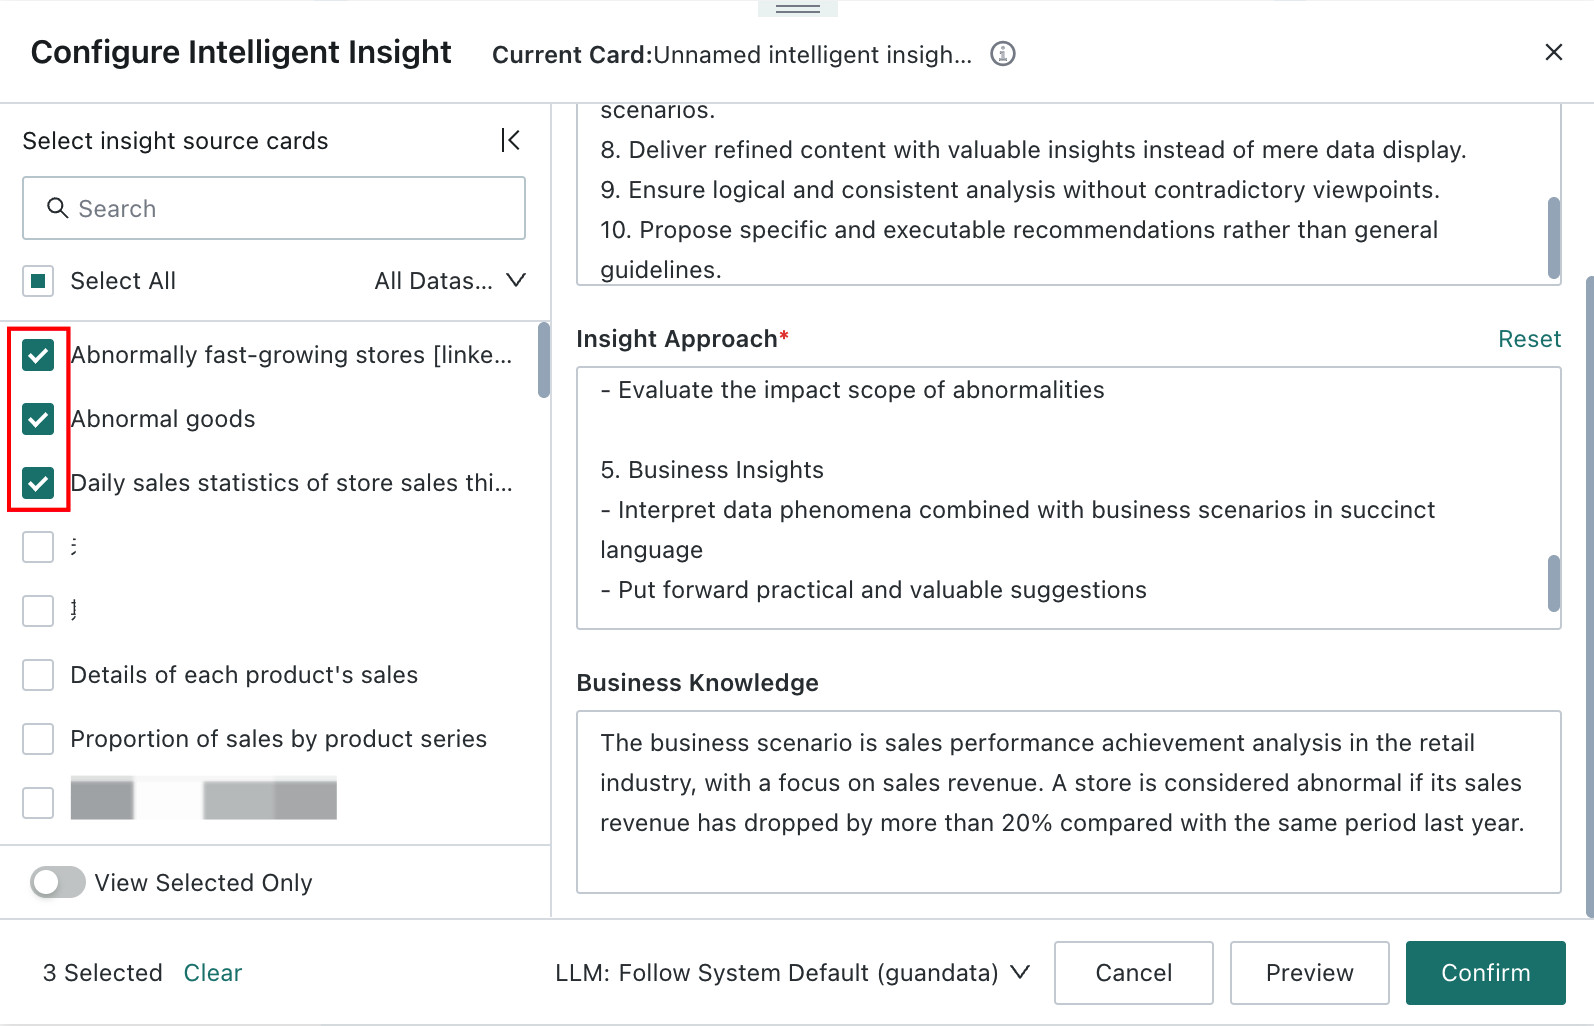
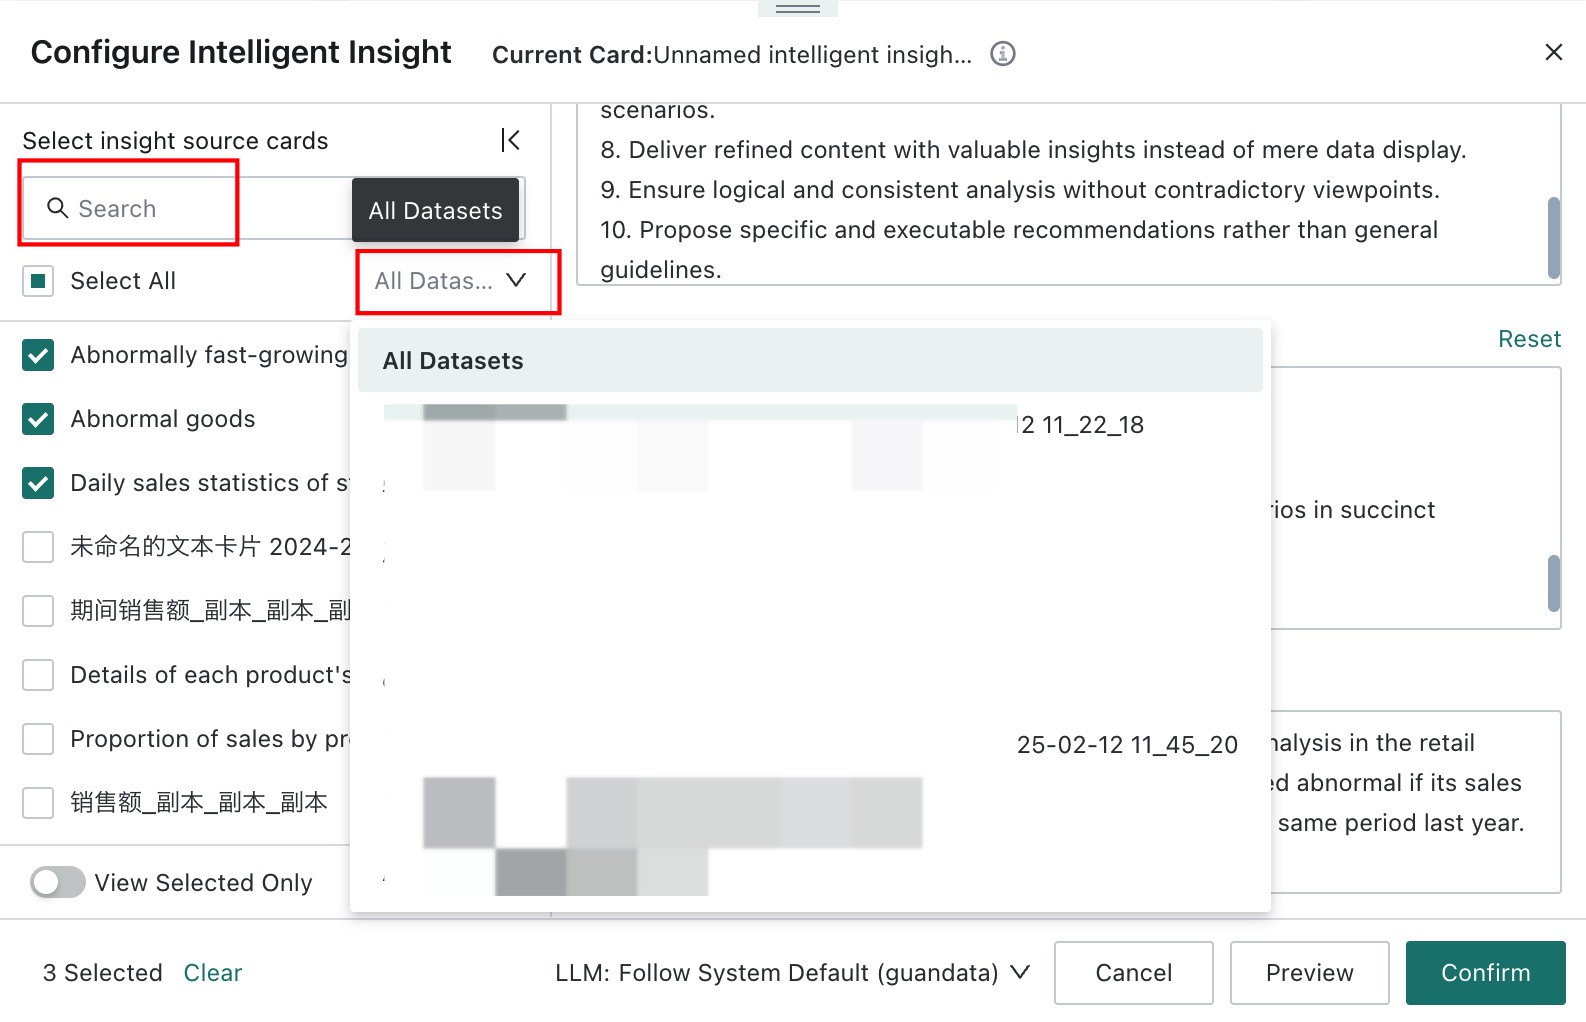
When selecting the scope, you can choose both cards currently in the page layout and cards in the card pool. Hover over the right side of a card. If it is already in the current page layout, you can clickLocate This Cardand the page jumps to that card. If it is not currently in the layout, the system showsThis Card Is Not in the Current Layout.Cards can be searched by name or filtered by Dataset before selection.
-
Configure prompts. In the
Configure Insightpage, use the right panel to setOutput Requirements,Insight Logic, andBusiness Knowledge. For guidance, see Configure Insight Prompts in Dashboard Insights and Prompt Writing Best Practices.
You can clickPreviewat any time during prompt configuration to check the result.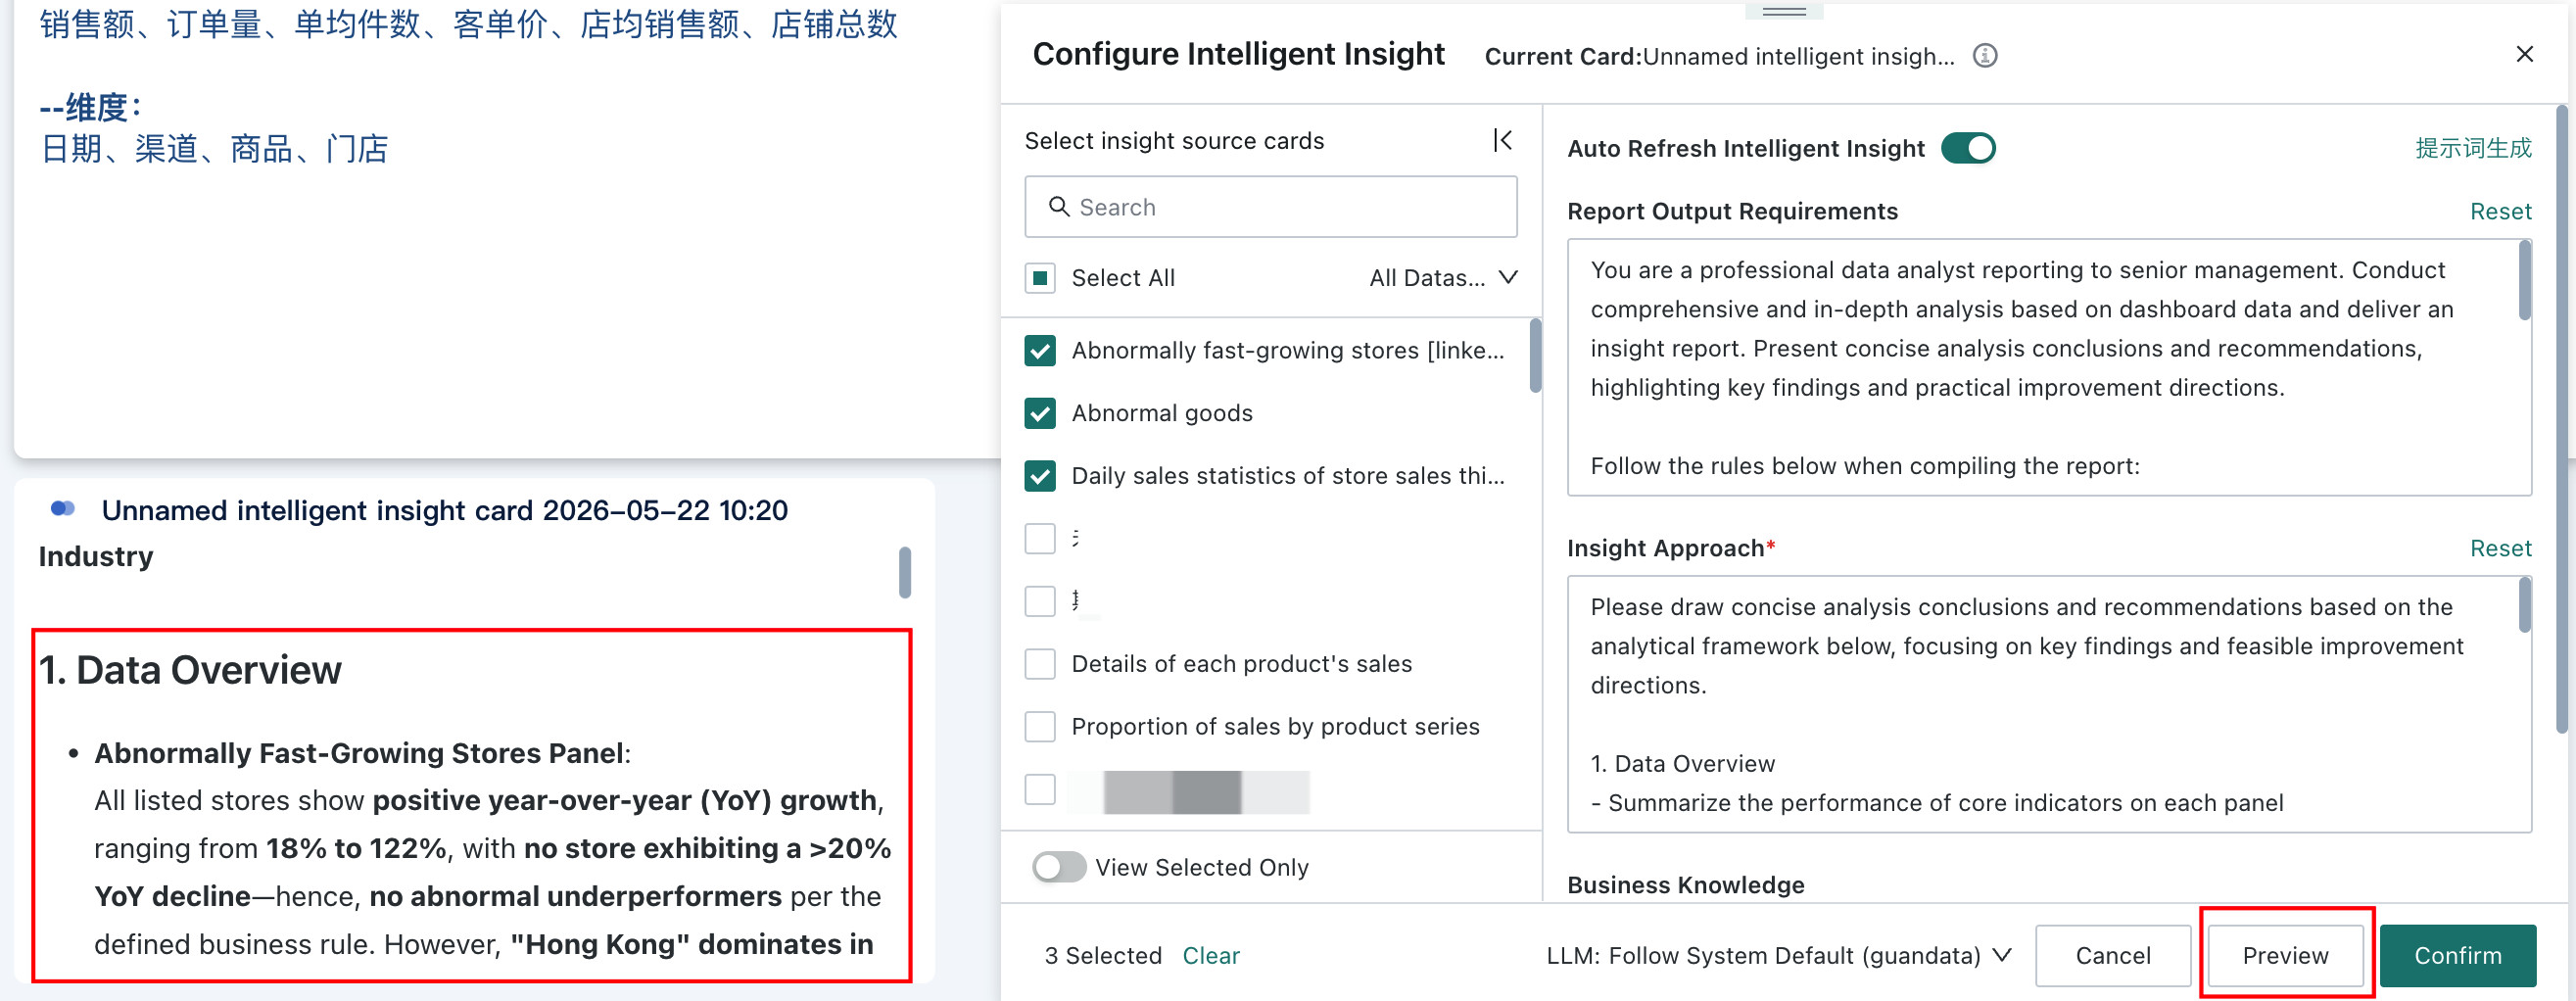
-
Select an LLM service. Choose the appropriate model as needed. If you do not switch it manually, the system uses the default LLM.
NoteBefore this step, make sure LLM Service has already been configured in
Admin Center > System Integration > LLM Service.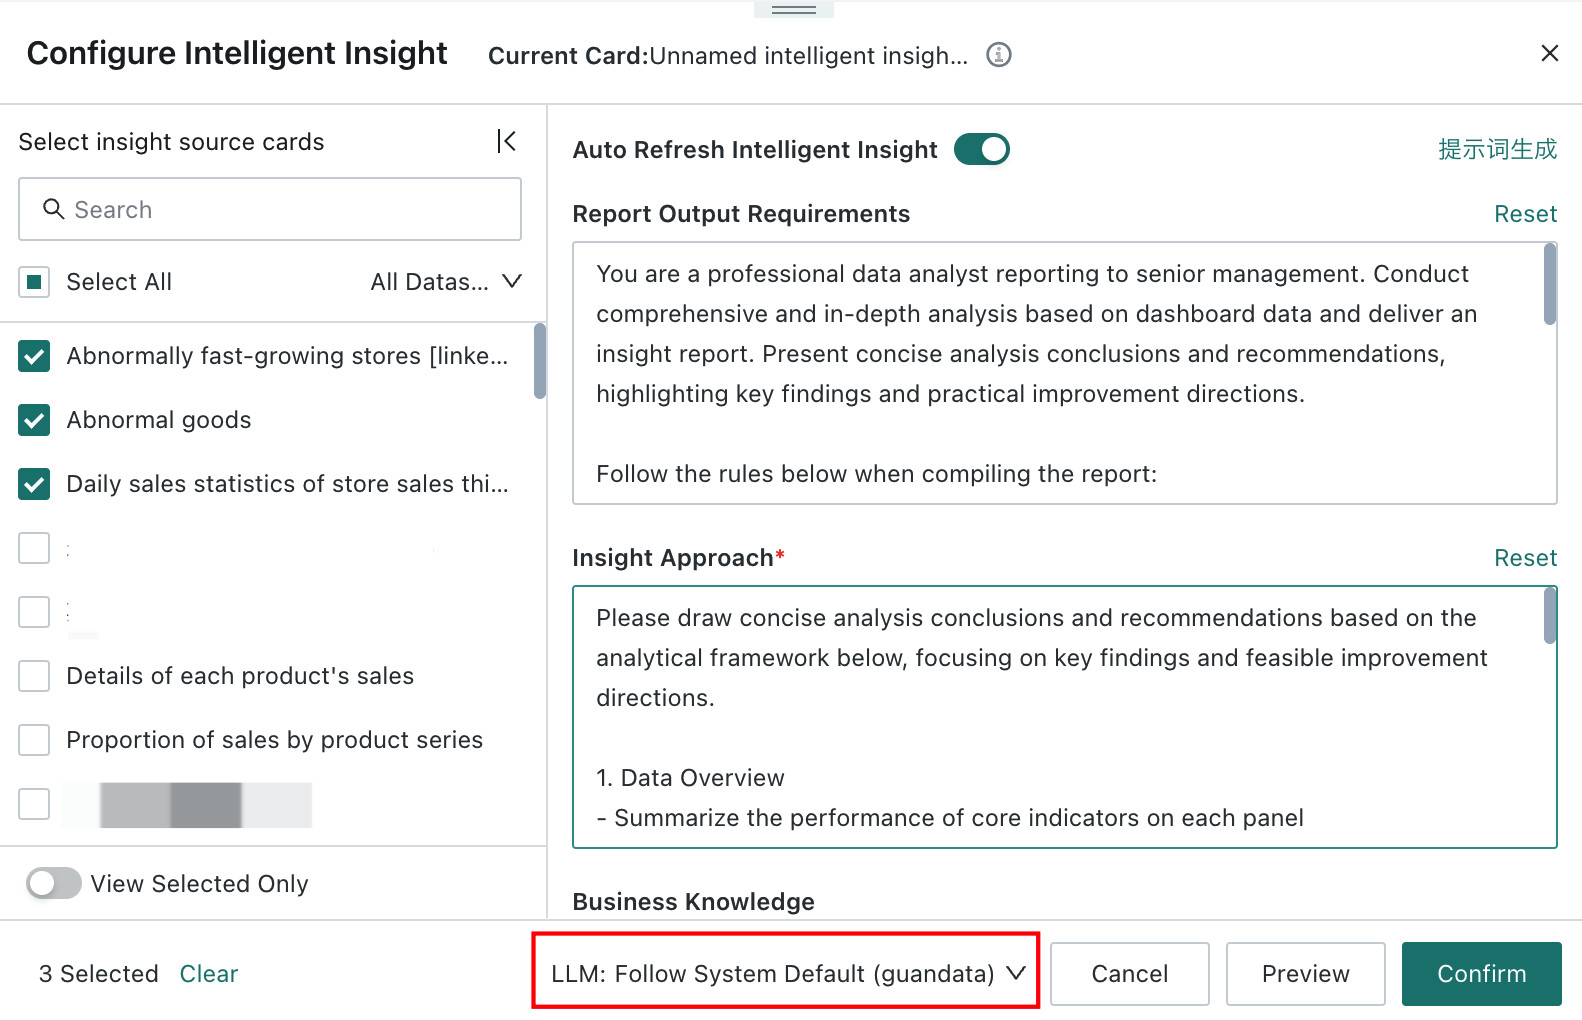
-
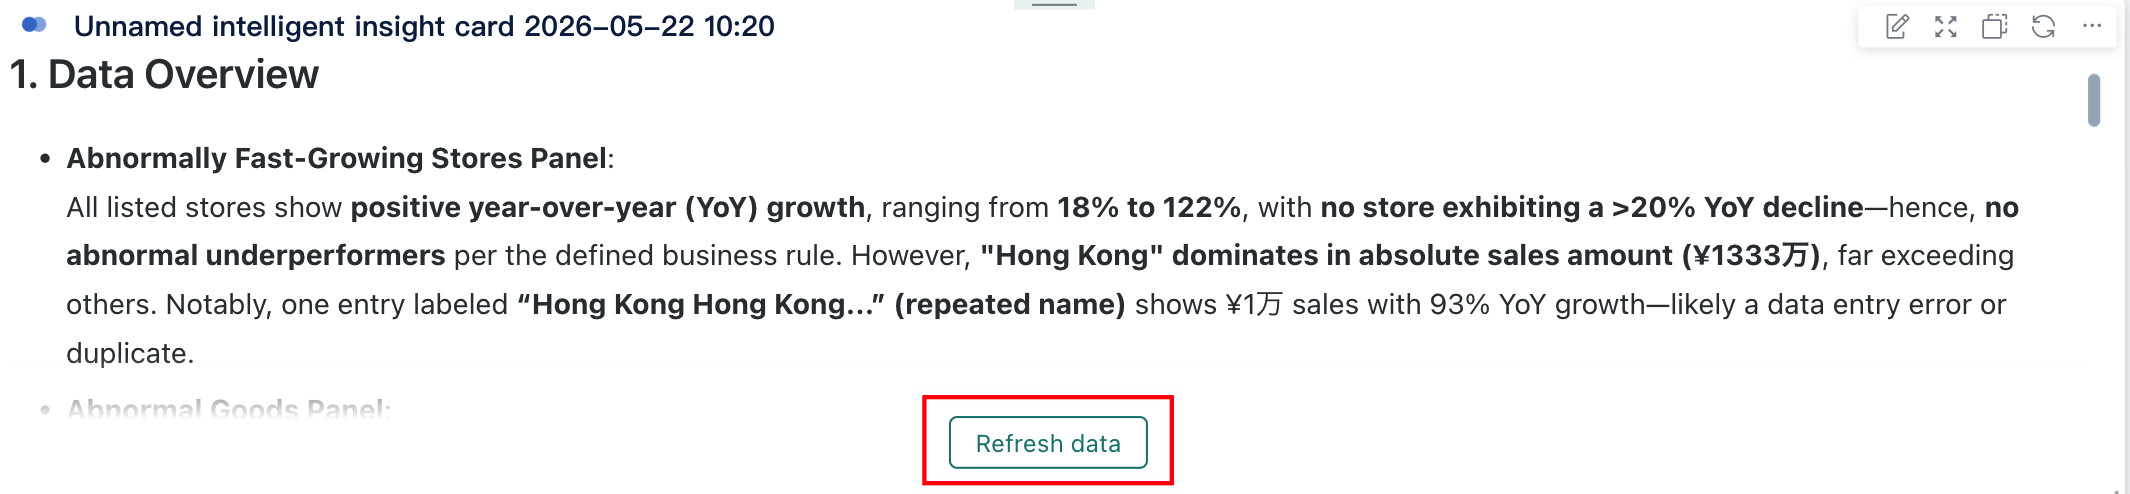
Optional: turn off automatic refresh of insight conclusions. If you do not want conclusions to refresh automatically when related cards change, disable
Automatically Refresh Insight Conclusions. After that, when the source card data changes, users must clickRefresh Datamanually to update the conclusion, which can help control LLM costs.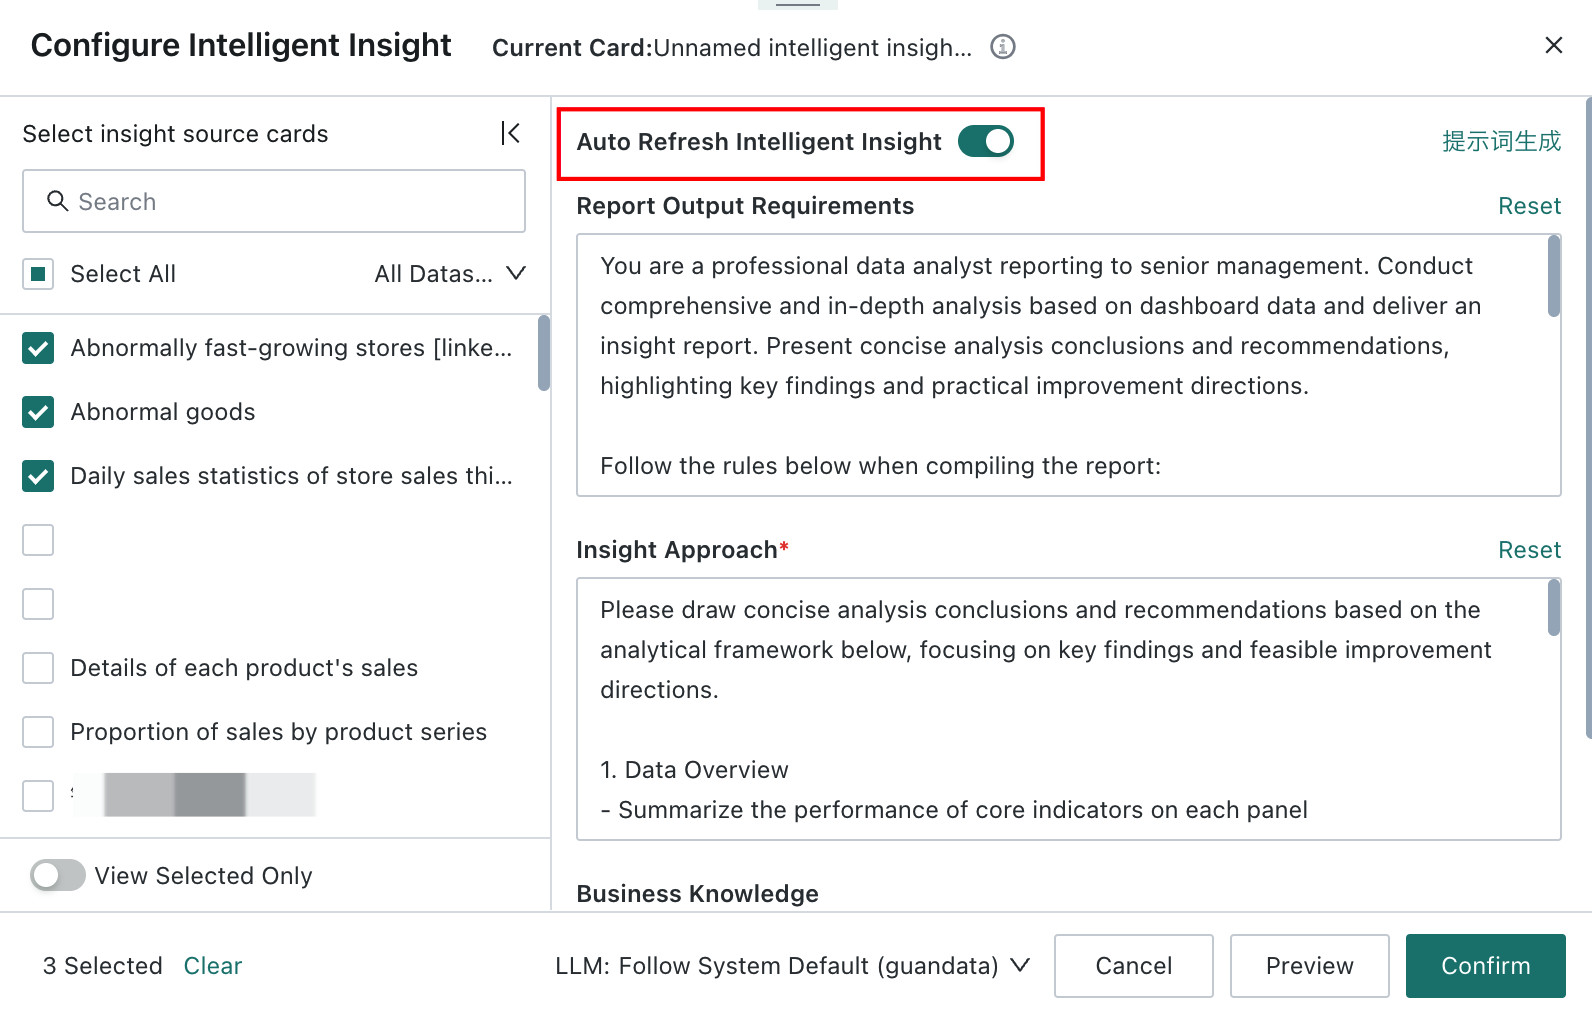
-
After finishing prompt and LLM service configuration, click
Confirmto complete the Card Insights configuration.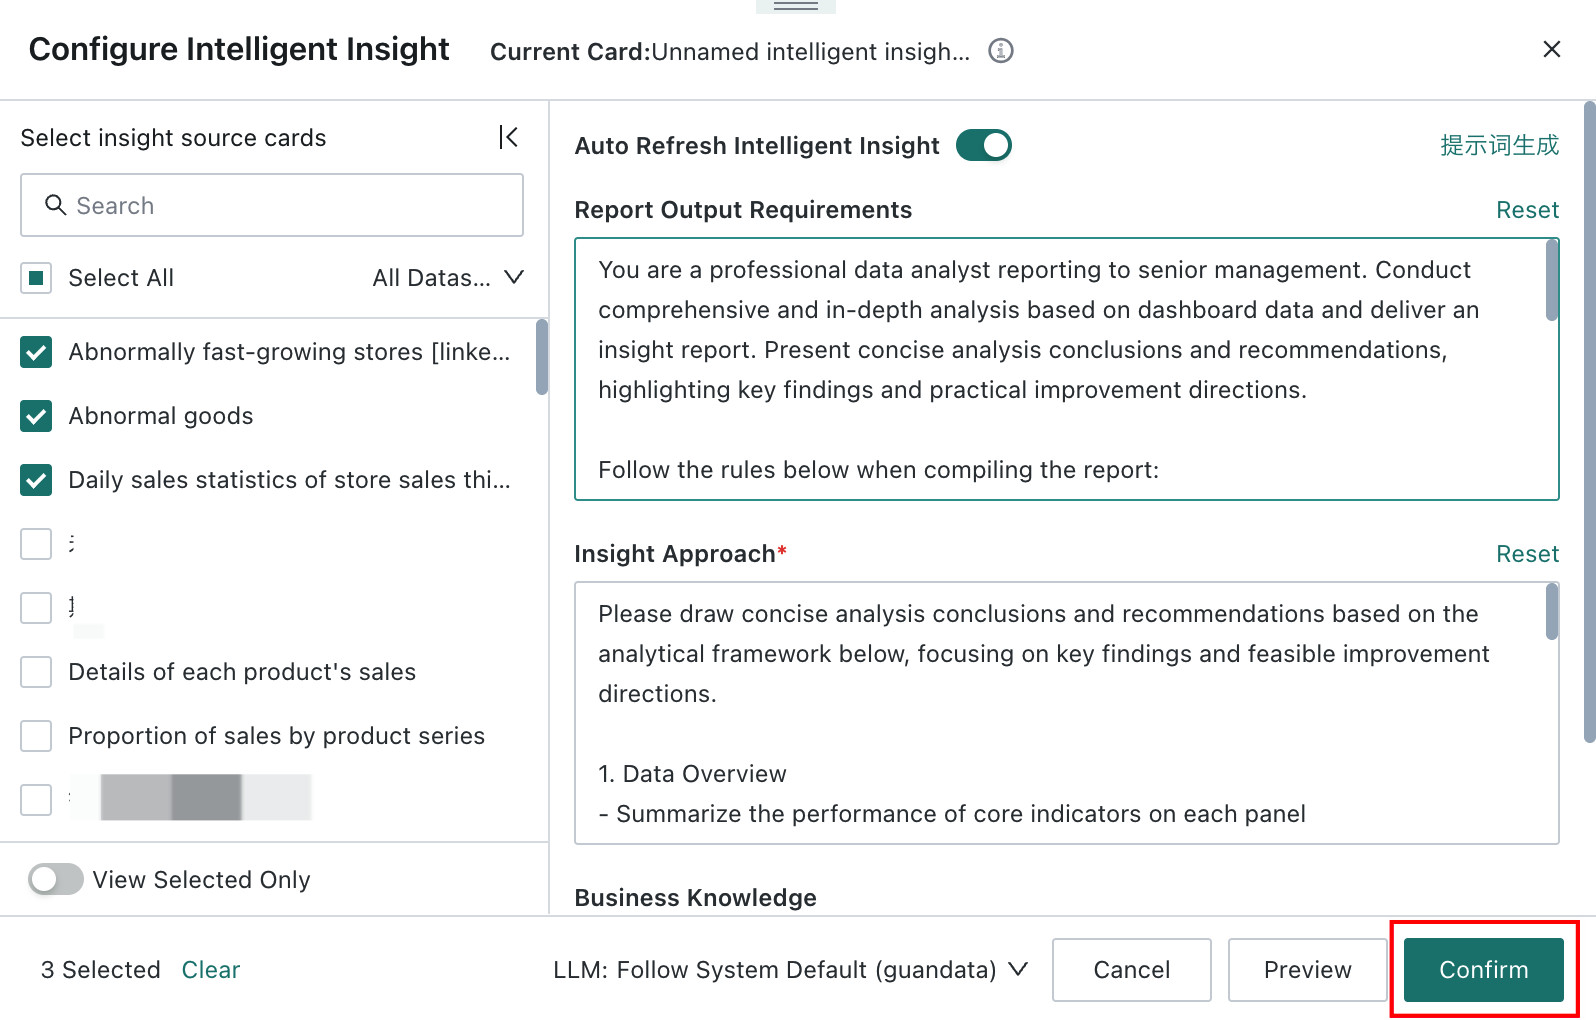
-
Optional: configure the title and card style.
- Click
More > Stylein the upper-right corner of the card.
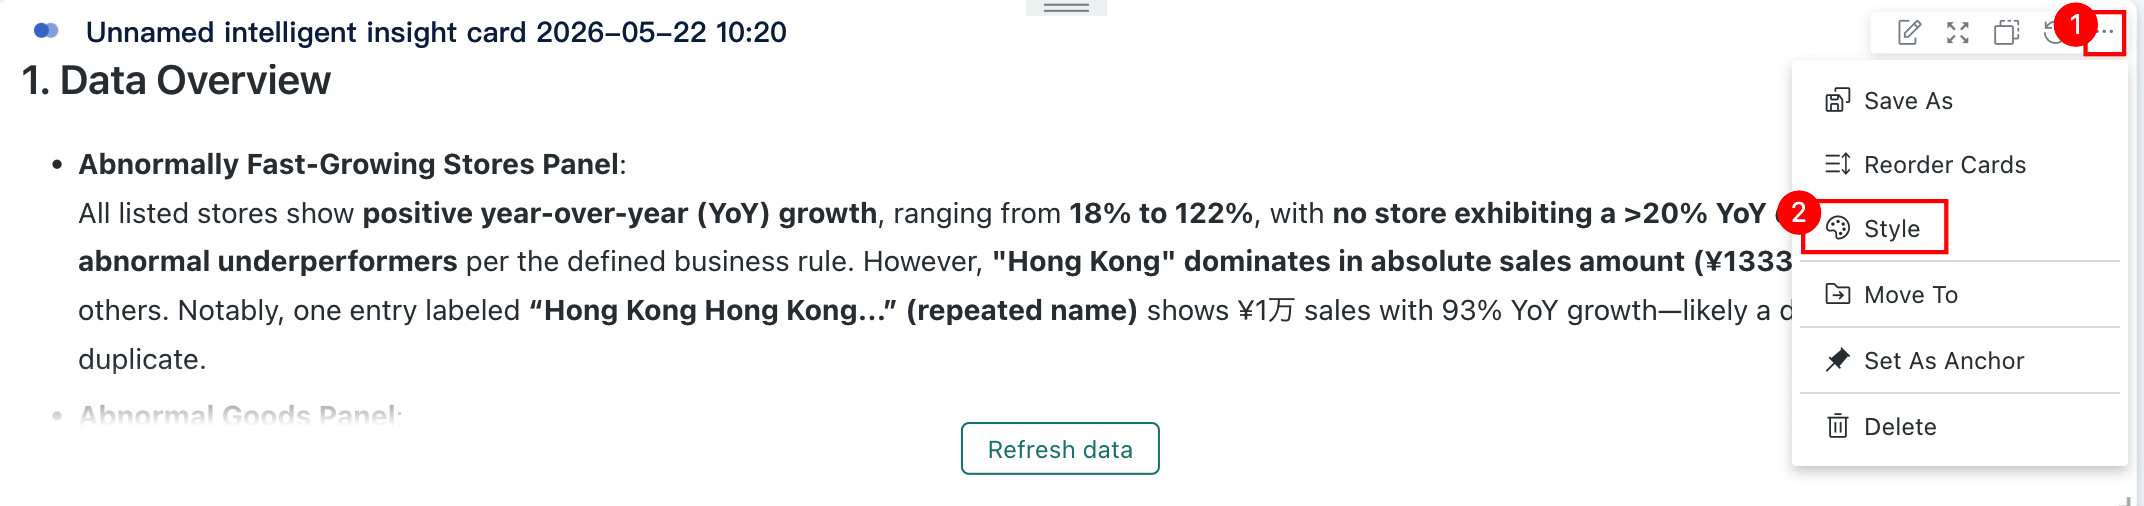
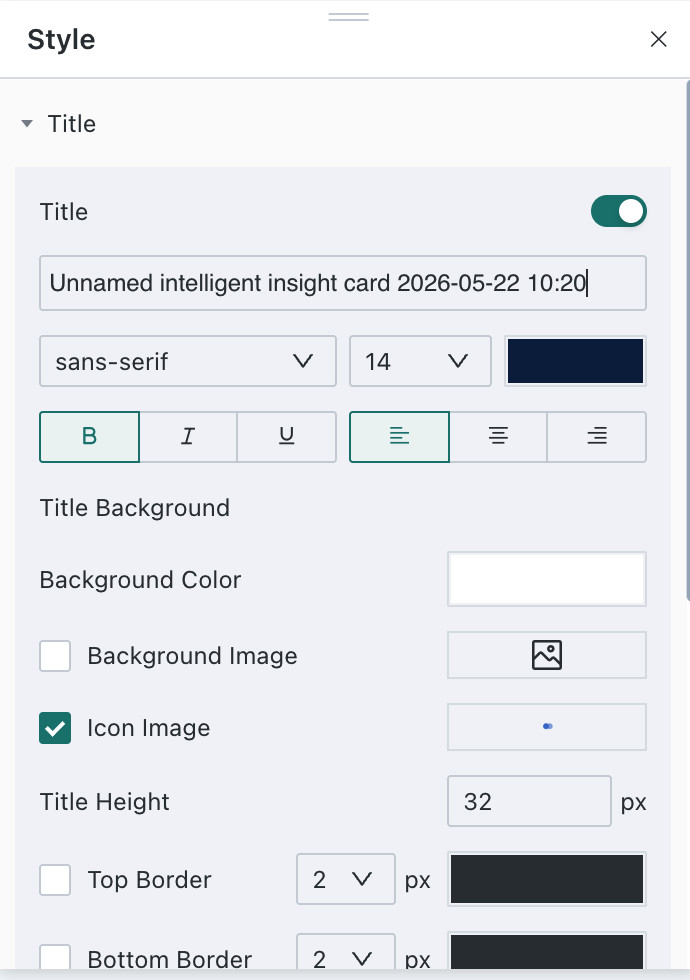
- On the
Stylepage, turn onTitle, assign a name to the card, and configure the title style and background.
- Click
Other operations
For the remaining operations, see Card Management - Desktop.
Card Insights does not support every operation available in general card management. The actual supported operations are determined by what appears on the page.
Mobile
Steps
-
Switch the dashboard to mobile layout. In the
Card Poolon the right, click the+in the upper-right corner of a card to add it to the page layout.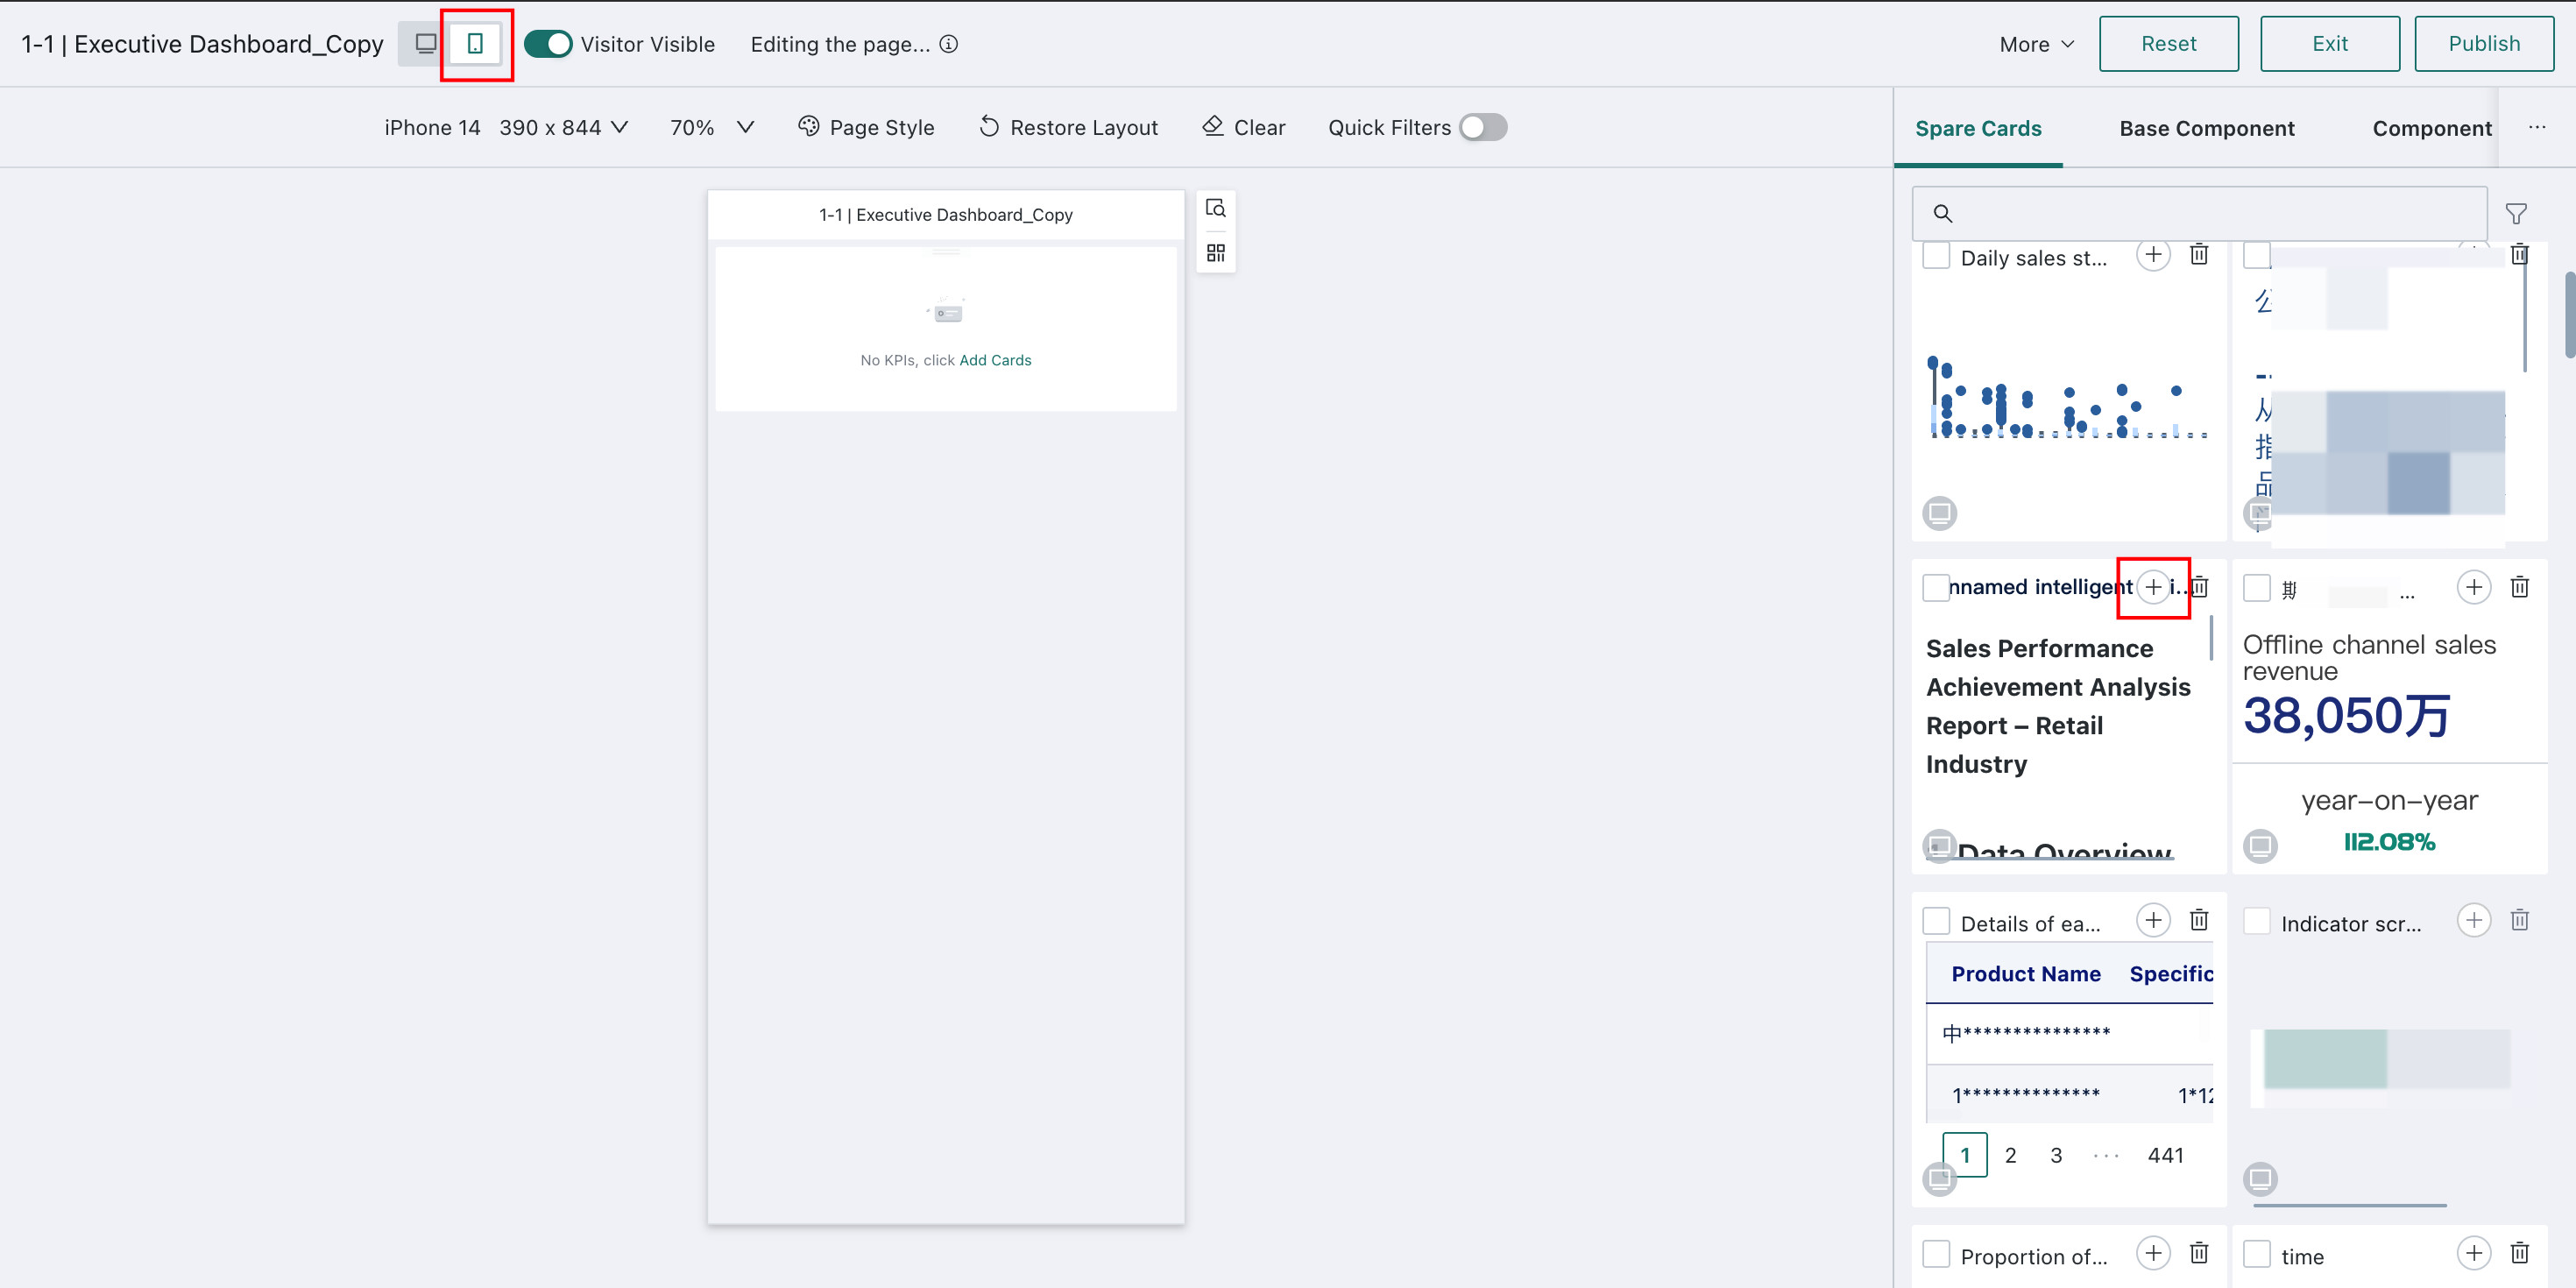
-
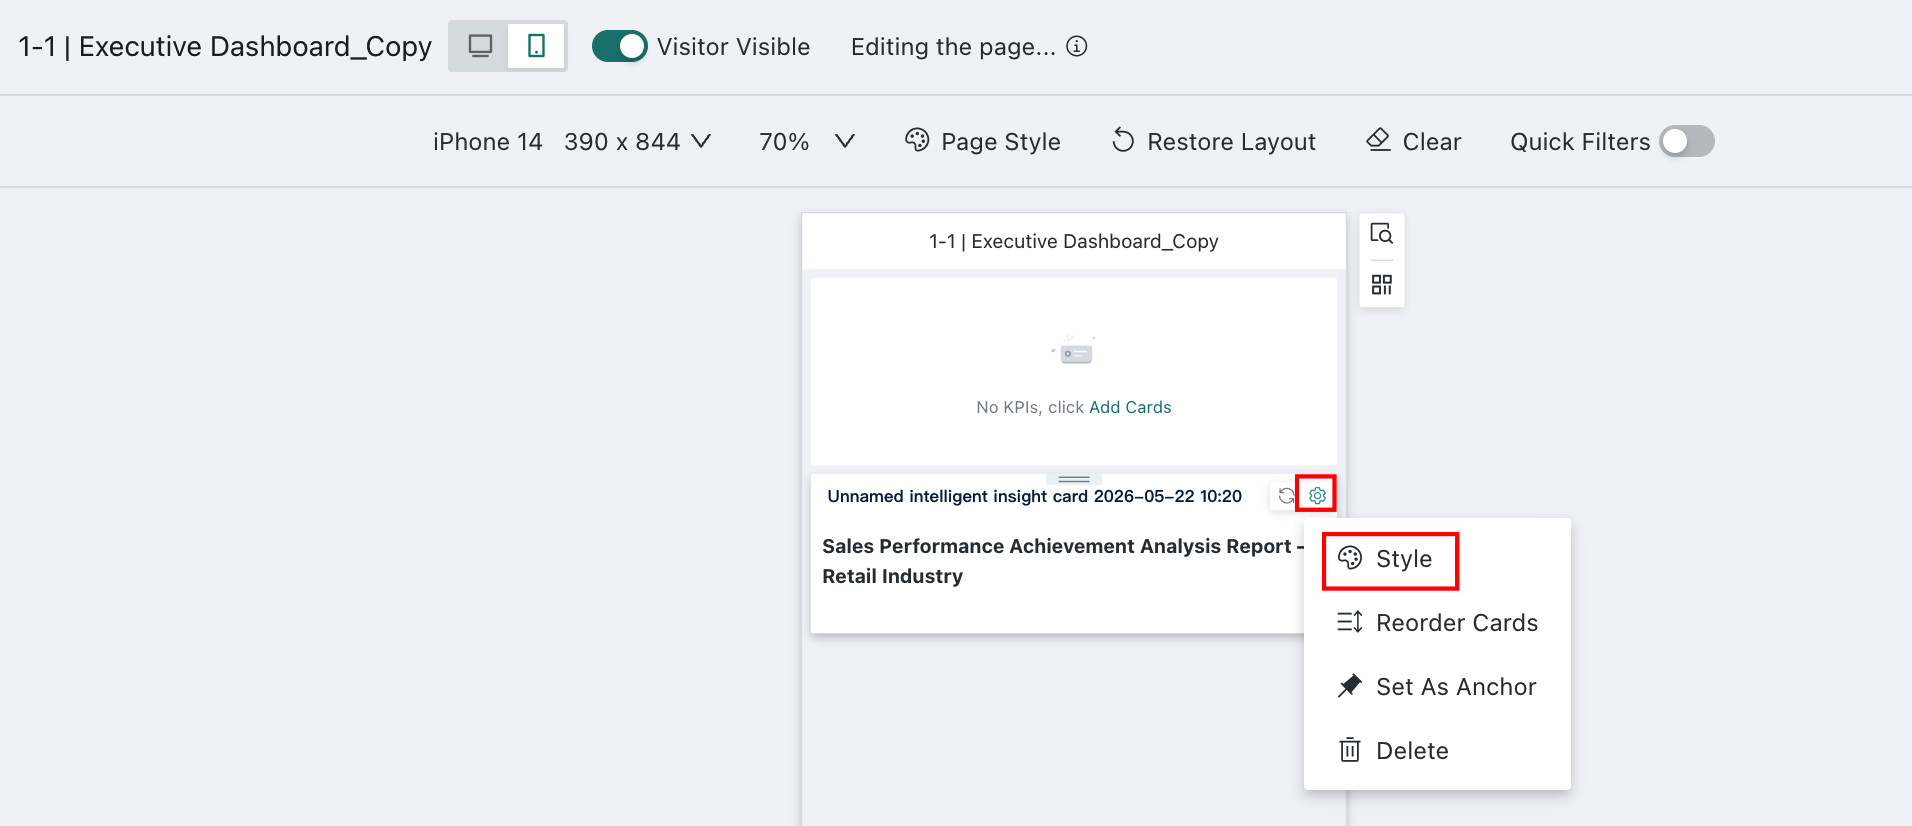
Optional: click
Settings > Stylein the upper-right corner of the card to configure mobile title styles and card background.NoteTitle style and card background inherit the desktop configuration.
Other operations
For the remaining operations, see Card Management - Mobile.
Card Insights does not support every operation available in general card management. The actual supported operations are determined by what appears on the page.
Publish Card Insights
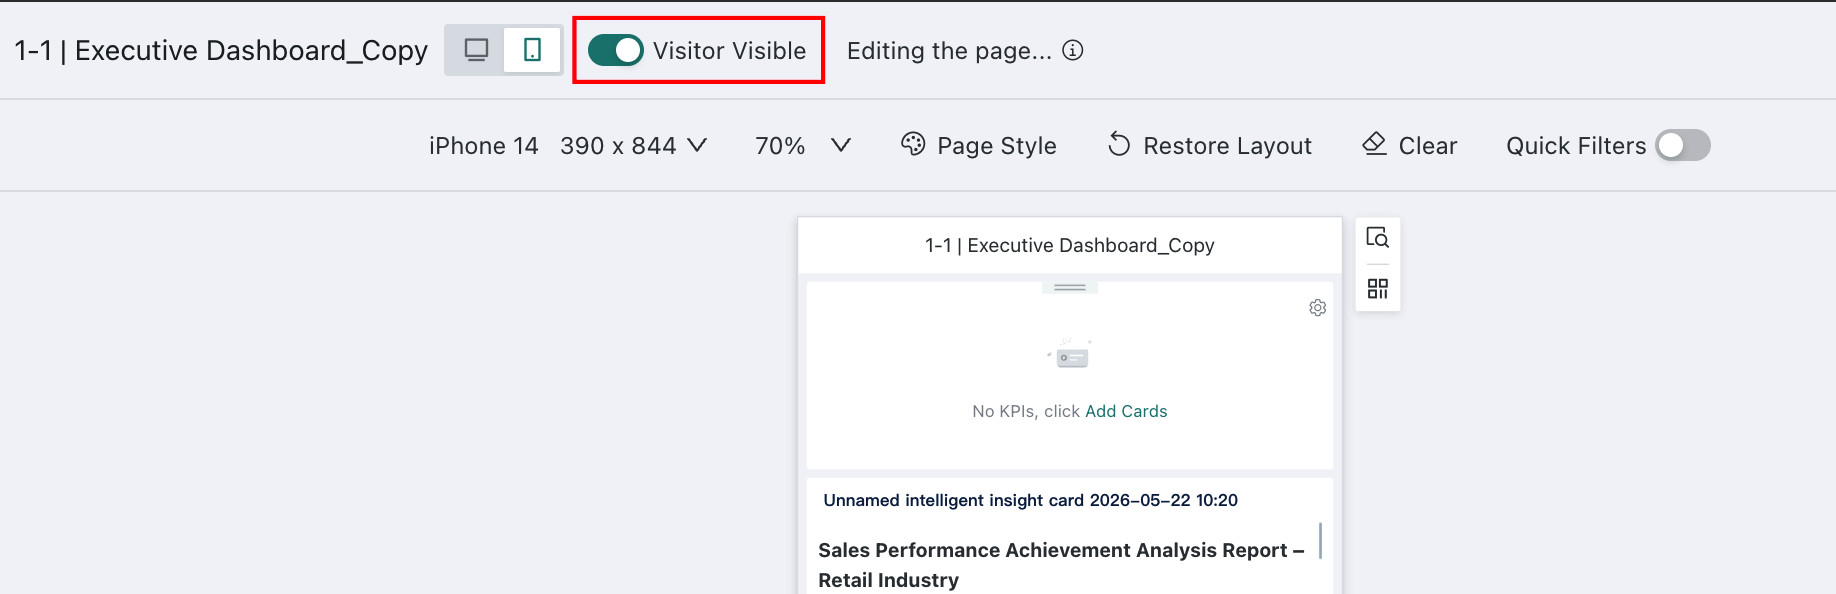
After card configuration is complete, turn on Visible to Viewers and click Publish in the upper-right corner to publish the insight online for dashboard viewers.
The Visible to Viewers switch must be enabled separately for desktop and mobile.
Subscribe to Card Insights
Card Insights supports subscription delivery. For details, see Card Insights Subscription.
Dashboard Viewers
The following examples use mobile as the primary scenario.
View Insight Conclusions
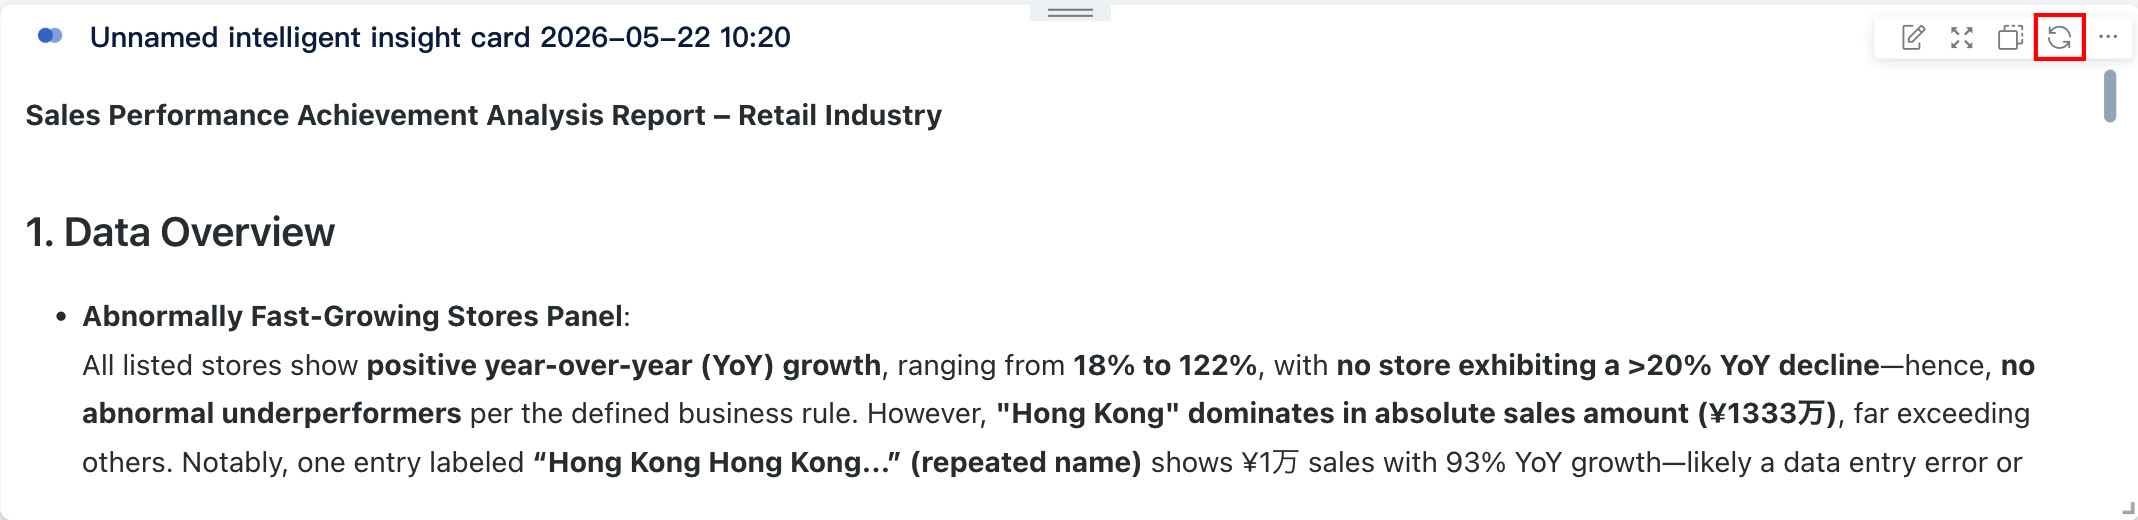
For dashboards where the user has viewer access, Card Insights can be viewed directly on mobile. Users can also enlarge the card, copy the result, and trigger regeneration.
-
Copy: Click
Copyto copy the generated insight content to the clipboard. The copied result can be pasted directly into reports or presentation materials, and text formatting such as bold, indentation, and numbered lists is preserved.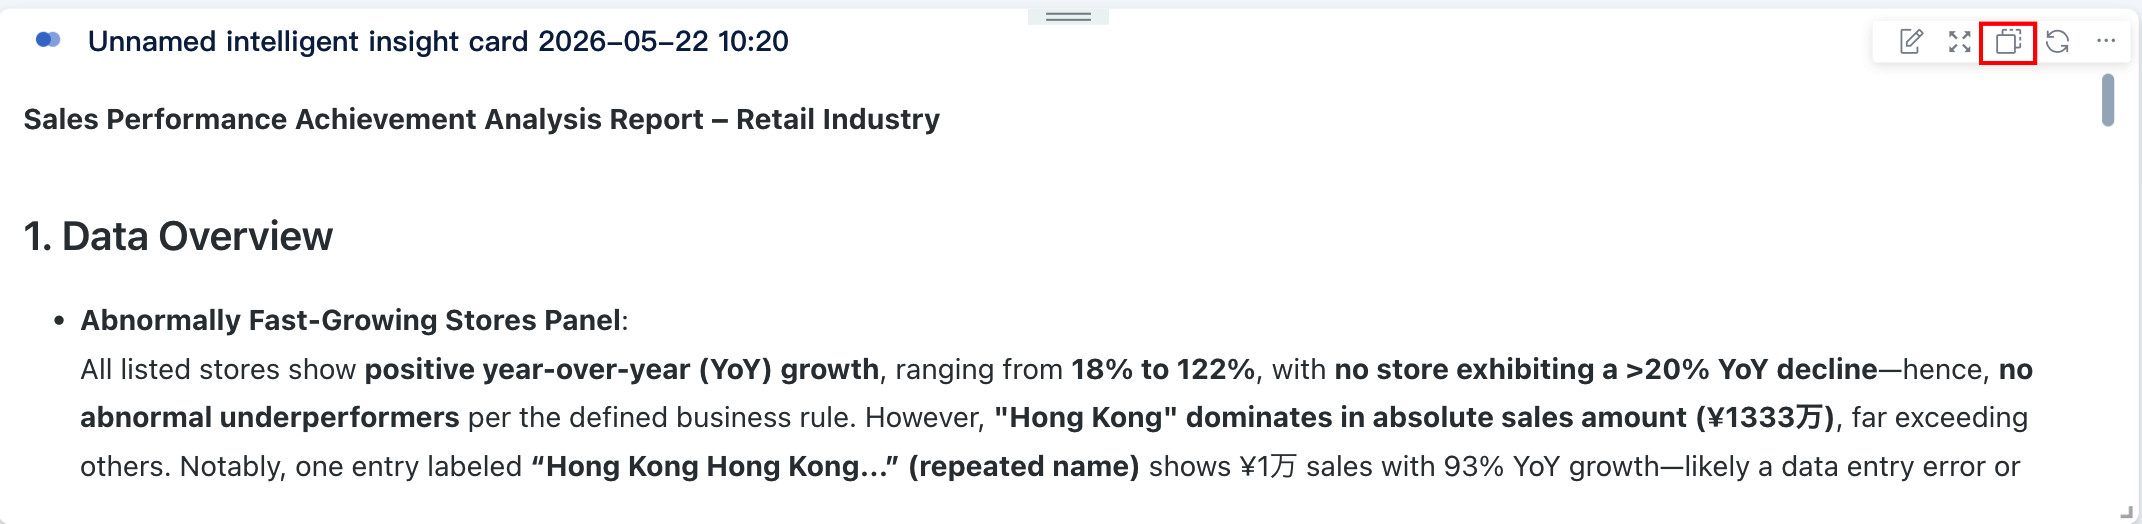
-
Re-Insight: If the generated conclusion is unsatisfactory, click this button to regenerate it.
View Insight Subscriptions
When a subscription is triggered, the recipient receives the message in the configured channel and can directly view the insight conclusion there. For details, see View Subscription Results.
Limitations
-
Image cards and external-link cards are not currently supported.
-
Table-type cards provide the first 200 rows of data for analysis.
If you need to change the number of table rows available for analysis, go to
Admin Center > Open Platform > Plugin Managementand modify the configuration by creating a plugin. For plugin management operations, see Plugin Management.NoteThis configuration takes effect globally and applies to both Dashboard Insights and Card Insights.
Example: change
200in the code below to the required number of rows.
GD.dispatch('config-dashboard-insight-settings', {
    cardDataLimit: 200, // Modify the table row limit here
})