View User Activity Records
This article explains how to enable and view user activity records for Guandata Dashboard Insights.
Feature Overview
After the feature is enabled, the system automatically collects and stores key user actions performed in Dashboard Insights and Card Insights, such as generating insights and initiating follow-up questions. The data is synchronized to a built-in dataset, and you can also view a processed dataset that is easier to read.
Enable the Feature
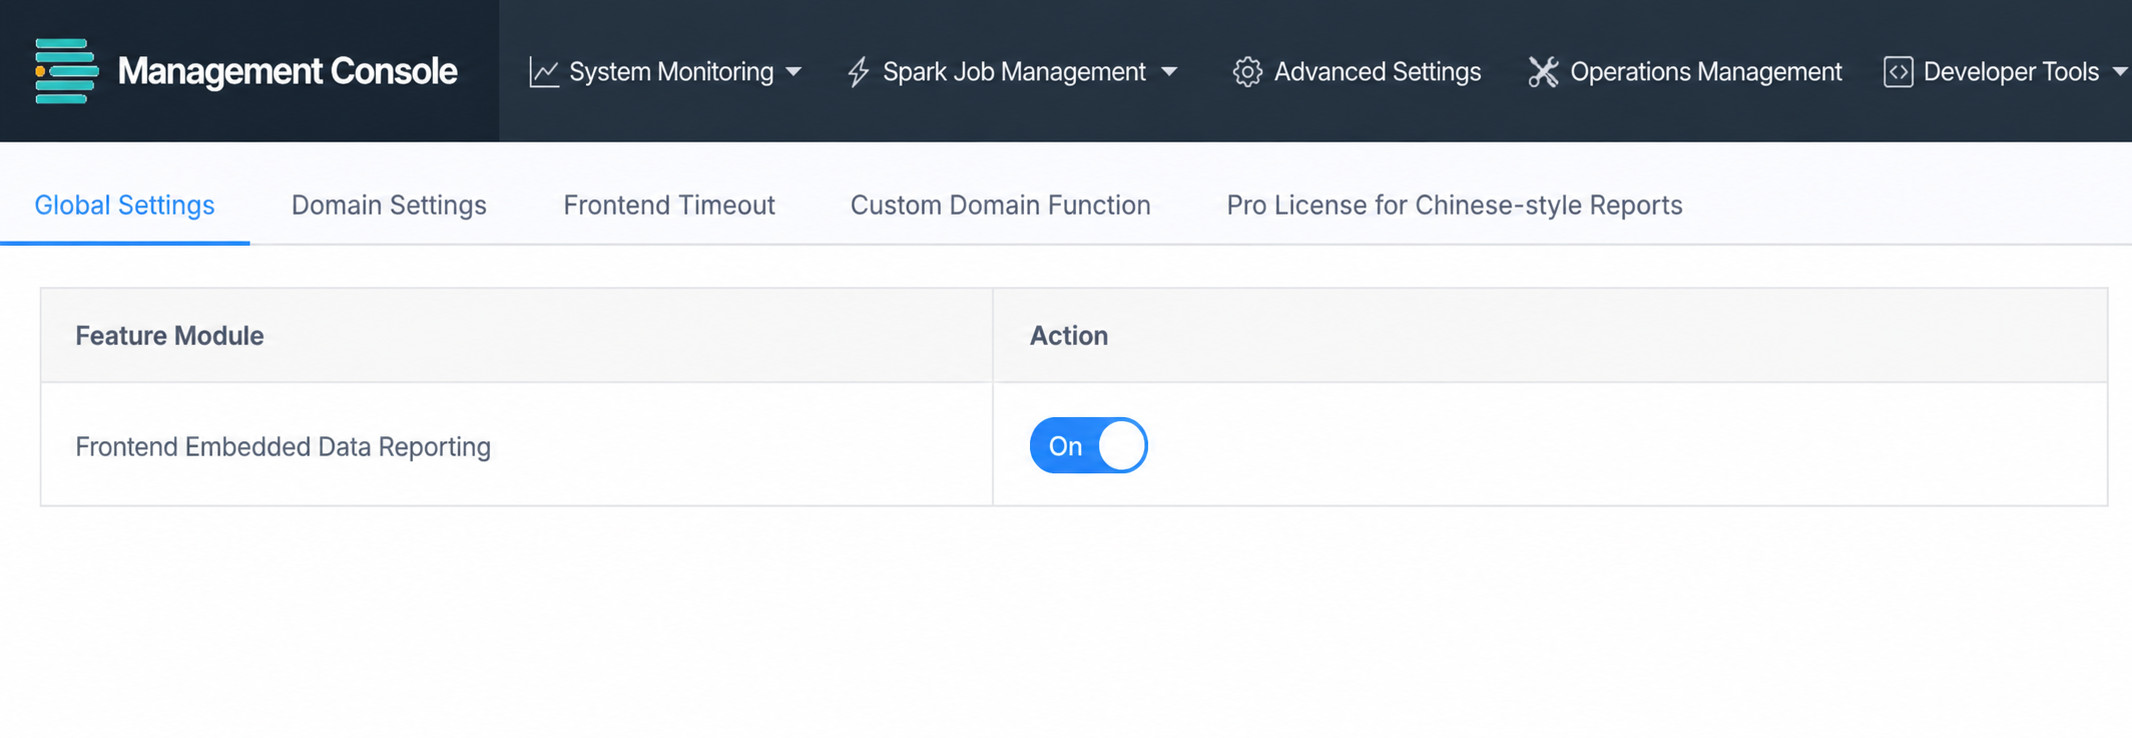
Go to System Operations Page > Advanced Settings > Global Settings and enable the Front-End Tracking Data Reporting switch.
For how to access the operations page, see Introduction to the System Operations Page.
Reported Data
After the feature is enabled, front-end data is automatically reported whenever users interact with the feature. All reported data is ultimately stored in the user_use_information_record dataset.
Below is an example of data automatically reported when a user performs actions in Dashboard Insights or Card Insights, such as generating insights or asking follow-up questions:
{
  "deviceId": "xxx",
  "product": "guandata-web",
  "dataType": "BURIED_POINT_DATA",
  "time": "2025-09-26 14:11:11",
  "data": [
    {
      "type": "custom",
      "data": {
        "type": "dashboardInsight", // Operation type: dashboard or card insight
        "pgId": "Page ID", // Related dashboard ID
        "operation": "generate", // User action: generate, refresh, and so on
        "llm": "deepseek-V3" // Invoked LLM
      }
    }
  ]
}
View the Data
View the Raw Dataset (user_use_information_record)
The automatically created user_use_information_record dataset contains the full raw reporting payload.
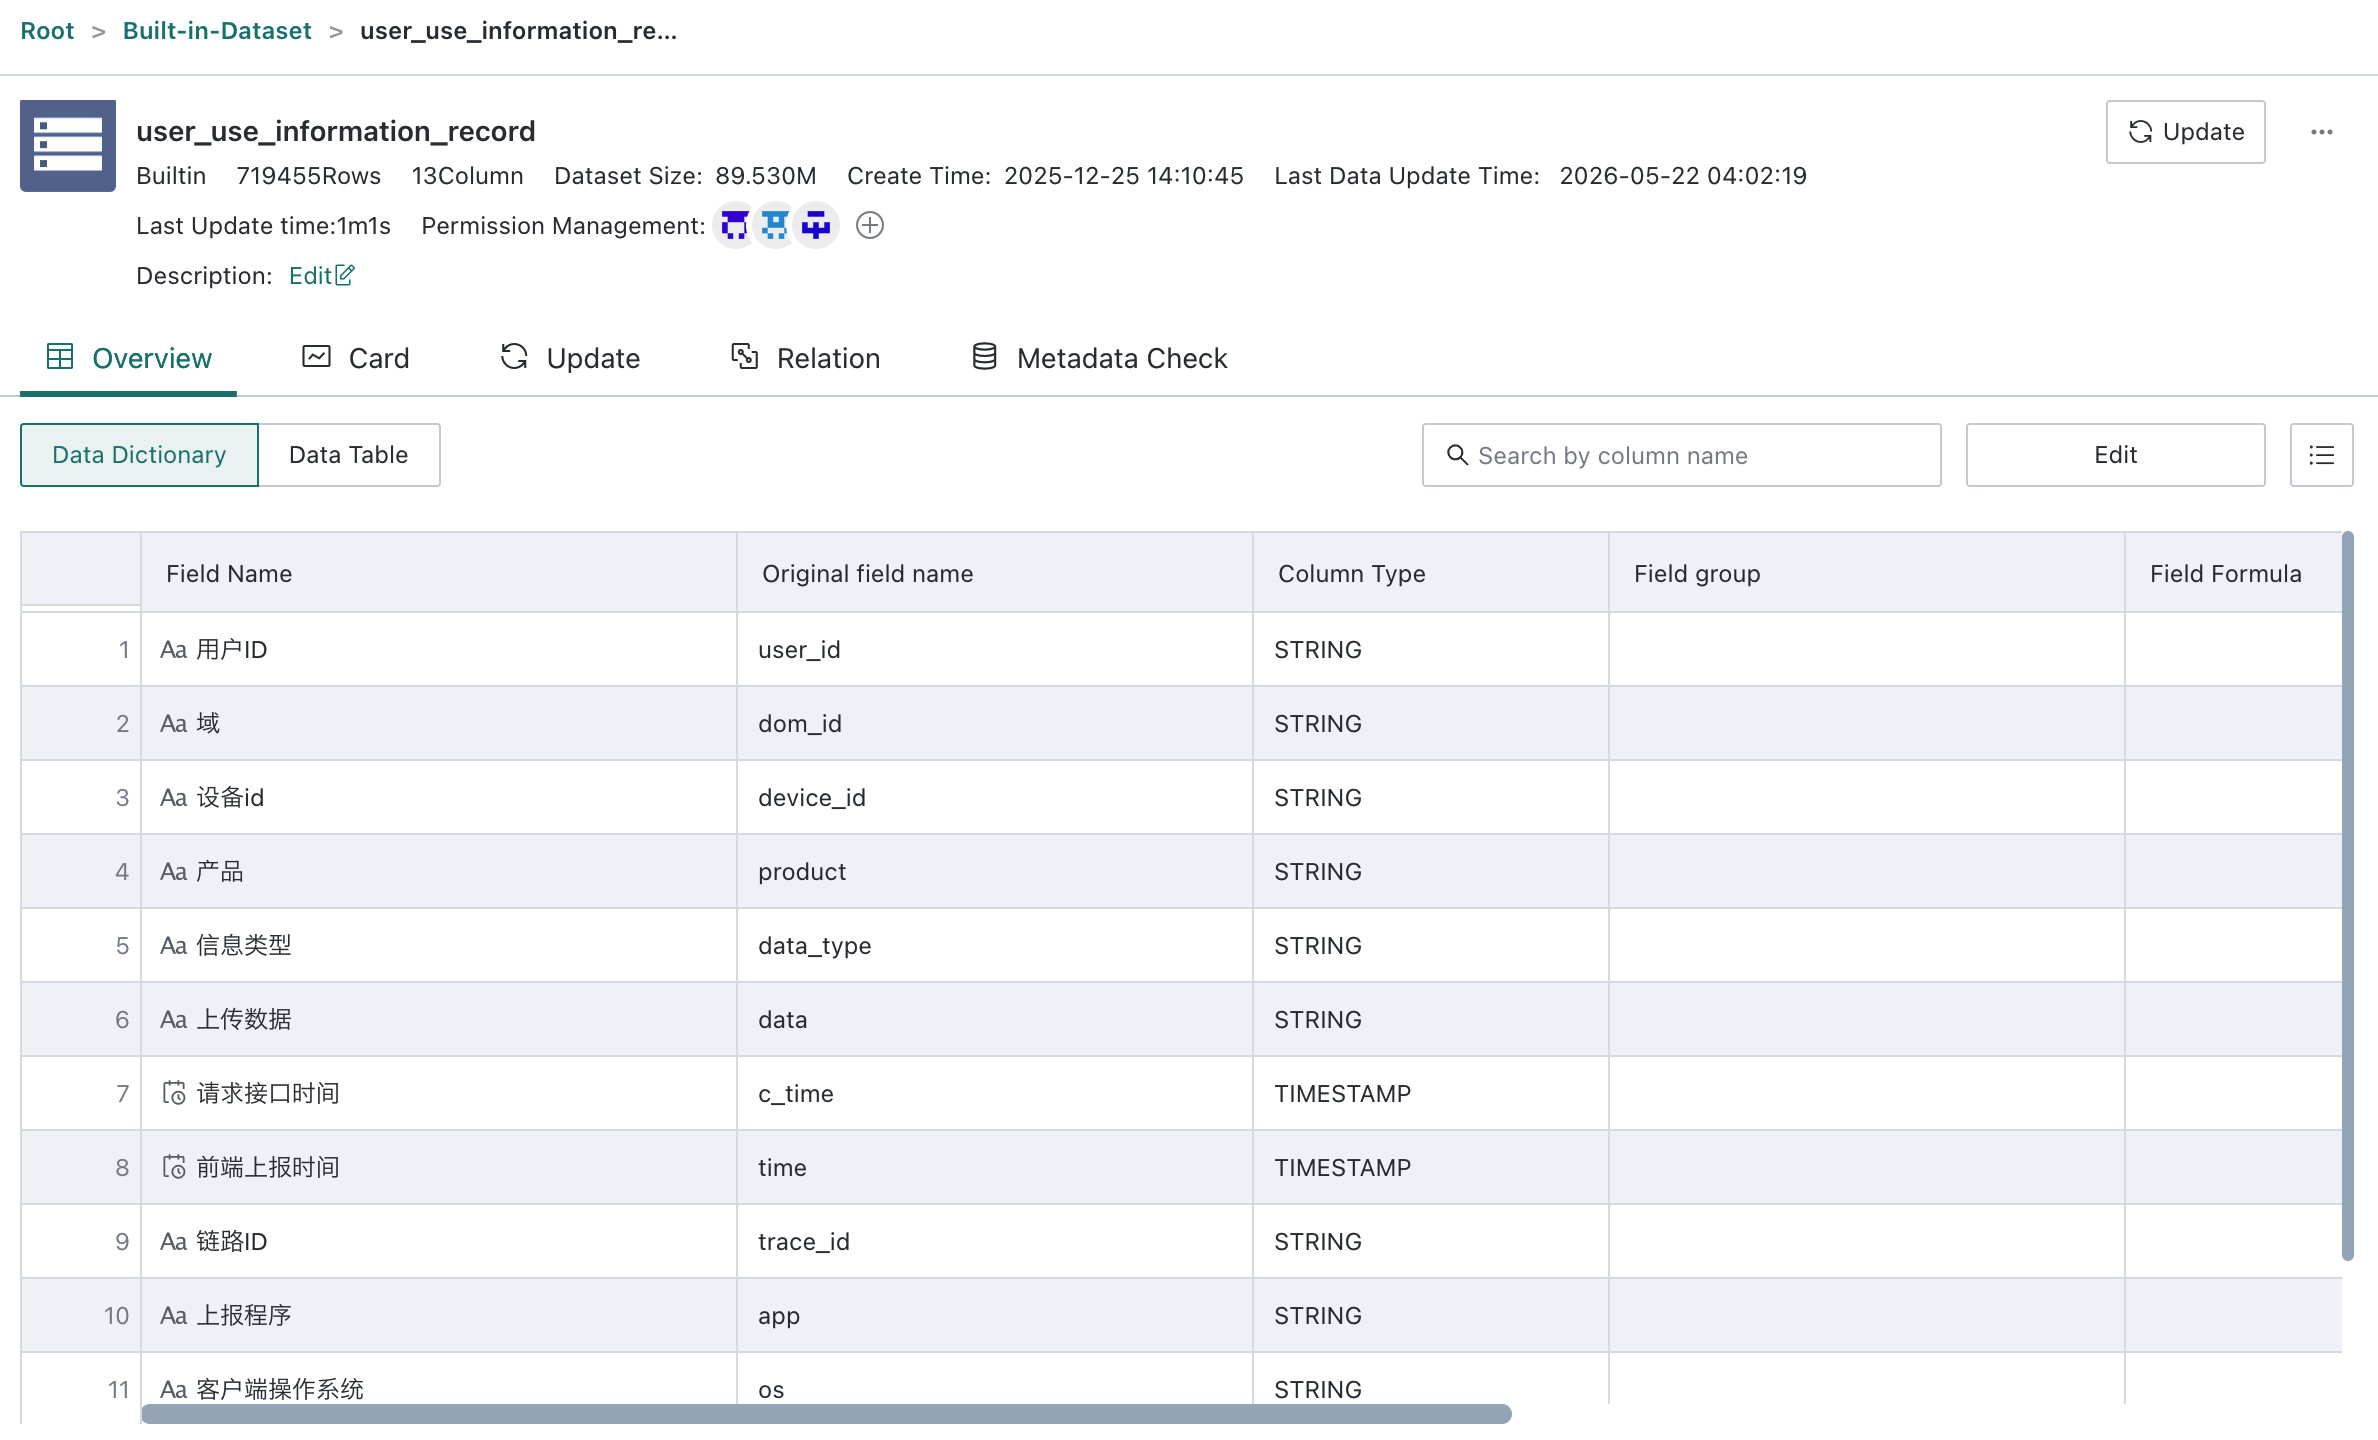
Field Descriptions for user_use_information_record
Using Dashboard Insights events as an example:
| No. | Field Name | Description | Sample / Enum Values |
|---|---|---|---|
| 1 | User ID | Unique identifier of the operating user | - |
| 2 | Domain | Environment domain to which the data belongs | demo |
| 3 | Device ID | Unique identifier of the device | - |
| 4 | Product | Product name that generated the data | guandata-web |
| 5 | Data Type | Type identifier of the payload; here it is tracking data | BURIED_POINT_DATA |
| 6 | Uploaded Data | Contains operation type and key action details, including insight type, action, and LLM. See Uploaded Data Field Description | {"type":"custom", "data": {"type":"dashboardInsight","pgId":"sfc62866c6bd741fbb8928d9", "operation":"generate", "llm":"Deepseek-V3"}} |
| 7 | API Request Time | Time when the interface request was made | - |
| 8 | Front-End Report Time | Time when the front-end reported the data | - |
| 9 | Trace ID | Unique identifier used for tracing the request chain | - |
| 10 | Reporter Program | Program identifier or name of the reporting process | - |
| 11 | Client OS | Operating system used by the client | Mac OS X |
| 12 | Client Browser | Browser used by the client | Chrome |
| 13 | Client IP | IP address of the client | 192.168.xxx.xxx, 10.xxx.xxx.0 |
Uploaded Data Field Description
For Dashboard Insights-related operations, the value of Uploaded Data is a JSON string with the following structure:
| Field Name | Description | Possible Values |
|---|---|---|
| type | Operation type. All reporting records for Dashboard Insights and Card Insights use custom | custom |
| data.type | Dashboard insight or card insight | dashboardInsight / cardInsight |
| data.pgId | Dashboard page ID. Present for both Dashboard Insights and Card Insights | sfc62866c6bd741fbb8928d9 |
| data.cdId | Insight card ID. Present only when Card Insights is triggered | c5a2a5f879ad24f74b832293 |
| data.operation | User action that triggered the LLM call. See data.operation Field Description | generate / refresh-data / ... |
| data.llm | Name of the currently invoked LLM when multiple models are available in the environment | deepseek-v3 and so on |
data.operation Field Description
| Scenario | data.type | data.operation | |
|---|---|---|---|
| Dashboard Insights | Automatic generation when opening the sidebar | dashboardInsight | generate |
| Click the `Regenerate` button | refresh-data | ||
| Ask a follow-up question after an insight is generated | follow-up | ||
| Launch an insight from `Custom Insight Logic` | custom-analysis | ||
| Click `Preview` while editing Dashboard Insights configuration | preview-analysis | ||
| Card Insights | Card automatically generates insights when the page is opened | cardInsight | generate |
| Click the `Re-Insight` button on the card toolbar | refresh-data | ||
| Regeneration triggered by editing, including (1) `Preview` after modifying the insight scope or prompt (2) automatic regeneration after clicking confirm or cancel |
modify-content | ||
| Automatic re-insight when data in the selected insight scope changes, including (1) card data updates caused by filters or linked interactions (2) drill actions on cards (3) card deletion |
refresh-on-source-update | ||
View the ETL-Processed Readable Dataset
The raw dataset is relatively complex, so we provide a preset ETL job that automatically joins and processes the raw data into a more user-friendly and analysis-ready dataset.
ETL download link:Guandata Dashboard Insights Usage Processing ETL
Advantages of the processed dataset:
- Information is more intuitive: it automatically joins user name, email, page name, and card name.
- The scenario is clearer: it adds the
Insight Operation Scenariofield to describe actions in plain language, such asCard automatically generates insights when the page is opened. - The data is more focused: it keeps only records related to Guandata Dashboard Insights and filters out basic actions such as page switching.
Create the ETL
-
On the
Data Preparation > Smart ETLpage, clickCreate ETL.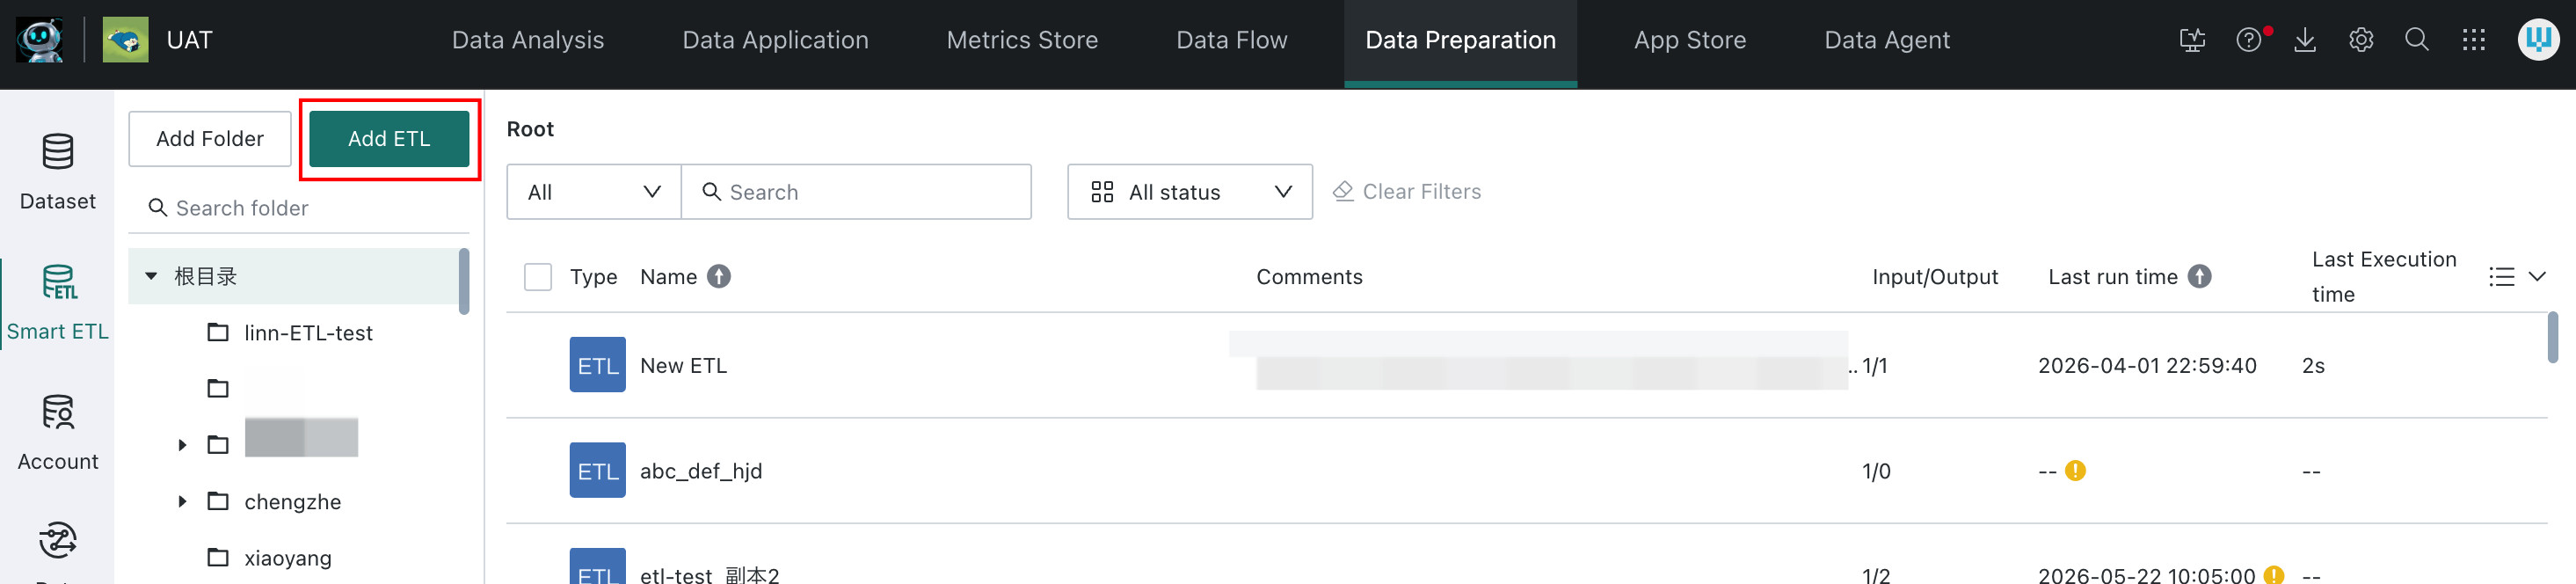
-
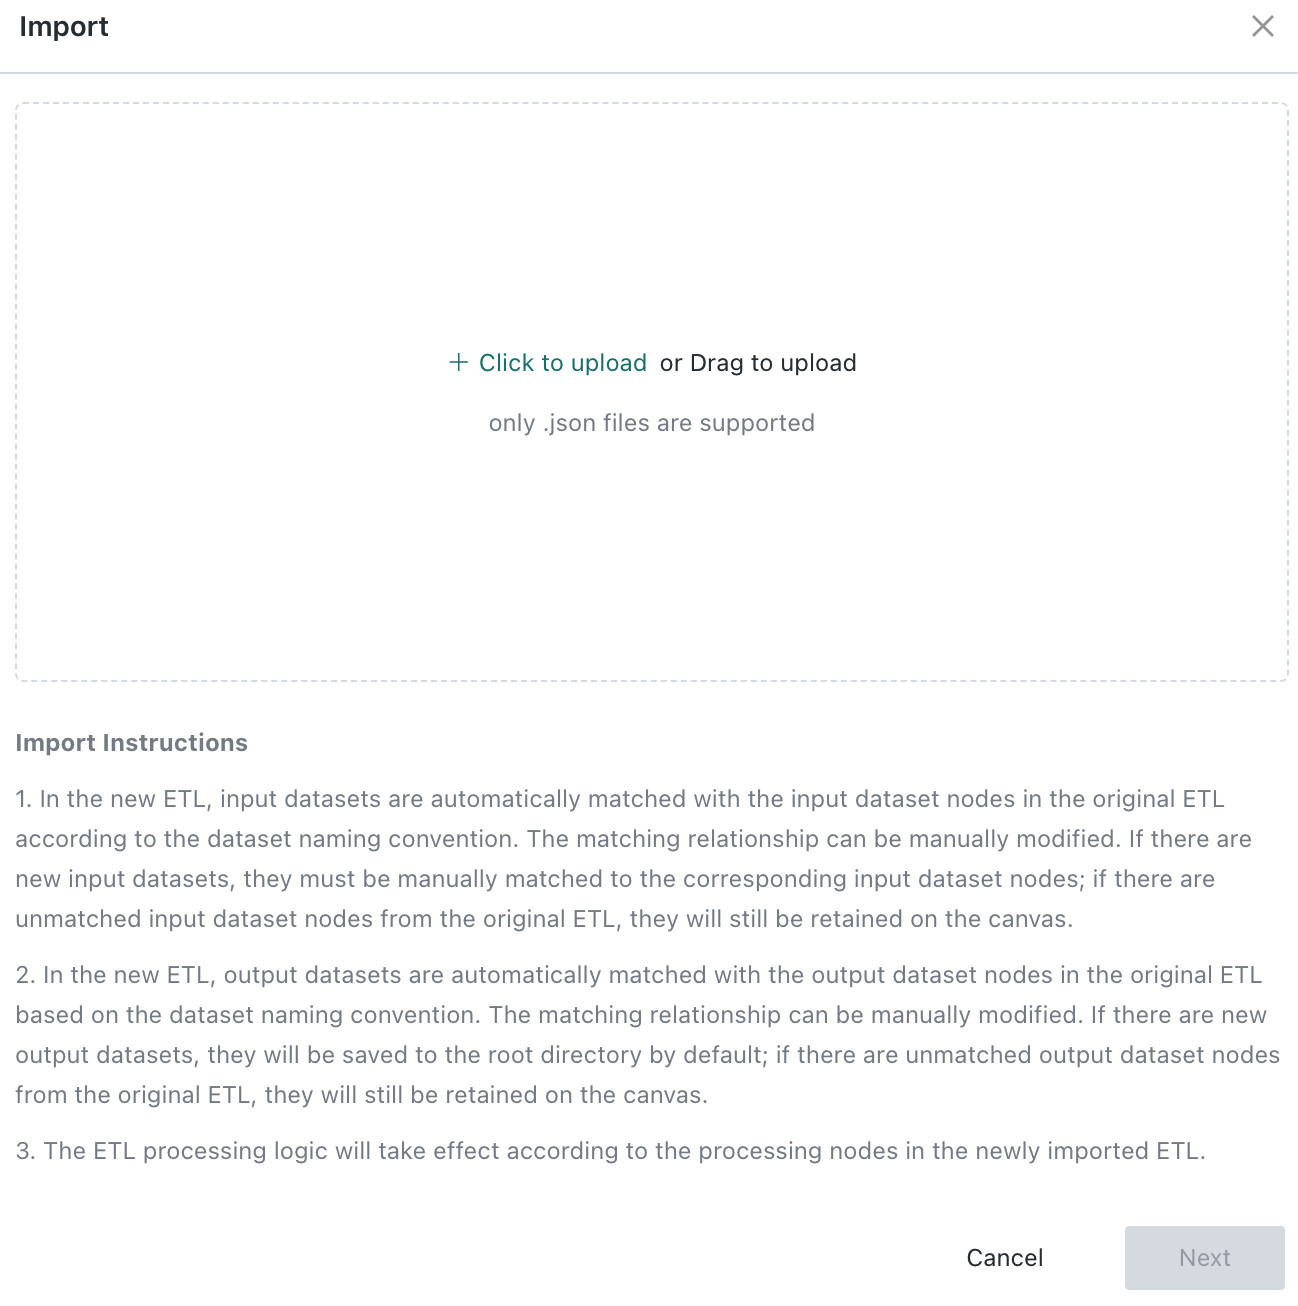
Click
Importin the upper-right corner, upload Guandata Dashboard Insights Usage Processing ETL, clickNext, and then clickConfirmon the next page without making any further changes.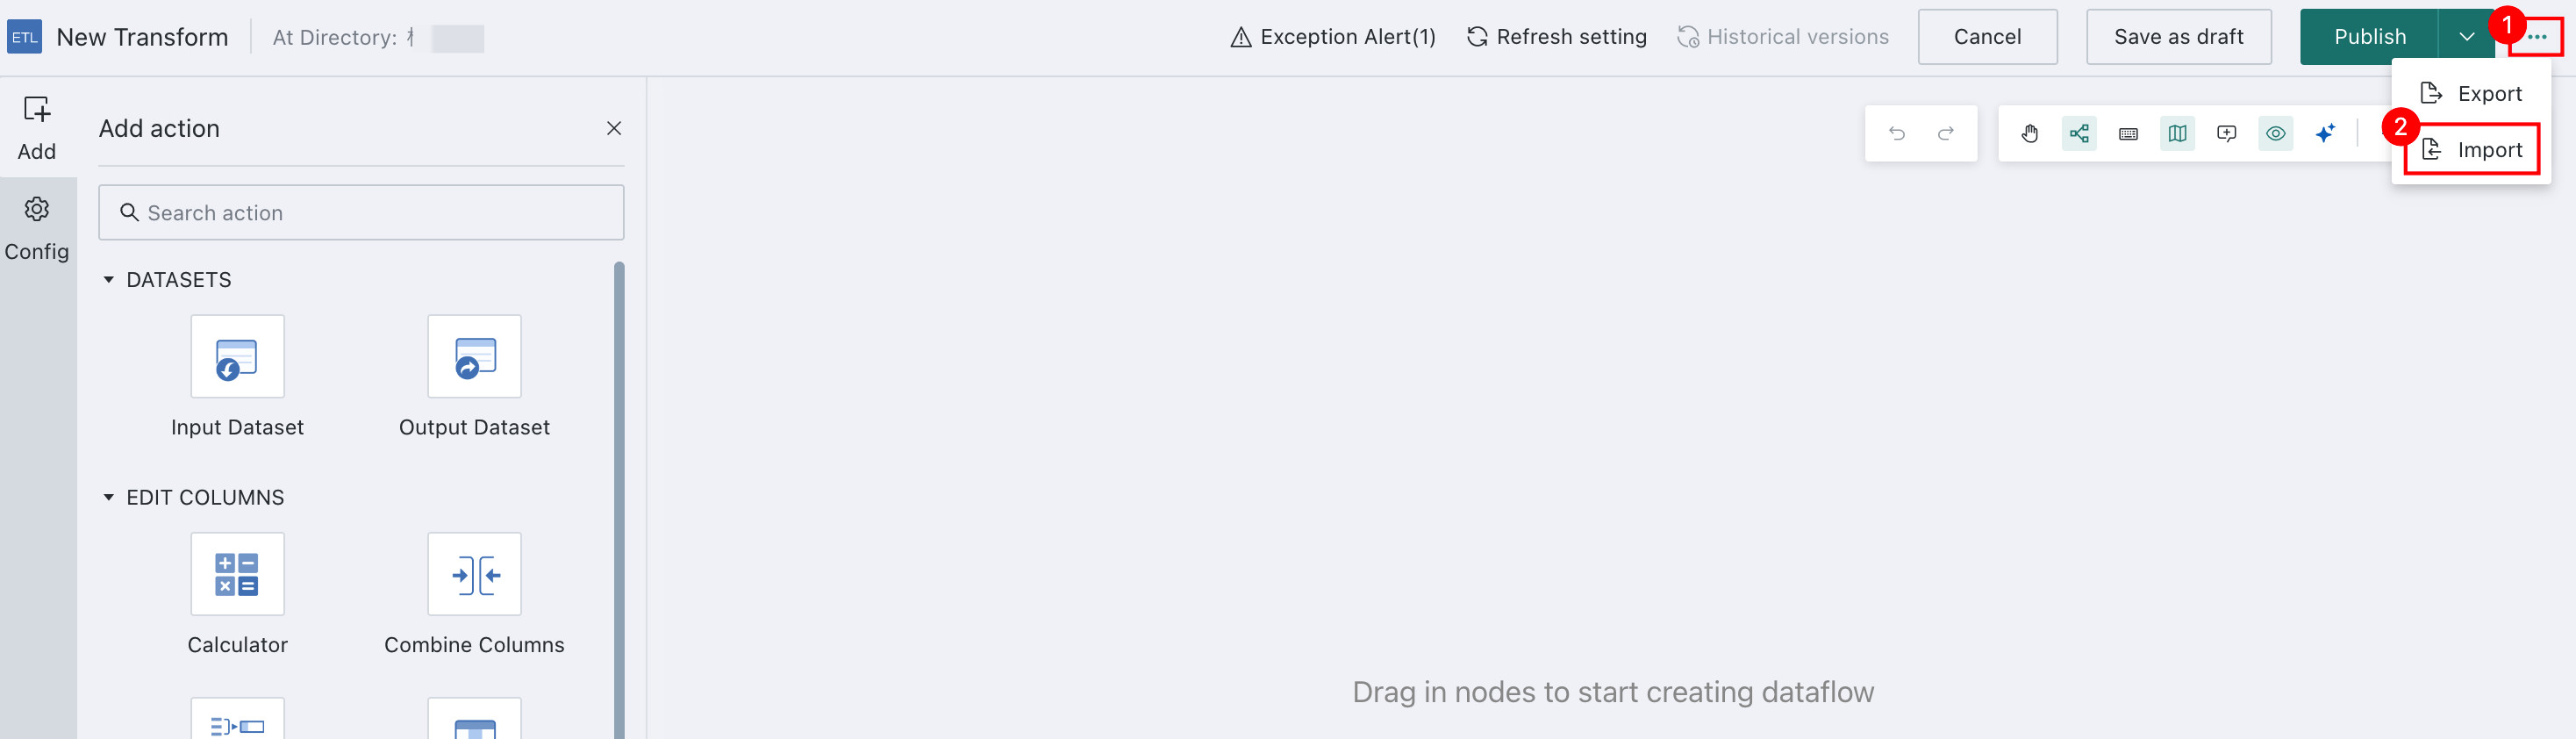
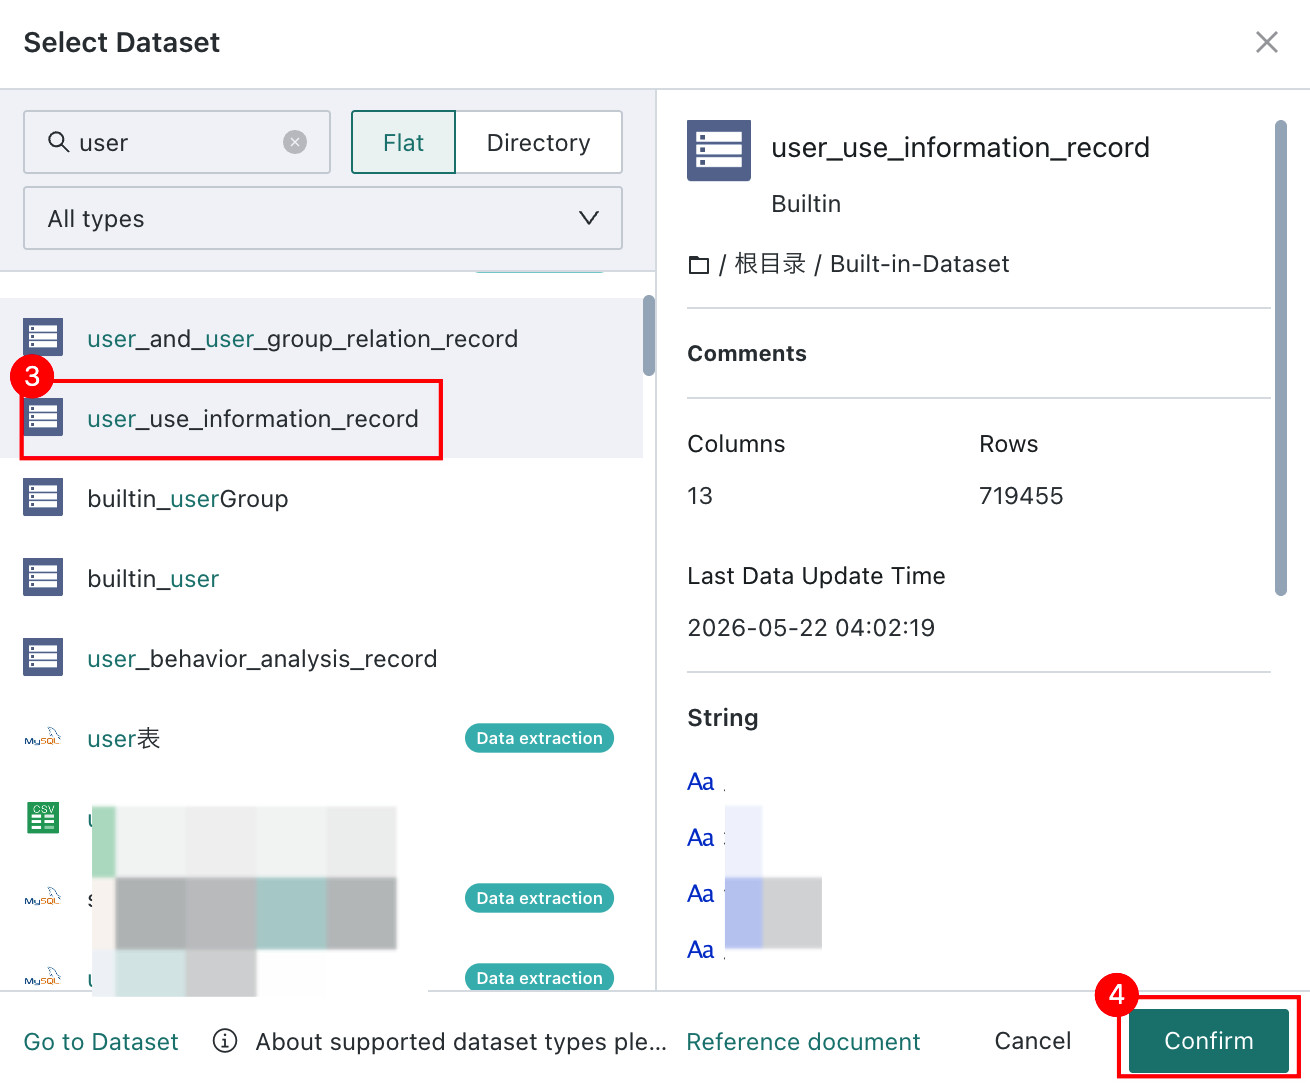
Replace the Input Datasets
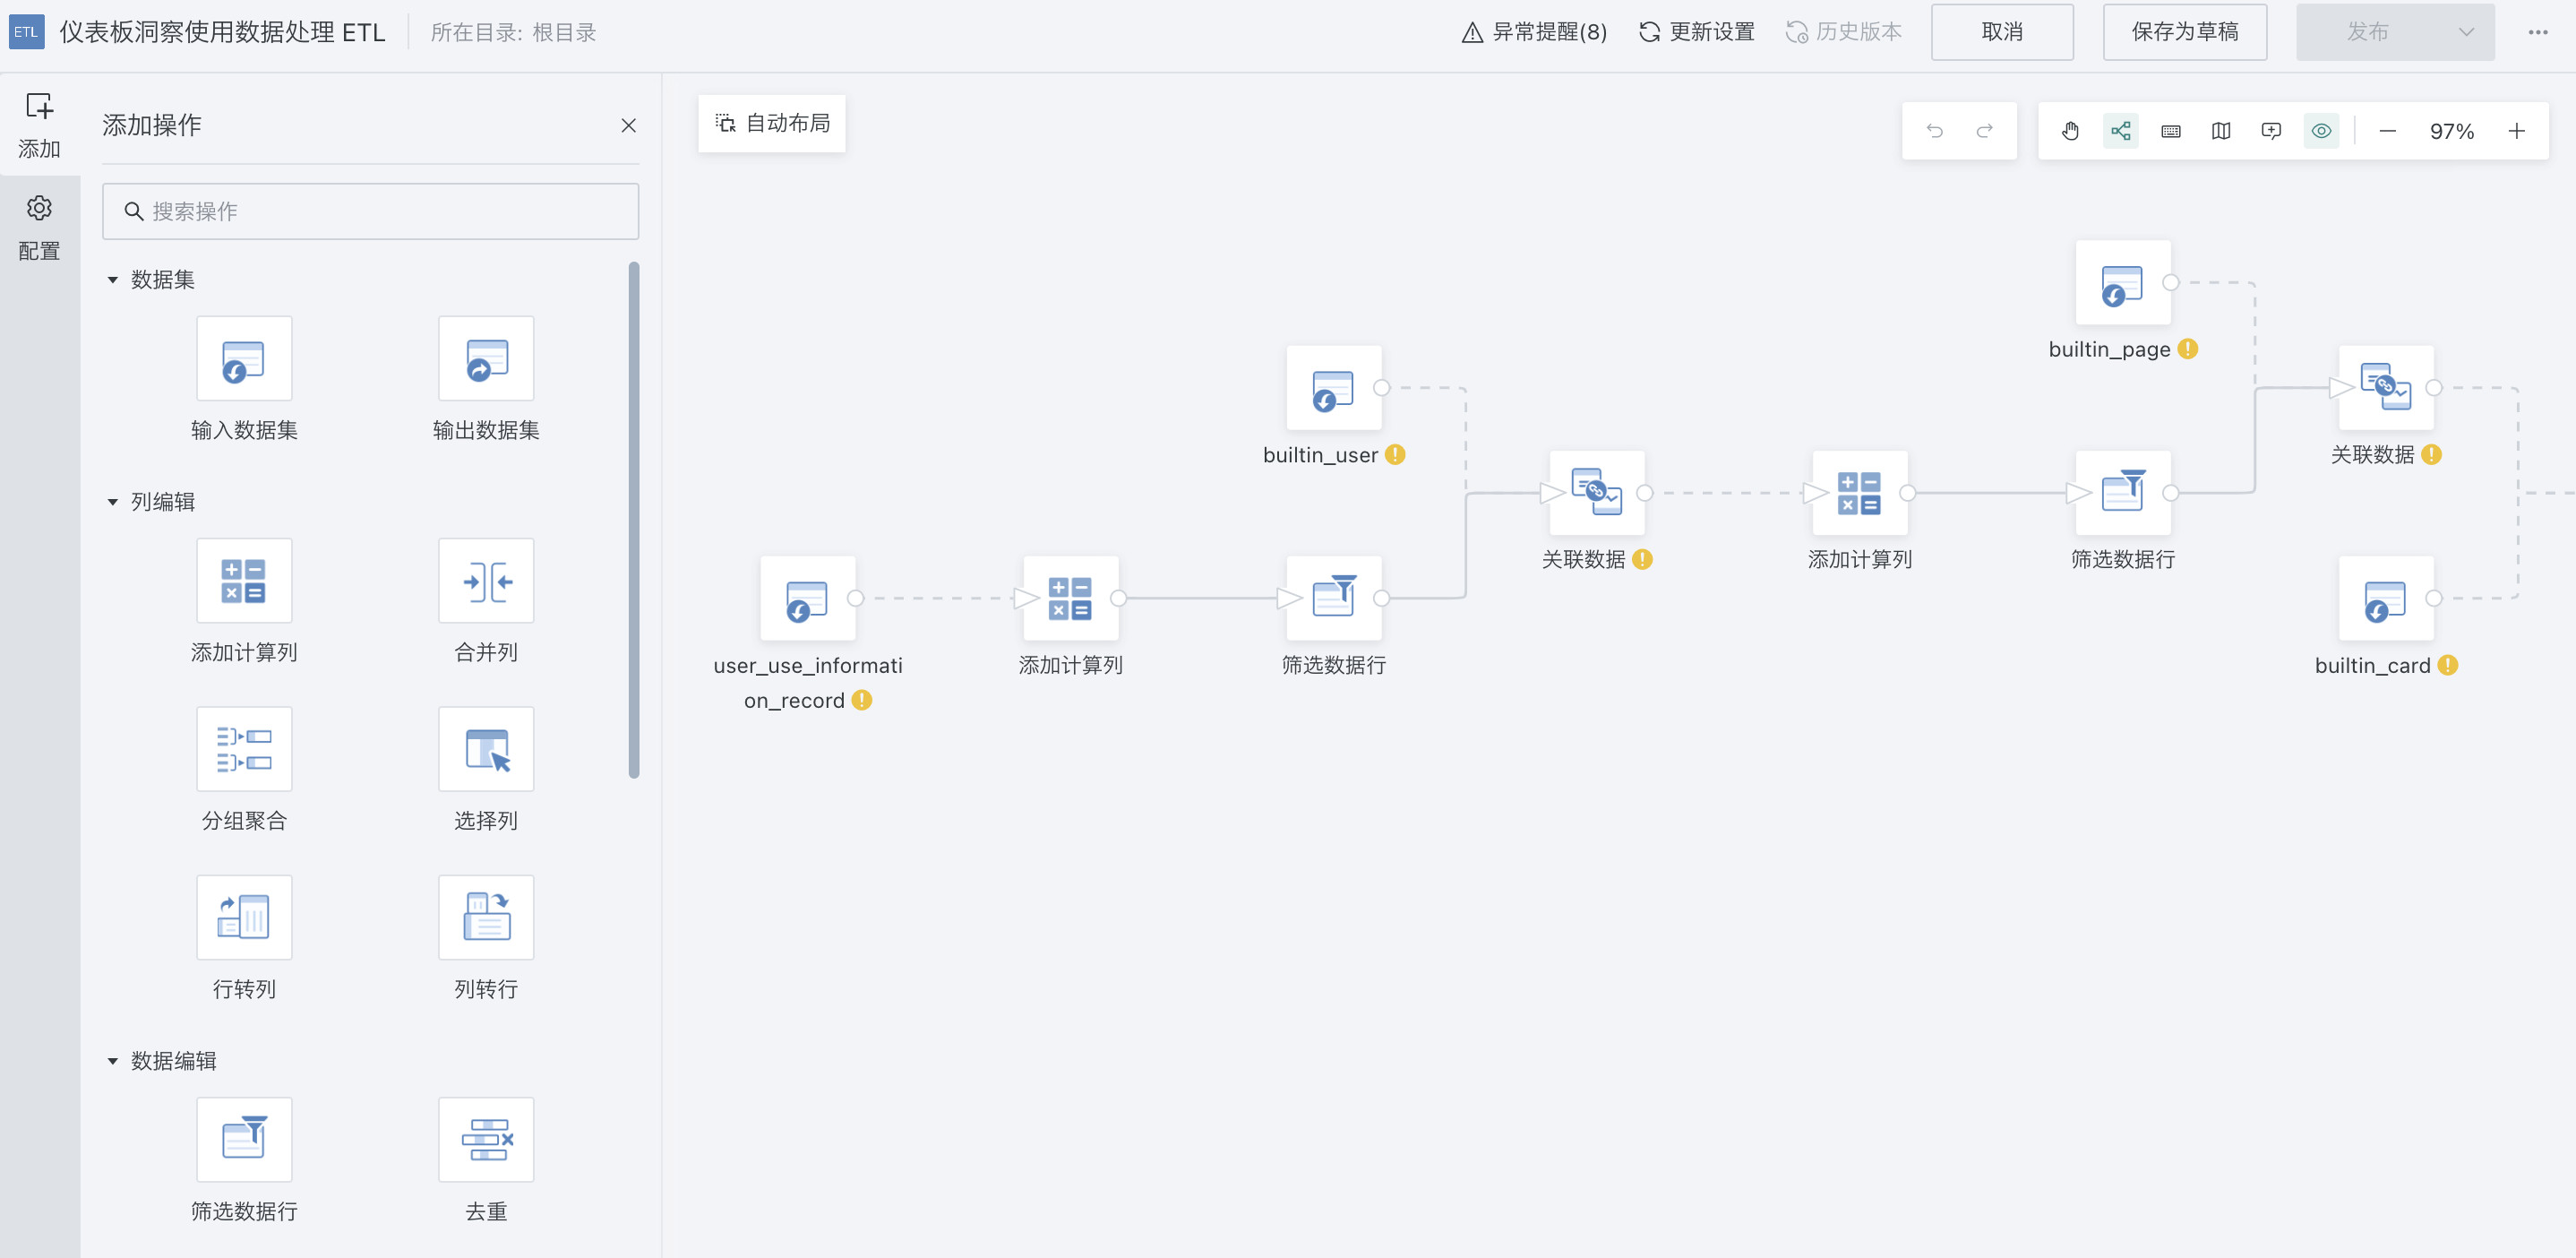
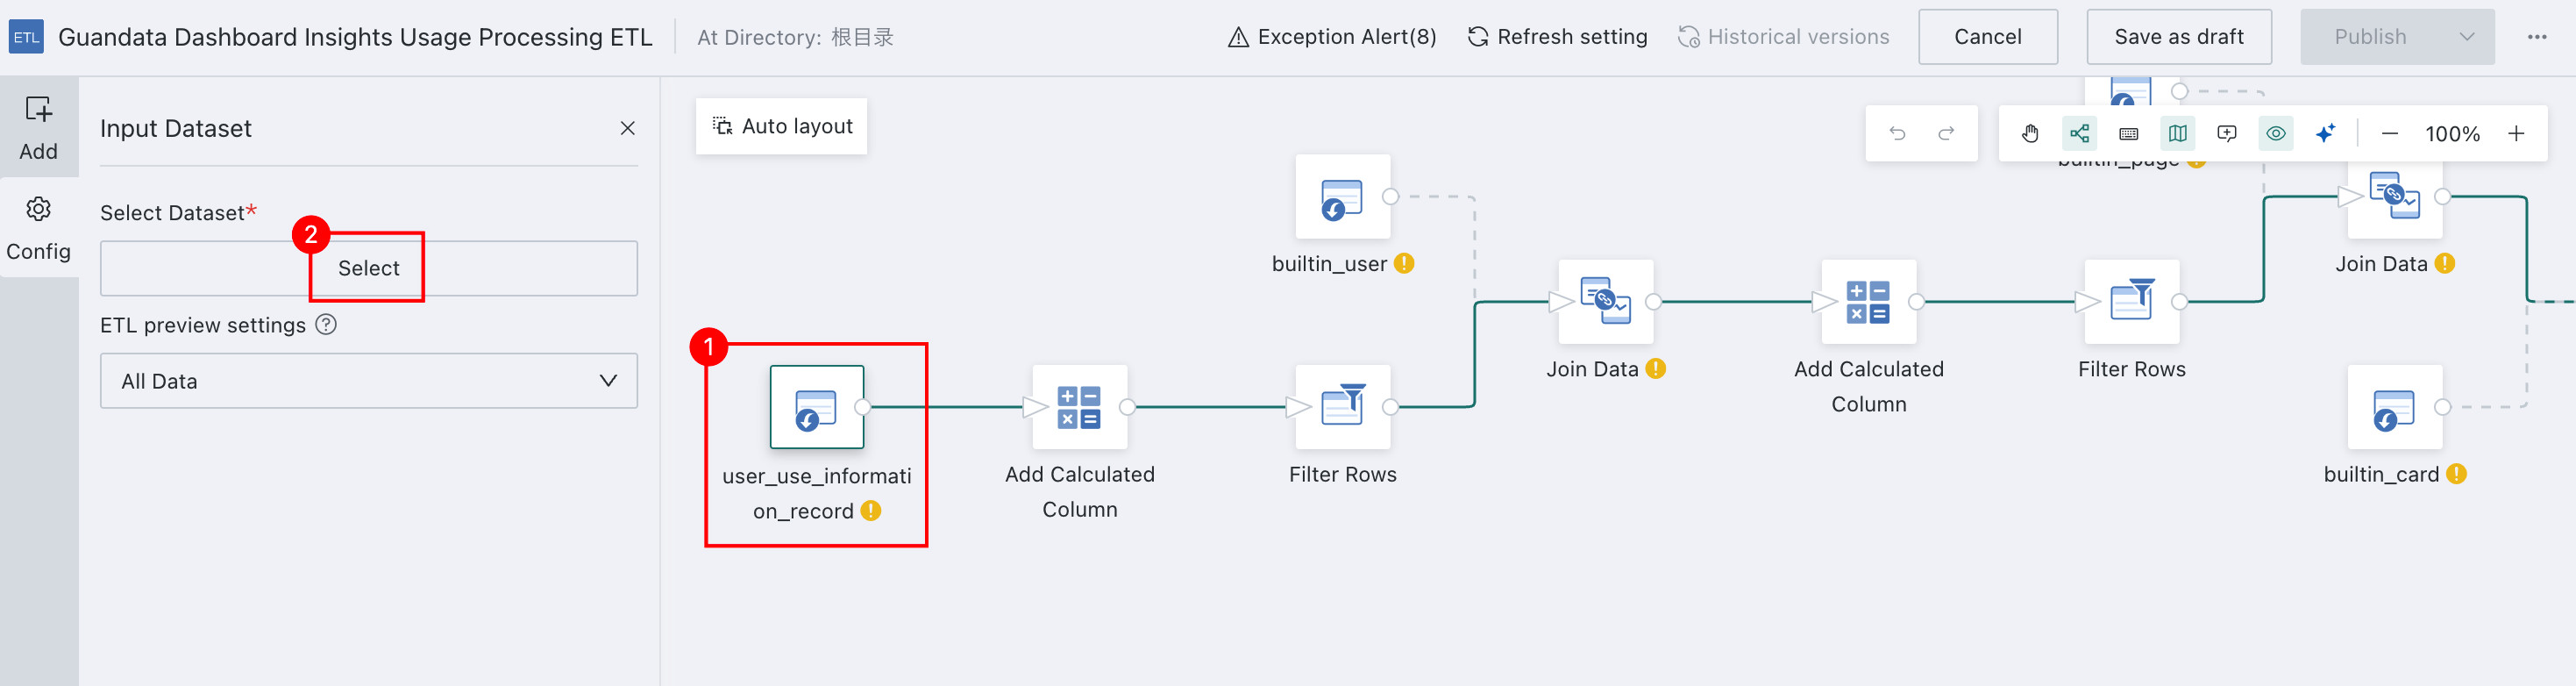
After the ETL is imported, you will notice that many datasets show an exclamation mark below them, indicating that the input datasets need to be replaced.
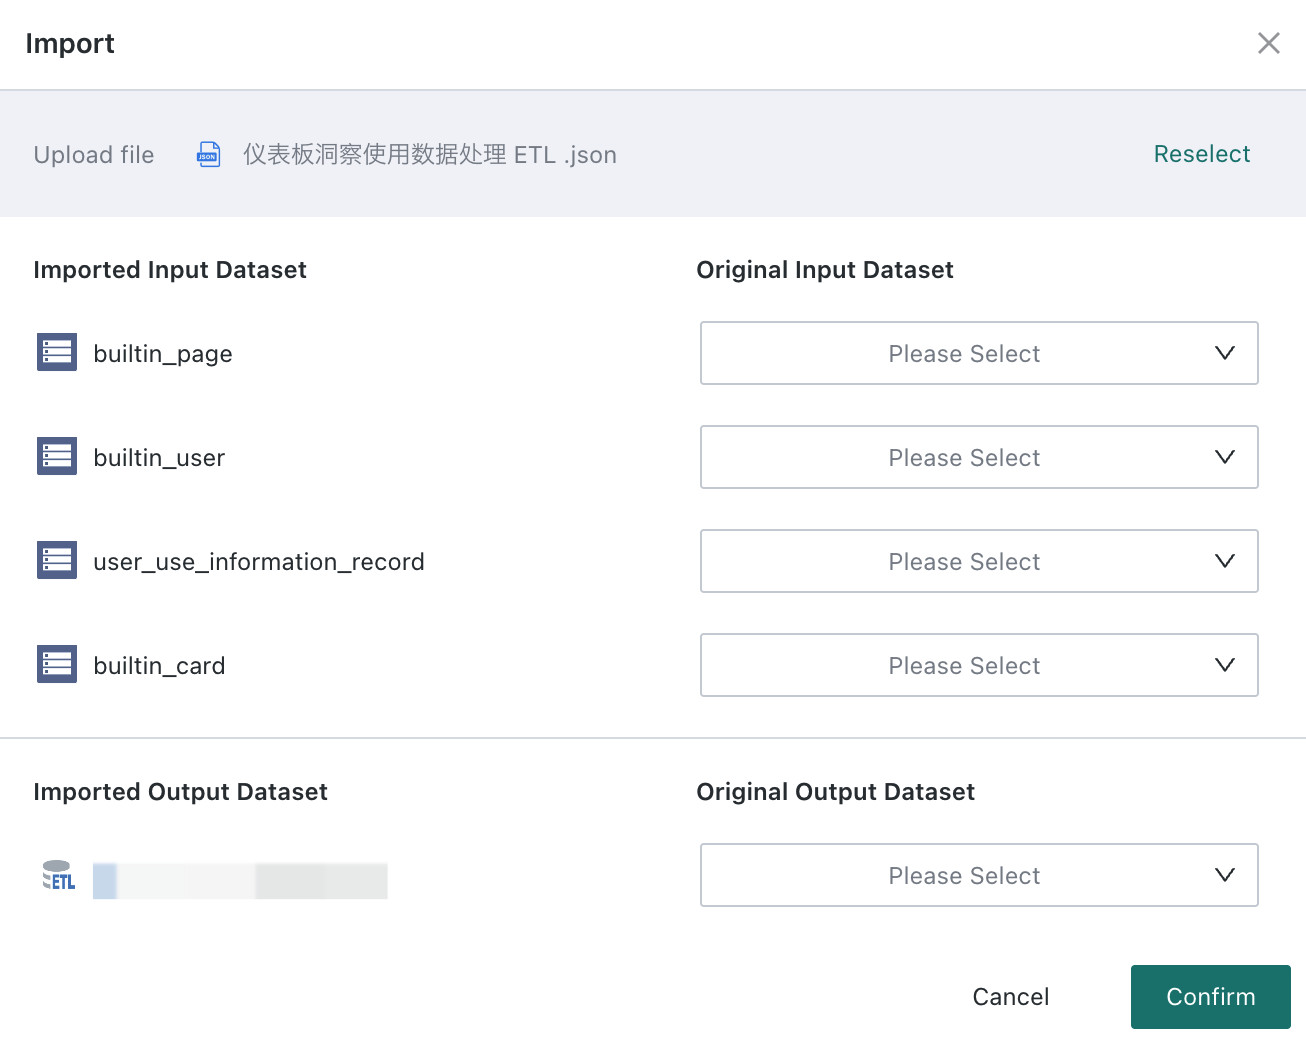
Using user_use_information_record as an example, select user_use_information_record, click Please Select under Select Dataset on the left, search for the user_use_information_record dataset, select it, and then click Confirm.
Use the same procedure to replace the remaining datasets.
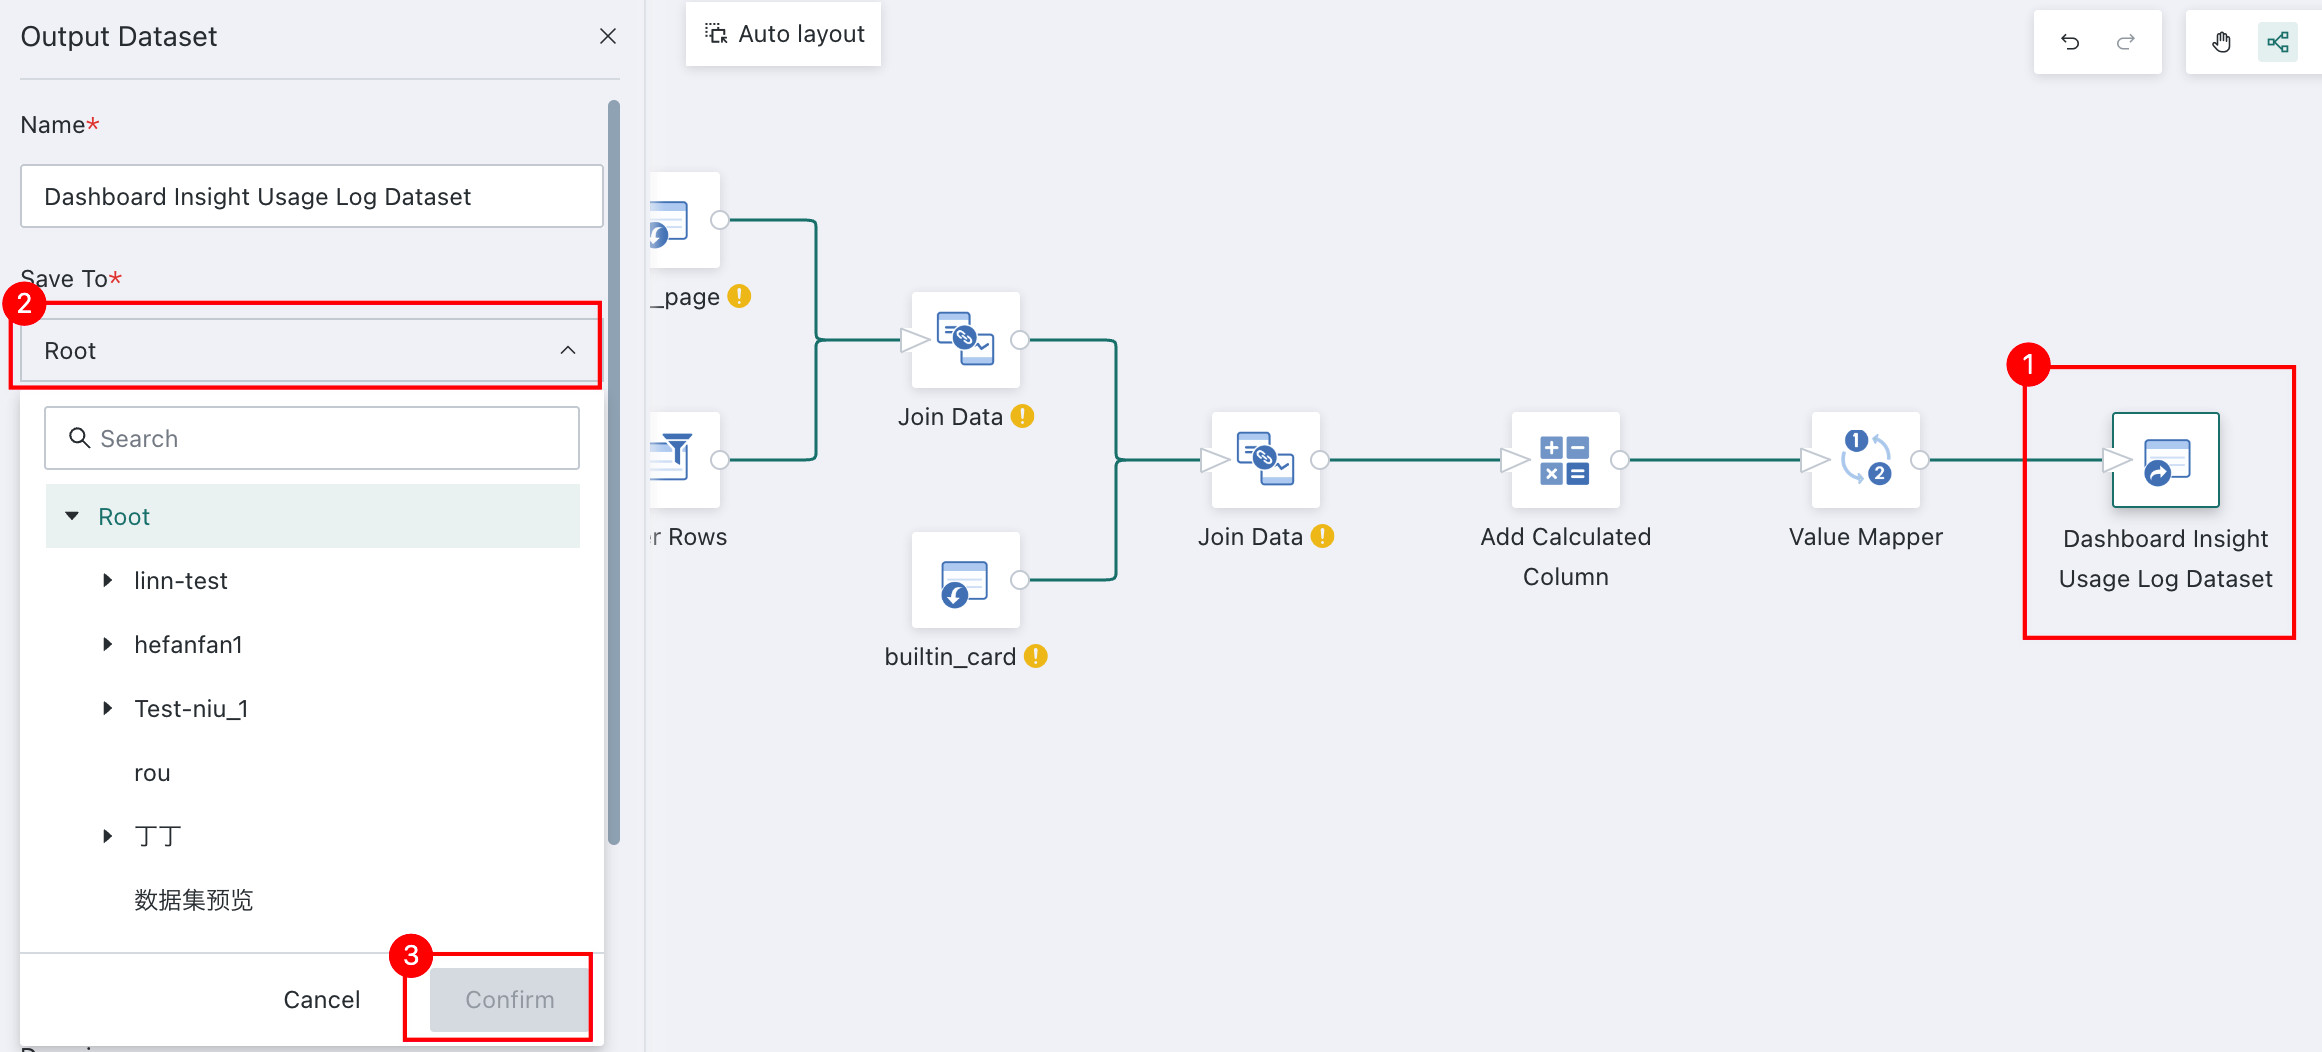
Set the Output Dataset Save Path
Select Guandata Dashboard Insights Usage Record Dataset, click Please Select under Save To on the left, choose the save path, and then click Confirm.
Preview and Review the Processed Data
Select Guandata Dashboard Insights Usage Record Dataset. When the Preview icon appears at the bottom, click it to view the processed data.
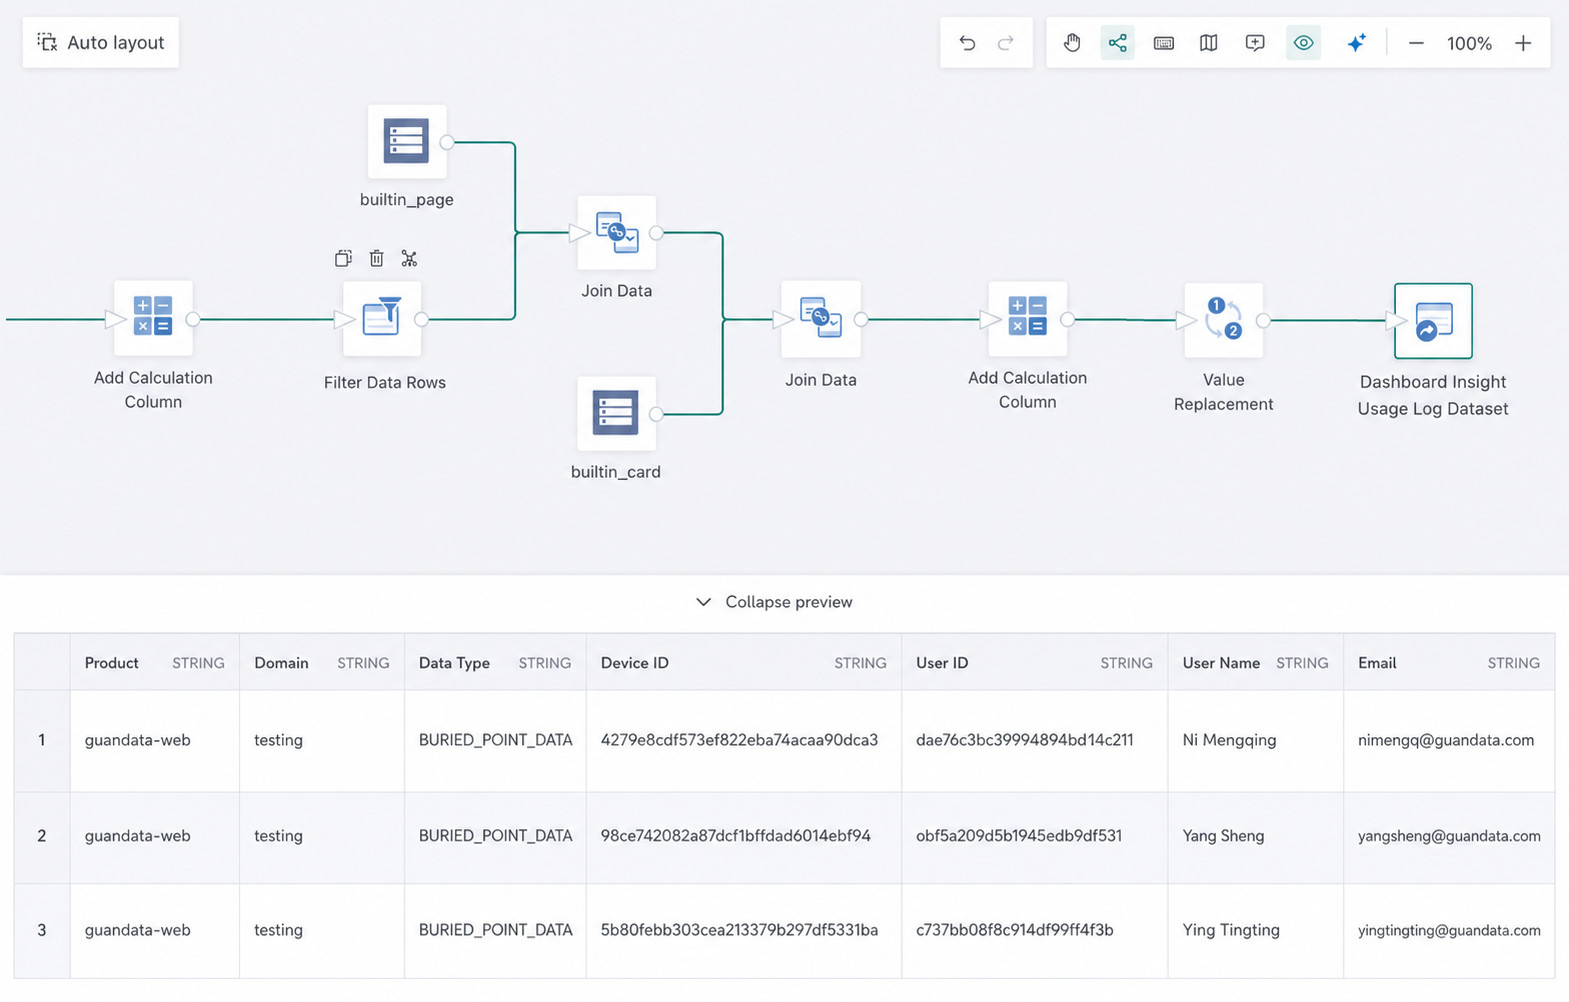
After ETL processing, the generated dataset contains only usage records reported for Guandata Dashboard Insights and provides more explicit descriptions for several enum values.
The following new fields are added:
| Field Name | Description | Example Value |
|---|---|---|
| User Name | Joined from the user ID and built-in dataset | Zhang San |
| User email address | zhangsan@guandata.com | |
| Uploaded Data Type | The type value inside Uploaded Data | custom |
| Uploaded Operation Type | The data.type value inside Uploaded Data | Card Insight / Dashboard Insight |
| Page Name | Joined from the page ID and built-in dataset. It may be null if the draft page has not been published or the page has been deleted | Store Manager Dashboard |
| Card Name | Joined from the card ID and built-in dataset. It may be null if the draft page has not been published or the card has been deleted. This field exists only for Card Insights and is null for Dashboard Insights | Insight Card |
| Insight Operation Type | The data.operation value inside Uploaded Data | refresh-data |
| Insight Operation Scenario | Detailed description of data.operation | Card automatically generates insights when the page is opened |