Insight Agent
Overview
Insight Agent is designed for scenarios where users need to investigate a business question in depth. When such a request is submitted, the system automatically performs planning, invokes the necessary tools, and generates an illustrated analysis report. The report not only shows the current business situation, but also uncovers underlying causes and trends to provide comprehensive and valuable insights, for example when answering questions such as "How has recent sales performance been?".
Prerequisites
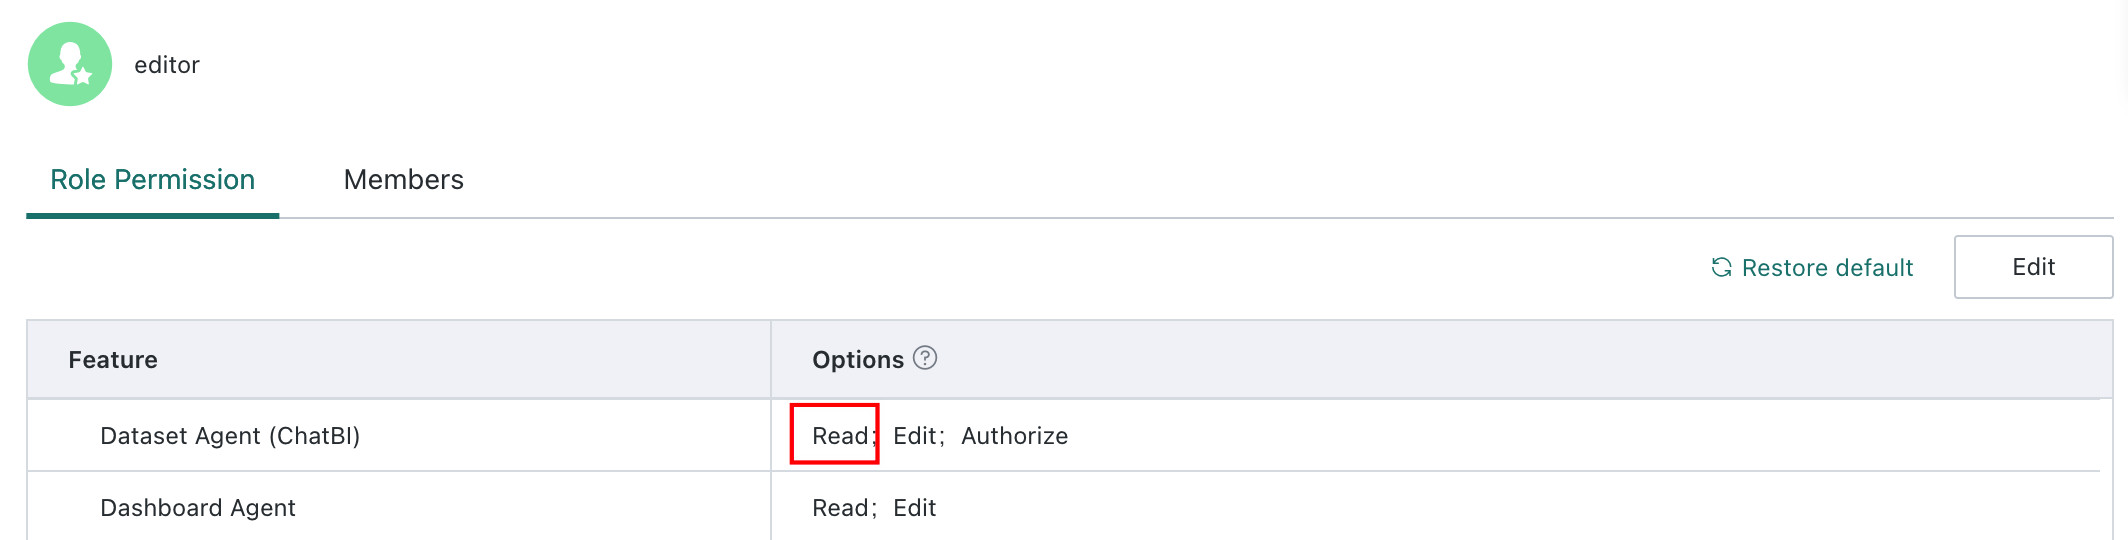
Only users with ChatBI View permission can access the Insight Agent page and ask questions.
Steps
-
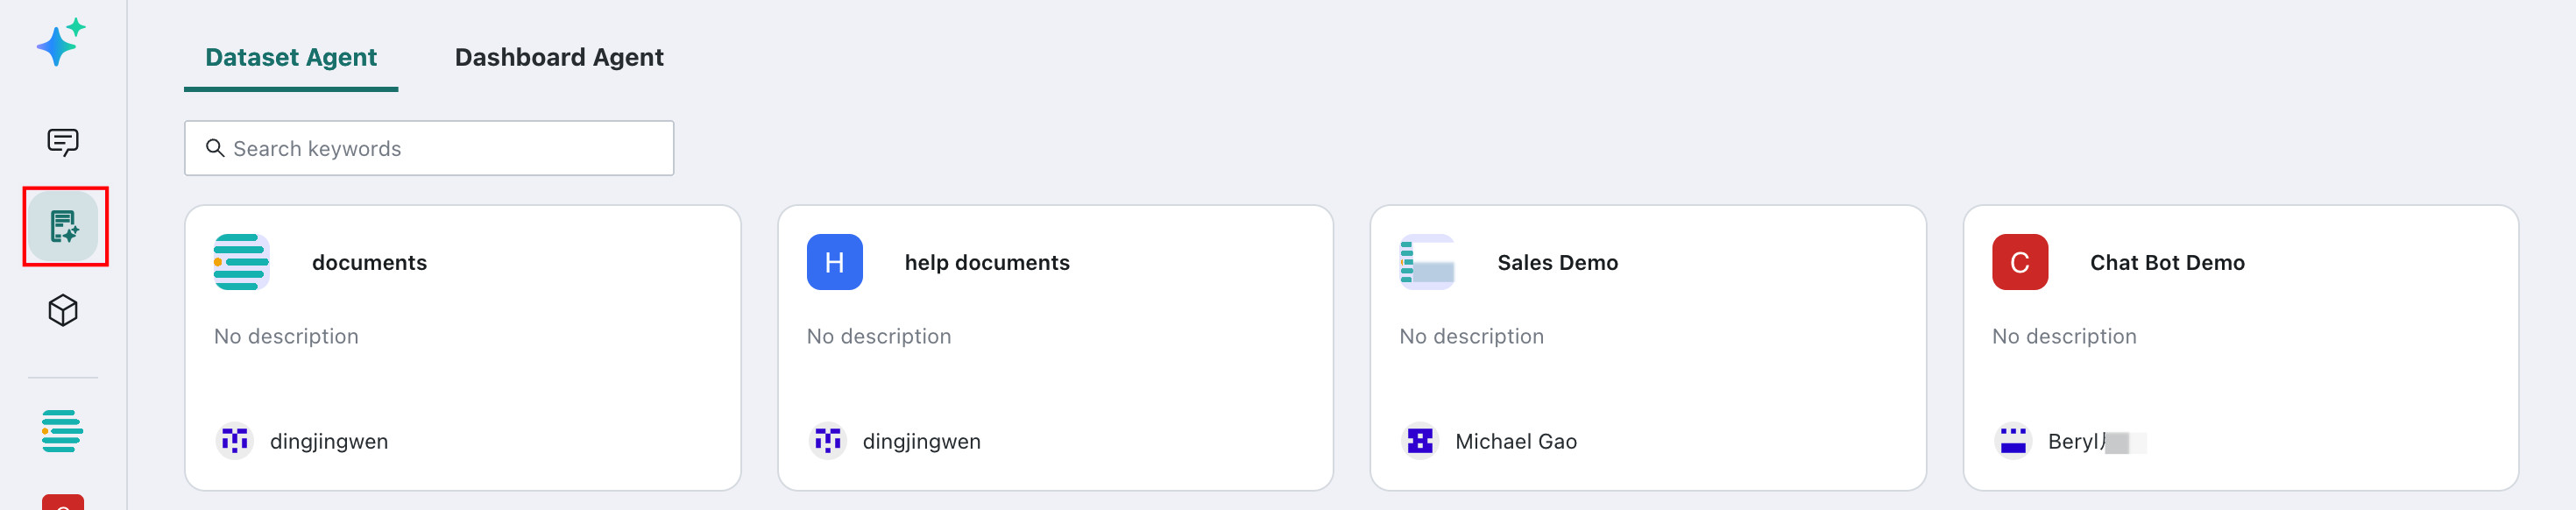
Click
Insight Agentin the left navigation bar to enter the insight analysis page. -
Select the agent to use for insight analysis. You can also search for the required agent with the search box.
-
Click a recommended question or enter your own question. The system automatically completes task planning, combines different tool calls, and finally generates a mixed text-and-chart analysis report.
The currently available tools are listed below:
| Tool | Description | Screenshot |
|---|---|---|
Knowledge Retrieval | Retrieves knowledge related to the user question from the knowledge base to build context and support structured responses. | 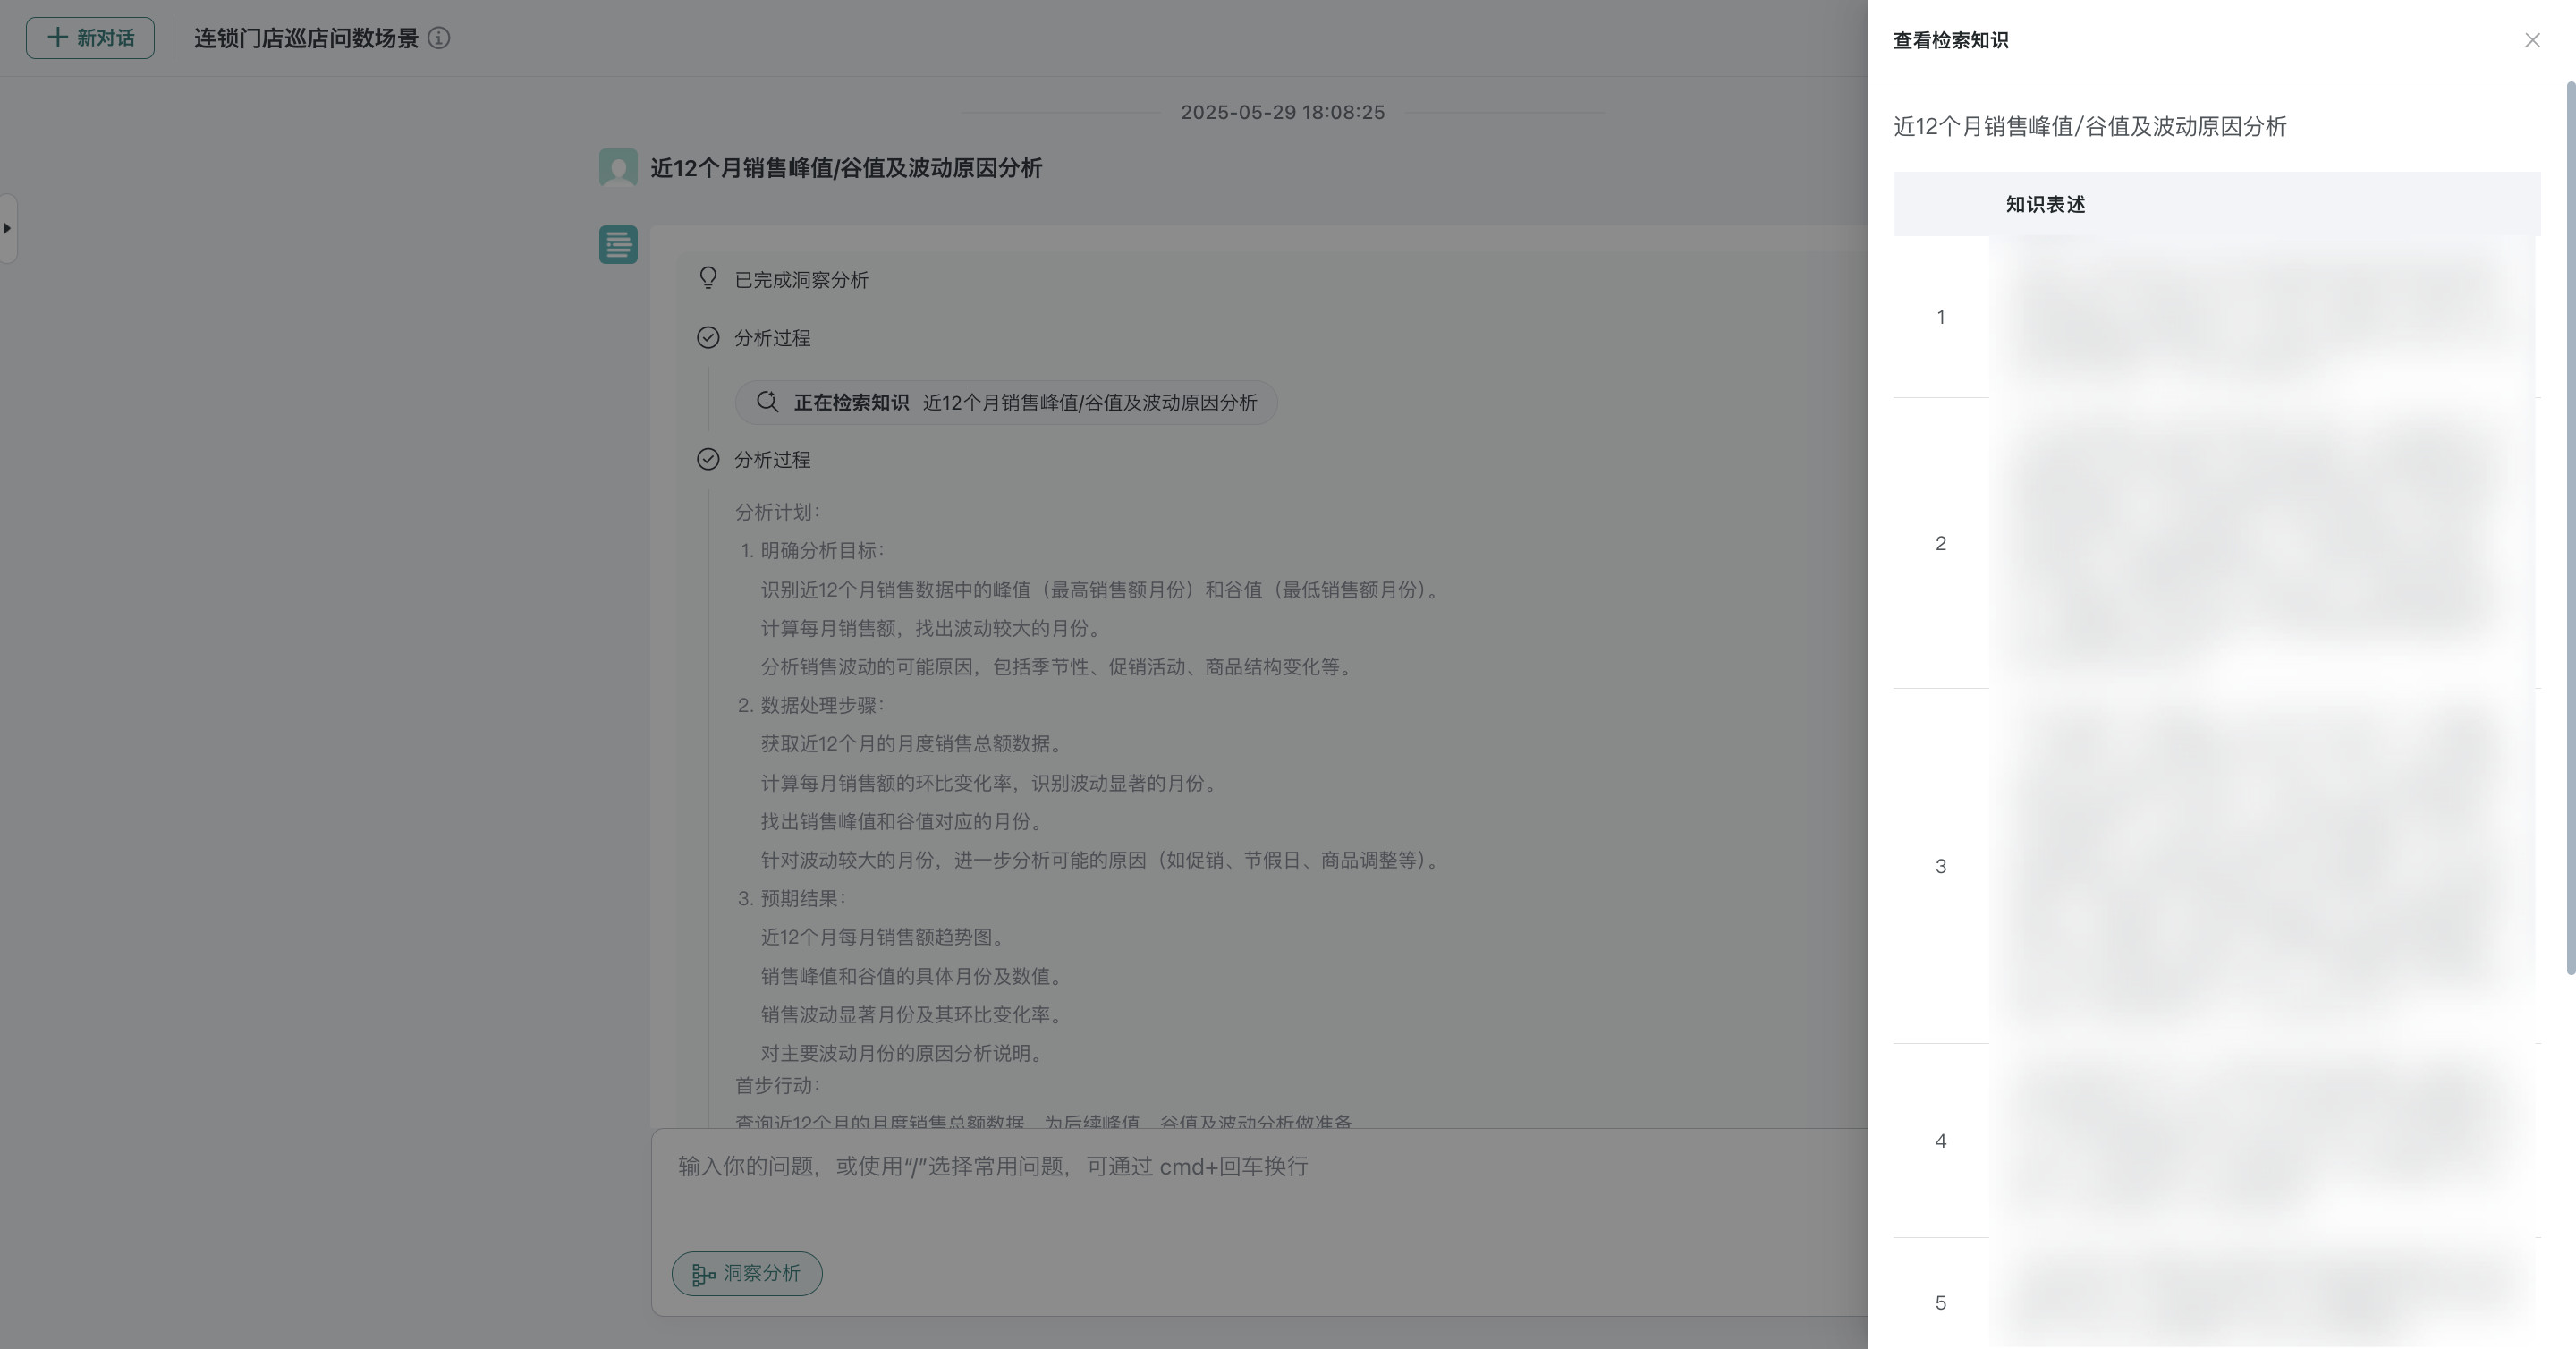 |
Data Query | Converts the user question into SQL, executes it through the compute engine, and returns structured data results. | 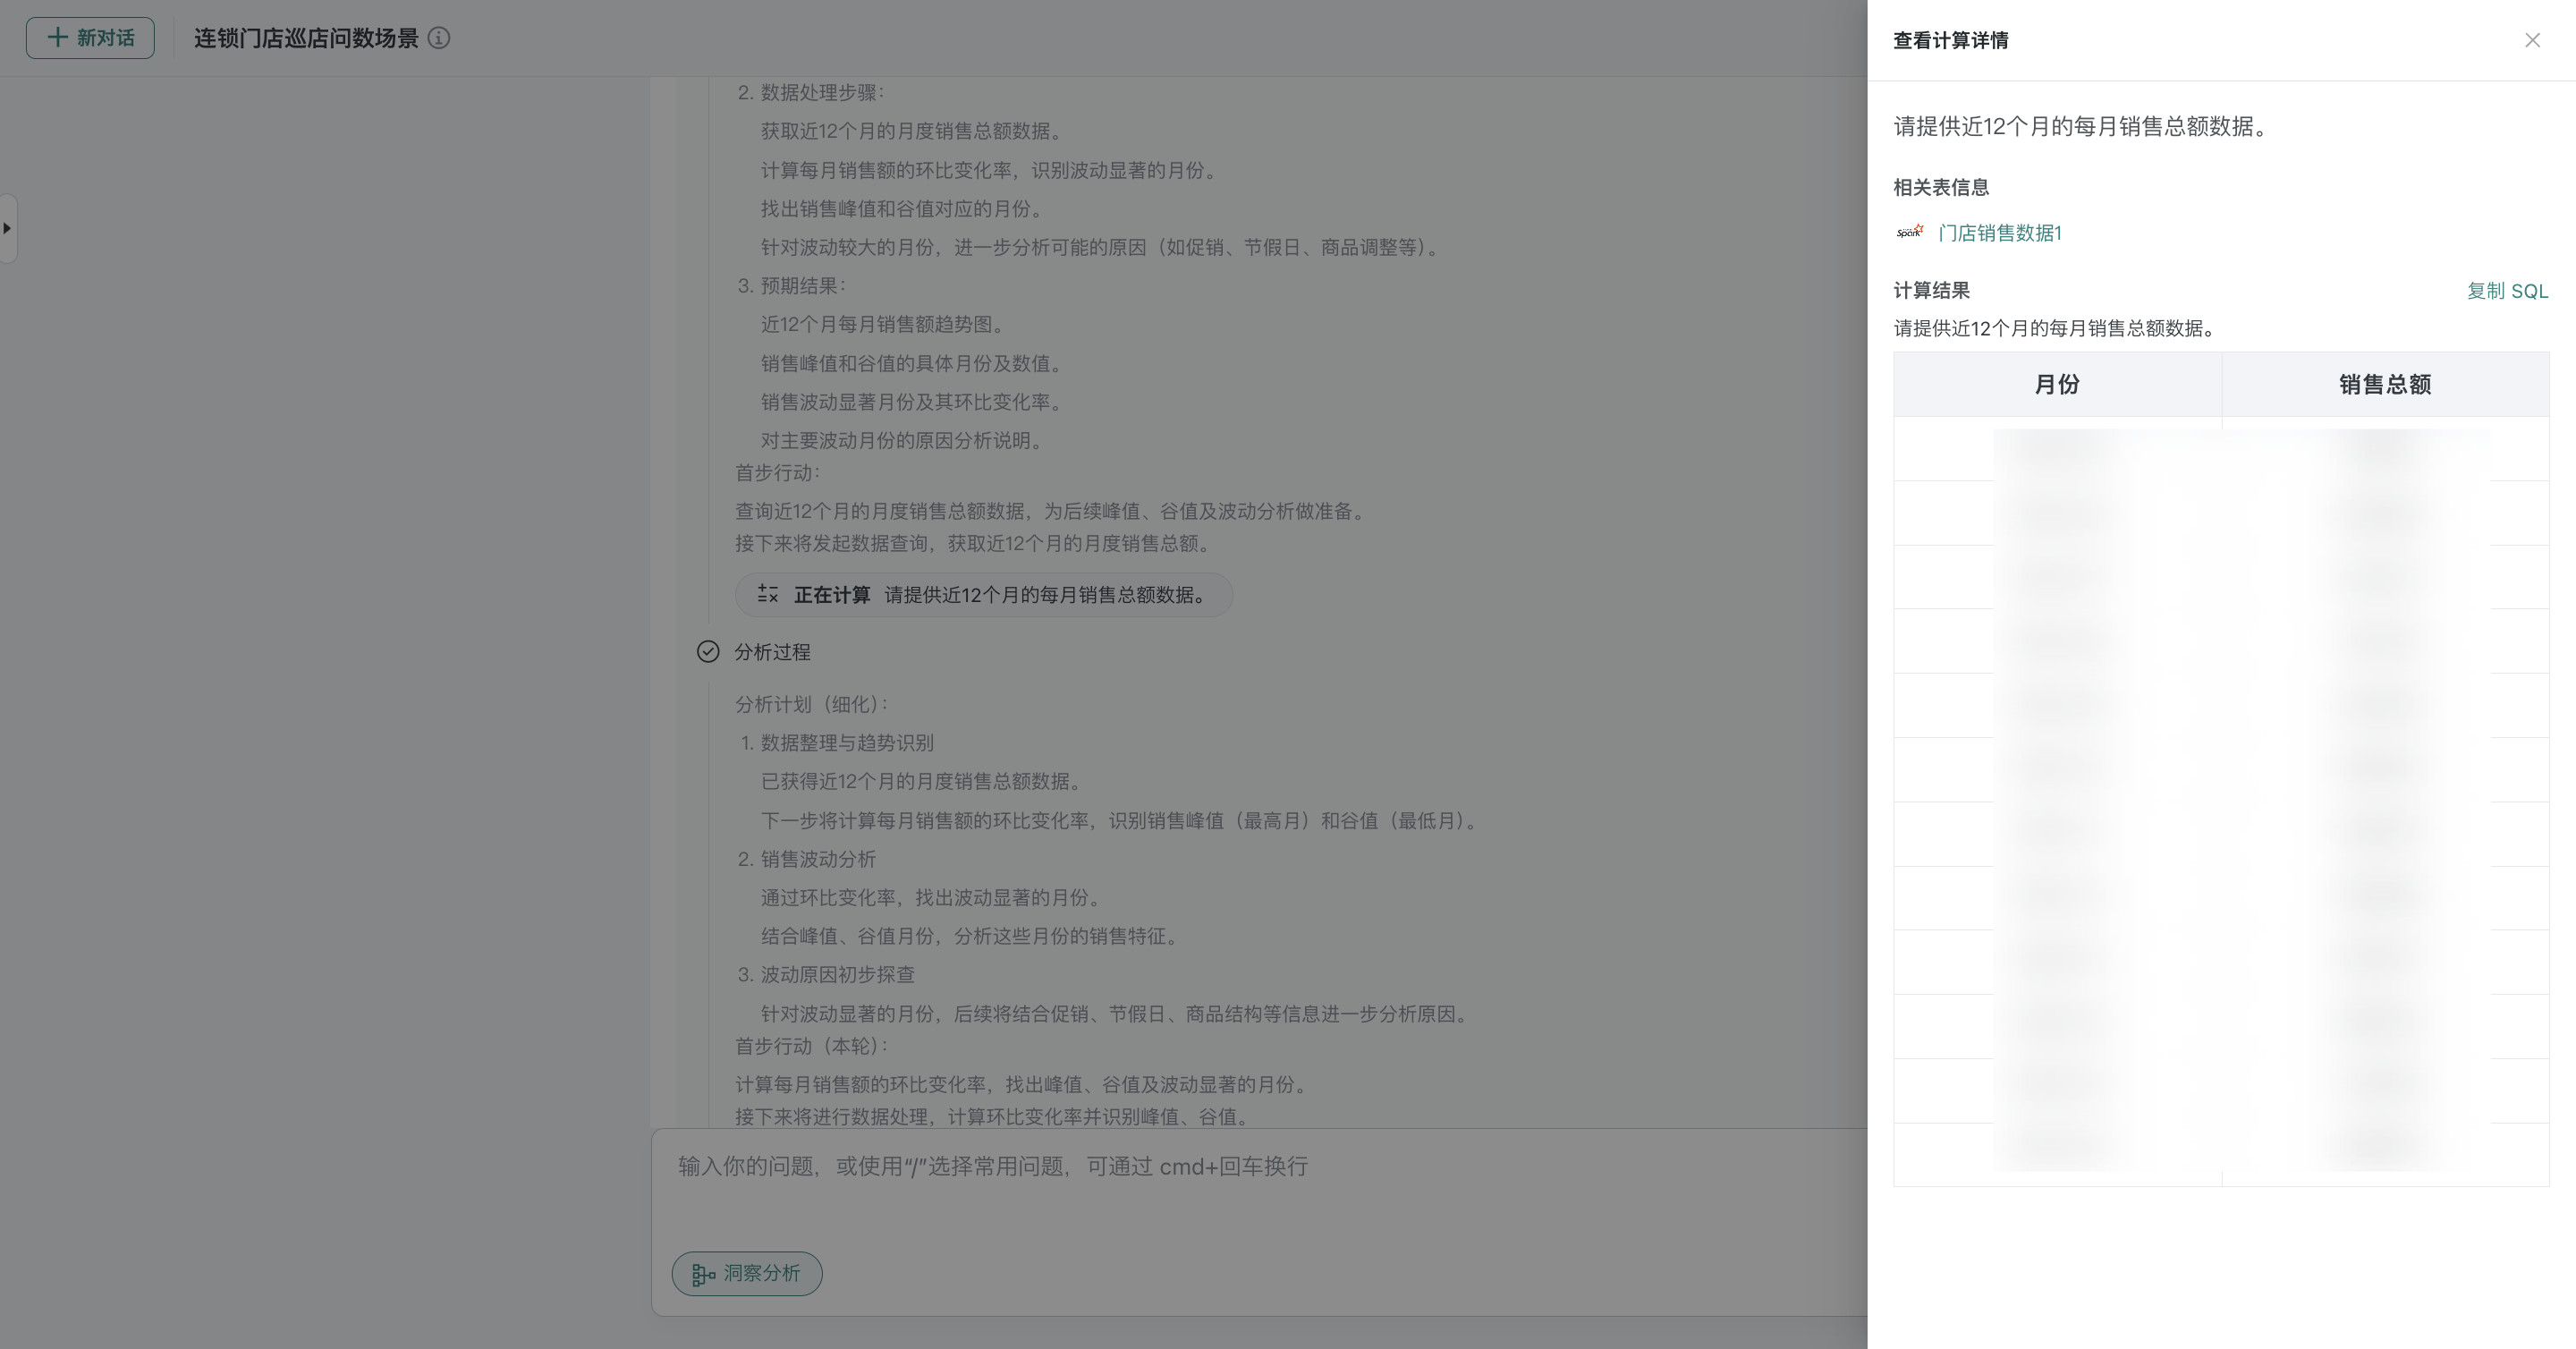 |
Python Generation | Breaks tasks down into Python scripts for execution and is suitable for complex data processing and visualization scenarios. |  |
Web Search | Retrieves relevant information from the public internet in real time to supplement data sources or validate conclusions. Note: Internet access is required. |  |
Features
View Dataset Details in the Current Conversation
Recommended Questions
Related Question Recommendations
Favorite
Feedback
Clear Context
Add Common Phrases
Input Suggestions
Message ID
New Session Interaction Rules
Personalized Memory
Voice Query
Query Visualization
When Insight Agent answers simple L1 query questions, the query result stays consistent with L1 query behavior. It supports actions such as Show / Hide Analysis Parameters, Switch Visualization, Axis Scale Settings, and Related Question Recommendations. This combines lightweight Q&A convenience with deeper analysis extensibility.
Report Display
After the report is generated, the full report content is expanded on the right side by default.
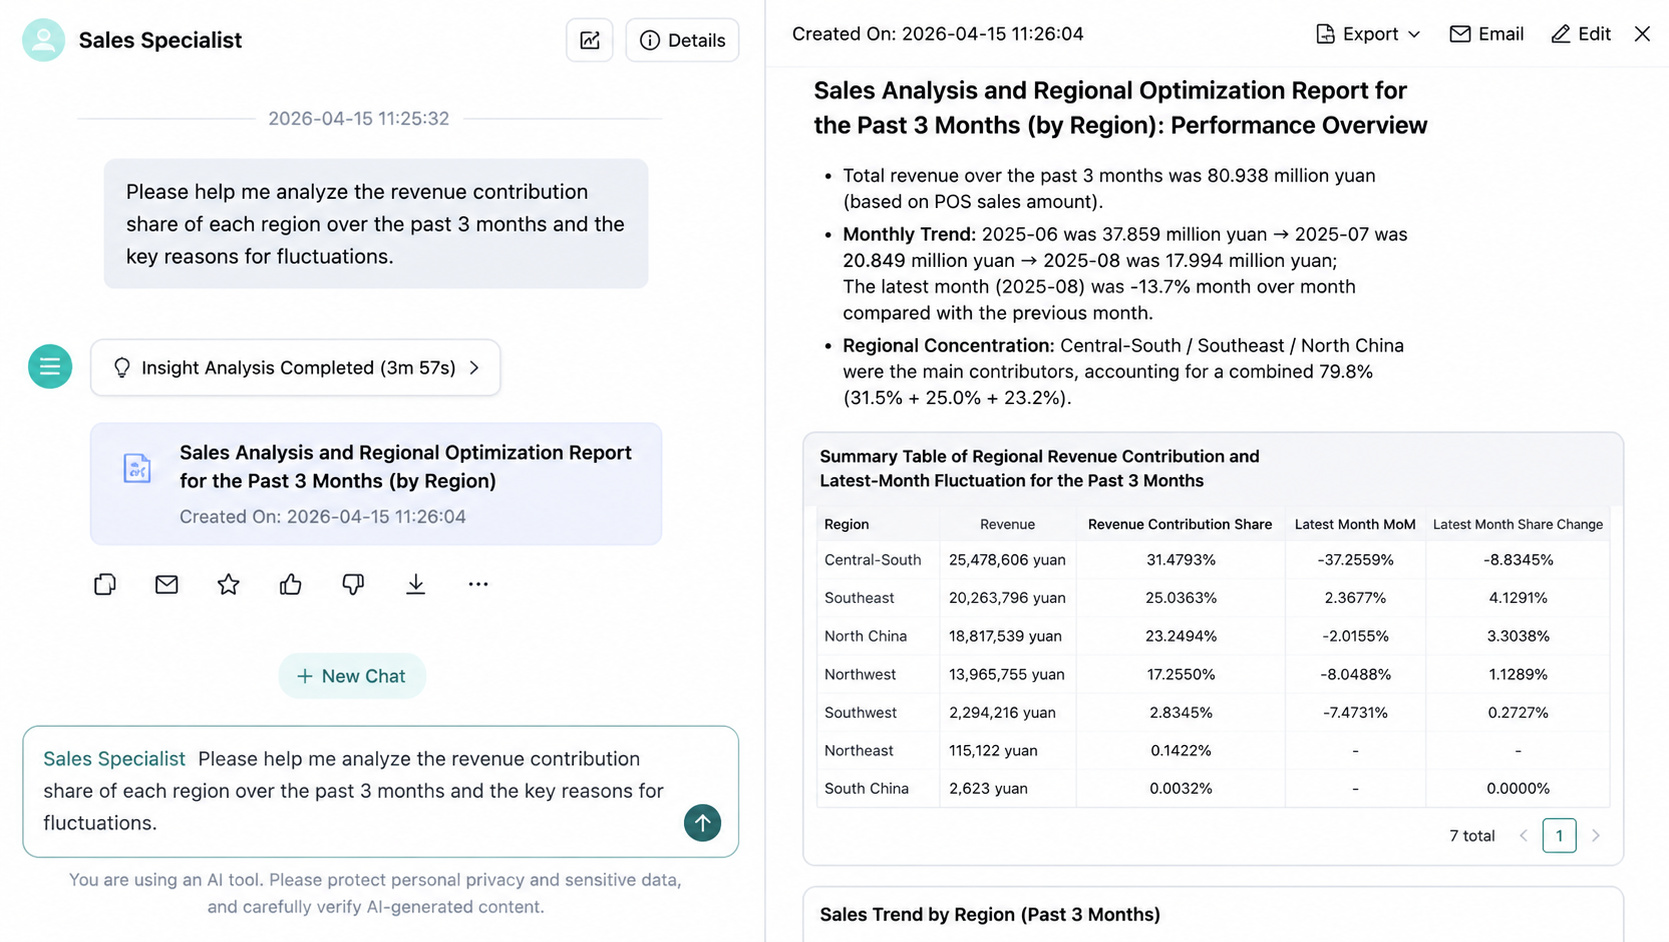
View Data Source
Insight analysis reports support viewing data sources, making it easier to trace the data basis of report conclusions and improve the credibility and explainability of analysis results.
Prerequisites
Show data sources has been enabled in Agent Detail Settings > Basic Information > Function Switch Configuration > Insight.
Steps
On the generated report page, click the numeric marker next to a conclusion to view the specific data information used by that conclusion, including the dataset and SQL query logic.
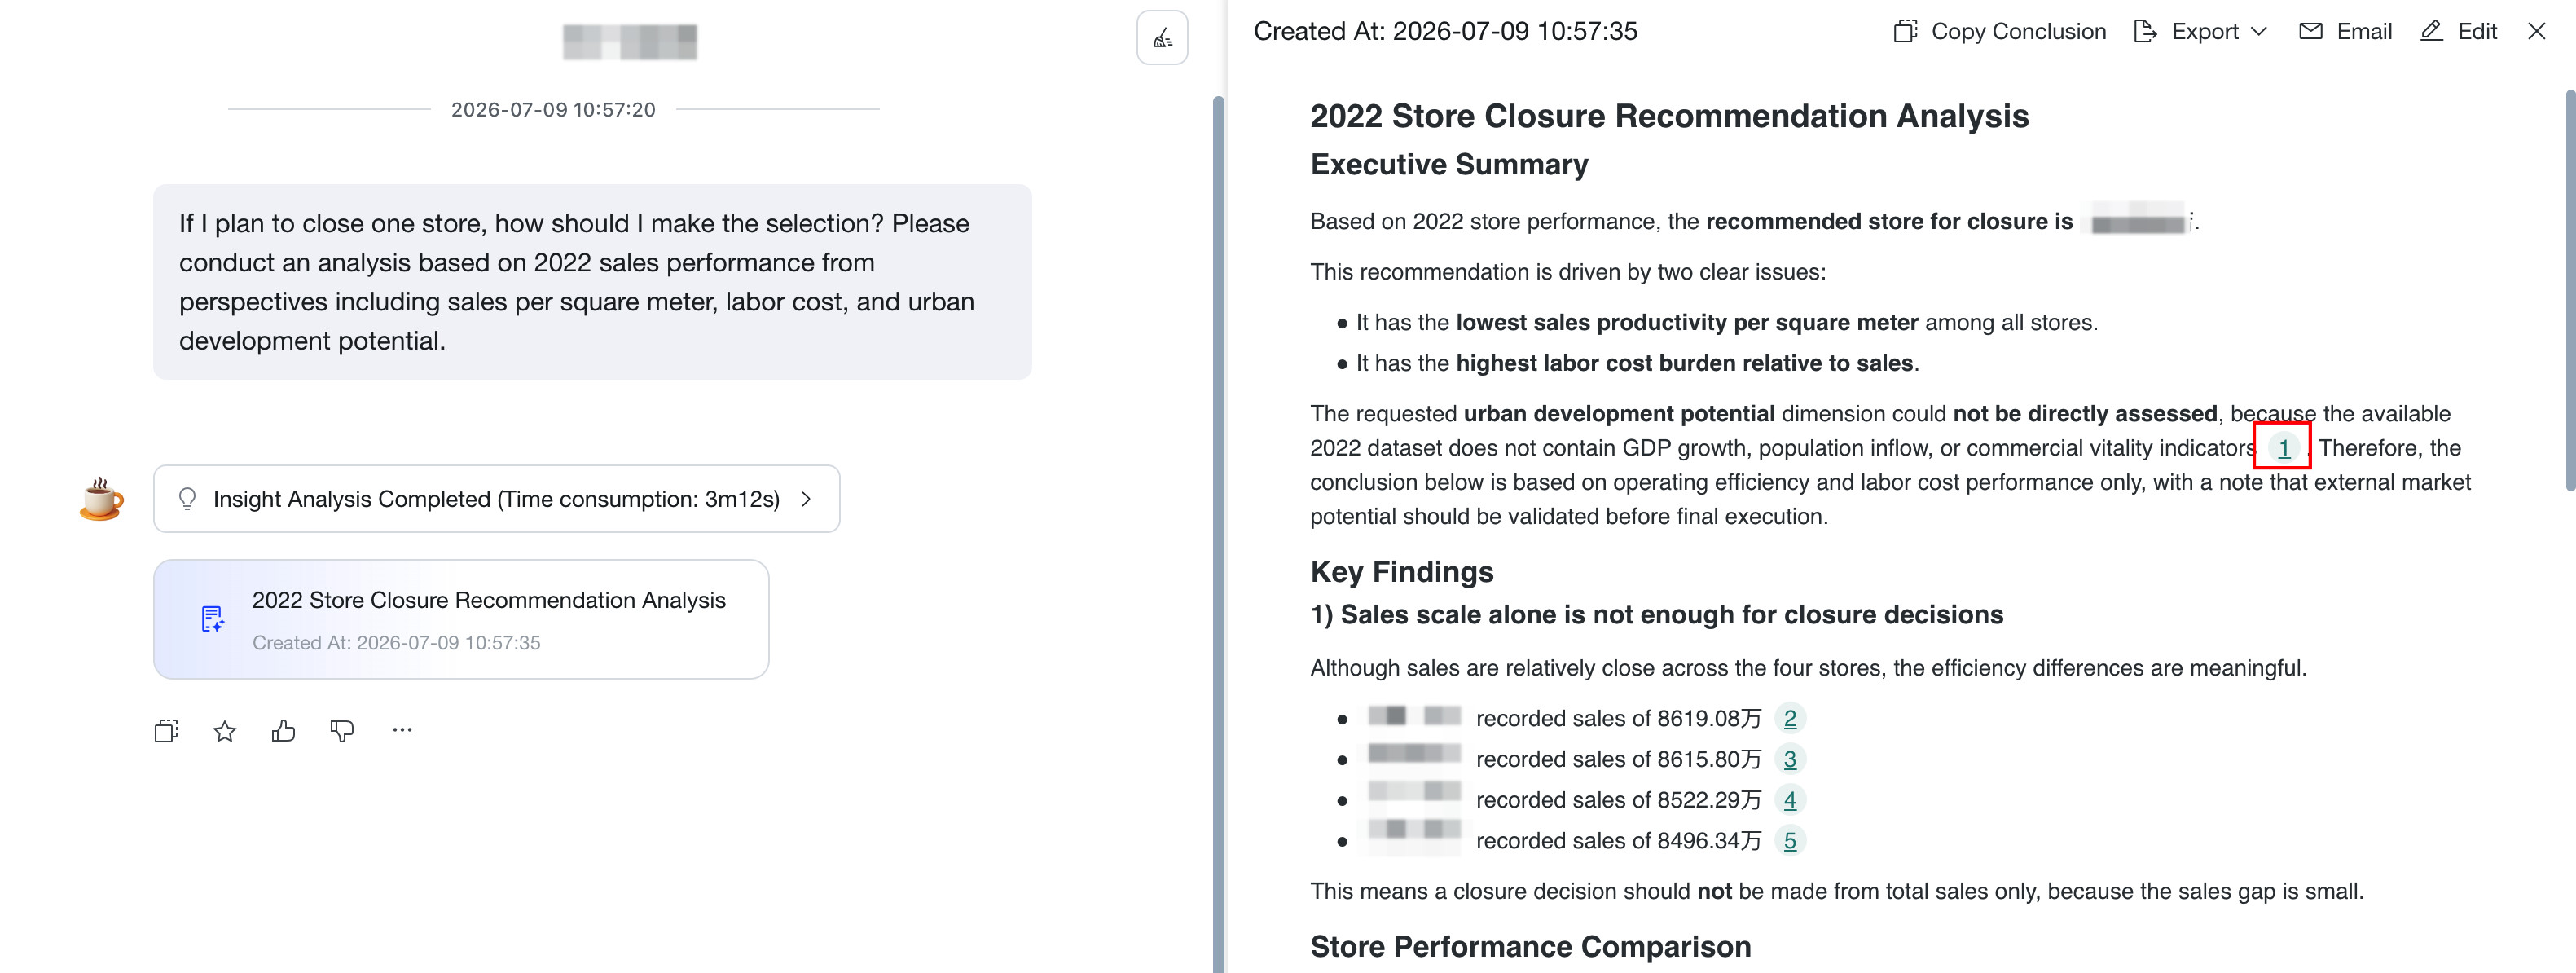
If a user manually edits and saves report content, the data source marker beside the original conclusion is no longer displayed. Because the modified content is manually produced, the system can no longer guarantee the credibility and explainability of that conclusion, so source tracing is no longer provided.
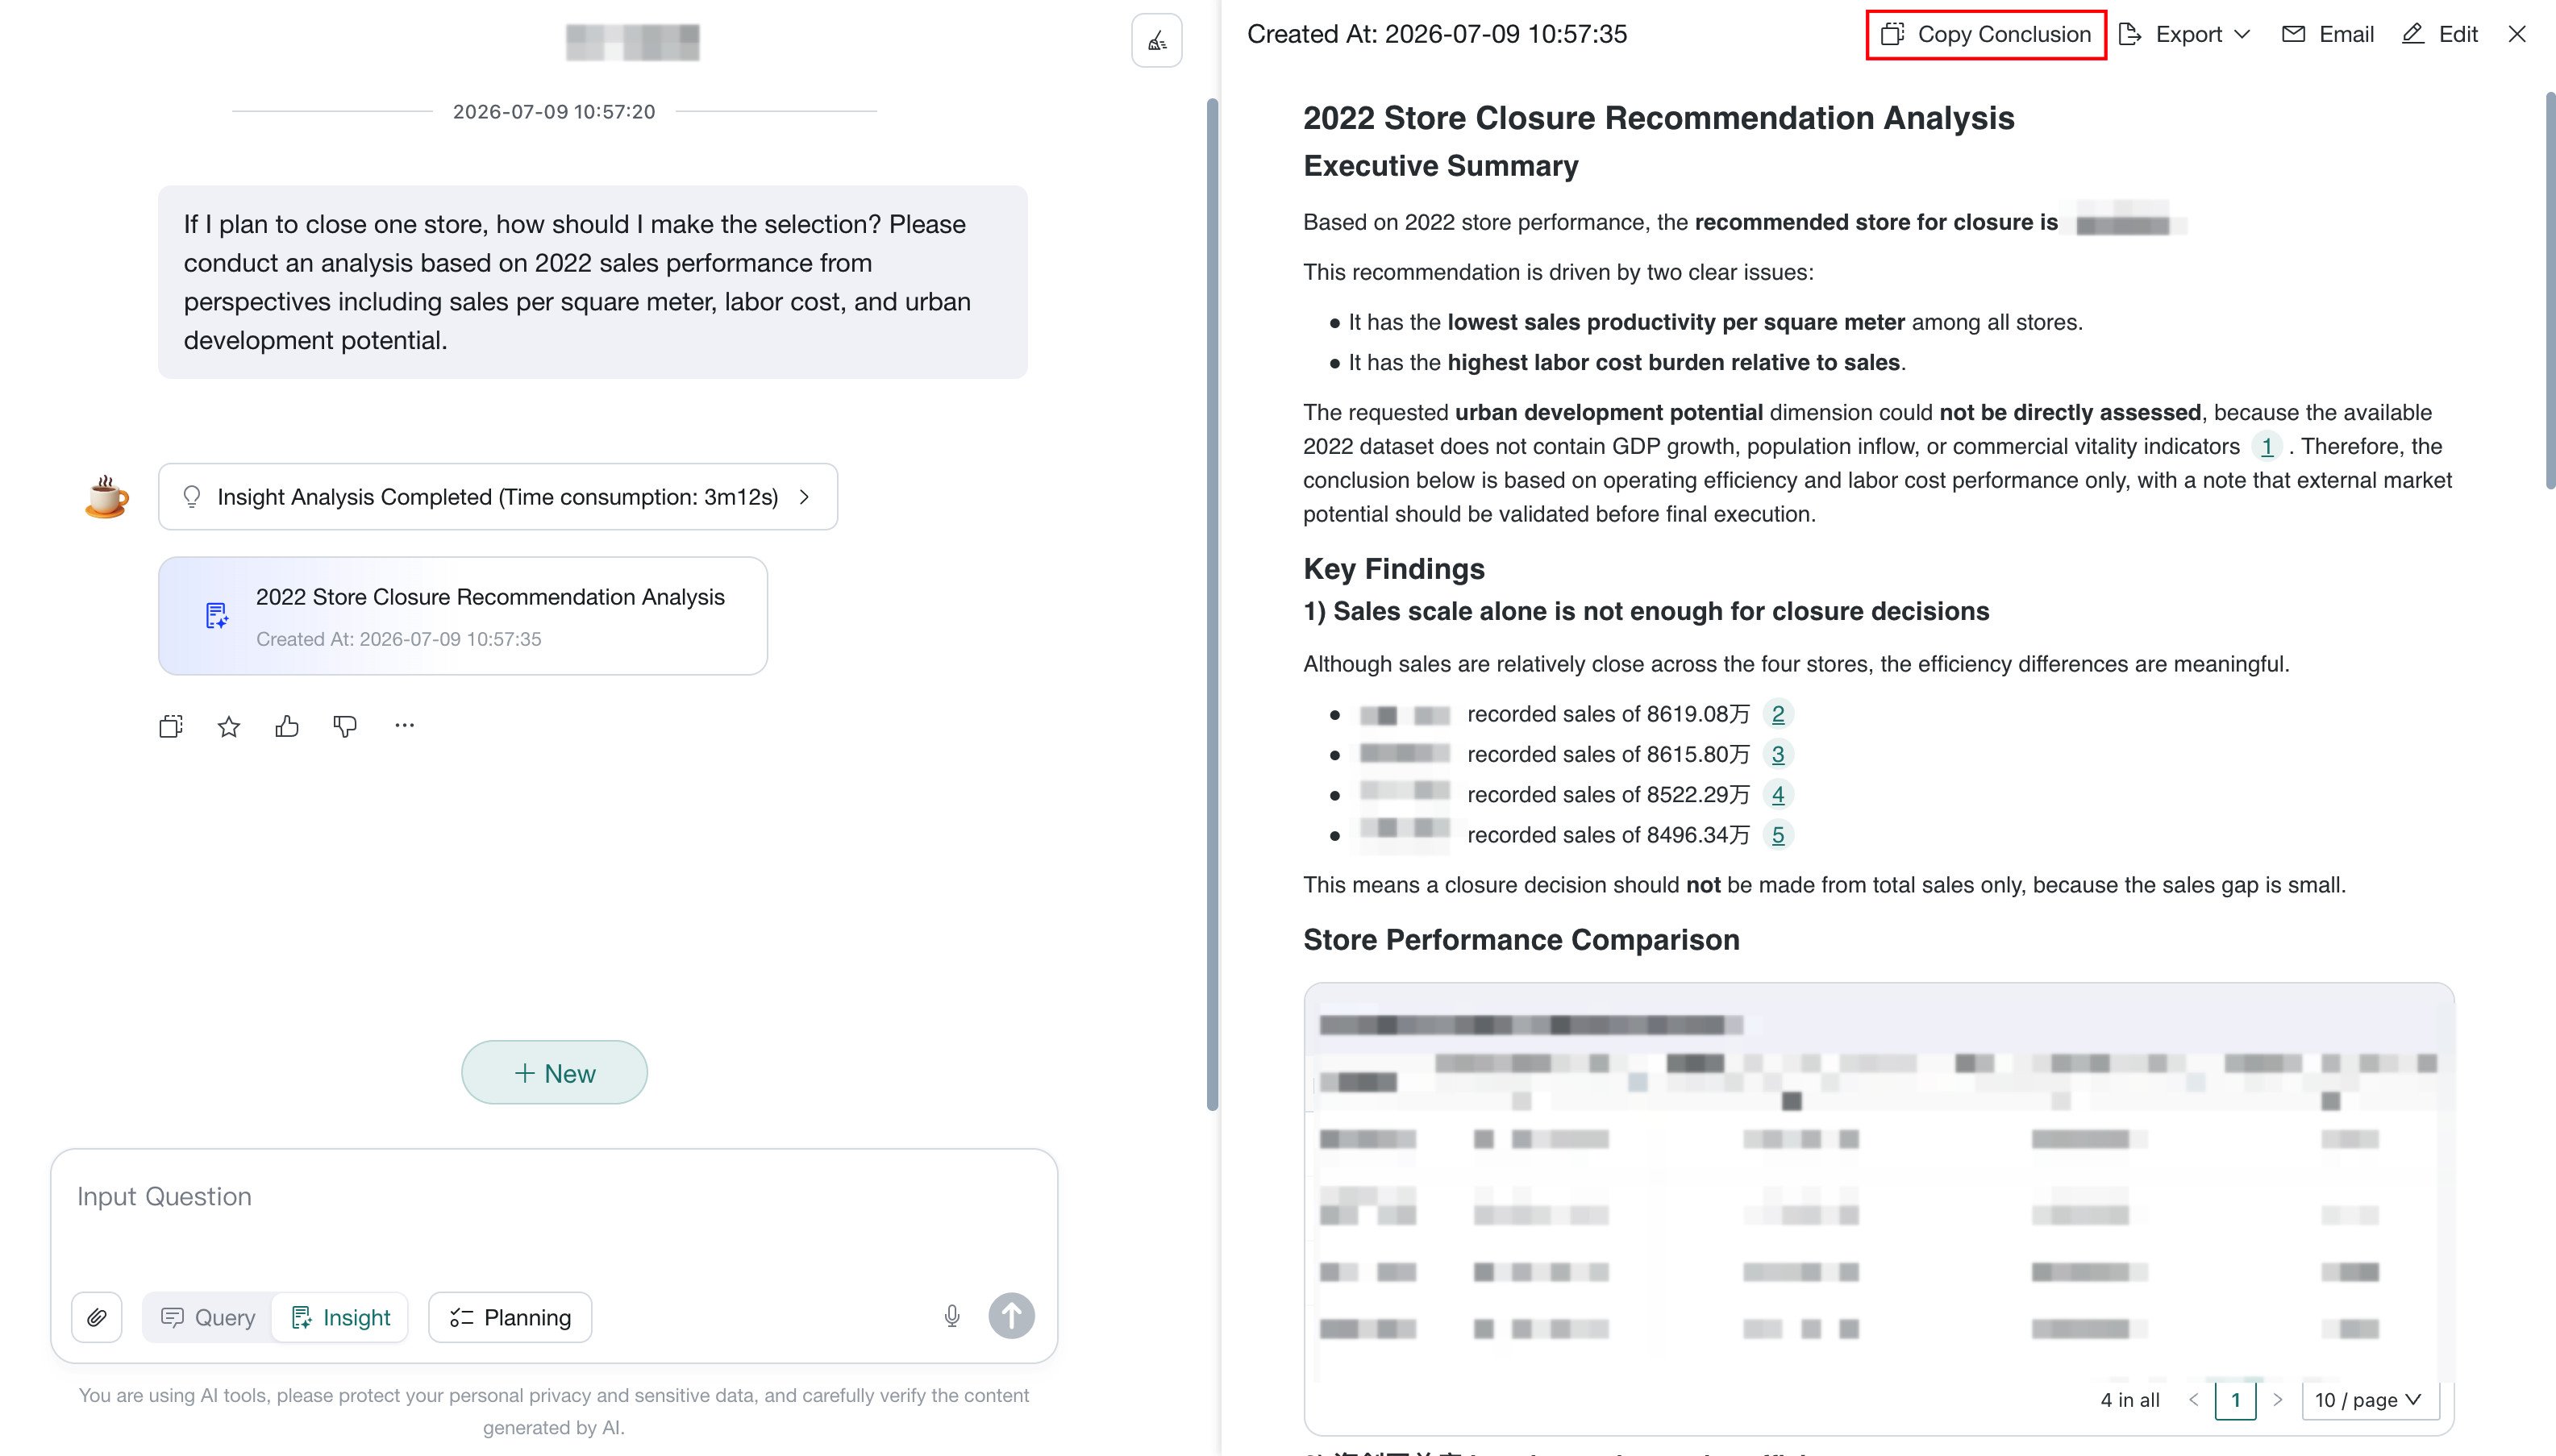
Copy Conclusions
Insight analysis reports support copying the full report with one click. The copied content is pasted in Markdown format.
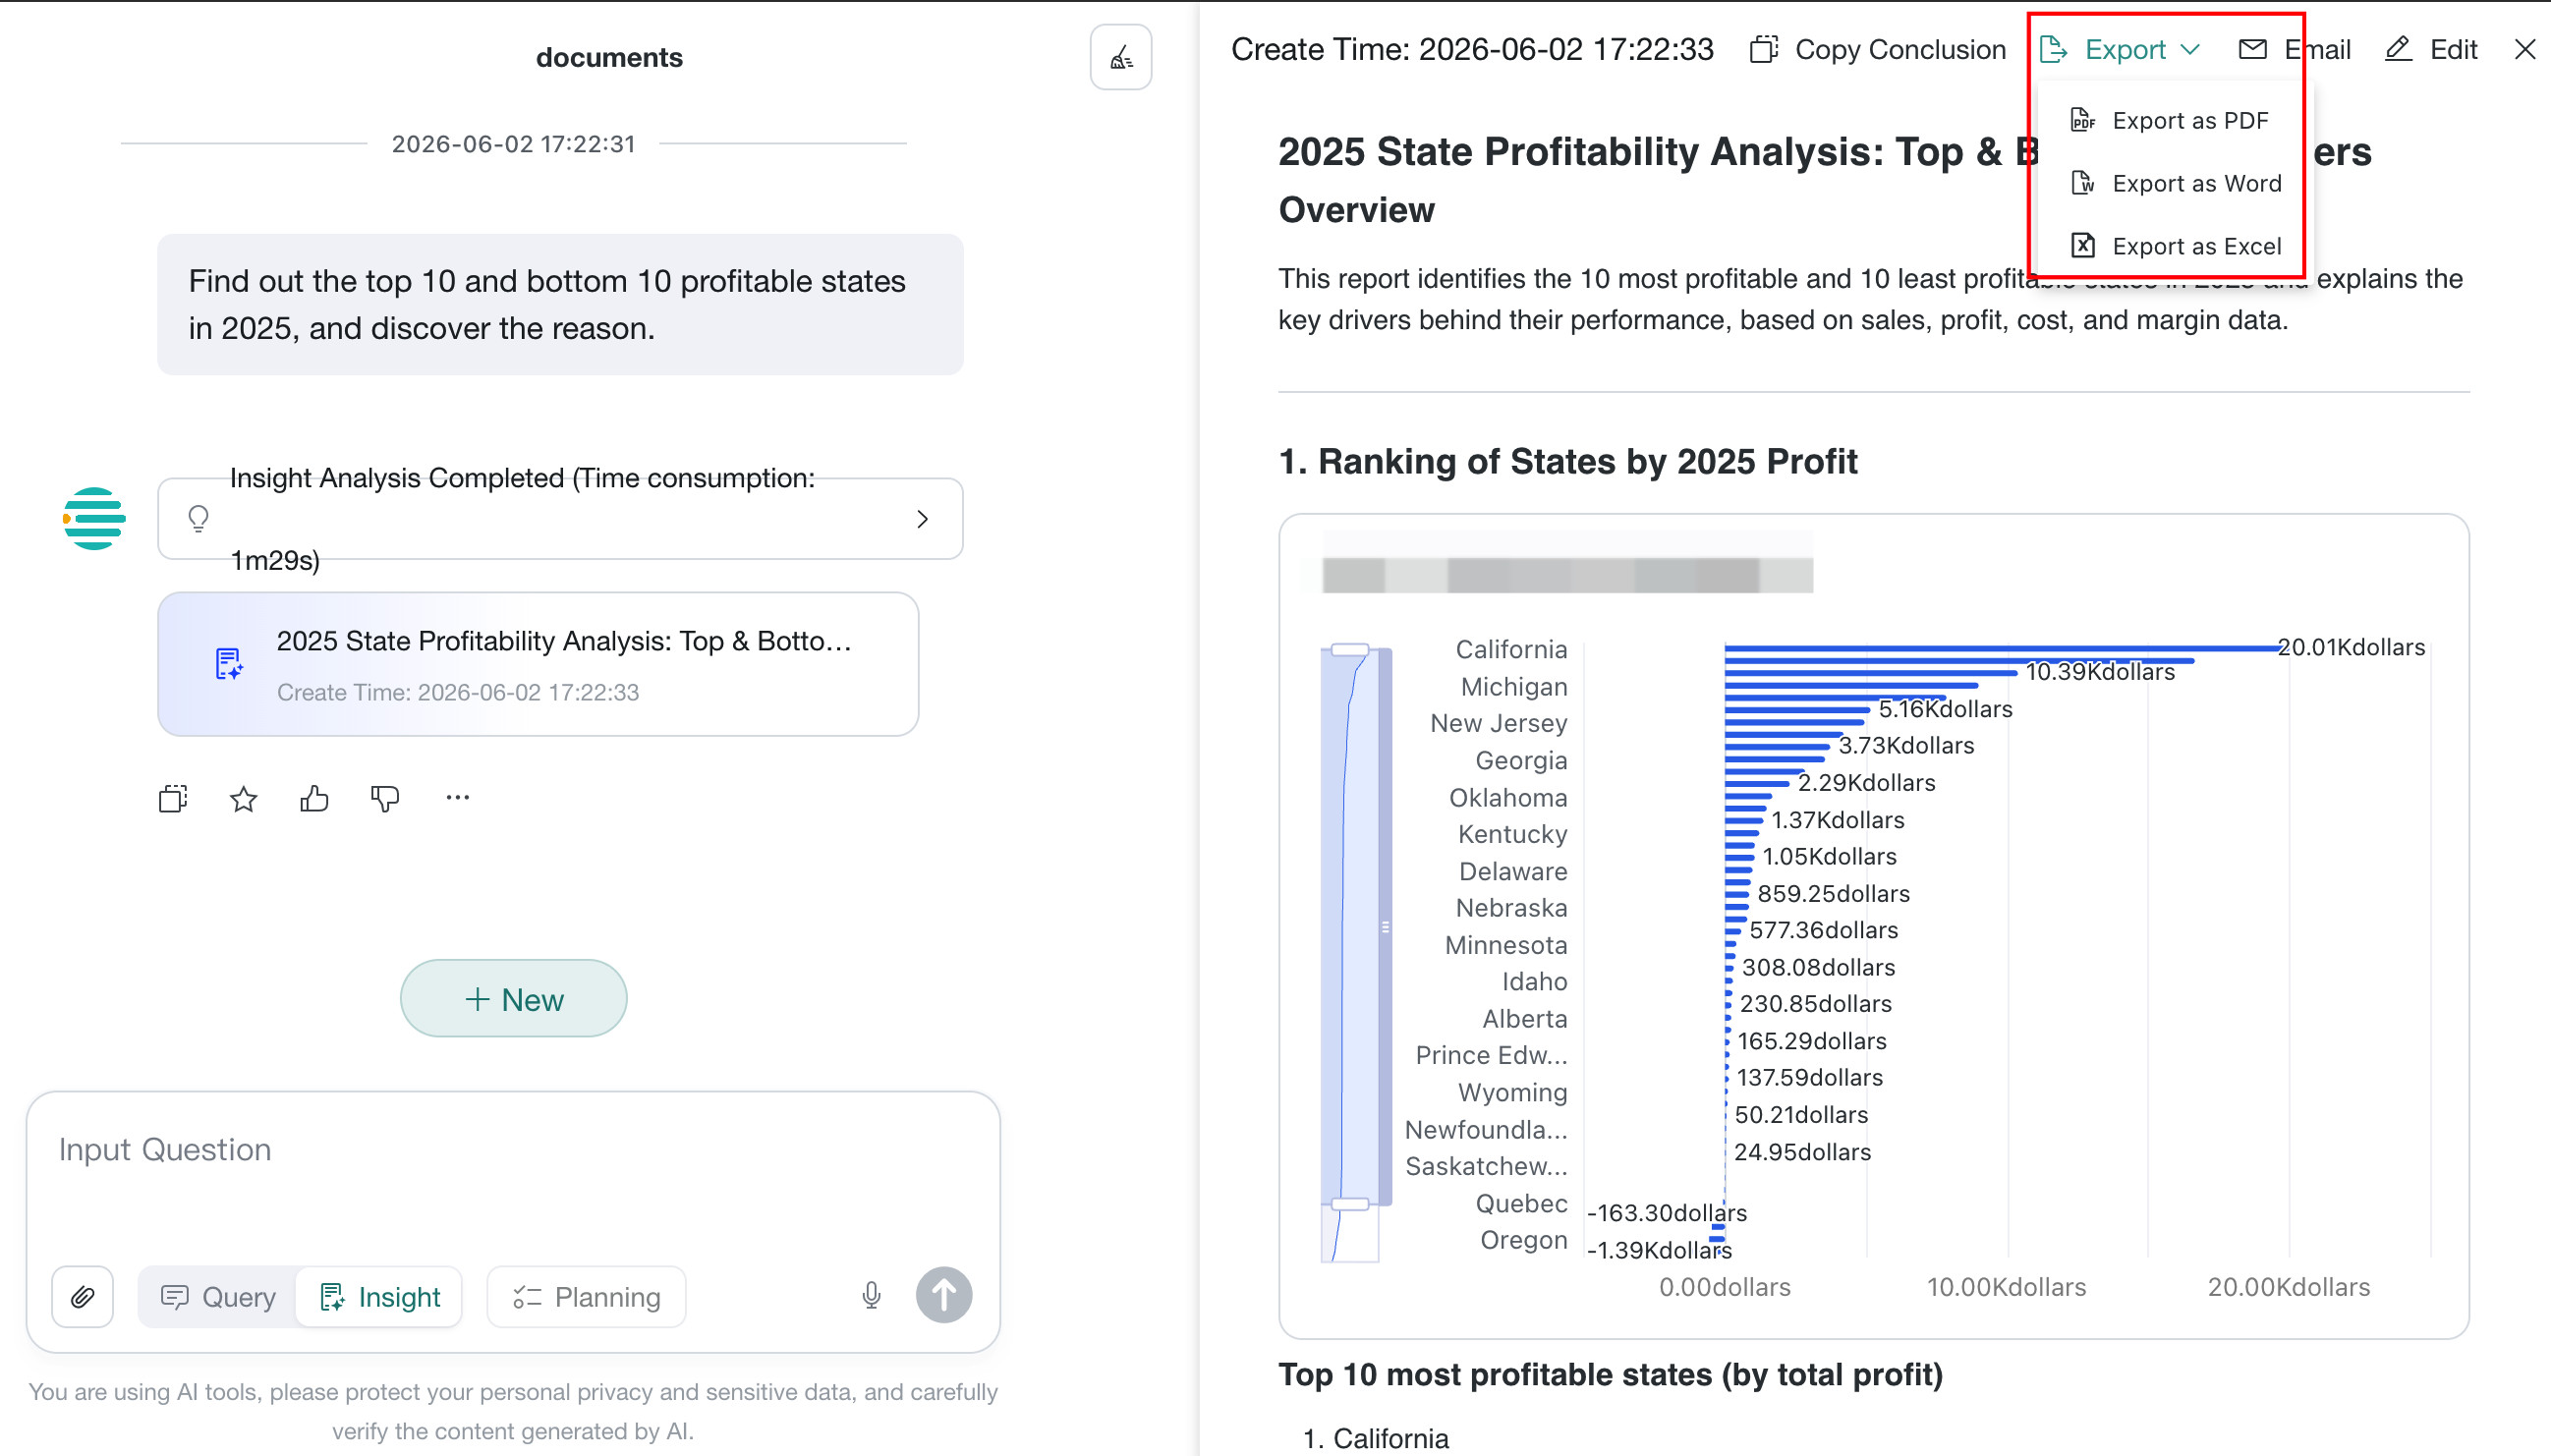
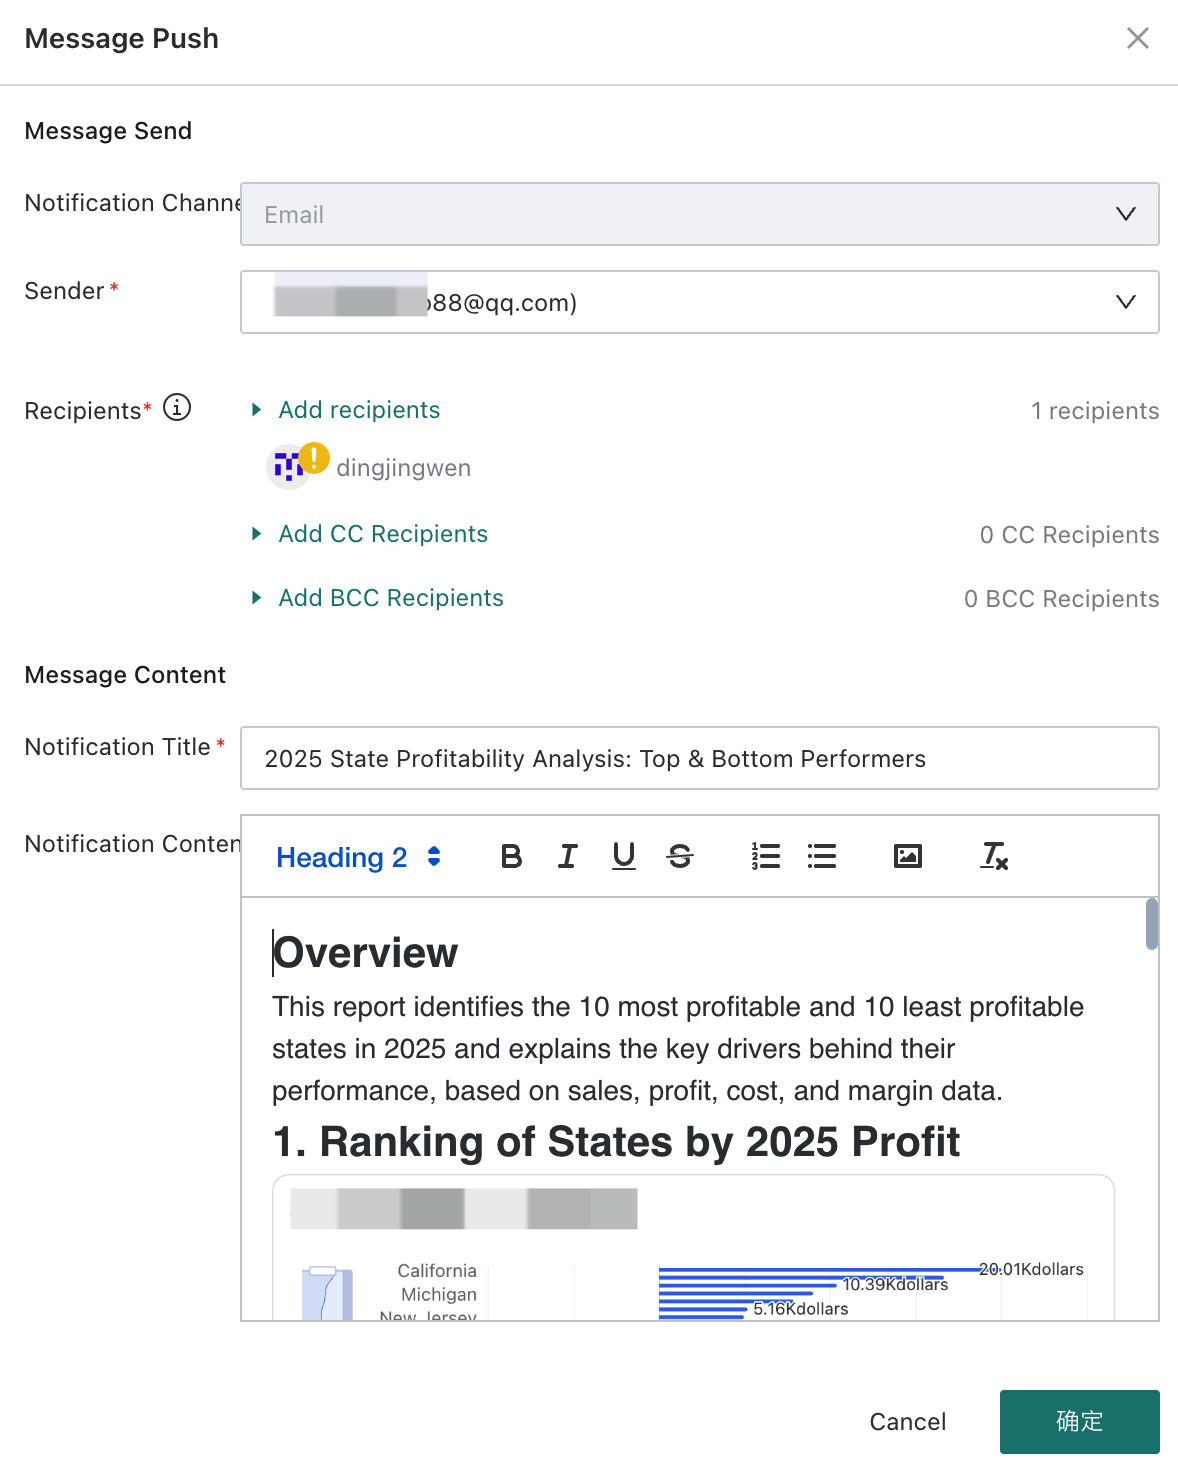
Export
On the report page, users can click the export button in the upper-right corner to export the insight report as PDF or Word. The exported content includes both text and charts in WYSIWYG form.
Email Push
Prerequisites
- The email service has already been configured. For configuration details, see Email Service Configuration, and recipient users must have email addresses configured.
- The Email Push feature has been enabled on the
Agent Management > Management Center > Feature Switch Settingspage.
Steps
Users can send analysis conclusions directly to designated recipients by email, enabling data-driven communication and closed-loop delivery. The feature supports rich-text editing, chart insertion, and multi-user configuration.
-
On the report page, click the
Emailbutton in the upper-right corner to open theMessage Deliverydialog.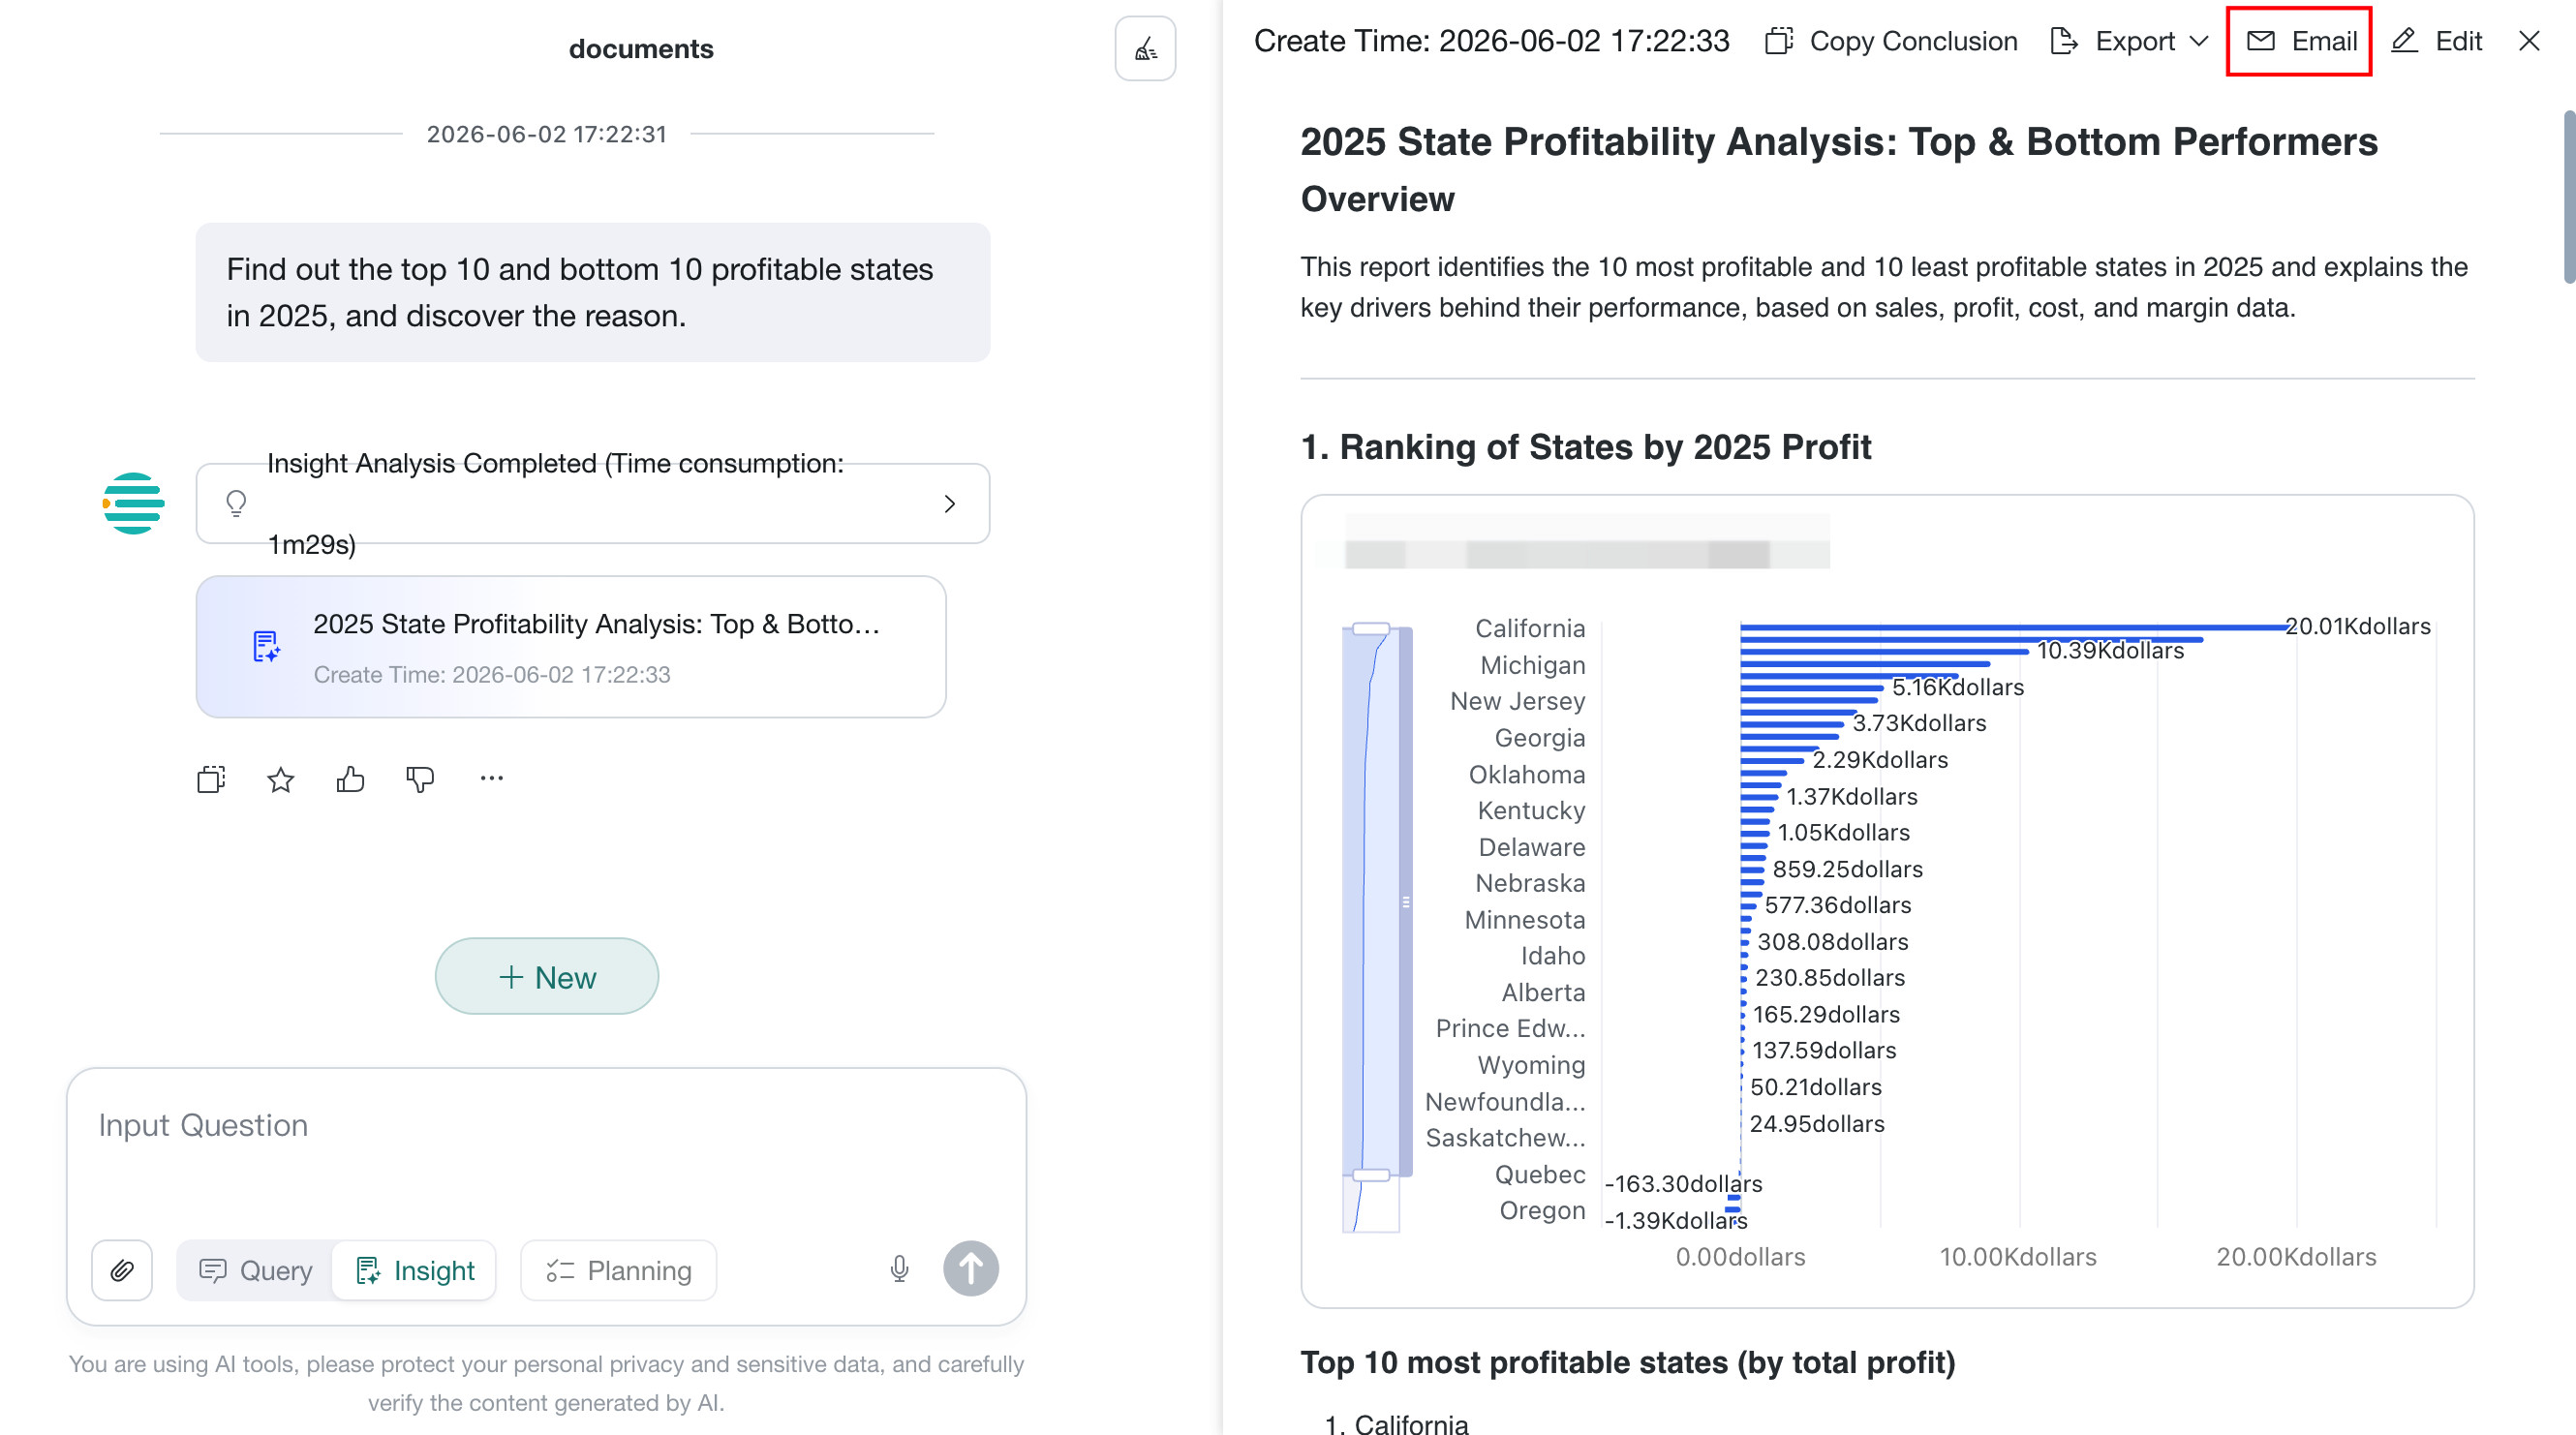
-
In the dialog, configure the following:
- Notification channel: defaults to
Email - Recipients: select BI users. The current user is selected by default, and multiple users are supported.
- Notification title: defaults to the report title and can be edited.
- Notification content: defaults to the report body. Charts in the report are automatically inserted as images, and rich-text editing is supported.
- Notification channel: defaults to
-
After completing the configuration, click
Confirmin the lower-right corner. The system will automatically send the email to the recipients.NoteIf the system indicates that delivery failed, check whether the recipient email addresses are correct and whether the email service configuration is effective.
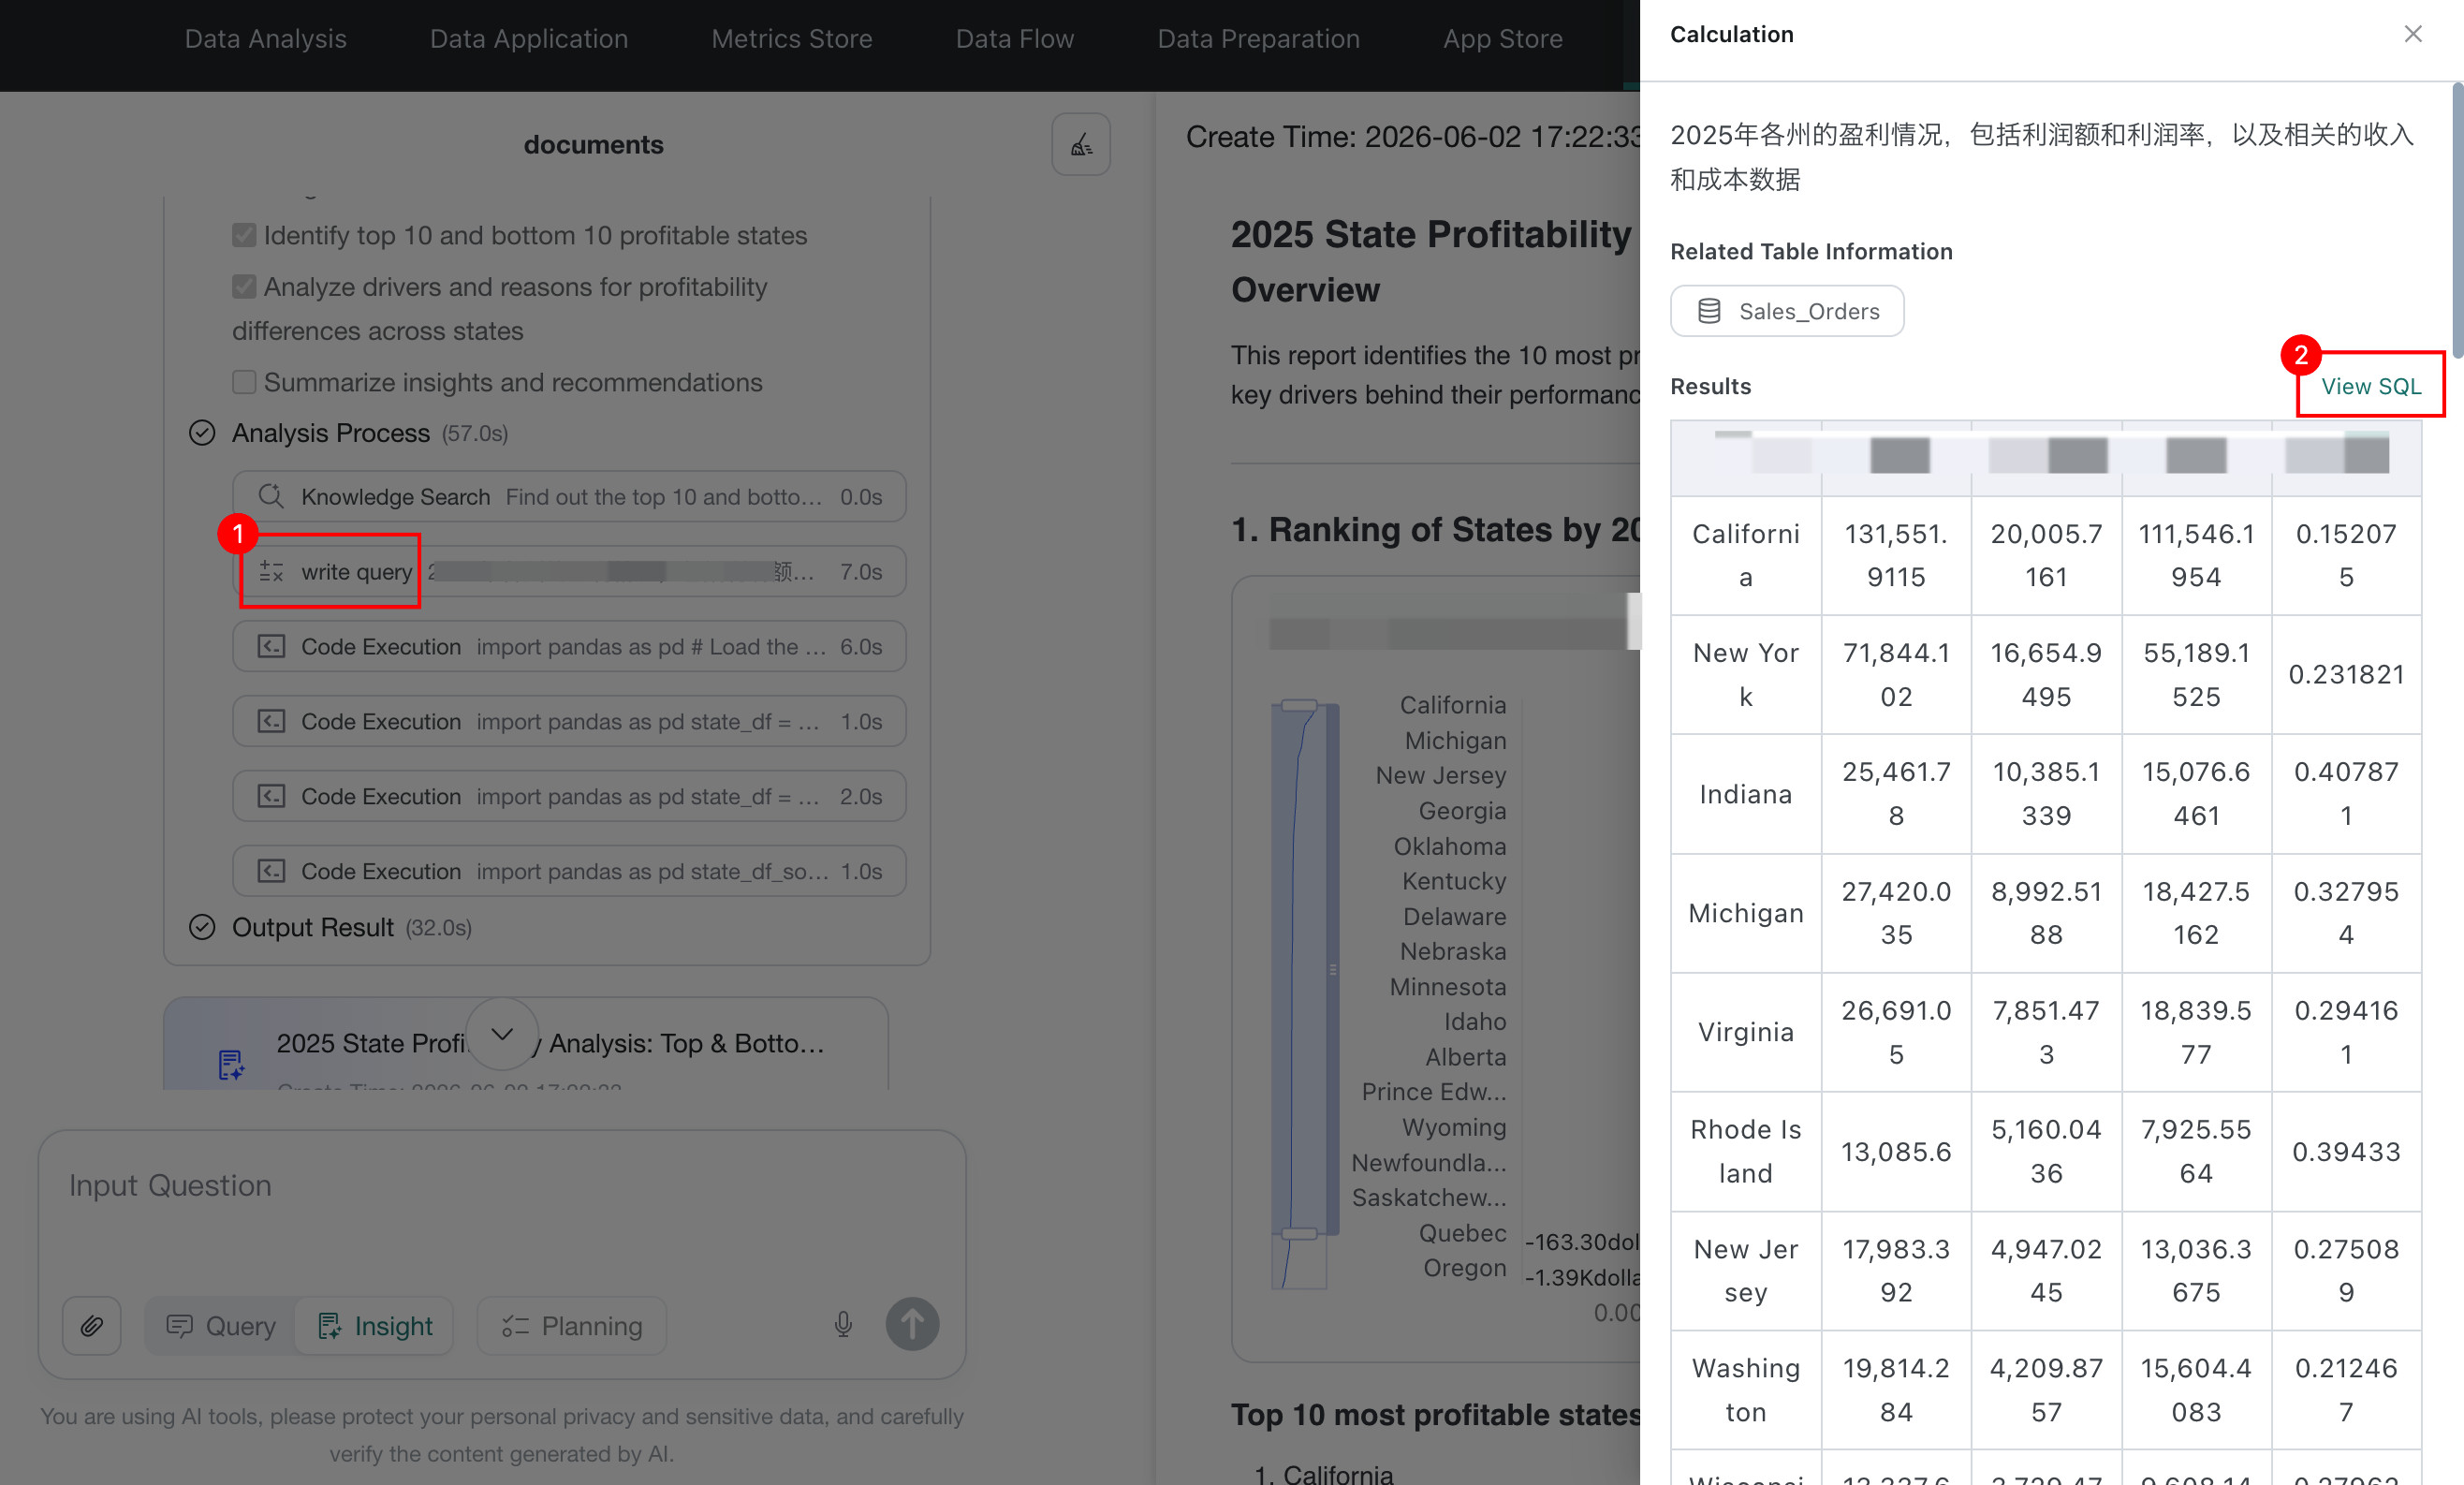
View and Copy SQL Details
During insight analysis, when the system invokes the Data Query tool, it supports viewing SQL details and copying SQL with one click.
View SQL Details:click a data query card to expand and view the generated SQL statement.Copy with One Click:click the copy button to copy the SQL statement to the clipboard for use in data warehouse queries or further analysis.
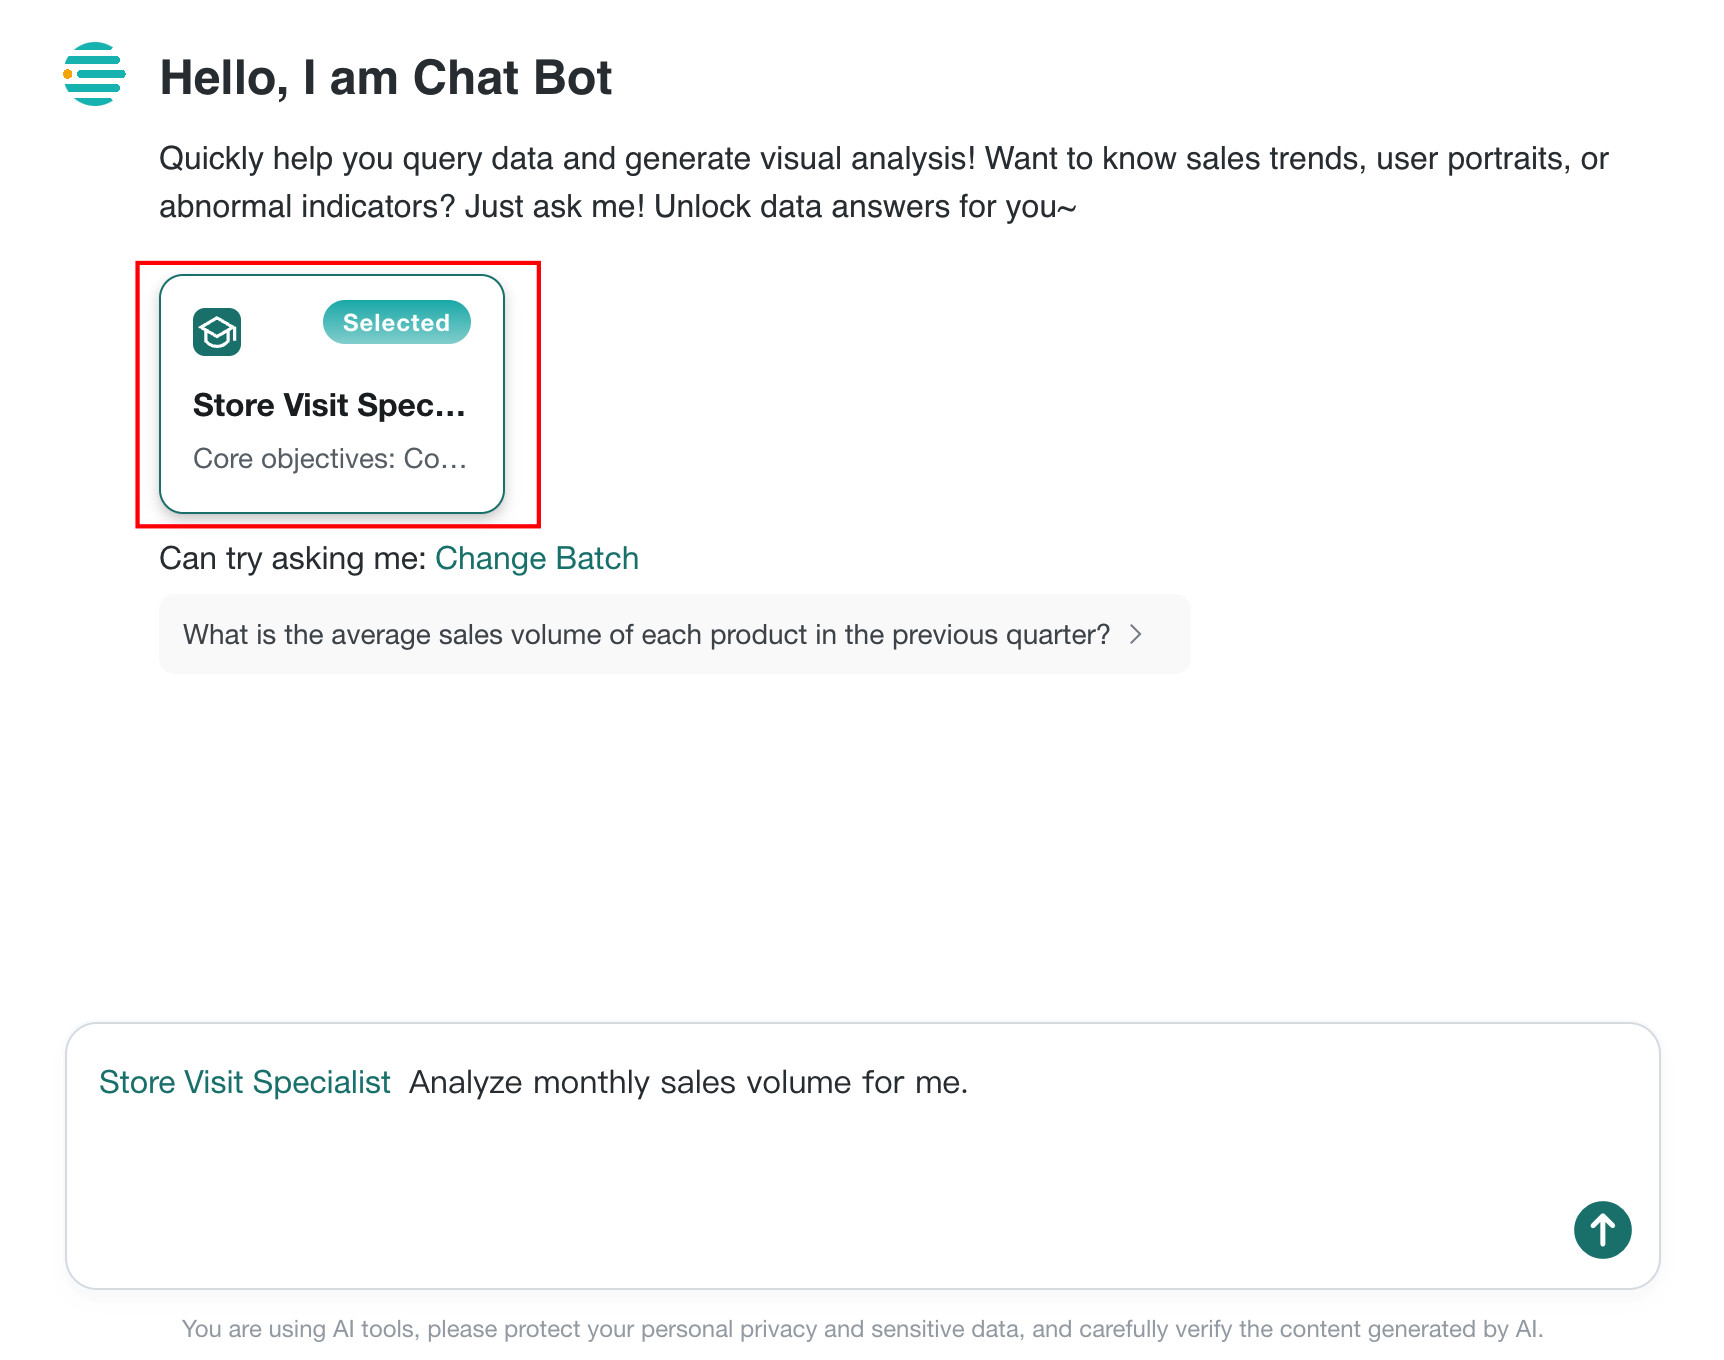
Analysis Specialist Invocation
In insight analysis, users can call preconfigured Analysis Specialist items by selecting them. For how to configure them, see Analysis Specialist.
Select the specialist to use on the insight page, and the system will automatically generate a report based on that specialist's predefined analysis approach.
Upload a File for Analysis
Insight Agent allows users to upload Excel and CSV files as supplemental data sources. The system combines the uploaded file content with datasets already associated with the agent and generates an insight report that better matches the user's actual data.
If the uploaded Excel file includes multiple worksheet tabs, the system automatically parses data from every sheet.
Applicable Scenarios: when users have temporary analysis needs and the required data has not been ingested into BI datasets, they can upload a local Excel or CSV file to quickly obtain an insight result.
Prerequisite: File Upload has been enabled in the Insight configuration.
Steps
- In the input area of
Insight Agent, click theUpload Filebutton. - In the file selection window, choose a local
Excel(.xlsx/.xls) orCSV(.csv) file and clickOpento upload it. - After the upload is complete, enter your question and send it. The system will combine the uploaded file data with the analysis process.
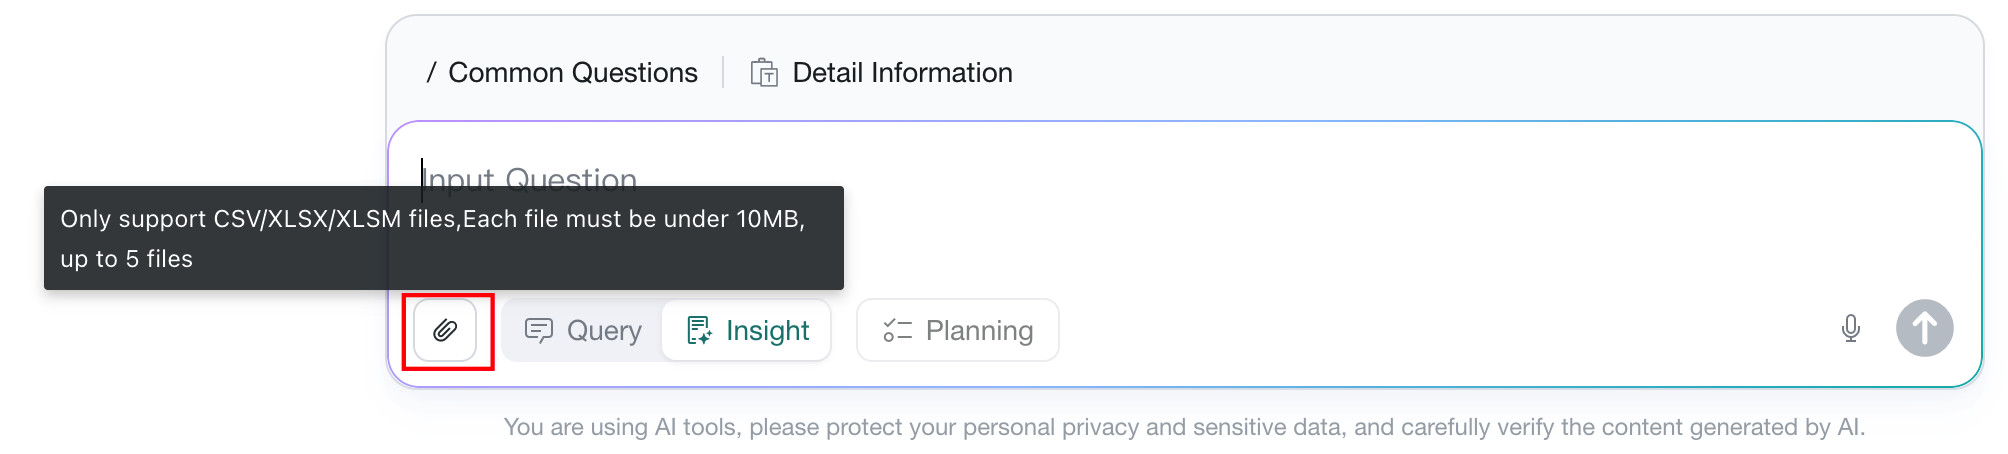
- There are system limits on file size and quantity per upload. If the limit is exceeded, the system prompts the user to adjust and upload again.
- Uploaded files are valid only in the current conversation and are not persisted to the agent dataset.
Limit Exceeded Alert
The system includes built-in query volume limits. During insight analysis, the system shows the following prompts when thresholds are triggered:
-
Query Limit Exceeded:when query results exceed20,000rows, the corresponding data query step displays aQuery Limit Exceededlabel with the message:The query result exceeded the system limit of 20,000 rows. The data has been truncated.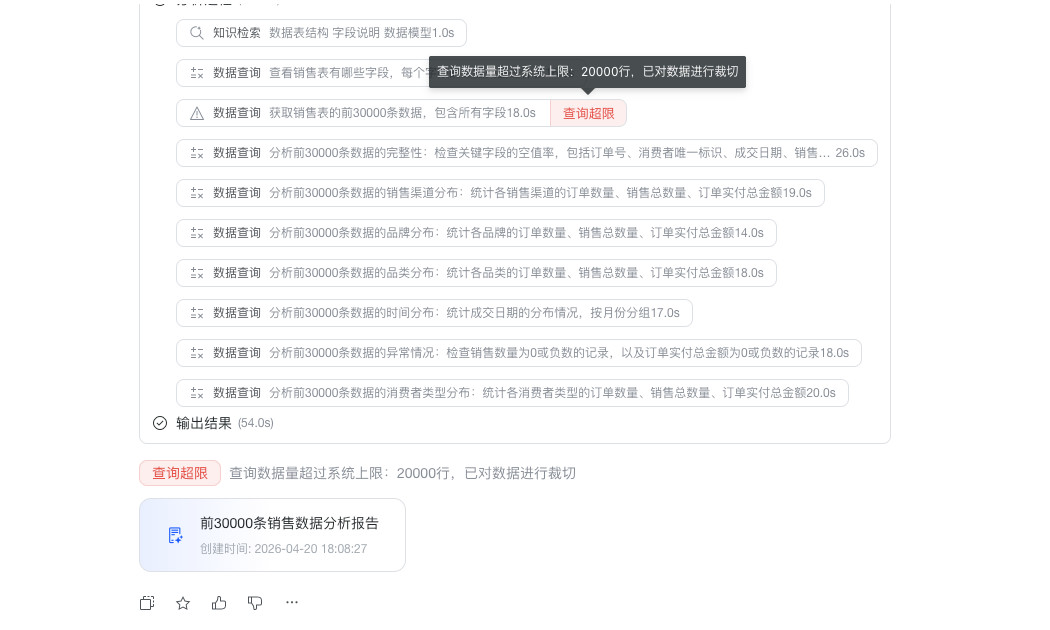
-
Data Processing:when the interpreted data exceeds1,000cells, the system automatically processes the data to ensure complete insight results. During this process, aData Processinglabel is displayed with the message:Because the data result exceeded 1,000 cells, the system automatically processed the data and performed insight analysis on the processed result.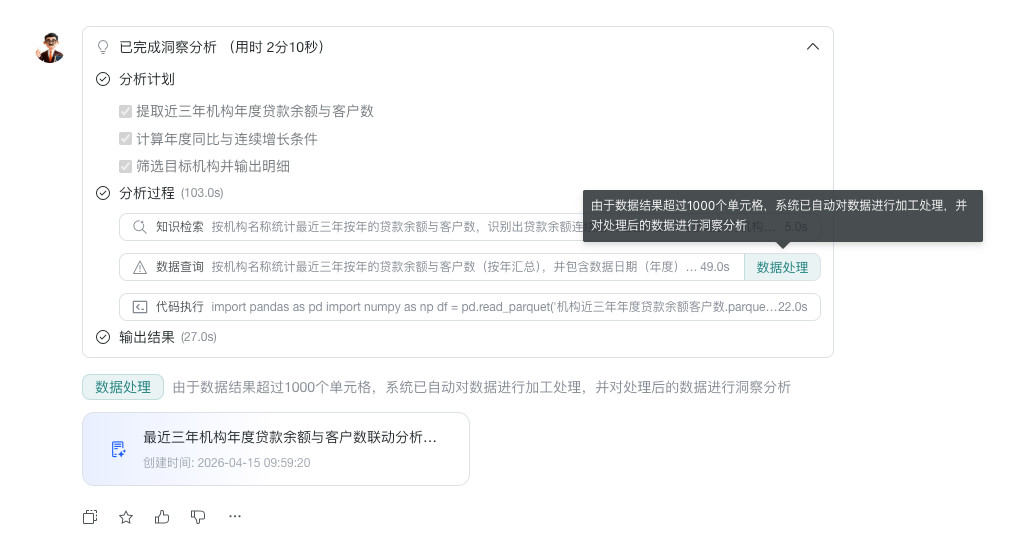
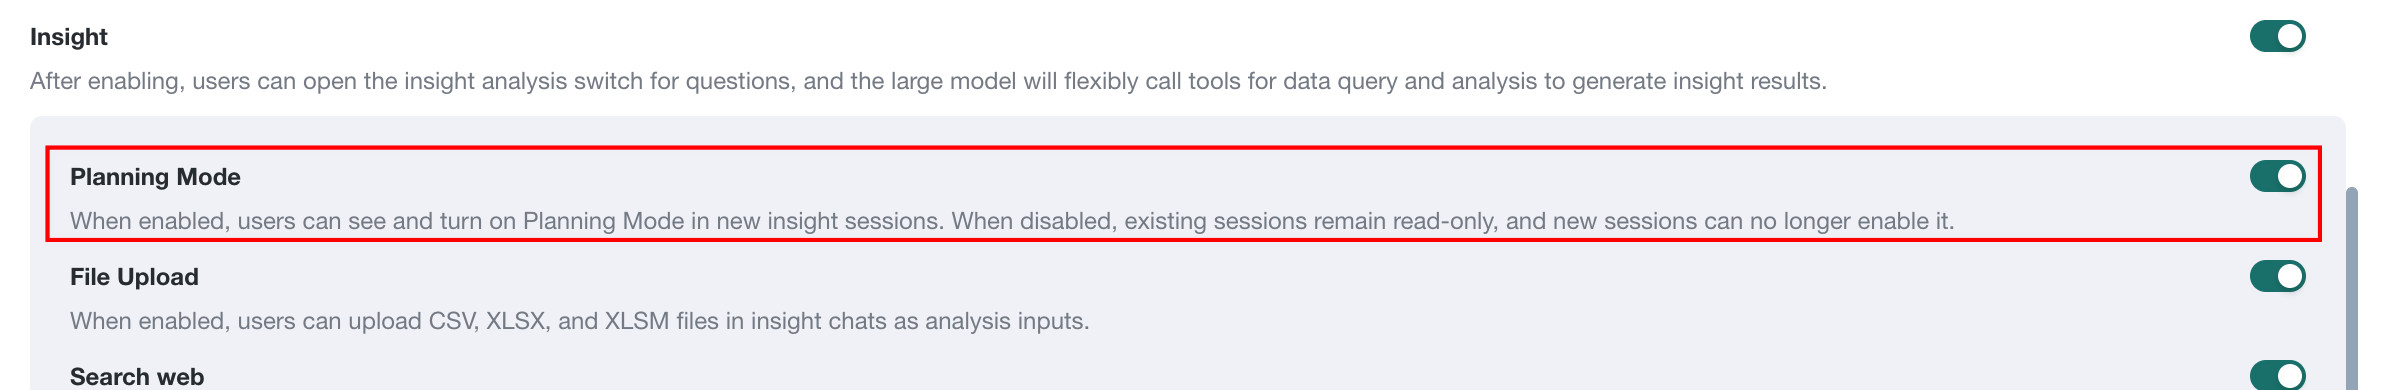
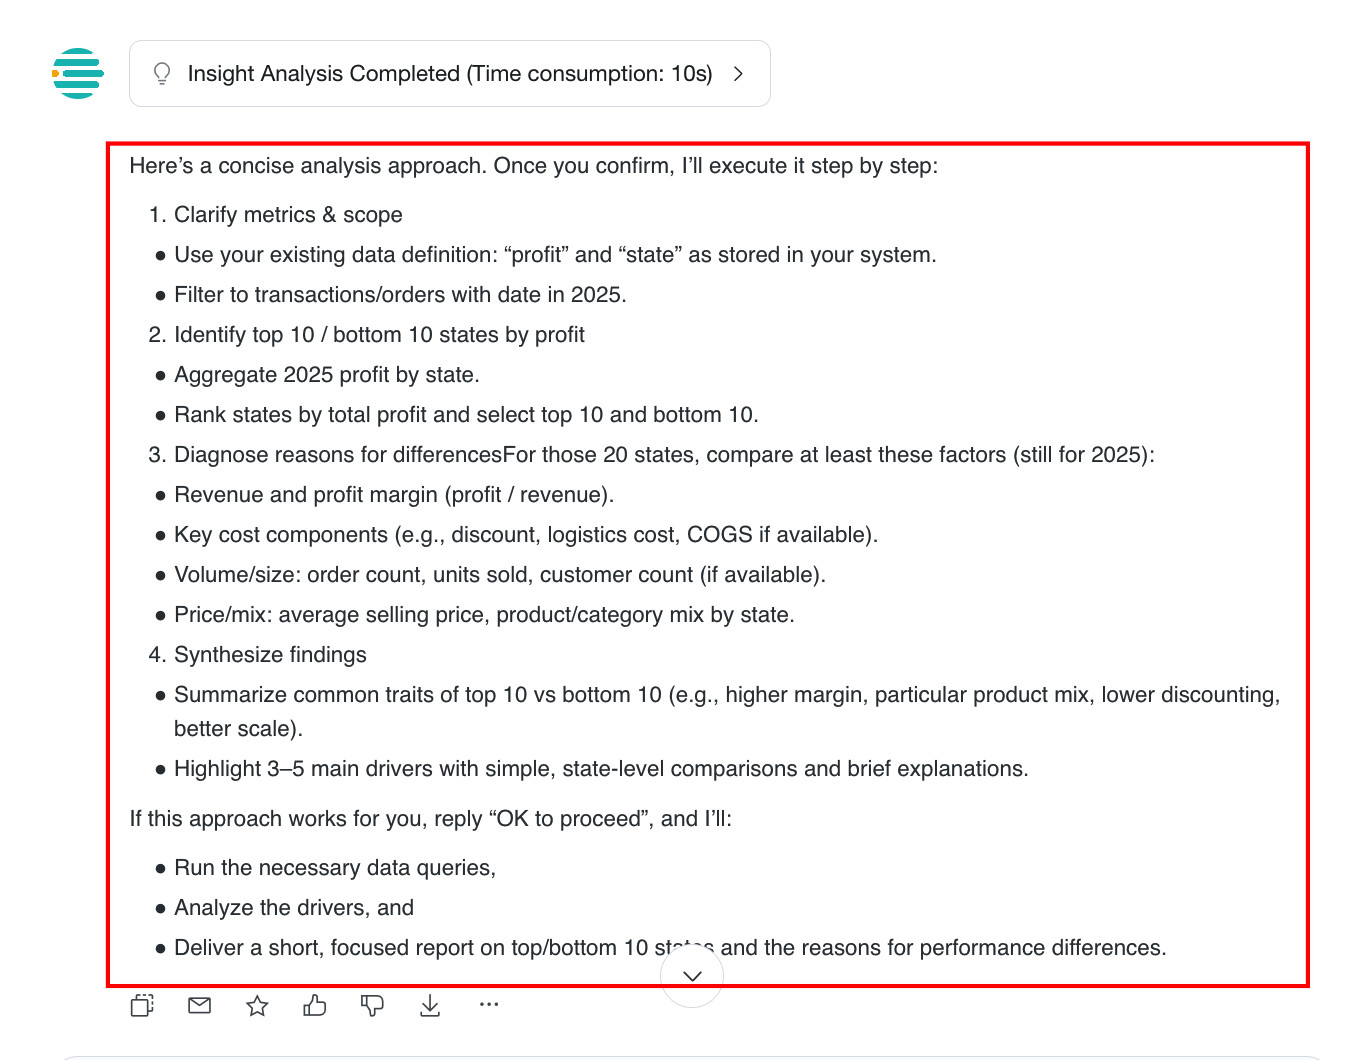
Planning Mode
Prerequisites
Planning Mode has been enabled in Agent Detail Settings > Basic Information > Feature Switch Settings.
Usage
During frontend Q&A, click Plan to enable Planning Mode.
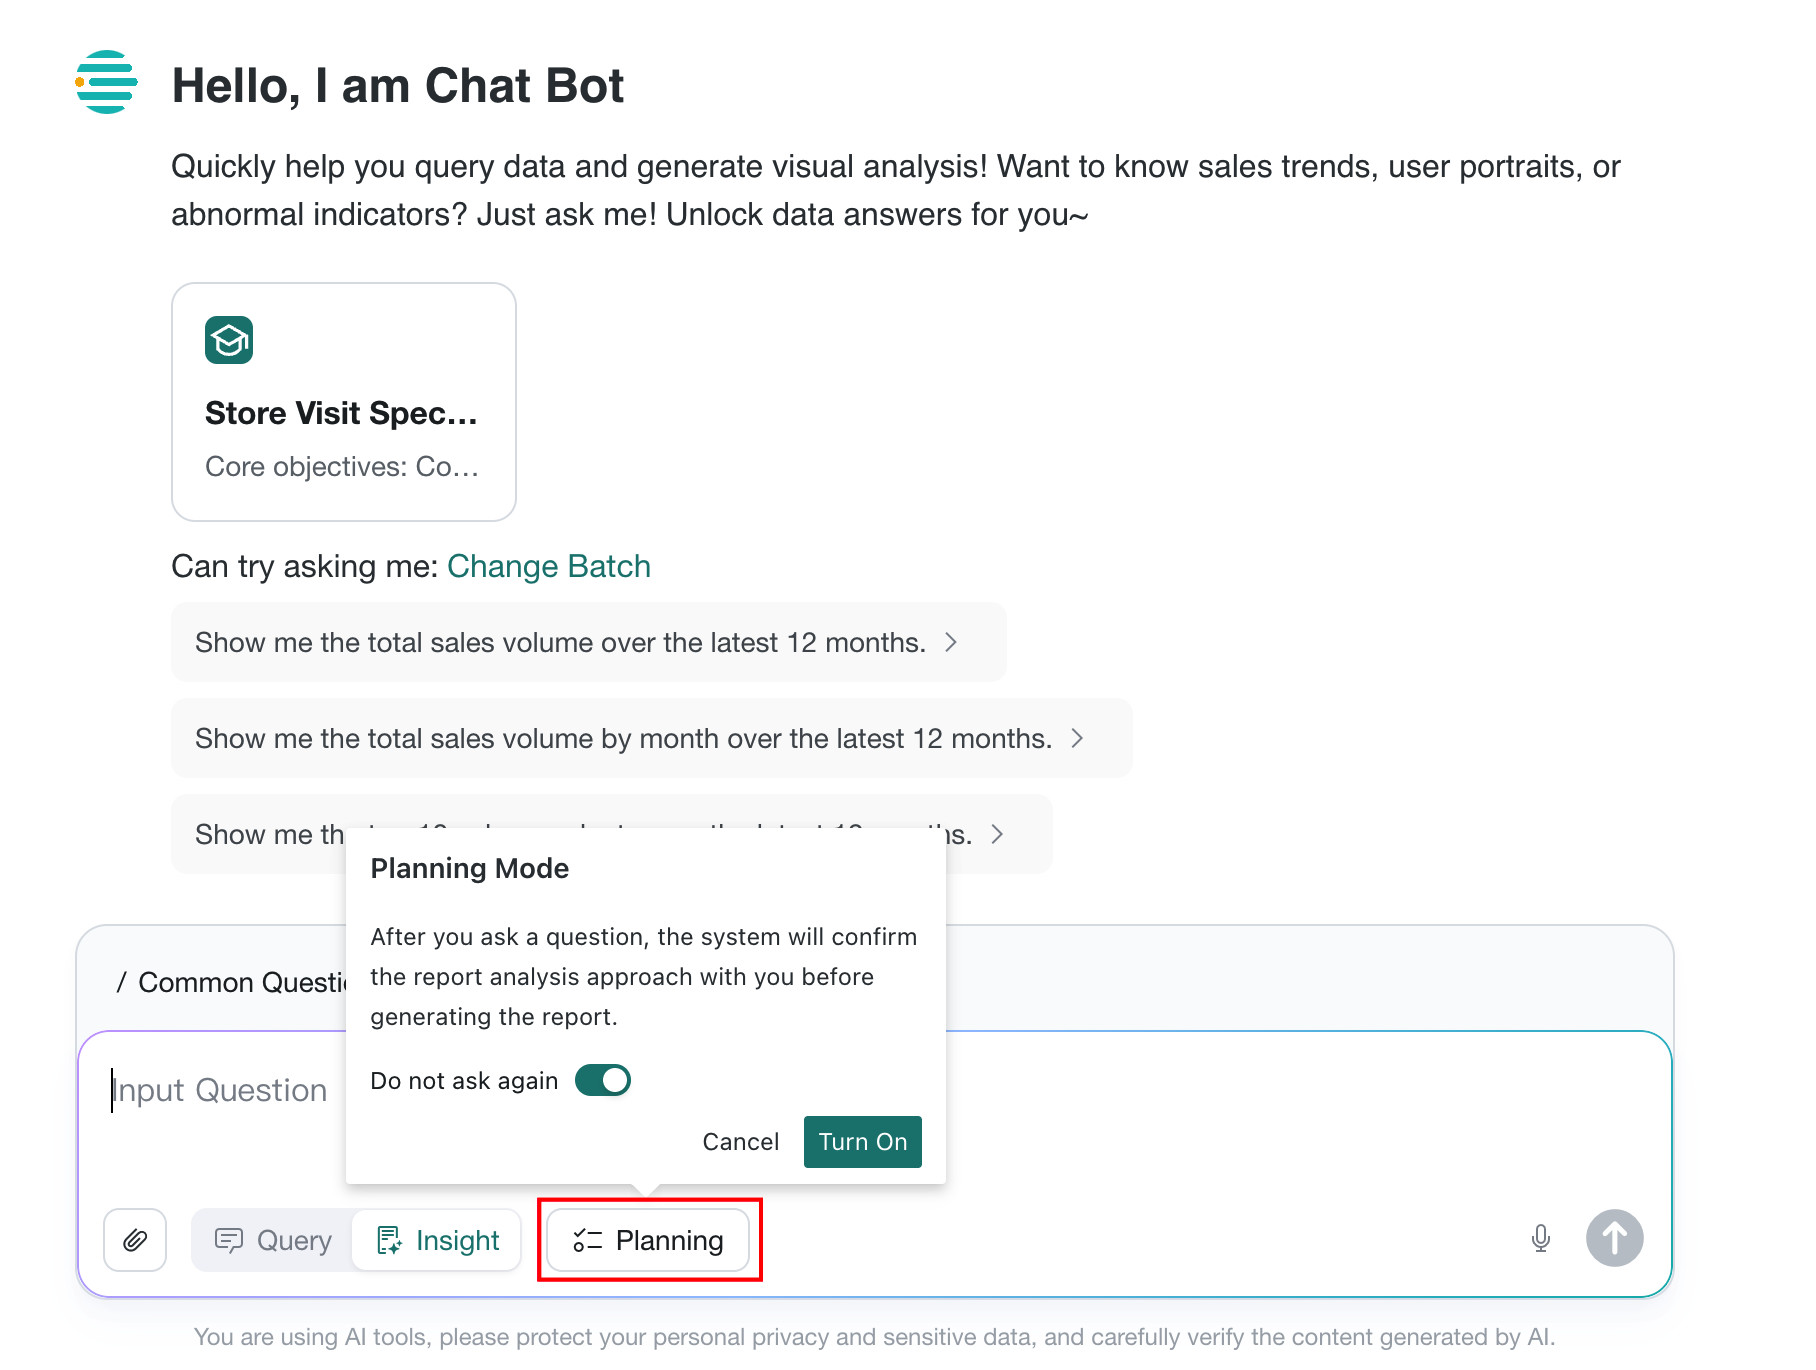
After Planning Mode is enabled, the system first confirms the analysis approach with you before generating the report.
How to Get Better Insight Analysis Results
The reasoning process of a large language model (LLM) is similar to that of a human analyst. If you want a new analyst to perform data analysis for a given agent, you still need to tell that analyst which business perspectives to consider and which metrics are required.
Therefore, before using Insight Analysis, we recommend that you first configure relevant chains of thought in the Business Knowledge Library. Using the Sales Performance scenario as an example, you can adapt the following structure based on your own business:
When a user asks about sales performance during a given time period, for example:
<How is <overall / a specific region / a specific product> performing this week / this month?><What are the sales amount / sales volume of <a specific region / product (for example, East China / Product A)> during a specific time period?>
Questions like the ones above all ask about overall or dimension-specific sales performance. If the time period is not explicitly specified, treat the current month as the default.
Use the following analytical approach step by step. Organize the full report using the pyramid principle, summarize all conclusions, and output a complete formal report in sections. During the process, do not pause to ask the user for more input or whether to continue. Complete the full analysis automatically, and do not repeat the final analytical step itself in the report.`
<What are the total sales amount, total sales volume, and average order value during the selected period for the overall scope or specified dimension? Average order value = total sales amount / total sales volume. If there is no sales data, show 0.><Show the comparison of sales amount / sales volume during the selected period for the overall scope or specified dimension against targets and historical peers, including achievement rate, year-over-year growth rate, and period-over-period growth rate, prioritizing key dimensions.><Show sales amount / sales volume and their proportions during the selected period for the overall scope or specified dimension by finer dimensions such as product, region, or channel, sorted from high to low.><Further display the detailed sales data during the selected period for the overall scope or specified dimension under each finer dimension in table form. Use limit 10 to control the displayed row count and avoid too many rows.>