Data Consumer Guide
Overview
Dashboard Agent helps Data Consumers perform deep insights on business questions through cross-dashboard Data Integration and linked analysis. It can also generate standardized professional reports to improve decision-making efficiency.
Prerequisites
Users must have both of the following permissions before they can enter the Insight Agent page and ask questions:
Readpermission for Dashboard Agent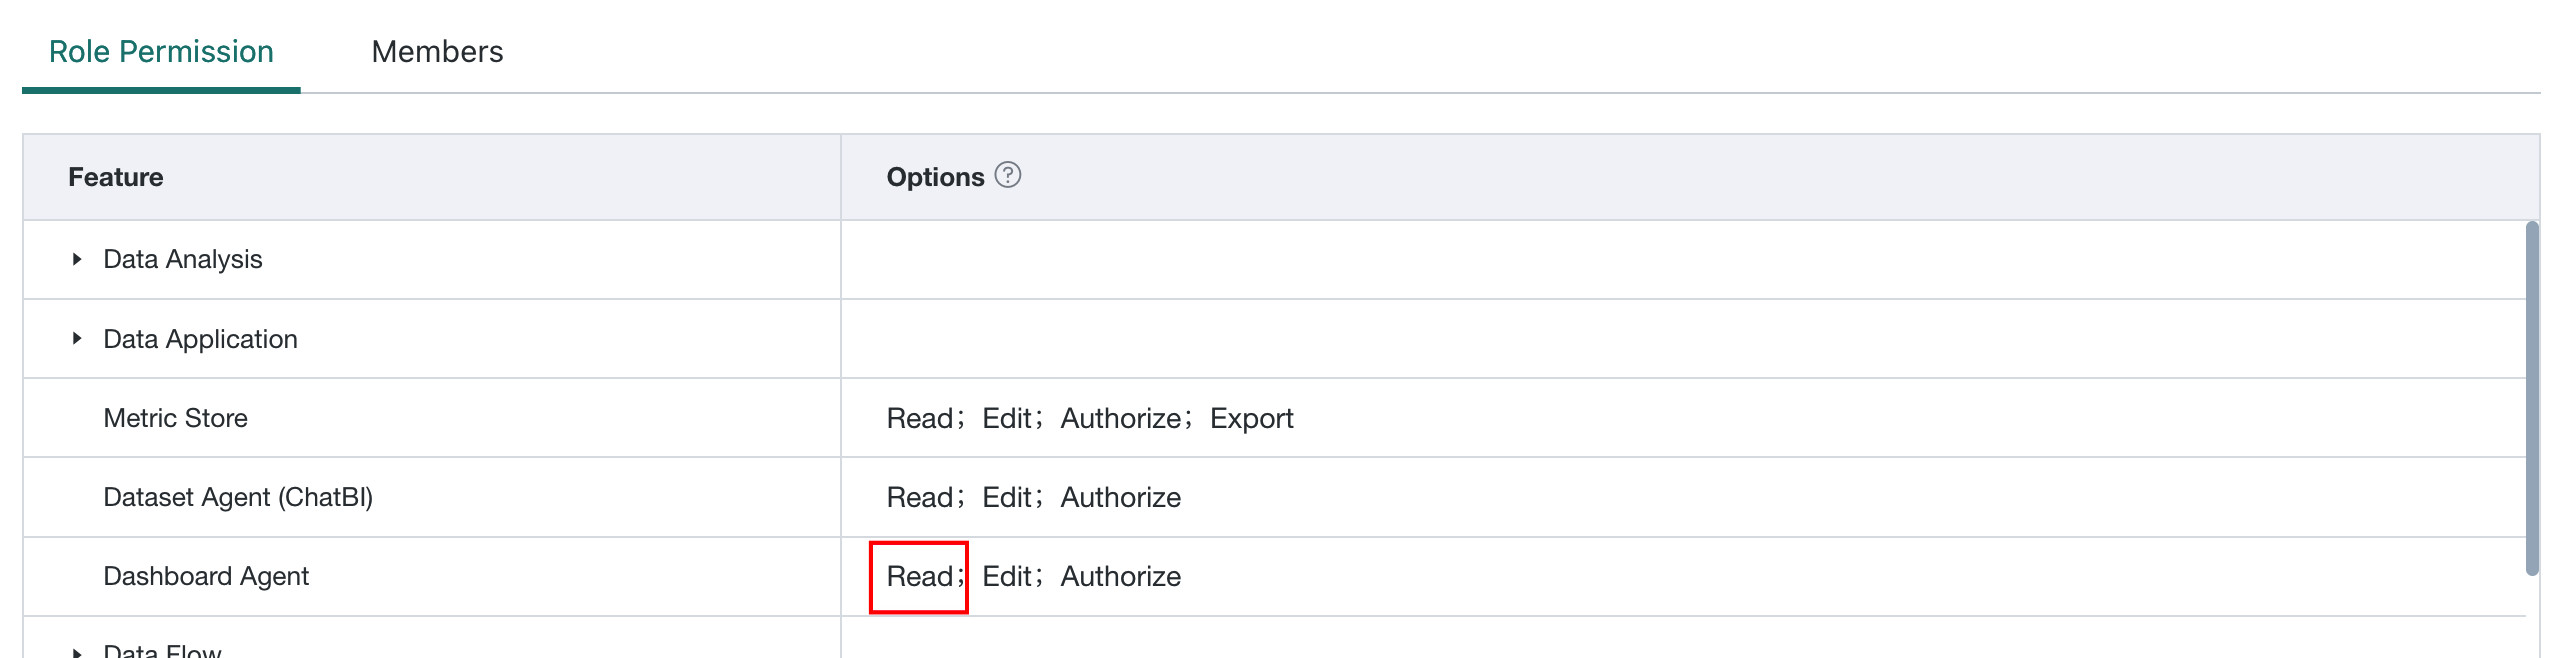
User Permissionsfor the target agent
Procedure
-
Log in to Guandata BI and go to
Data Agent > Insight Agent > Dashboard Agent. -
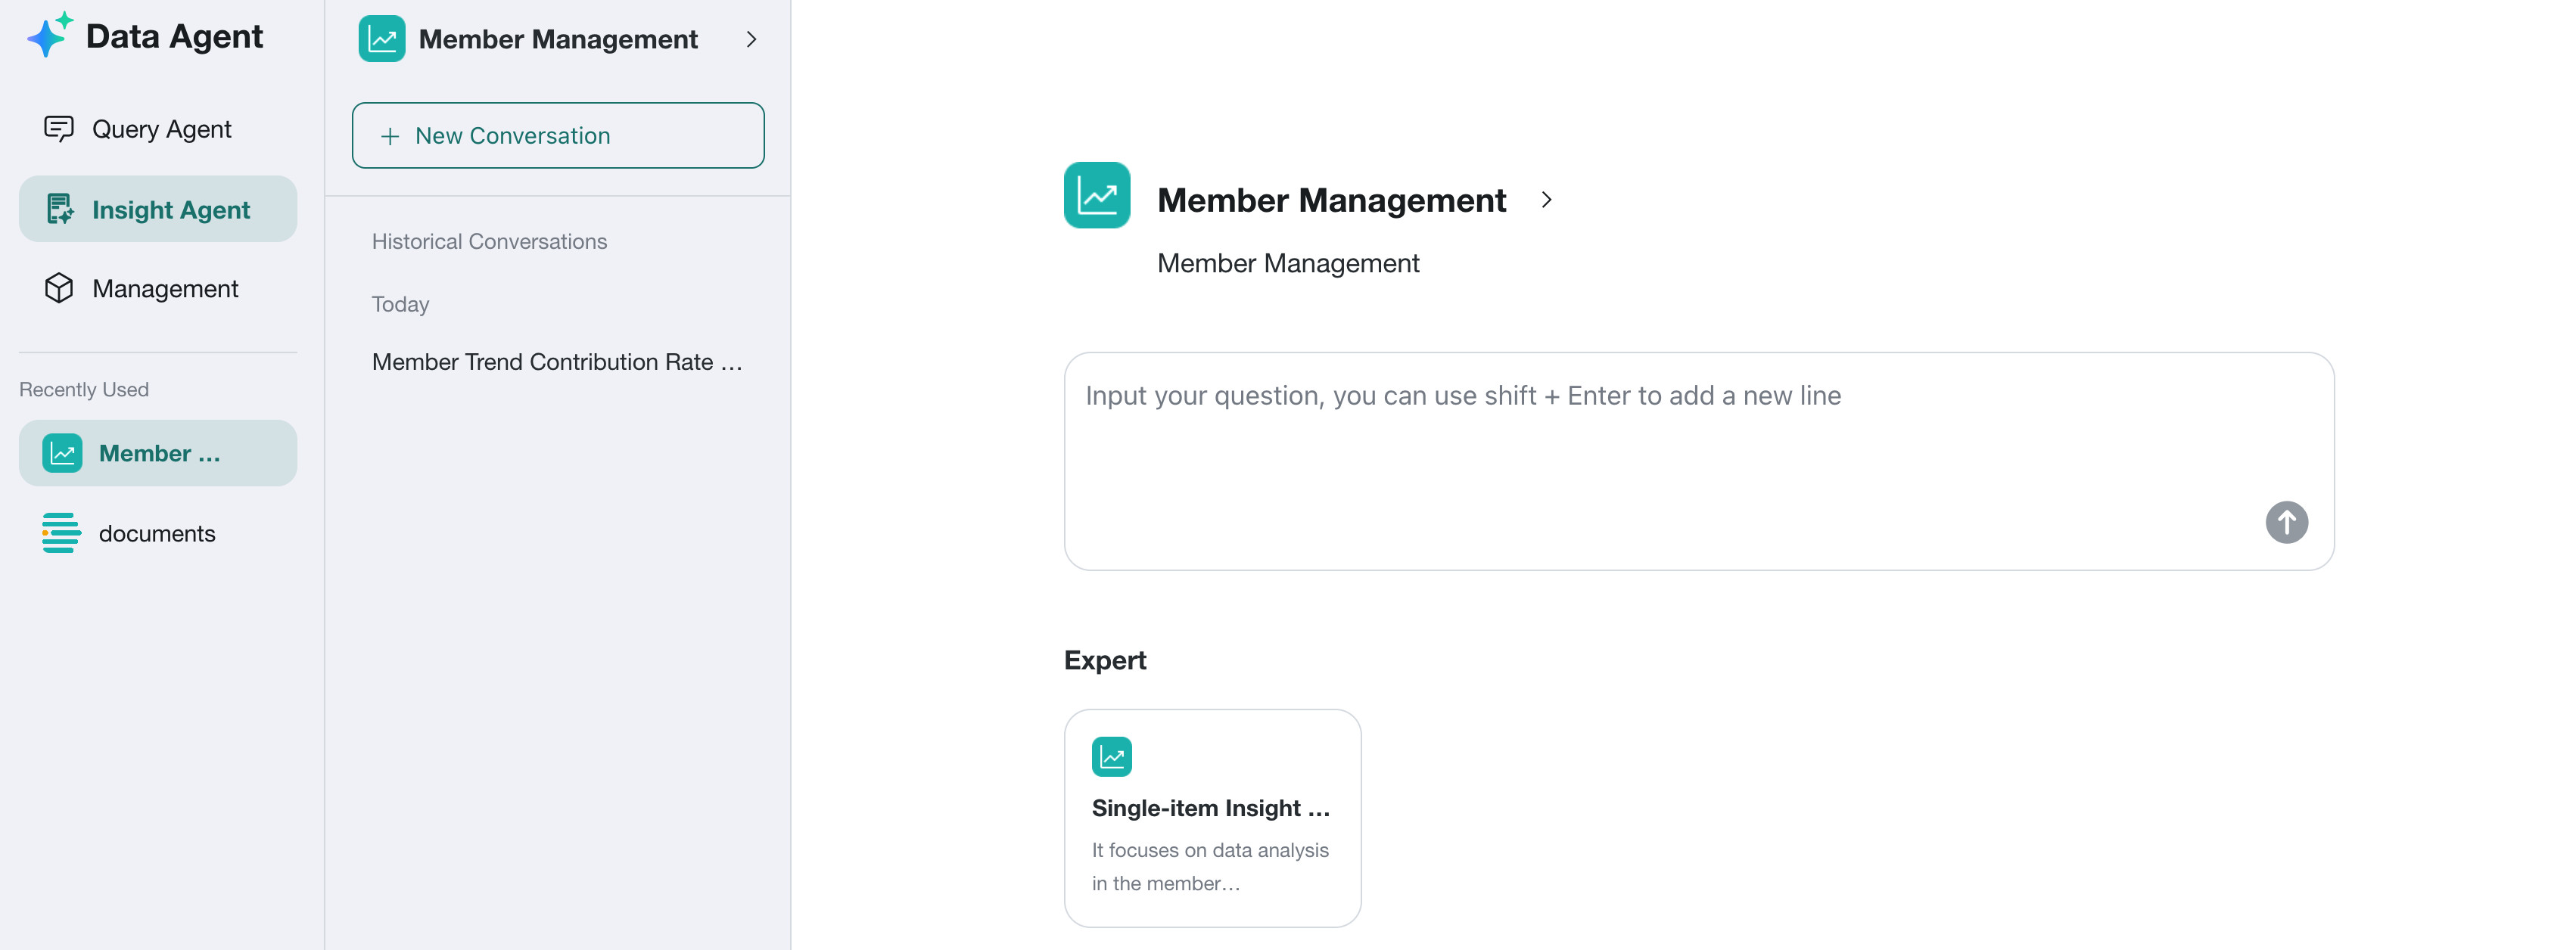
In the agent list on the right, select the agent to use for insight analysis. You can search for the target agent in the search box. Move the cursor over the agent to view its detailed description.

-
Enter a question in the dialog box and click
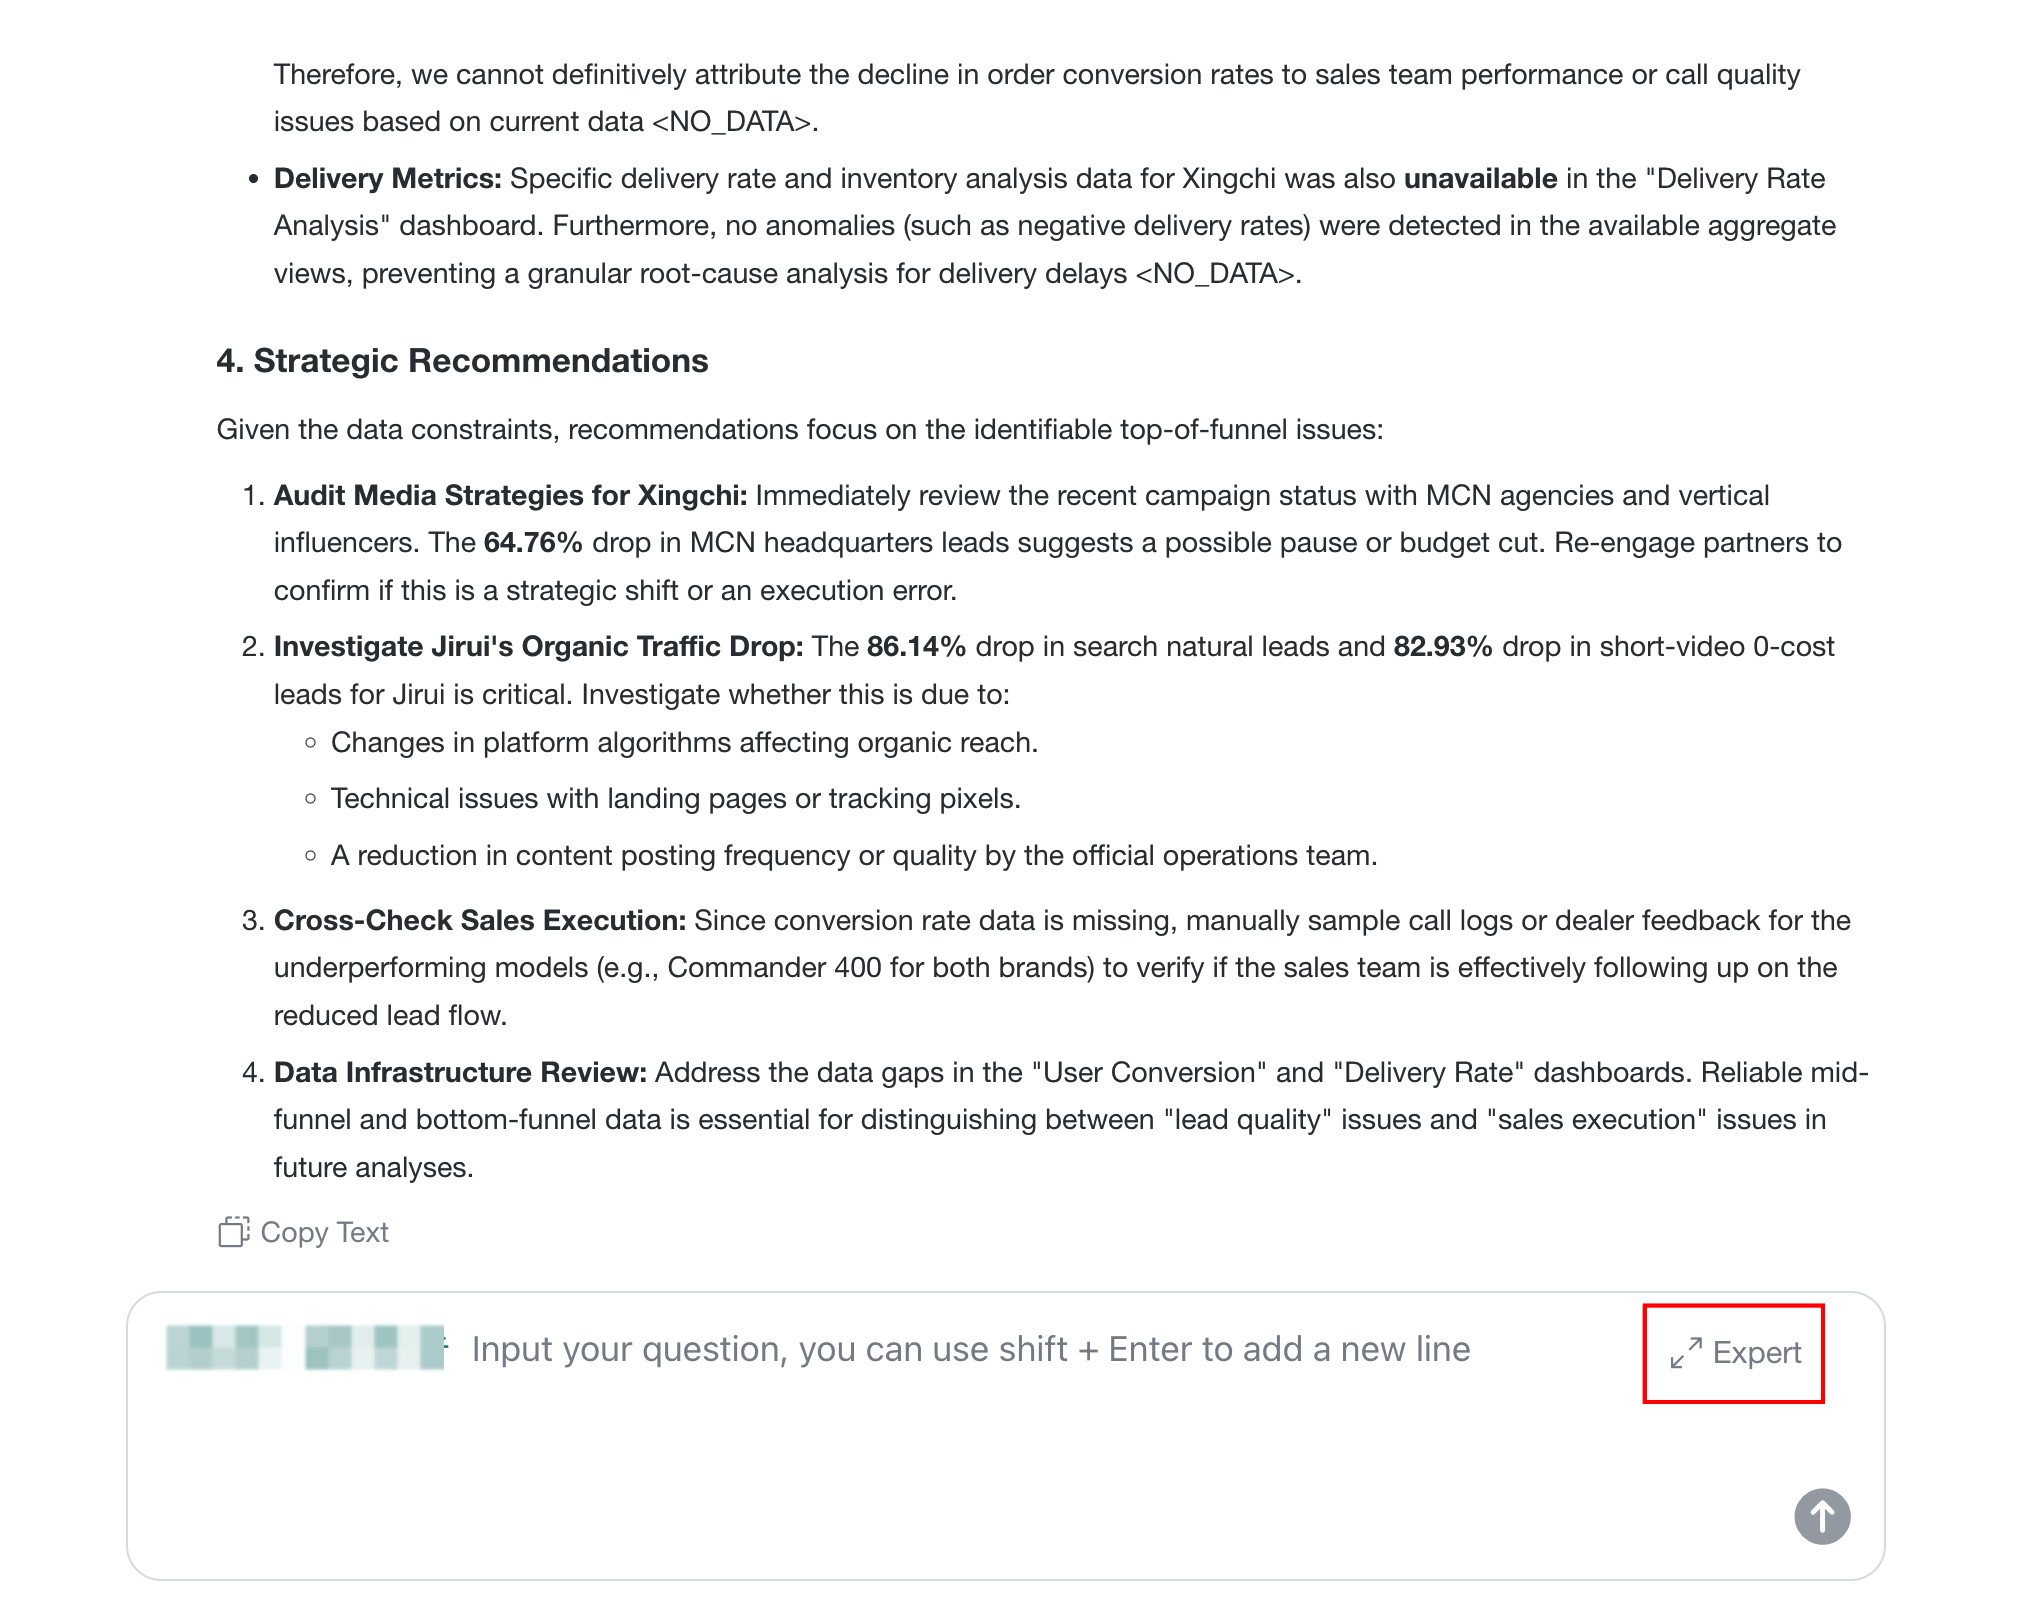
Send. The agent automatically plans the Analysis Path through Intent Recognition, performs cross-dashboard Data Integration and linked analysis, and generates a Comprehensive Answer.NoteIf the administrator has configured Expert in the backend, consumers can select an Expert as needed when asking questions.
-
View the Comprehensive Answer generated by the agent.
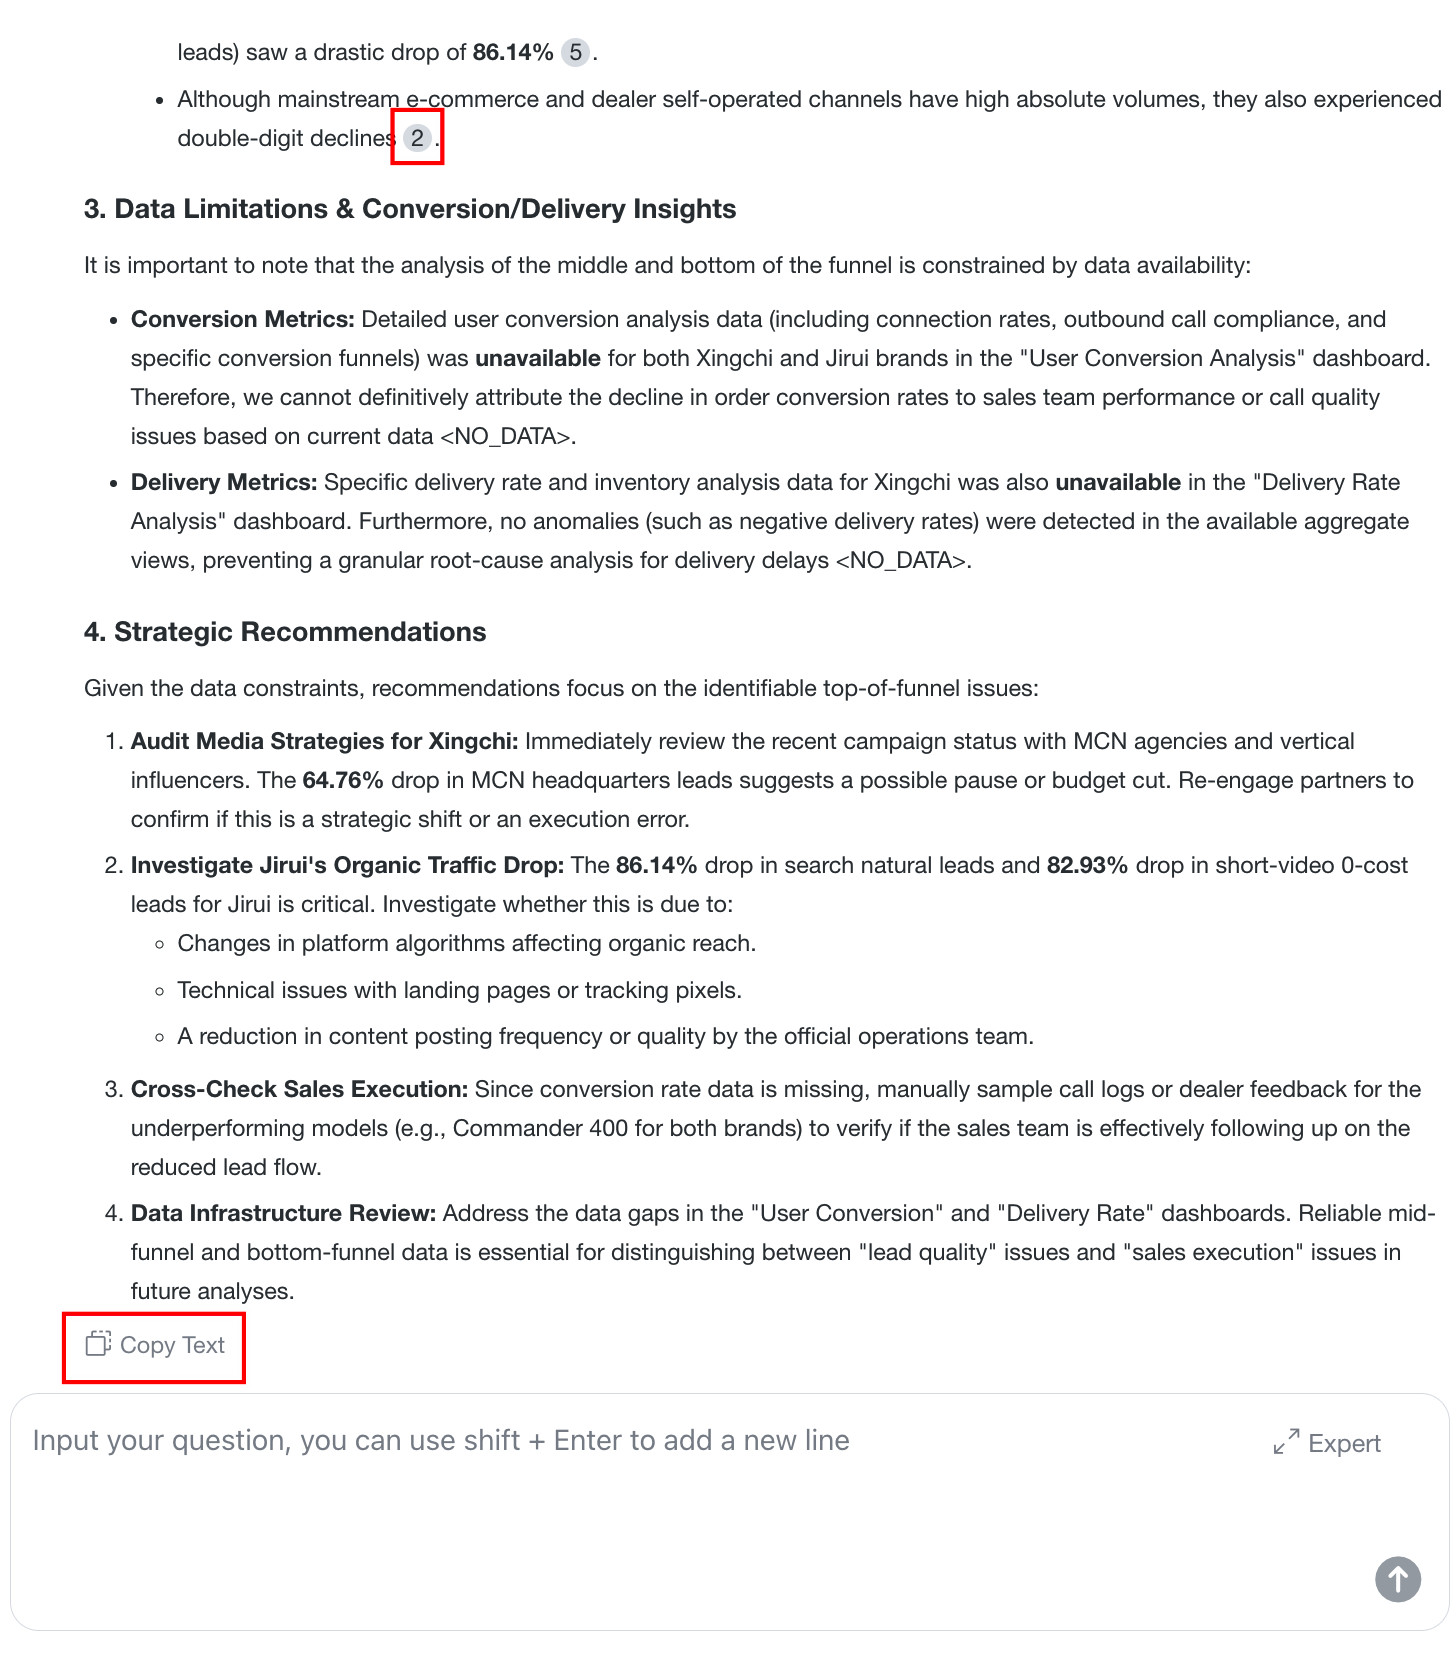
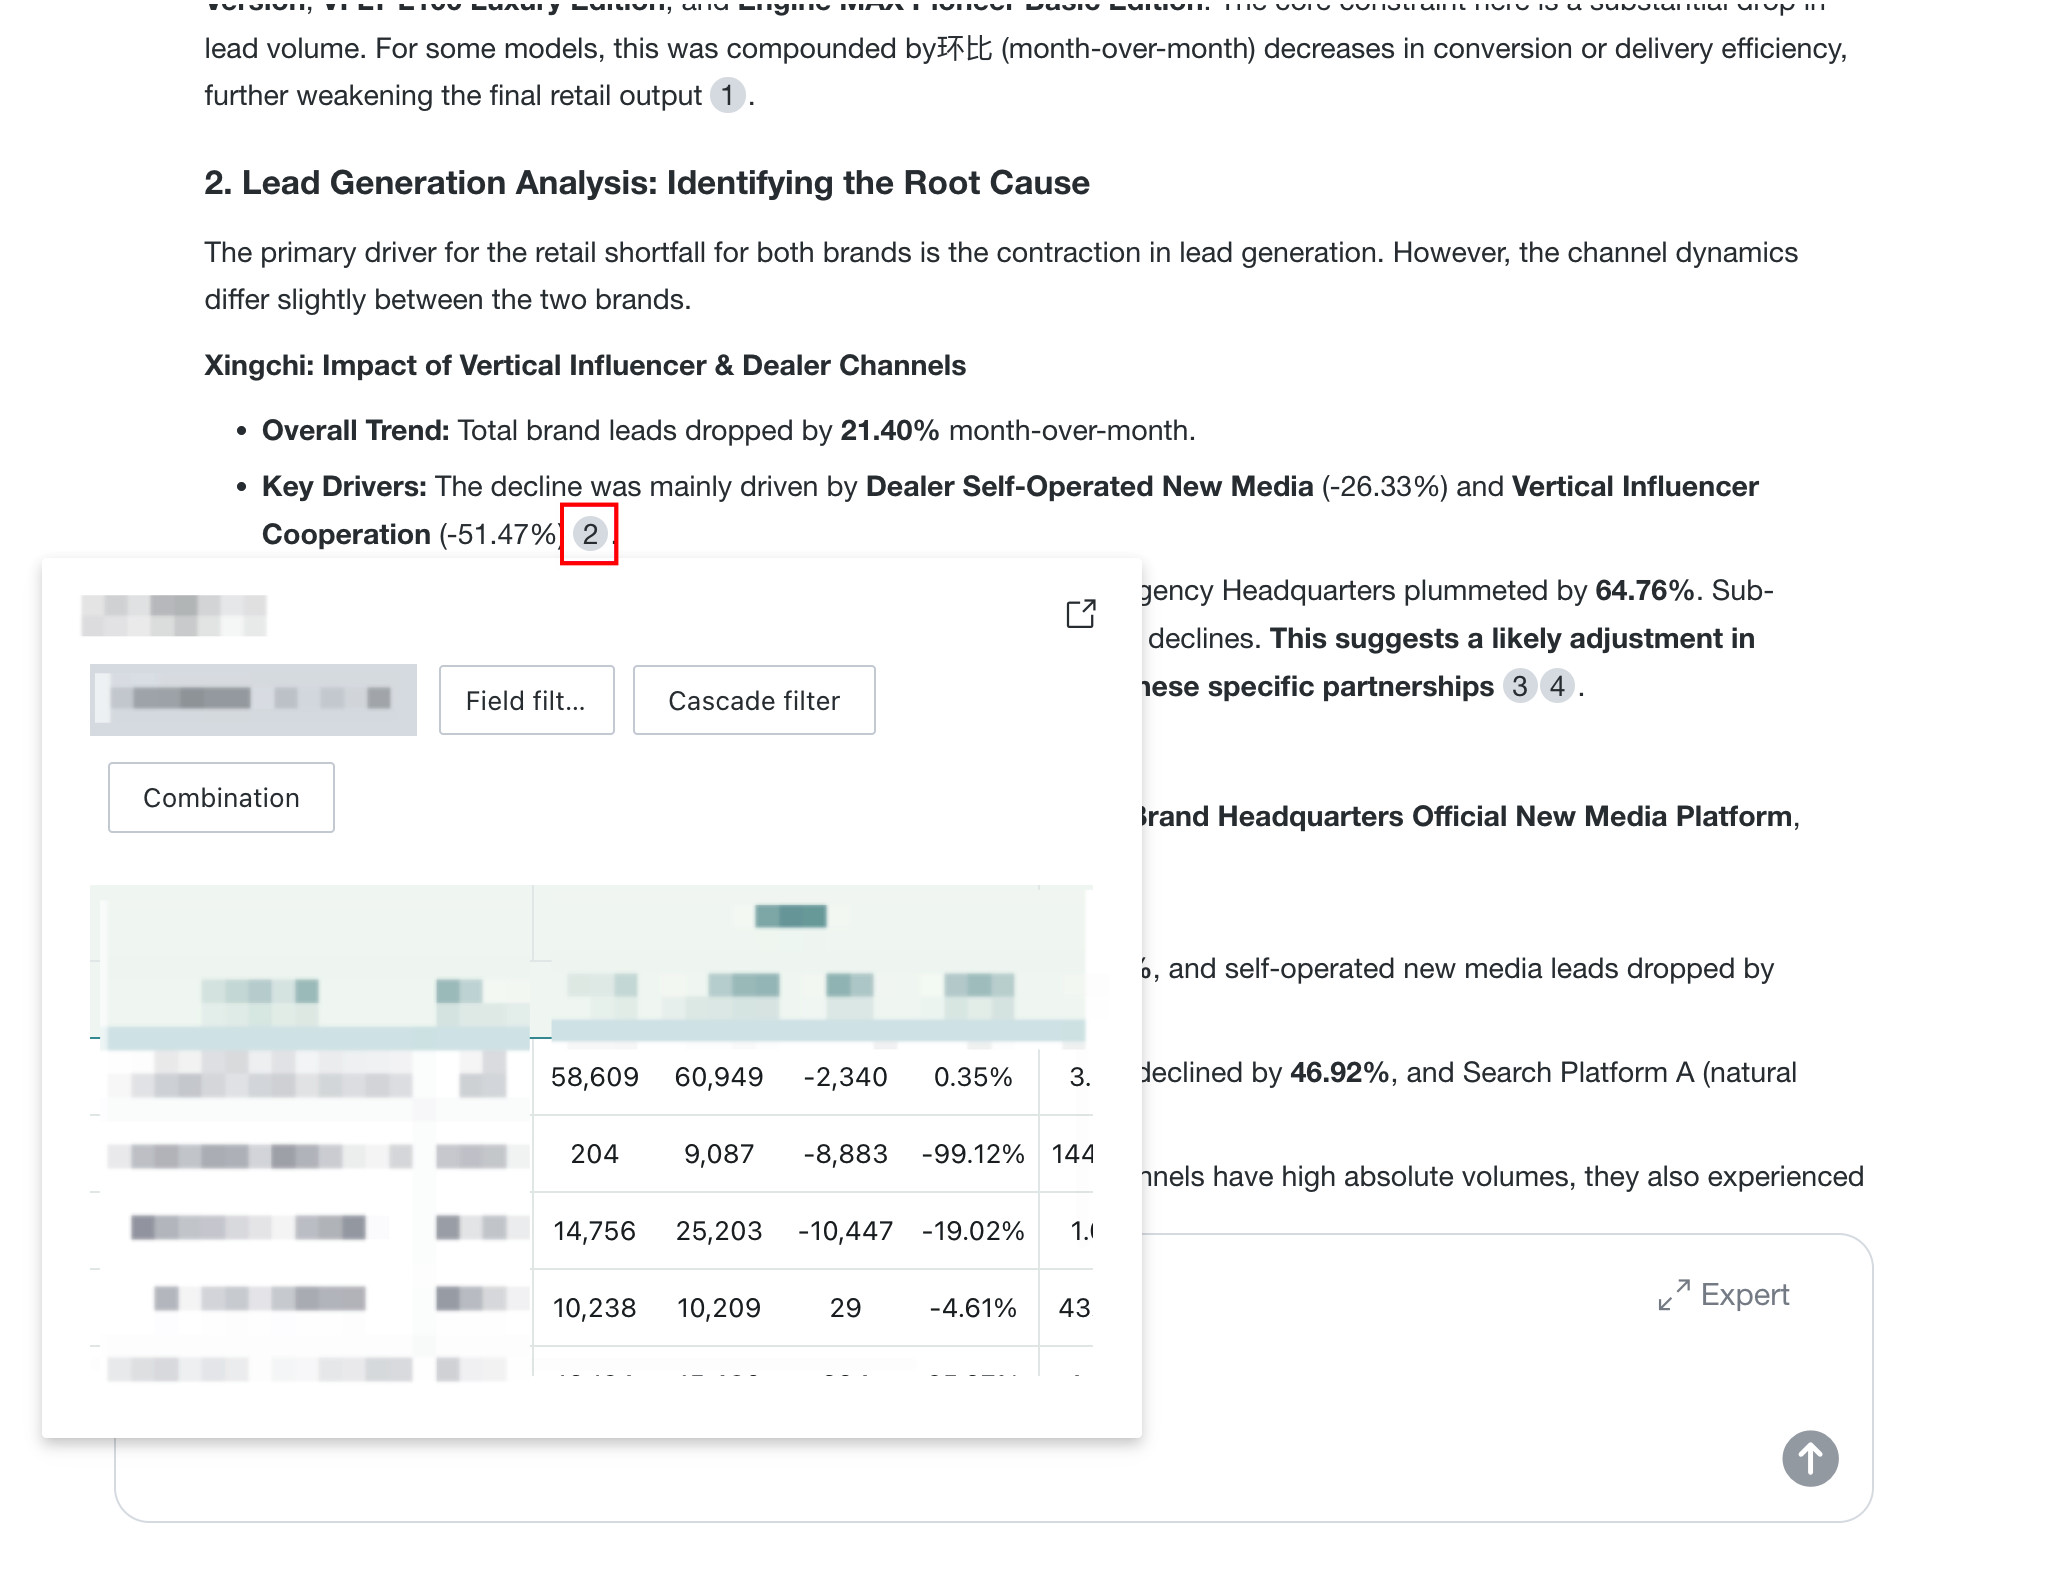
- Text type: The answer displays the referenced Visualization Cards as superscripts. Click a superscript to view the corresponding Card details. Click
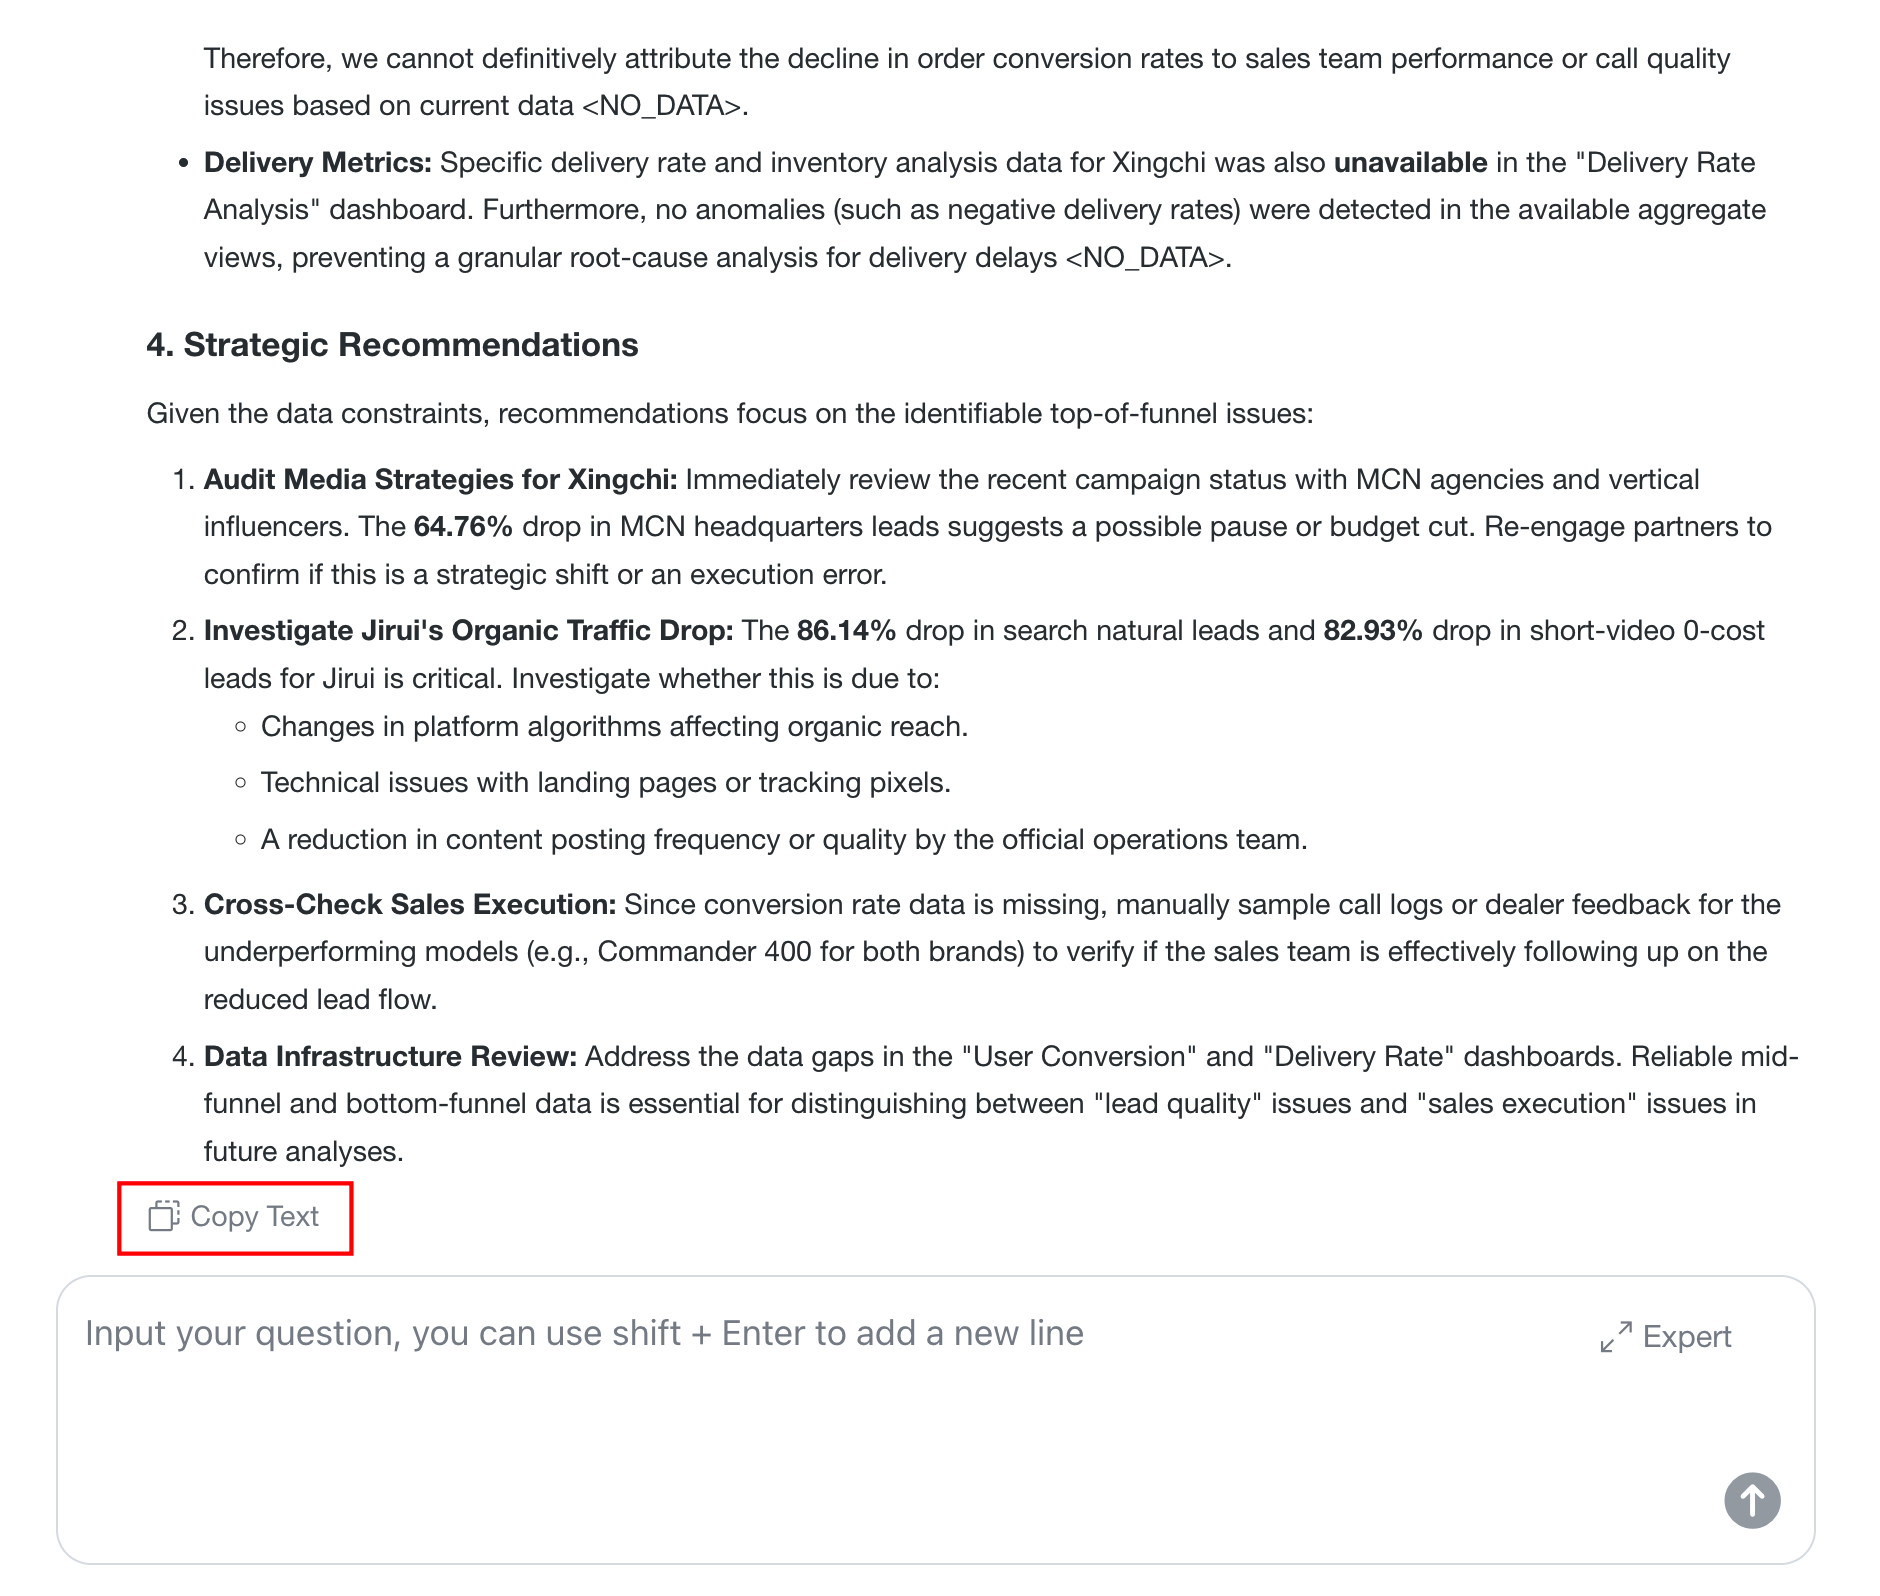
Copy Textto copy the answer with formatting retained.
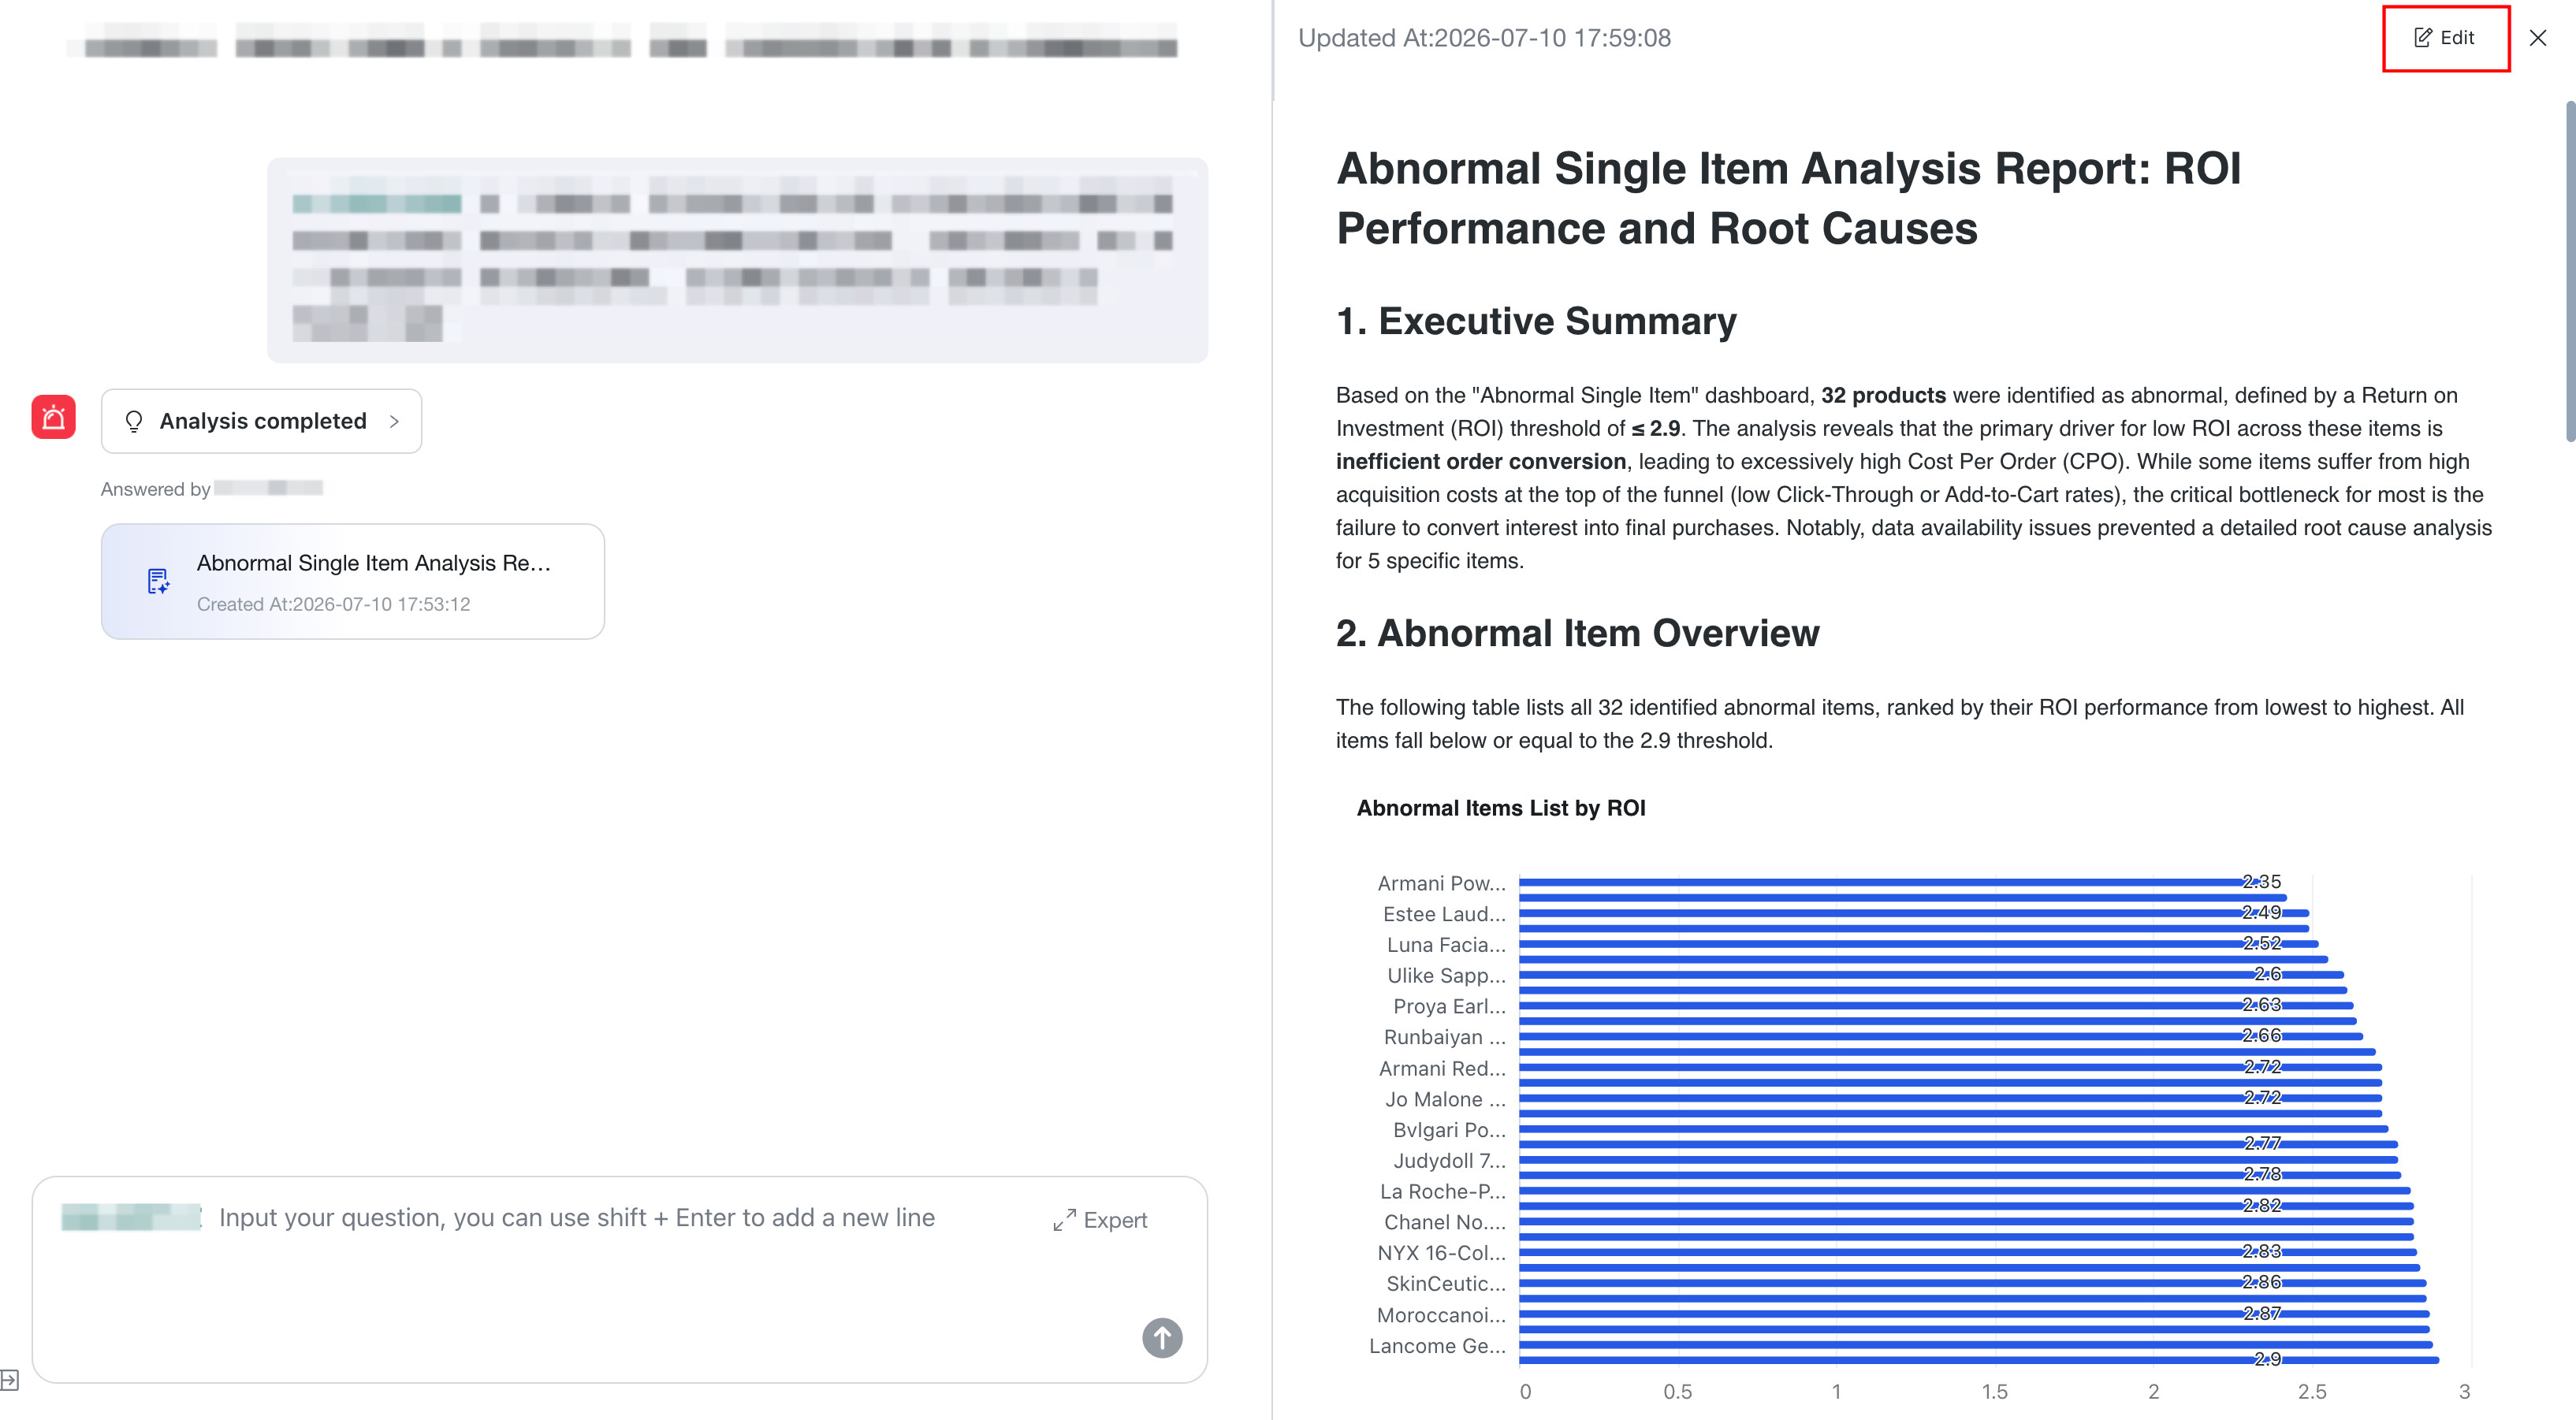
- Report type: If you select an Expert with Report Mode configured, the system automatically generates an analysis report and supports free editing of the report content.
- Text type: The answer displays the referenced Visualization Cards as superscripts. Click a superscript to view the corresponding Card details. Click
-
To explore the Insight Conclusion in greater depth, continue entering questions in the dialog box and click
Sendfor multi-turn in-depth follow-up questions. During follow-up questions, you can still select an Expert as needed or switch Experts at any time to handle flexible, open-ended question paths.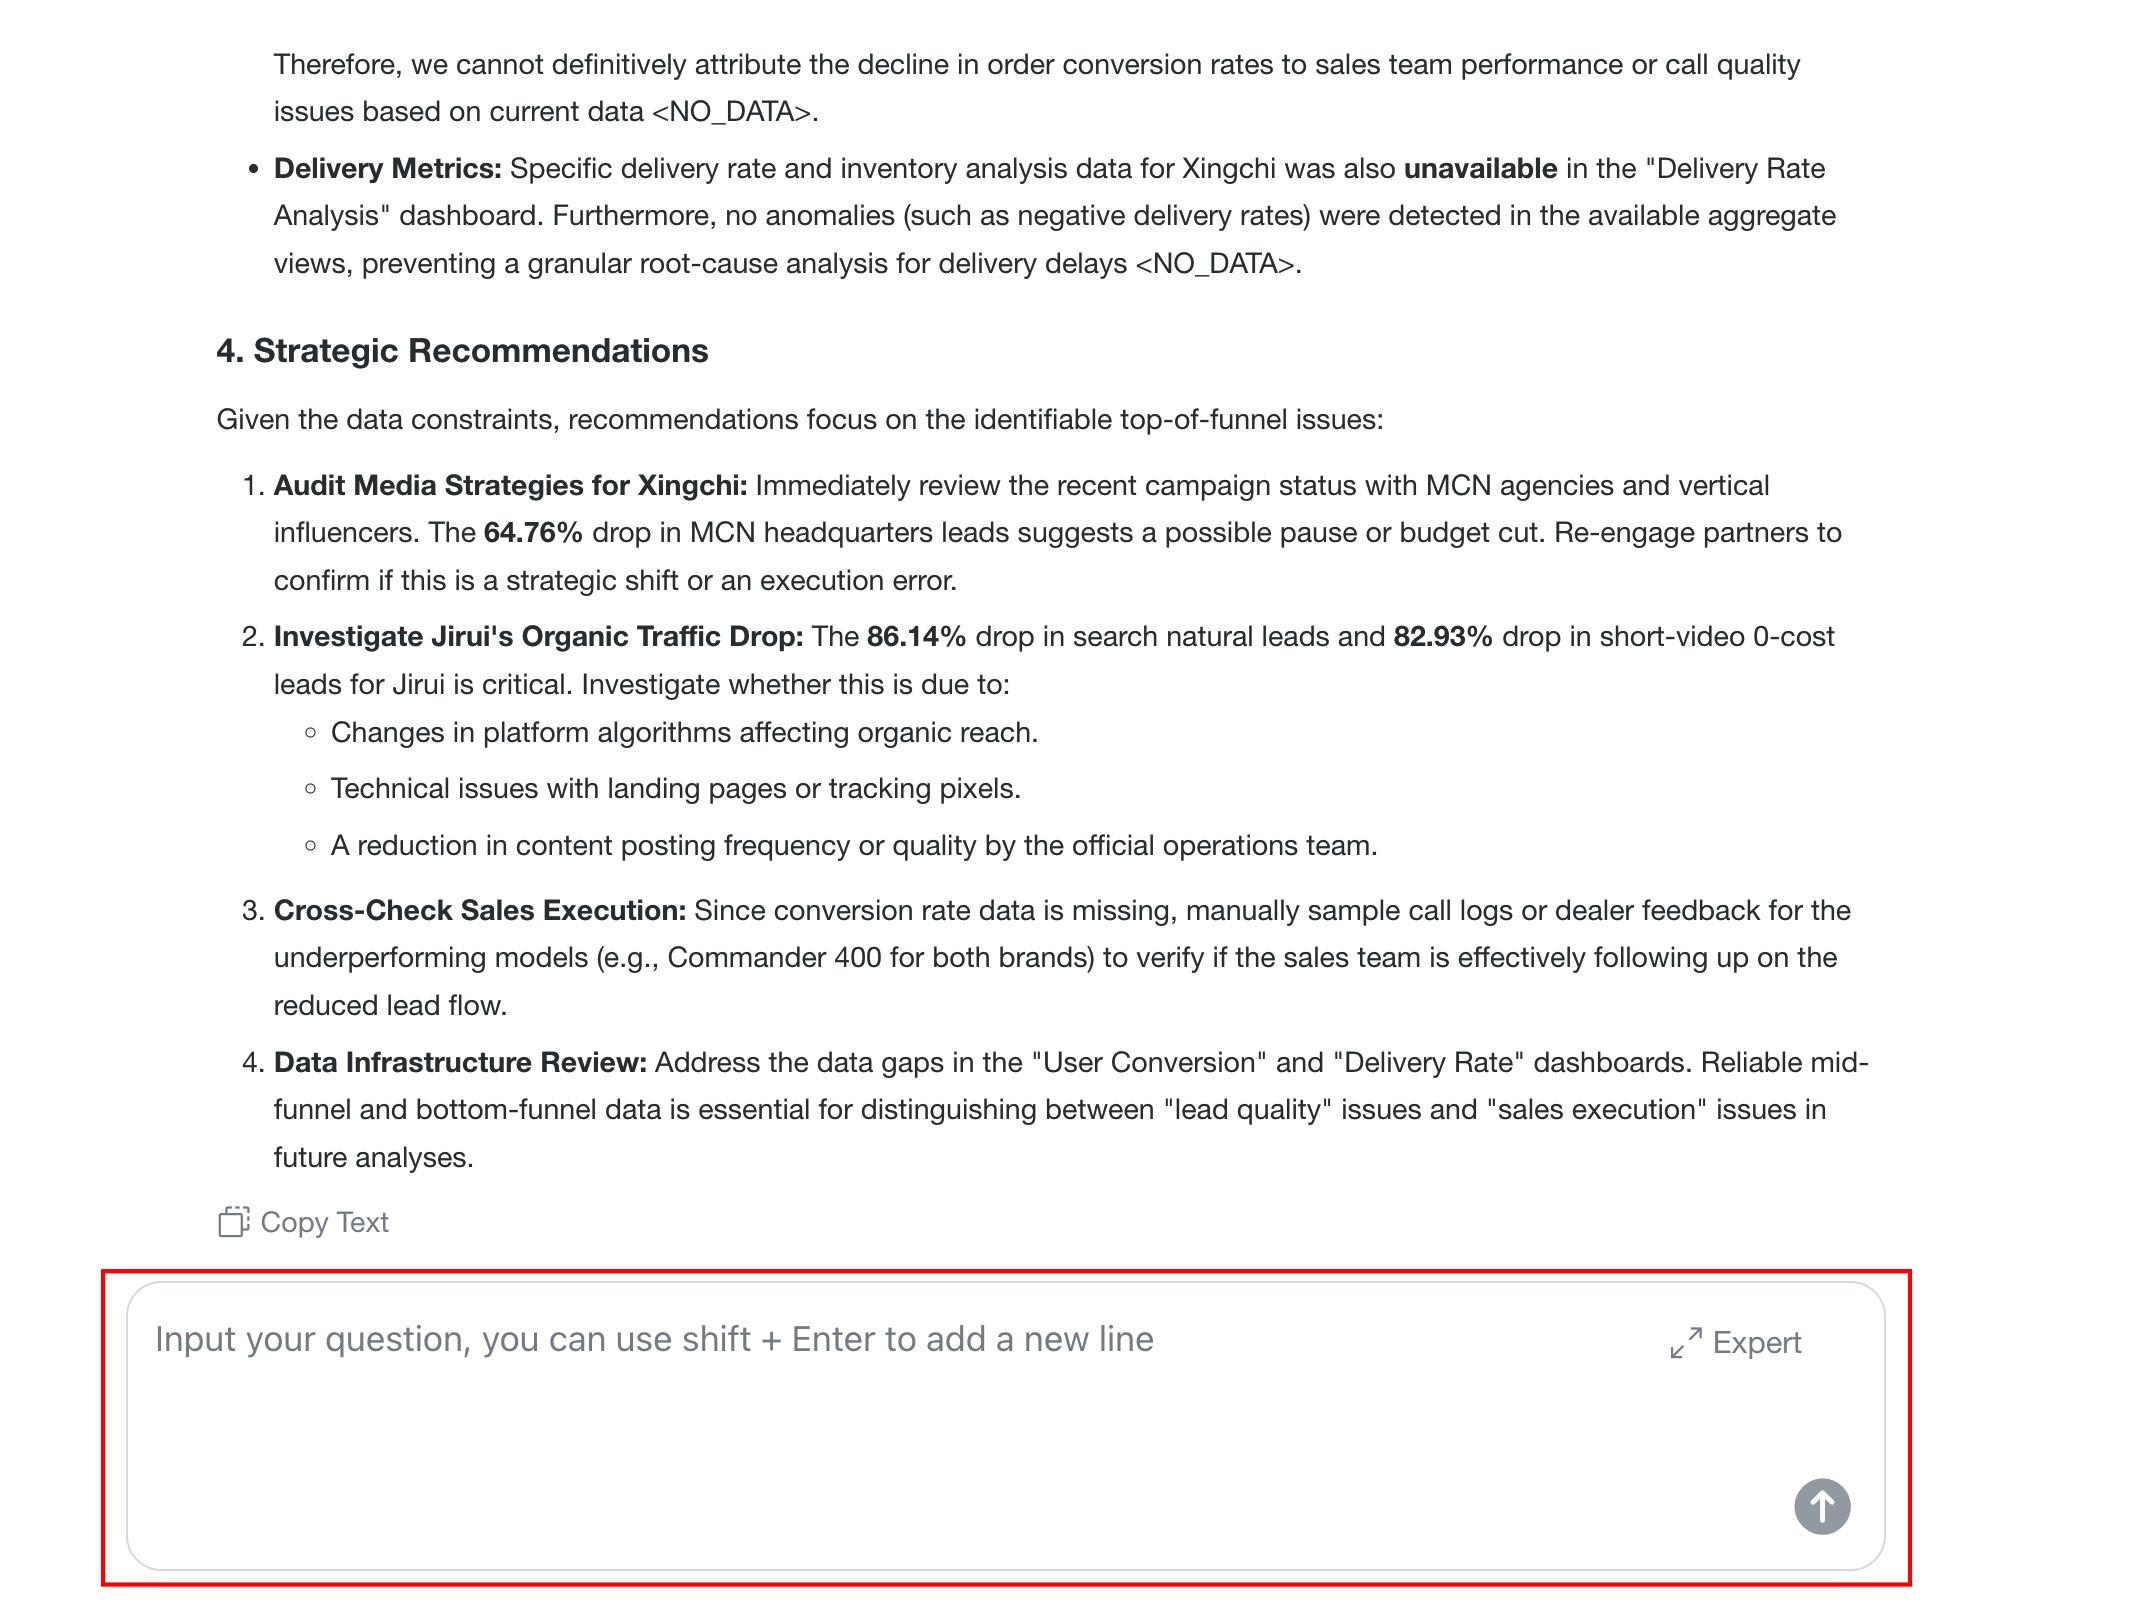
Feature Introduction
View Agent
Click an agent to enter the agent details page. The page shows the agent profile and Dialog History. The profile includes the name, description, and Data Scope.
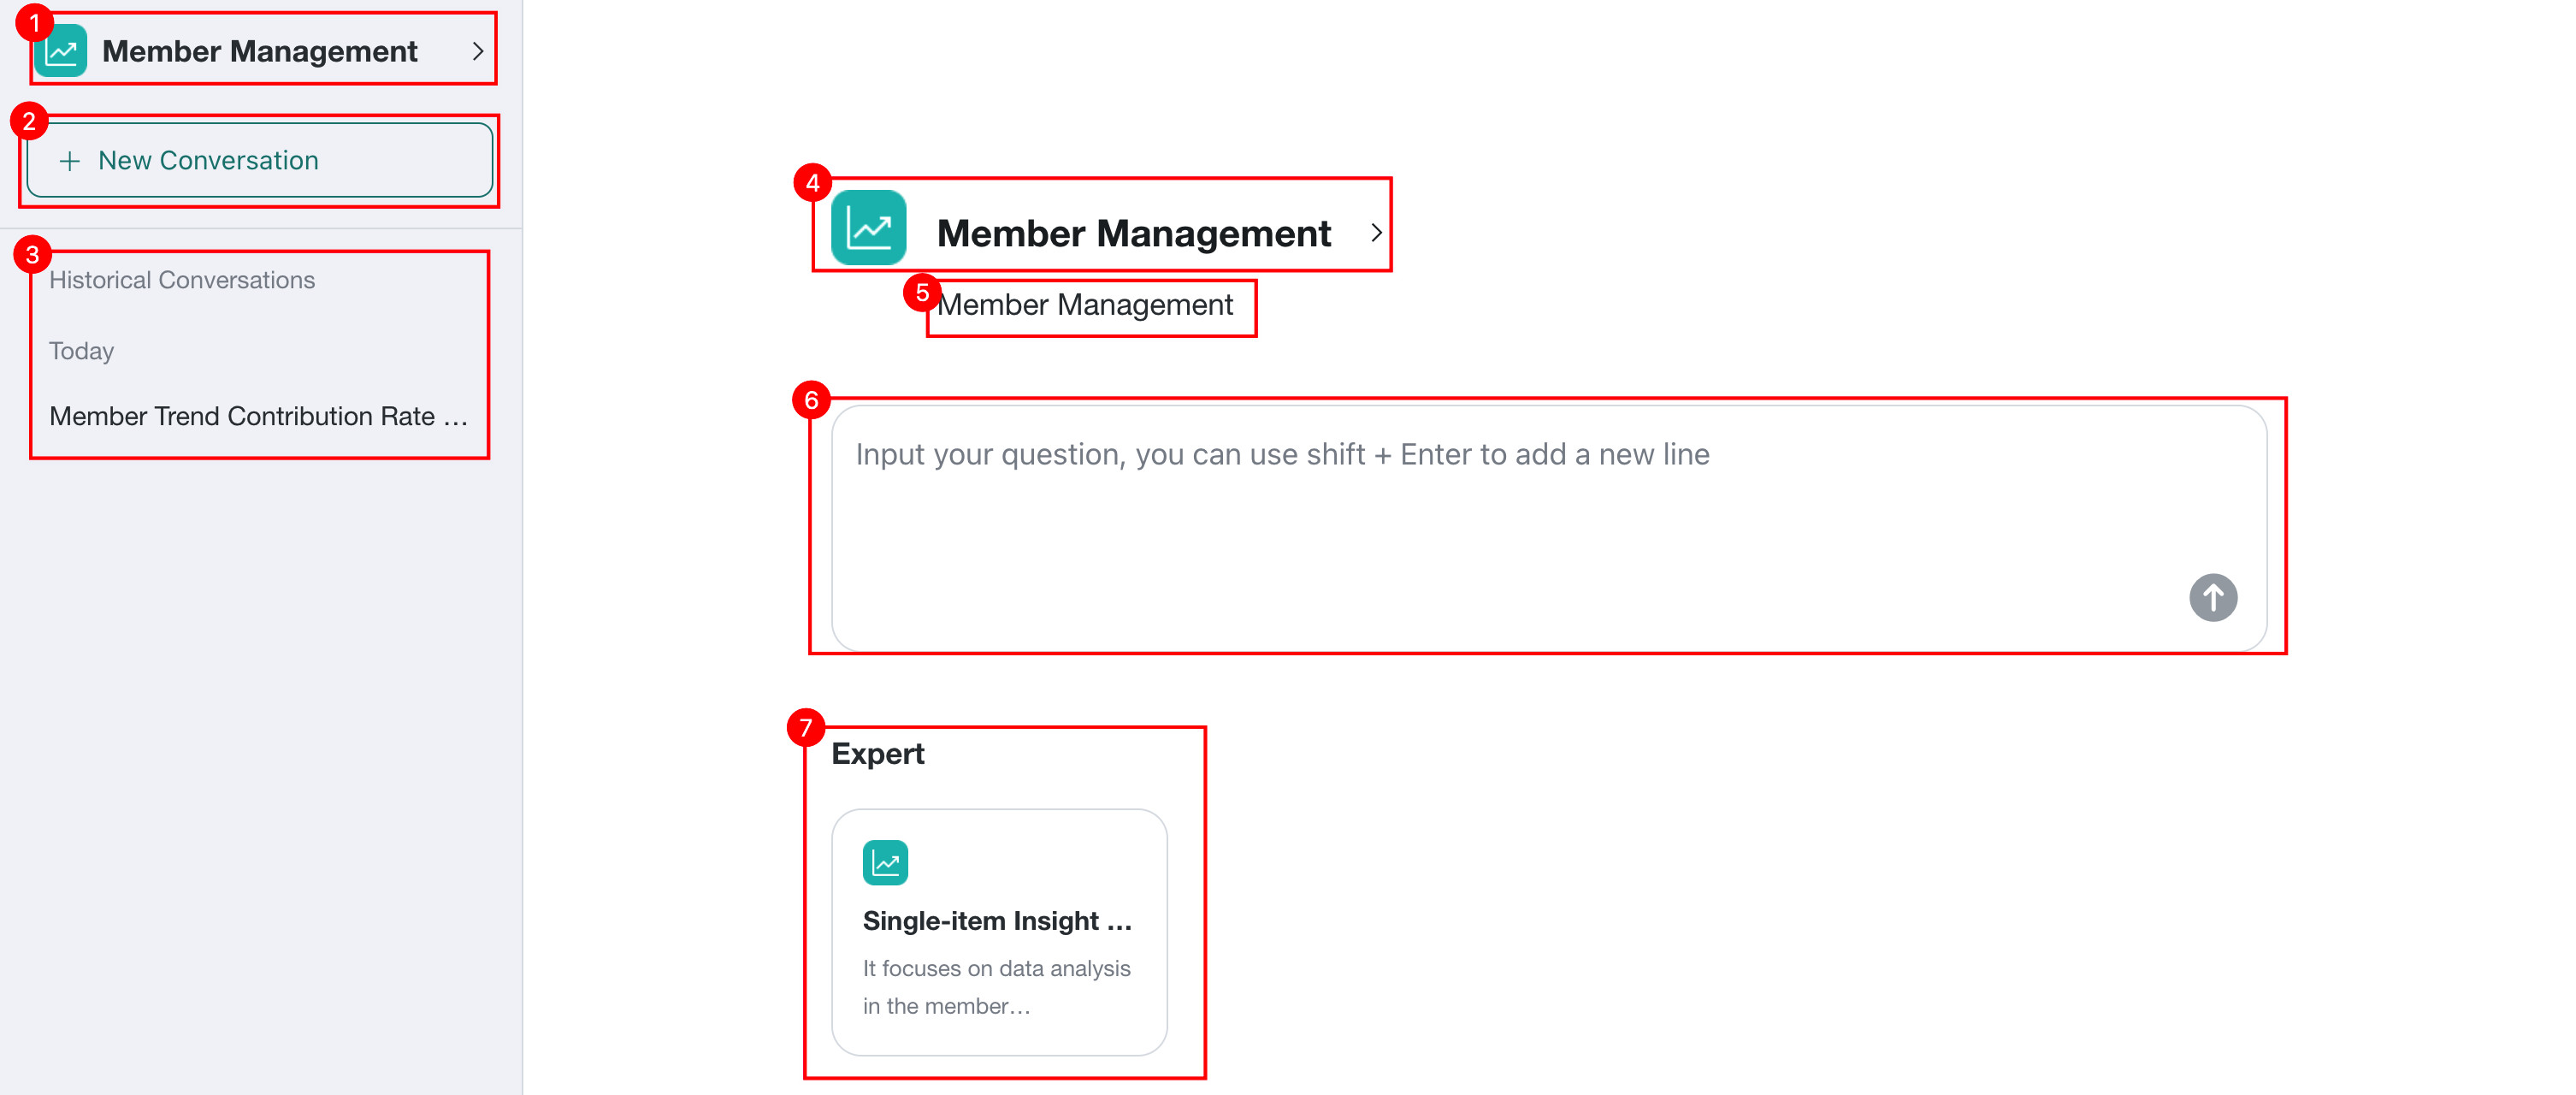
| No. | Configuration Item | Description |
|---|---|---|
| 1 | Agent list | Displays the Dashboard Agent currently in use. Hover over it to open the switch agent pop-up. You can search for agents by keyword.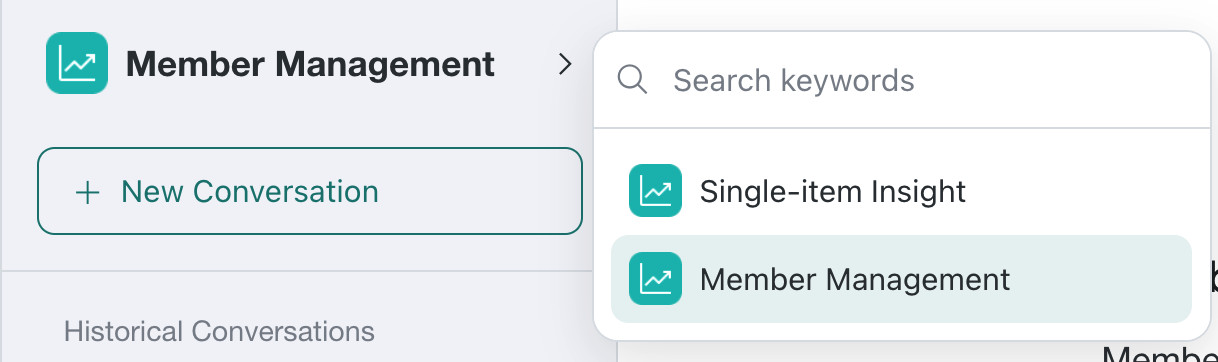 |
| 2 | New conversation | Click to create a new conversation. |
| 3 | Dialog History | Displays the current agent's Dialog History grouped by time. Click a conversation to quickly review it. |
| 4 | Agent name | Displays the name of the selected agent. Click it to view the agent name, description, and Data Scope.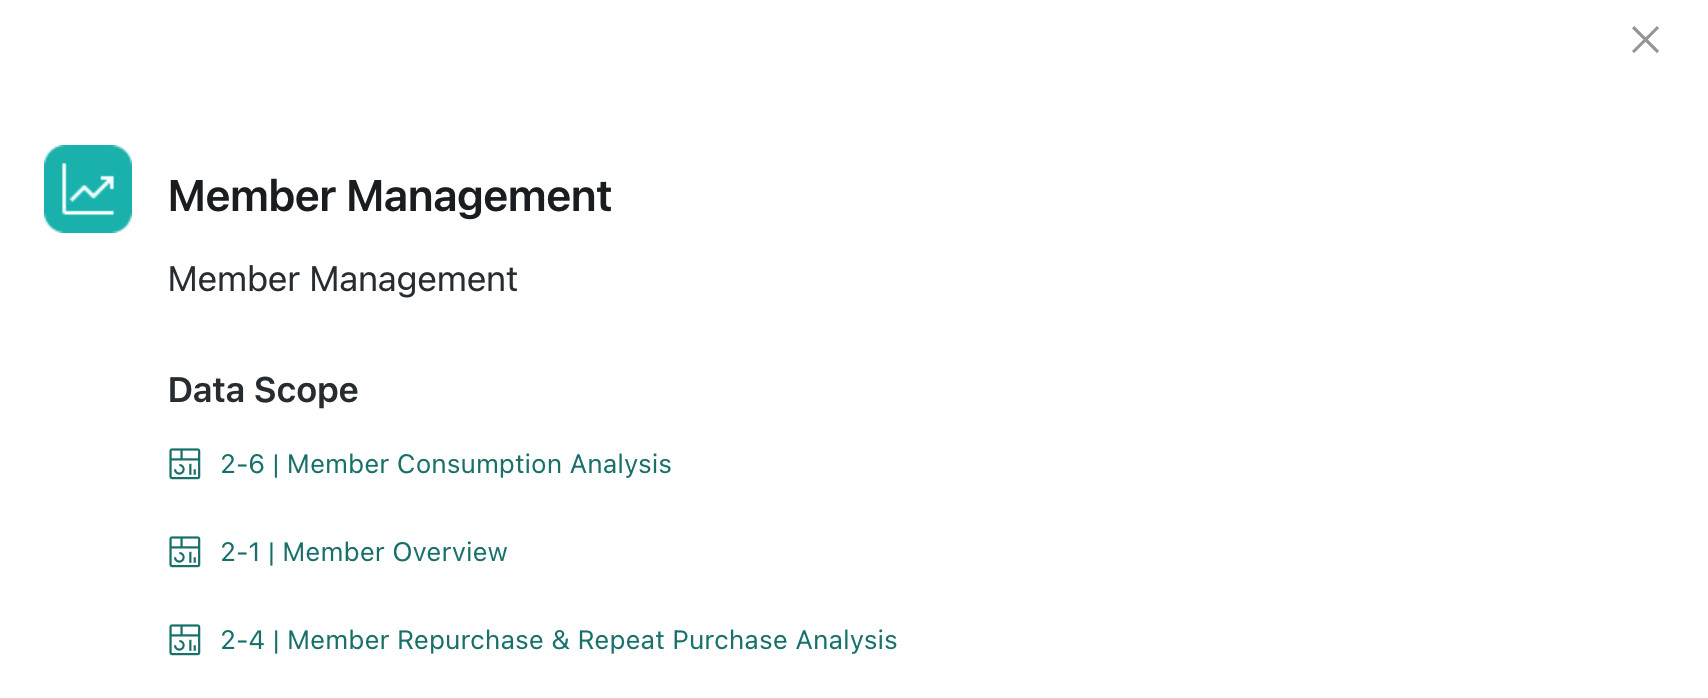 |
| 5 | Agent description | Displays the description of the current agent. |
| 6 | Dialog box | Enter your question here. Press Shift + Enter to insert a line break, then click Send after entering the question. |
| 7 | Expert | Displays the Experts configured for the current agent. Select one to generate a report according to that Expert's predefined Analysis Path. |
View Recommended Questions
Prerequisites
Recommended Questions must be configured in Agent Details Configuration > Basic Information.
Usage Instructions
When users start a new conversation, question recommendations are provided by default.
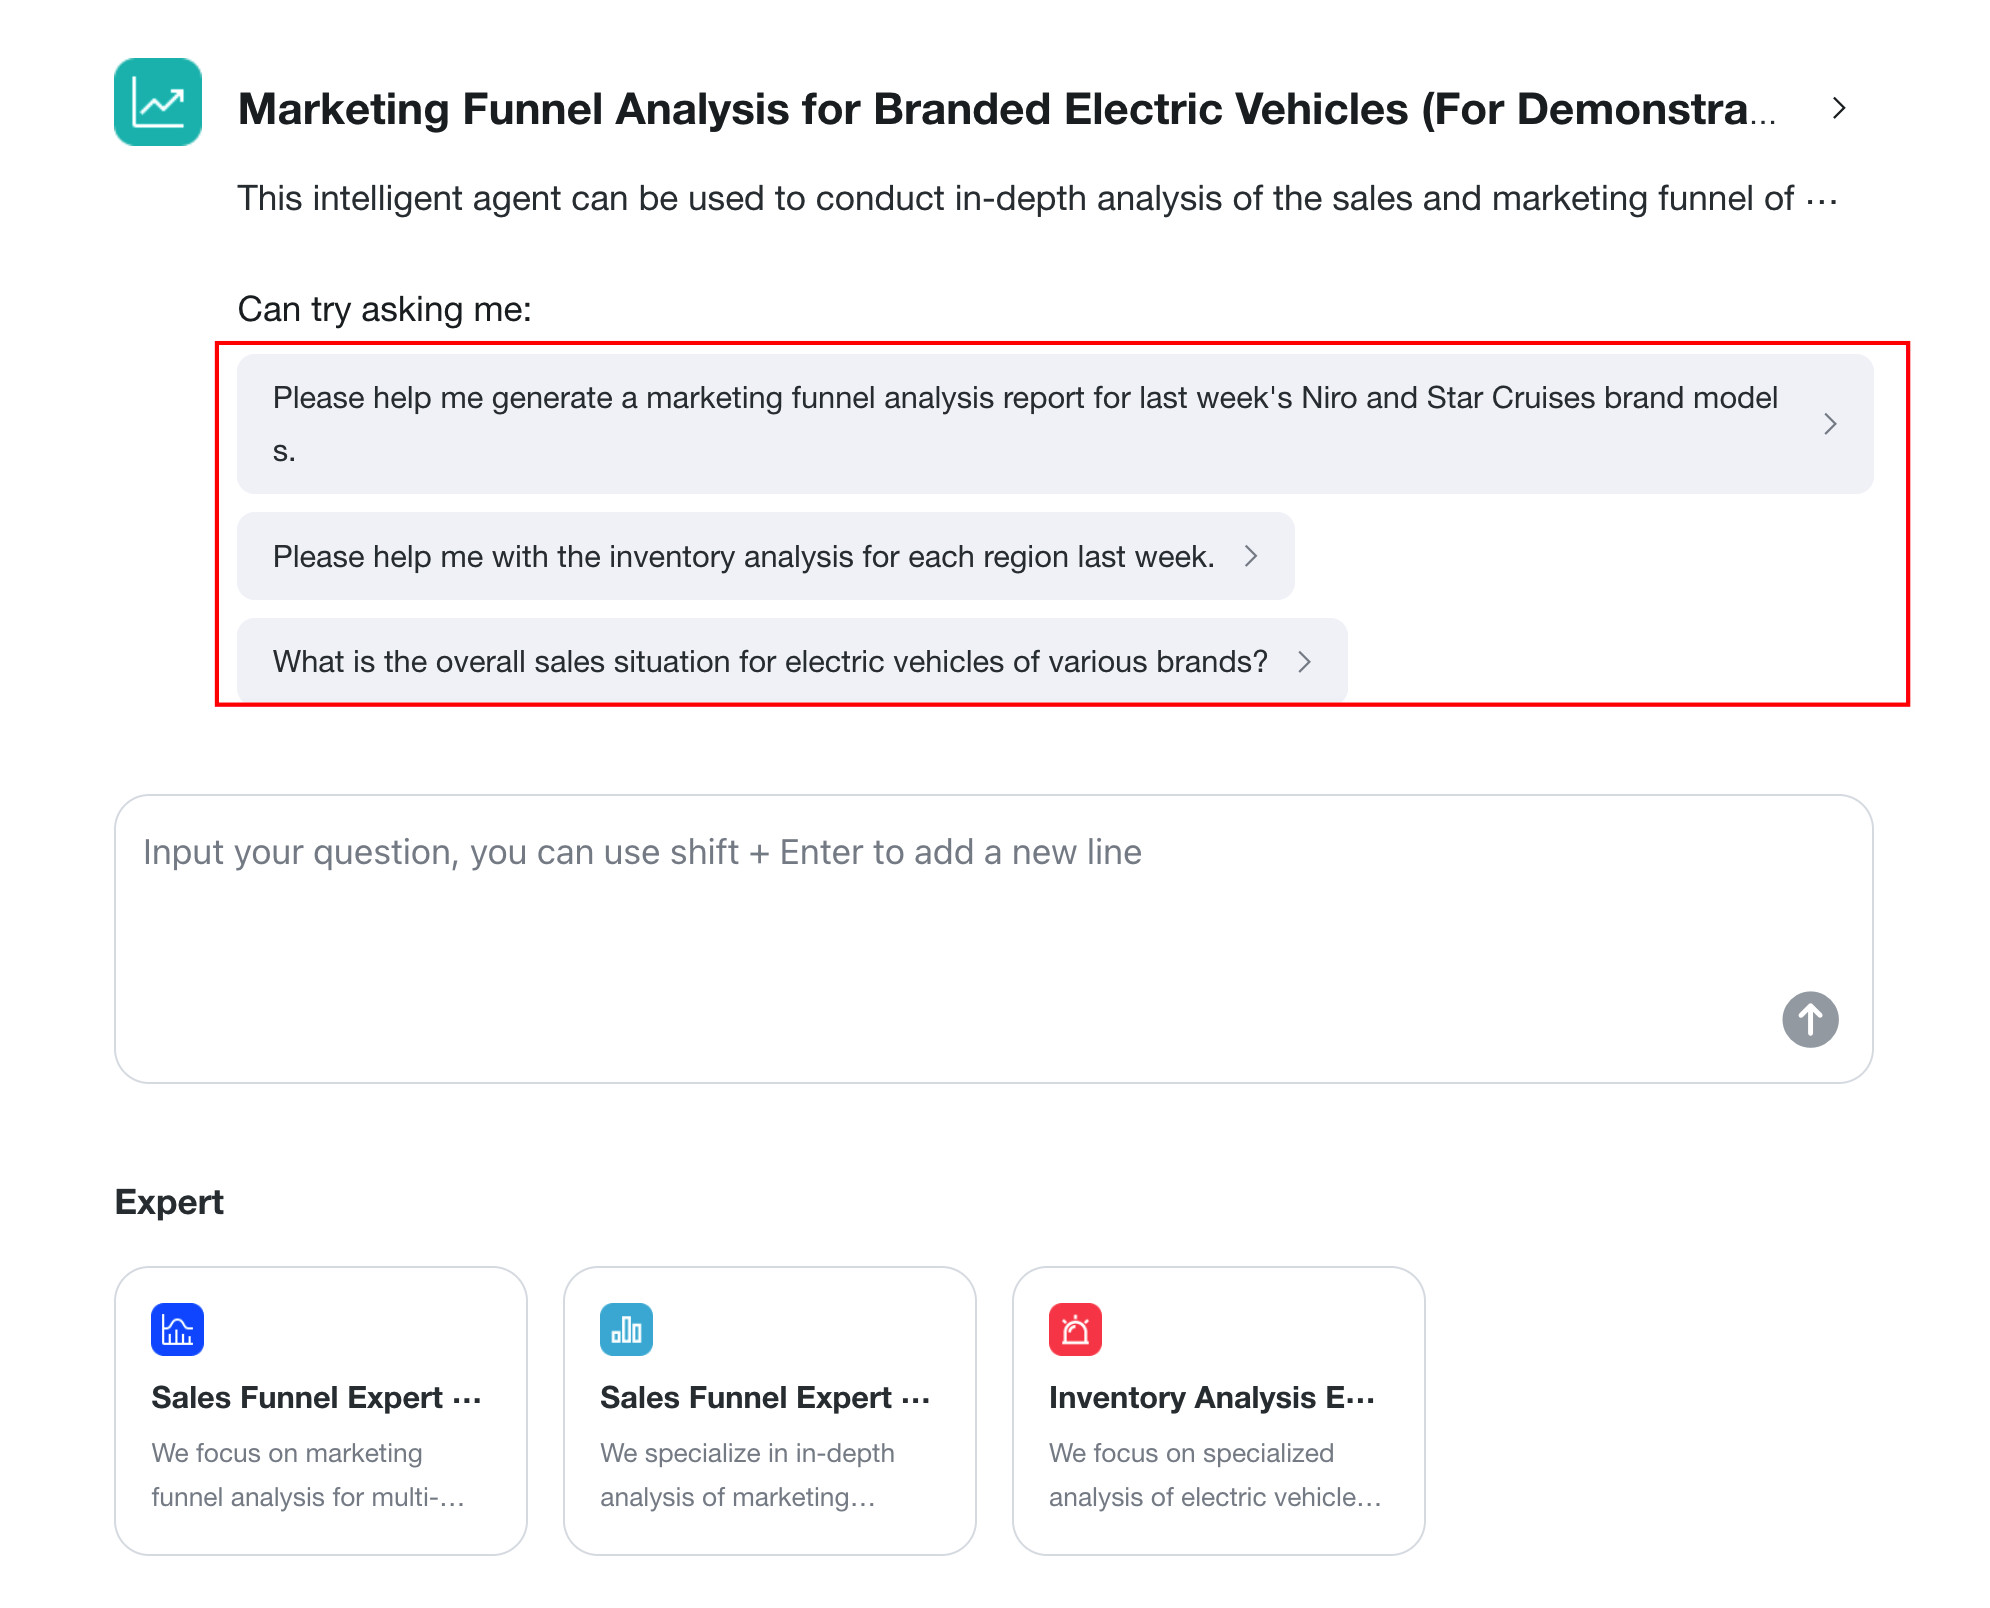
Automatic Matching and Manual Expert Invocation
The agent supports two Expert invocation methods: automatic matching and manual specification. For Expert configuration, see Expert.
Automatic Matching
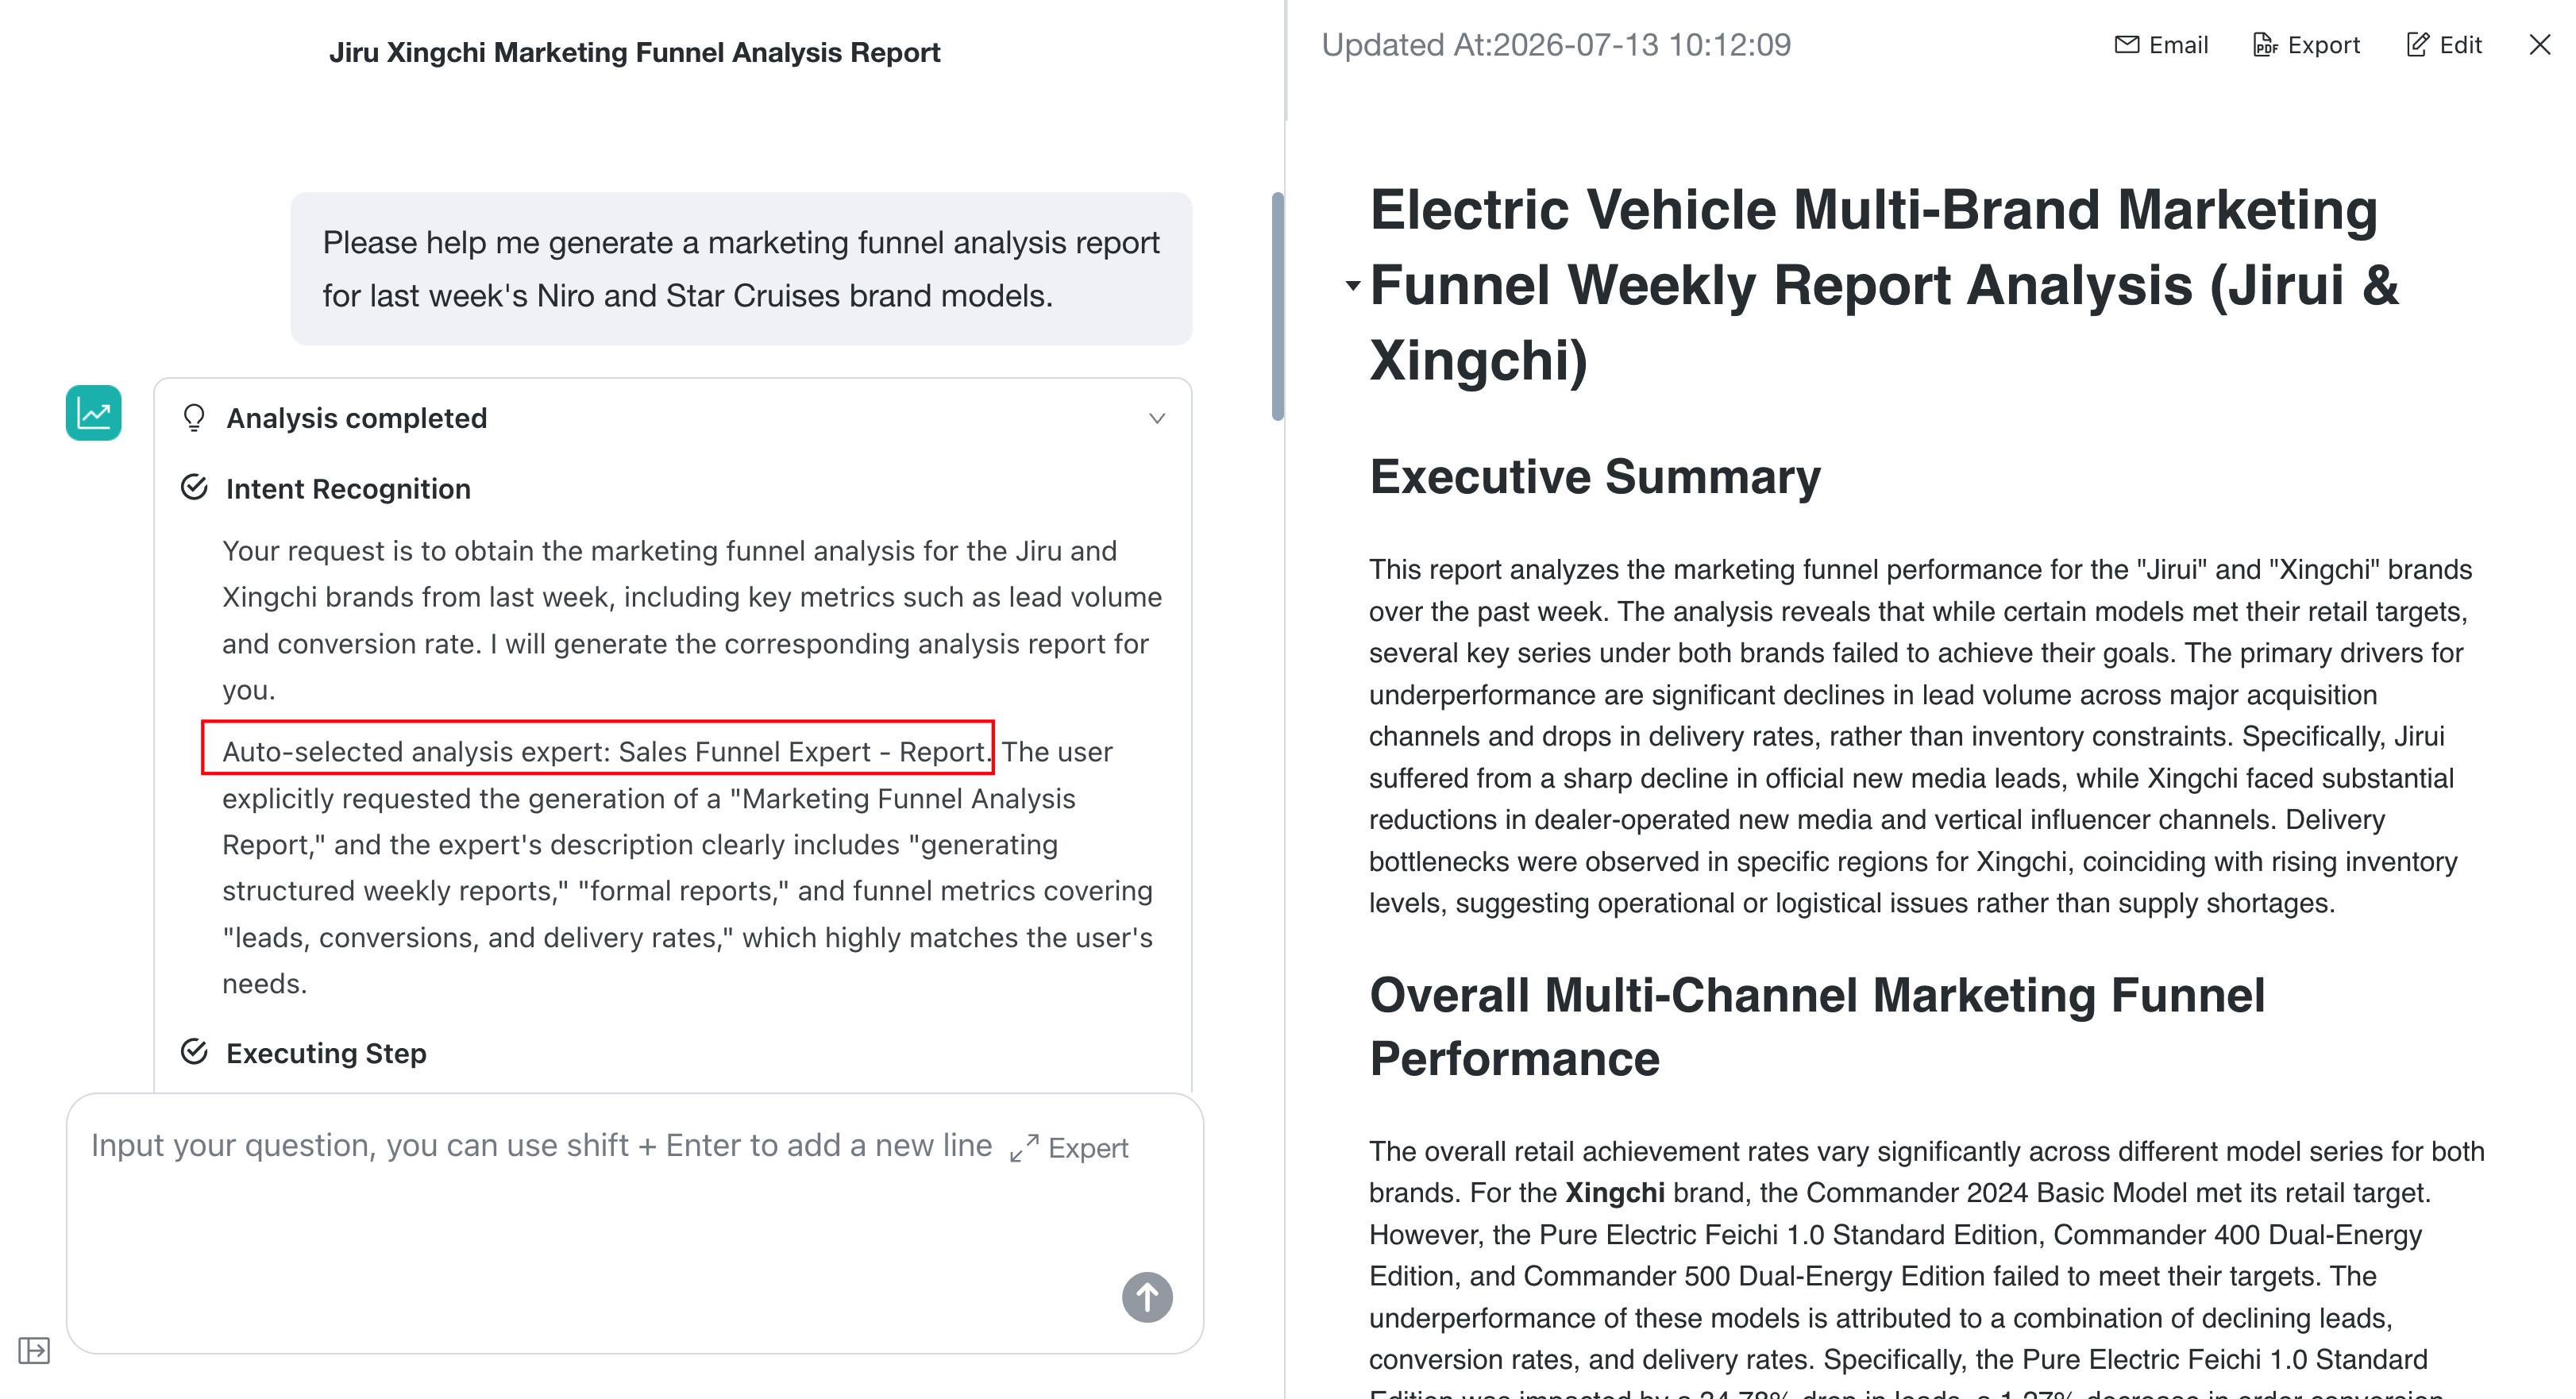
Simply enter a question without manually selecting an Expert. The agent recognizes the question intent and automatically matches the appropriate Expert based on each Expert's business scope. After matching succeeds, the system generates results according to the Expert's predefined Insight Thinking and Output Requirement.
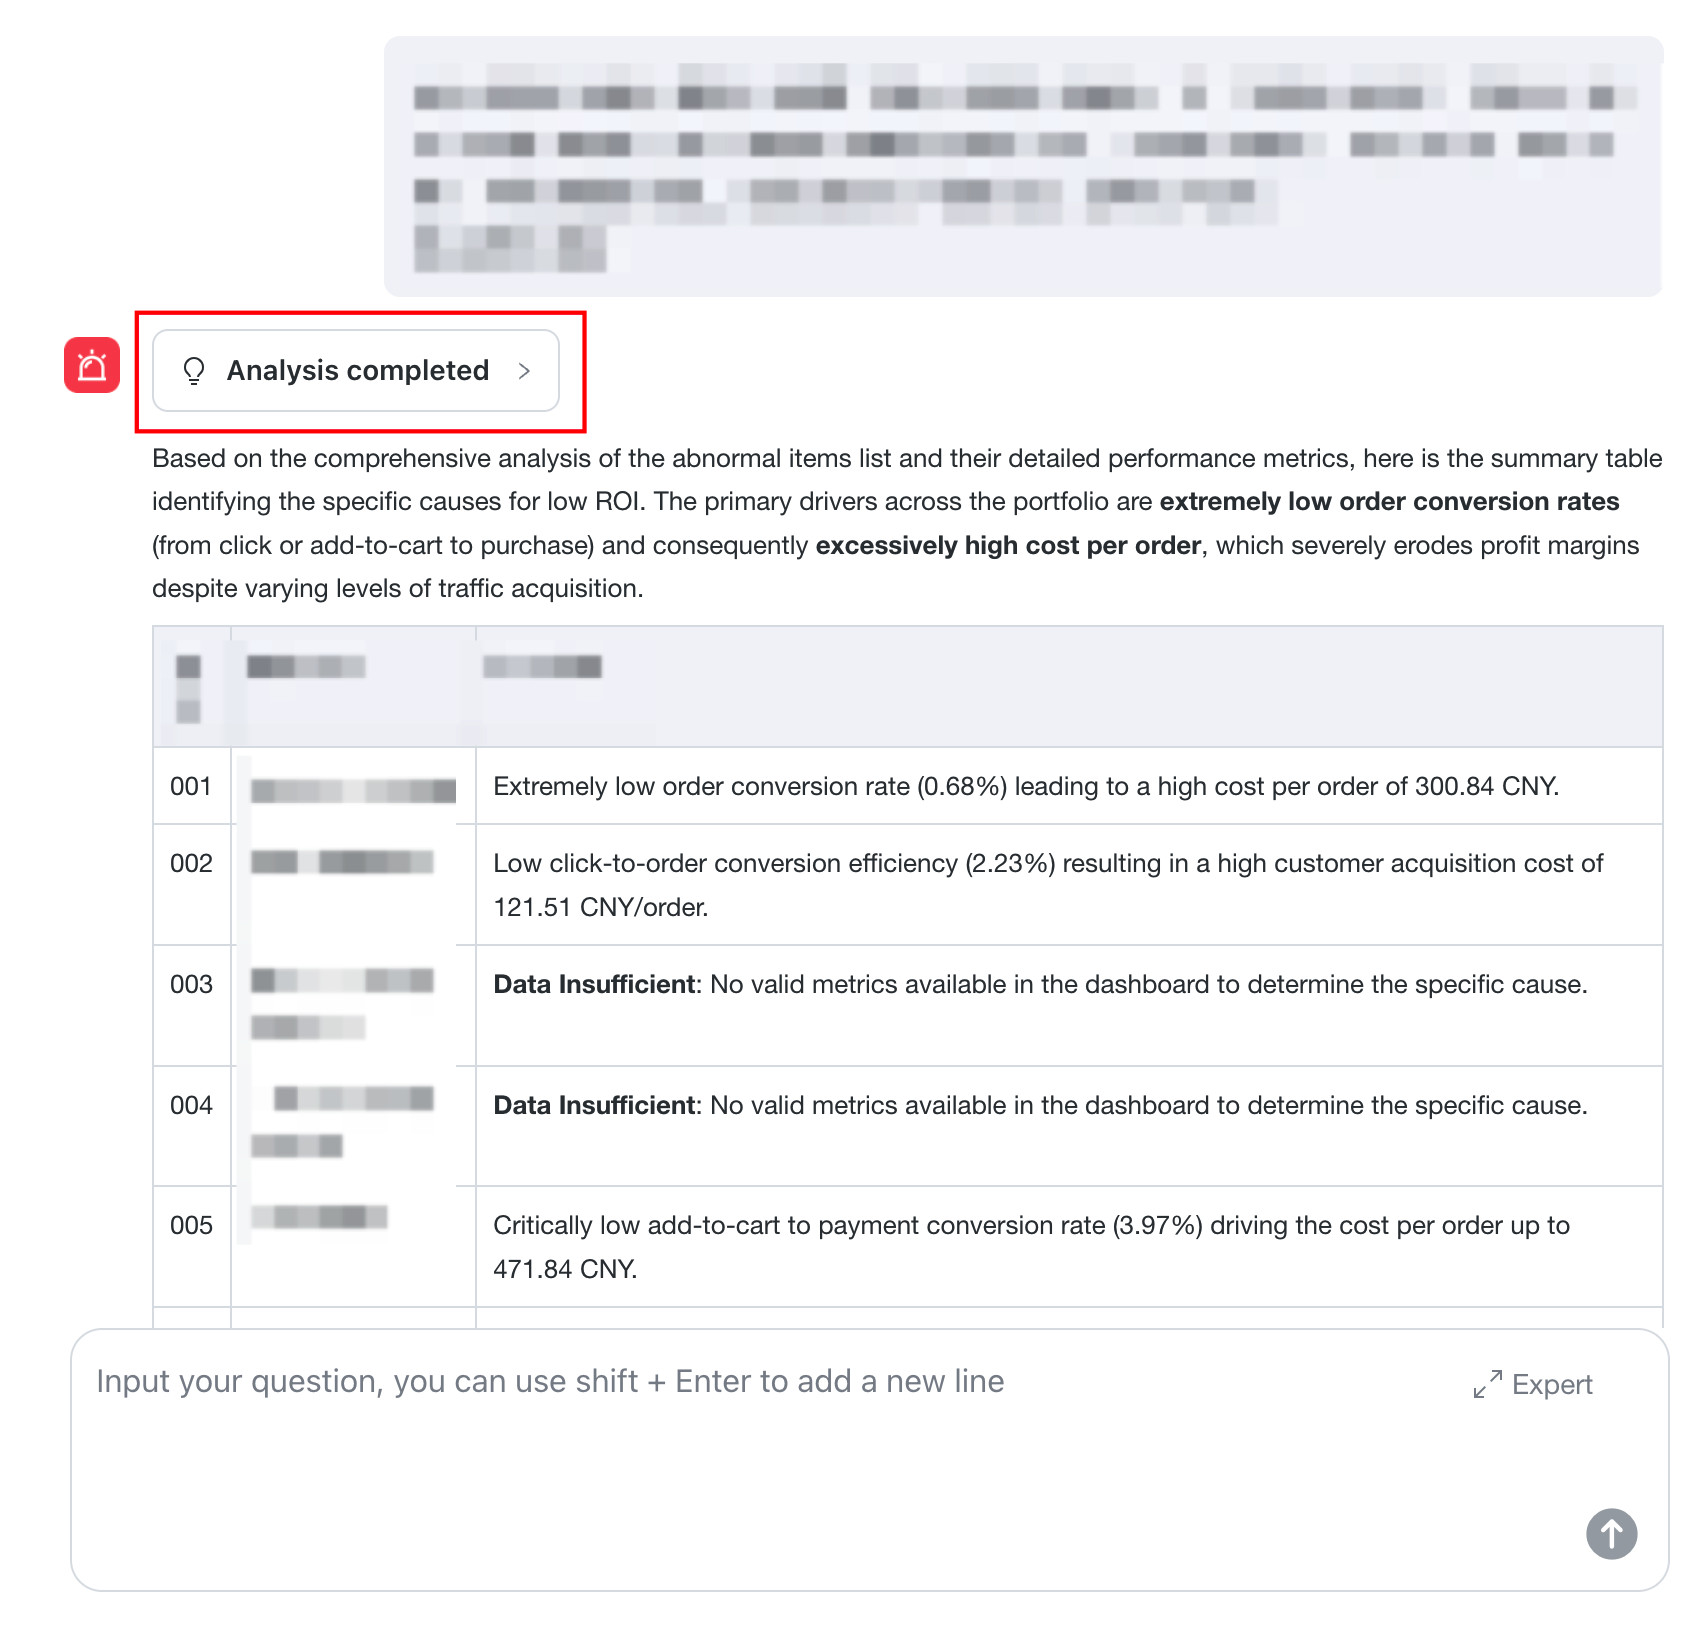
After execution is complete, expand Analysis completed to view the Expert automatically selected and invoked by the system.
Manual Specification
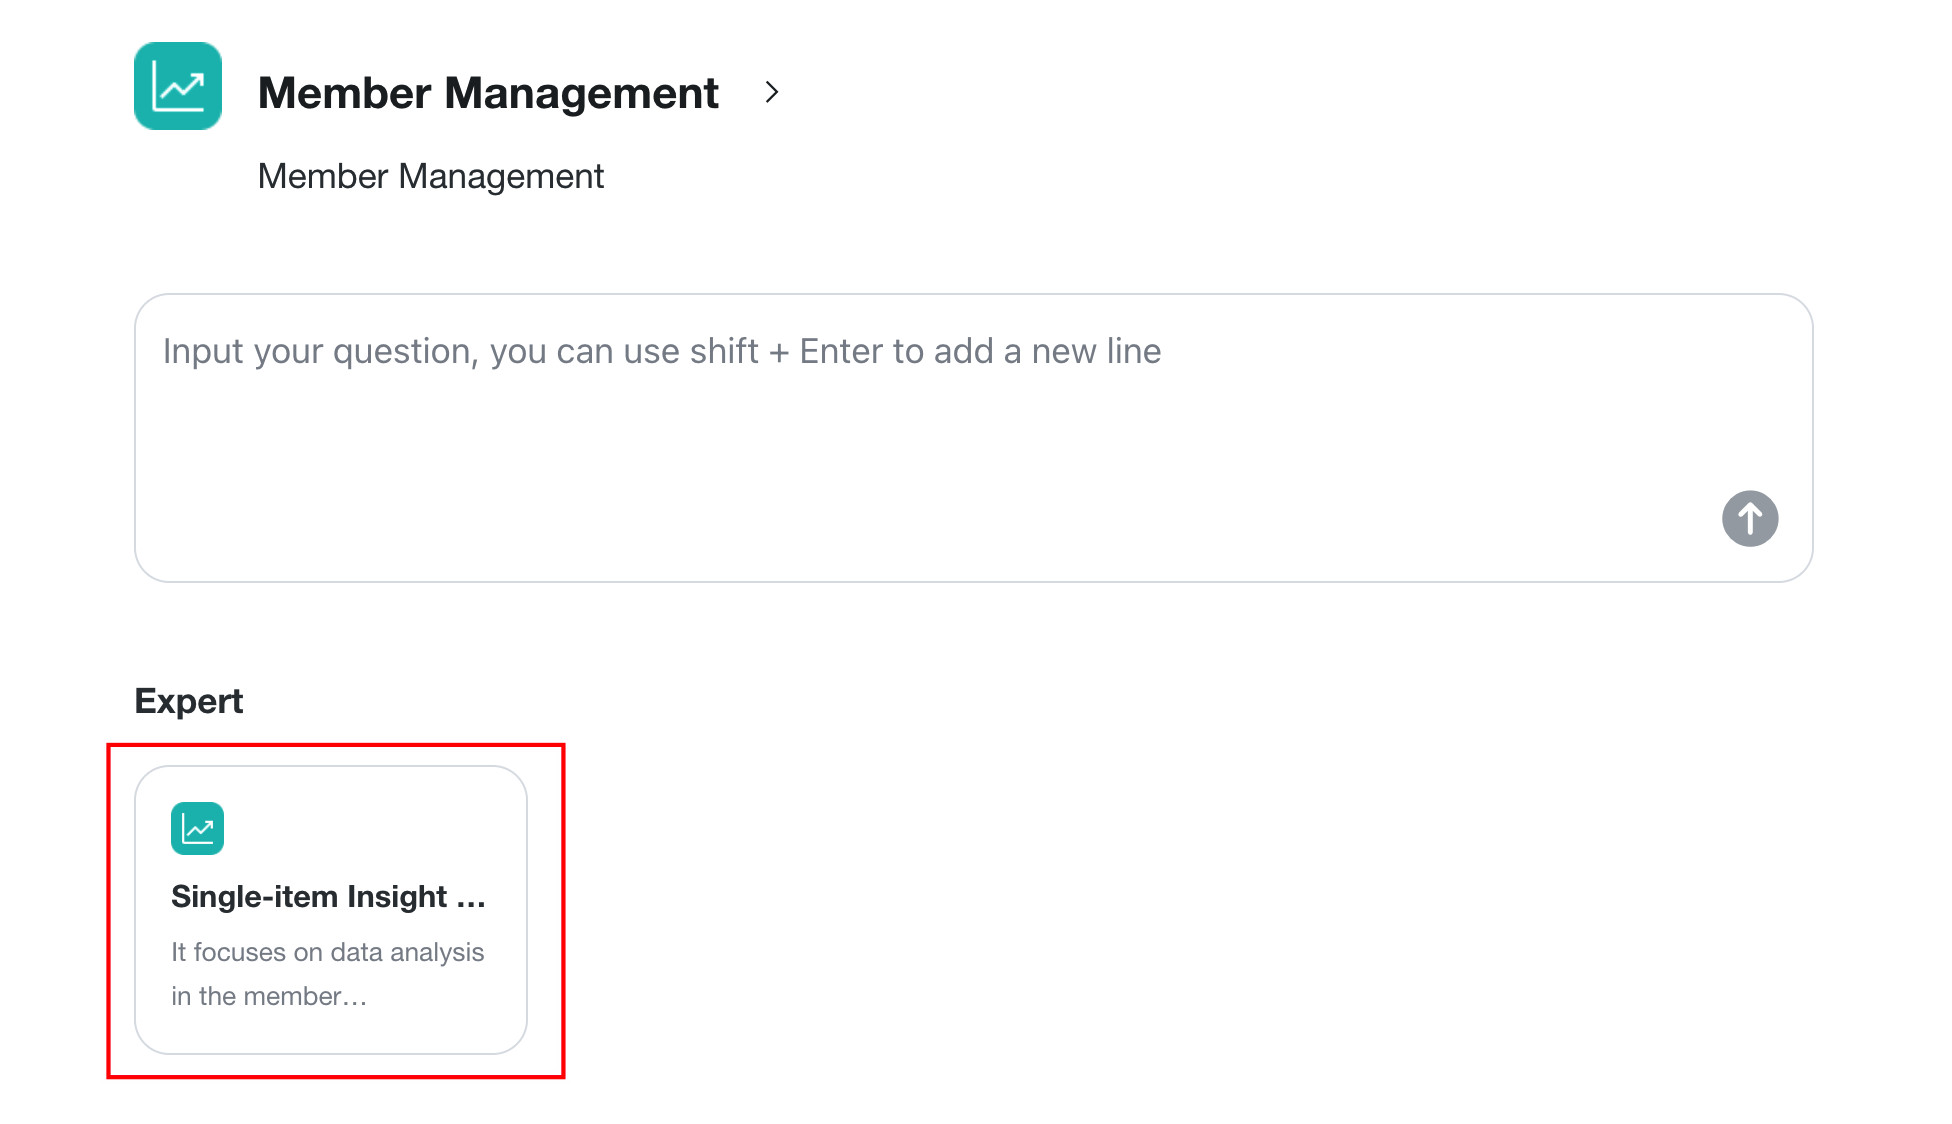
Select the Expert to use on the insight page. The system automatically generates a report according to the Expert's predefined Analysis Path.
View Analysis Process
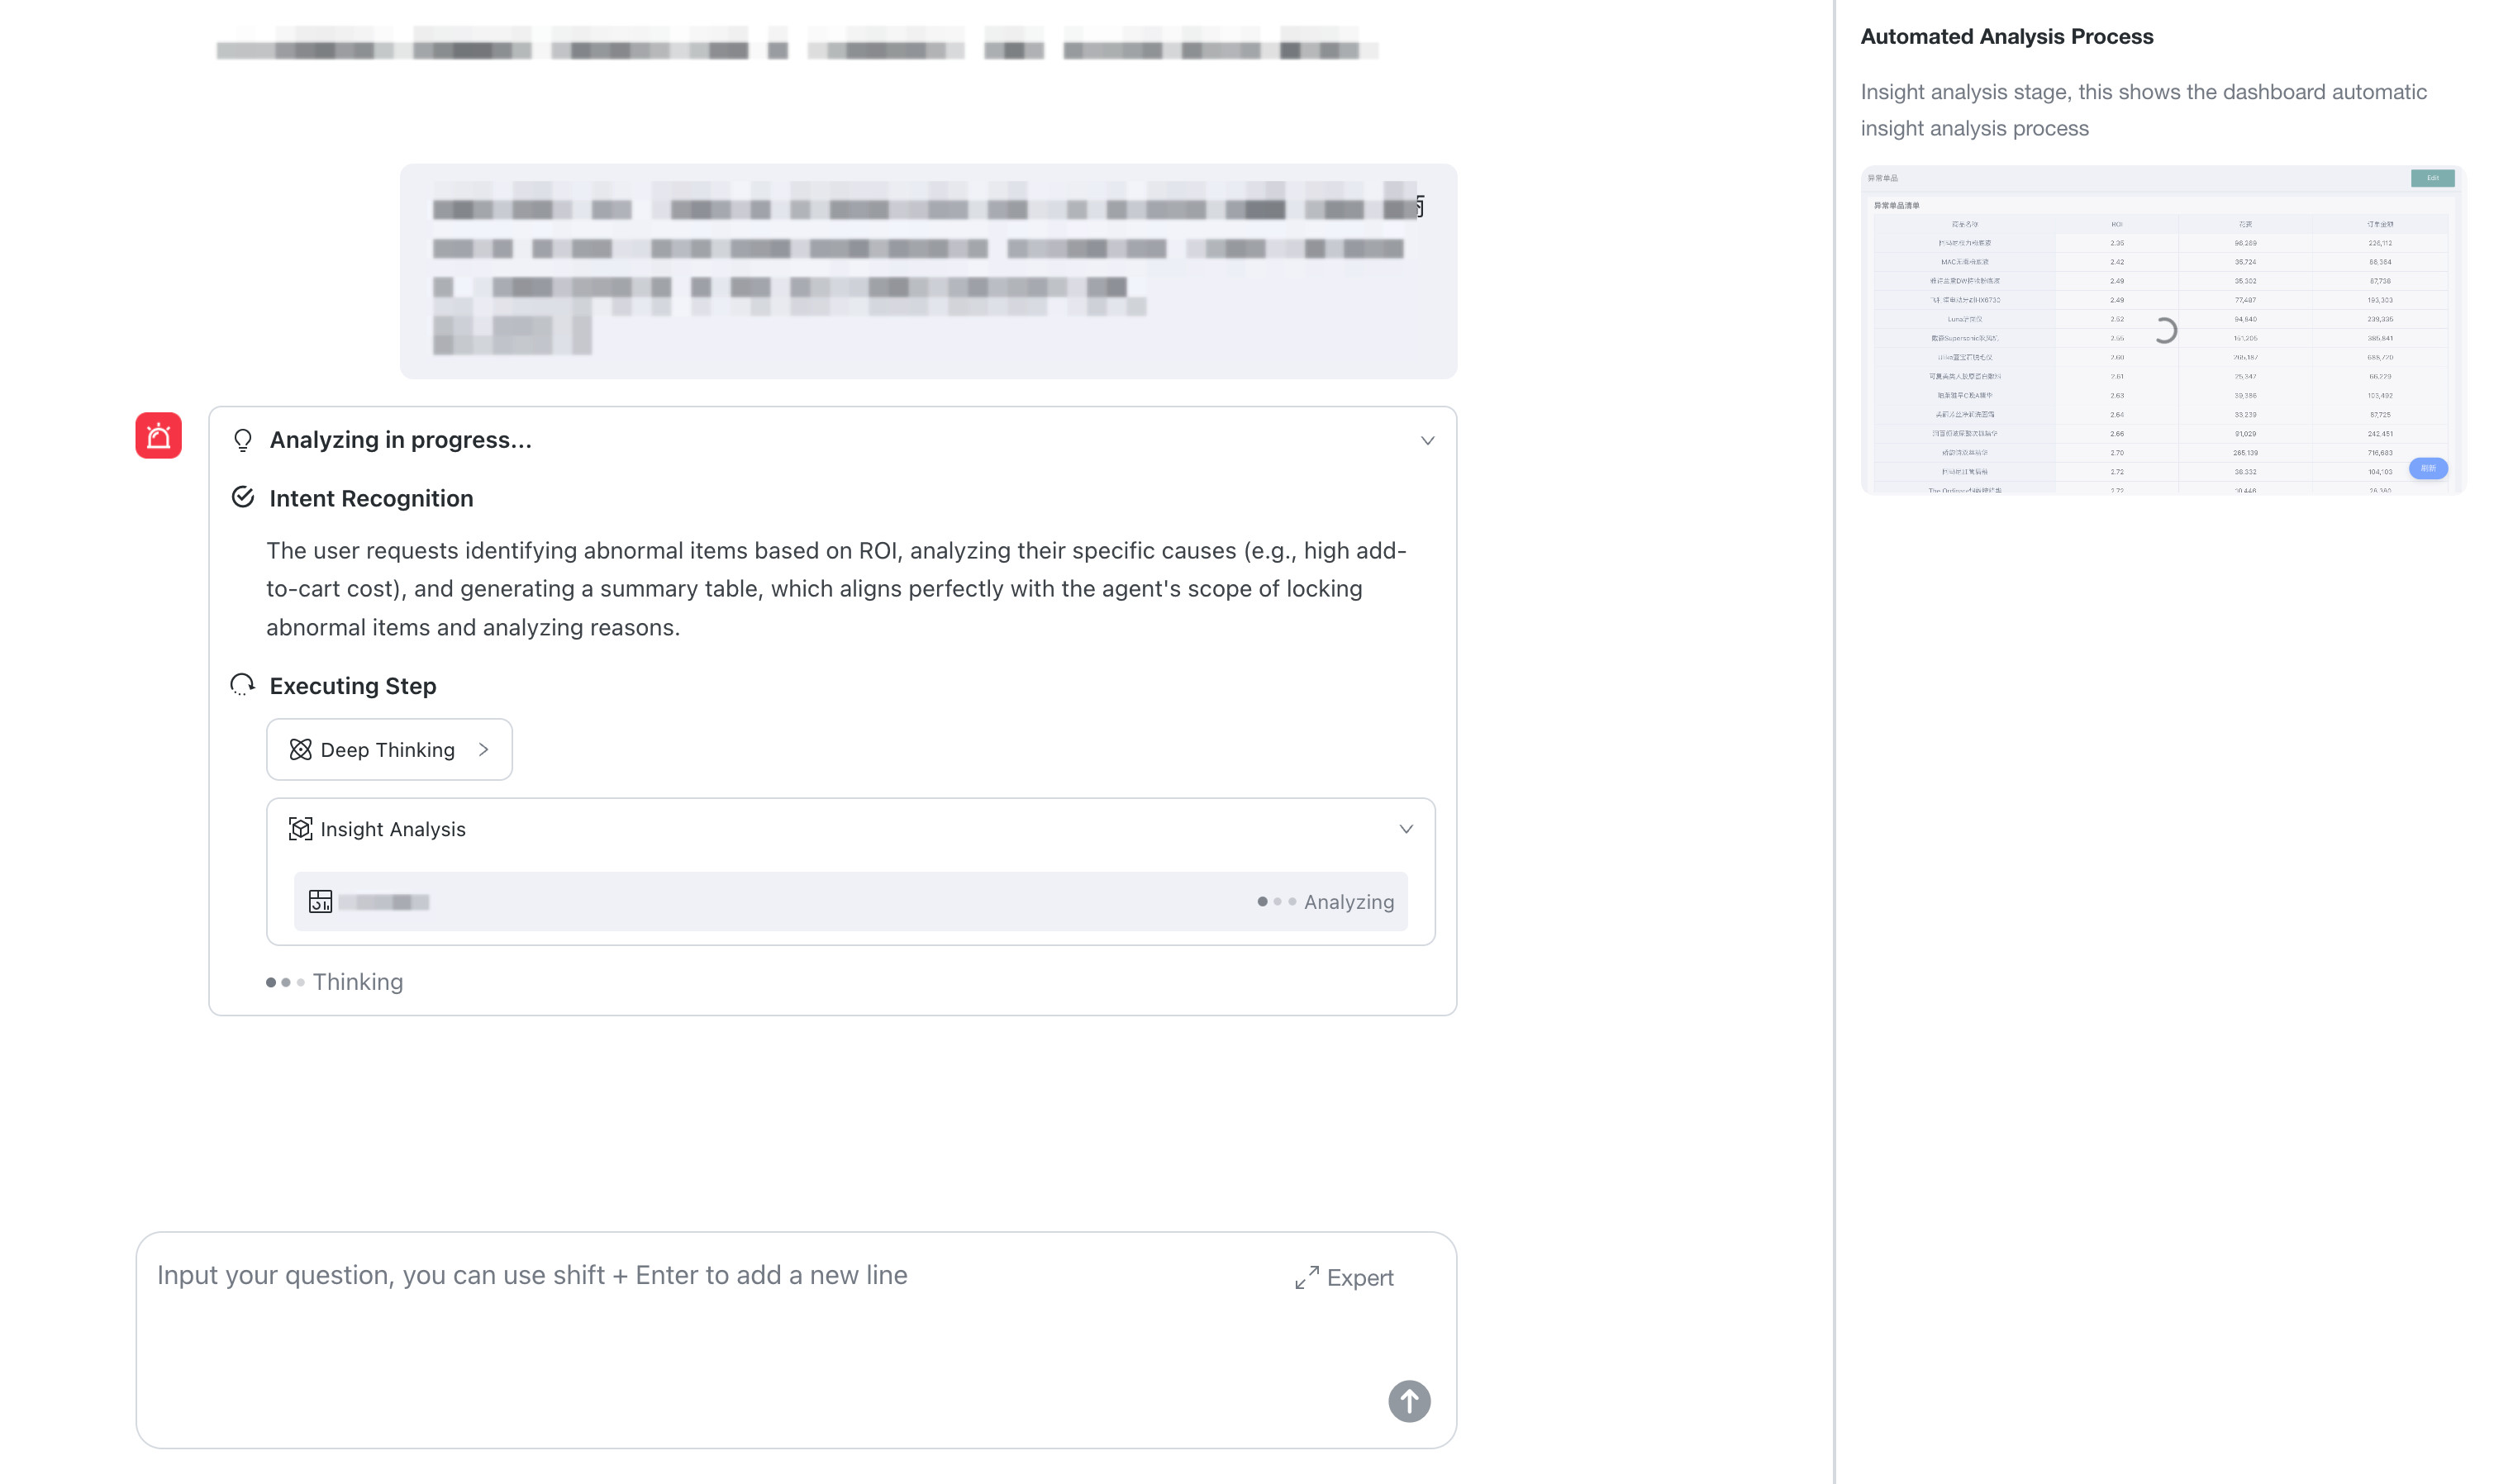
After you send a question, the system displays the Automated Analysis Process in real time in the dialog box, including the status progress of key steps such as Intent Recognition and Execution Steps. The Automated Analysis Process panel opens on the right at the same time, showing the details and progress of each insight analysis stage in real time until a complete analysis conclusion and report are generated.
After insight analysis is complete, the dialog box displays a collapsed Analysis completed panel. Expand it to view the complete system Analysis Process, including Intent Recognition, Execution Steps such as Deep Thinking and insight analysis, and Output Results.
View Insight Conclusion
The agent uses streaming output to display content progressively as conclusions are generated, without waiting for the complete analysis to finish.
-
Text conclusions are output paragraph by paragraph in the dialog area. During output, you can view the already generated analysis content simultaneously.
-
Report conclusions are output paragraph by paragraph in the report area on the right side of the page.
View Insight Conclusion
Text Type
View invoked Visualization Cards
Referenced Visualization Cards are displayed as superscripts during the insight process. Hover over a superscript to view Card details.
Copy Text
At the bottom of the answer generated by the agent, click Copy Text to copy the current answer to the clipboard with formatting such as bold text, indentation, and list numbering retained.
Report Type
If the system invokes an Expert with Report Mode enabled, the agent generates a standardized professional report. After the report is generated, the report content opens on the right by default.
The top of the report displays the last update time and provides operations such as Email, Export, and Edit.
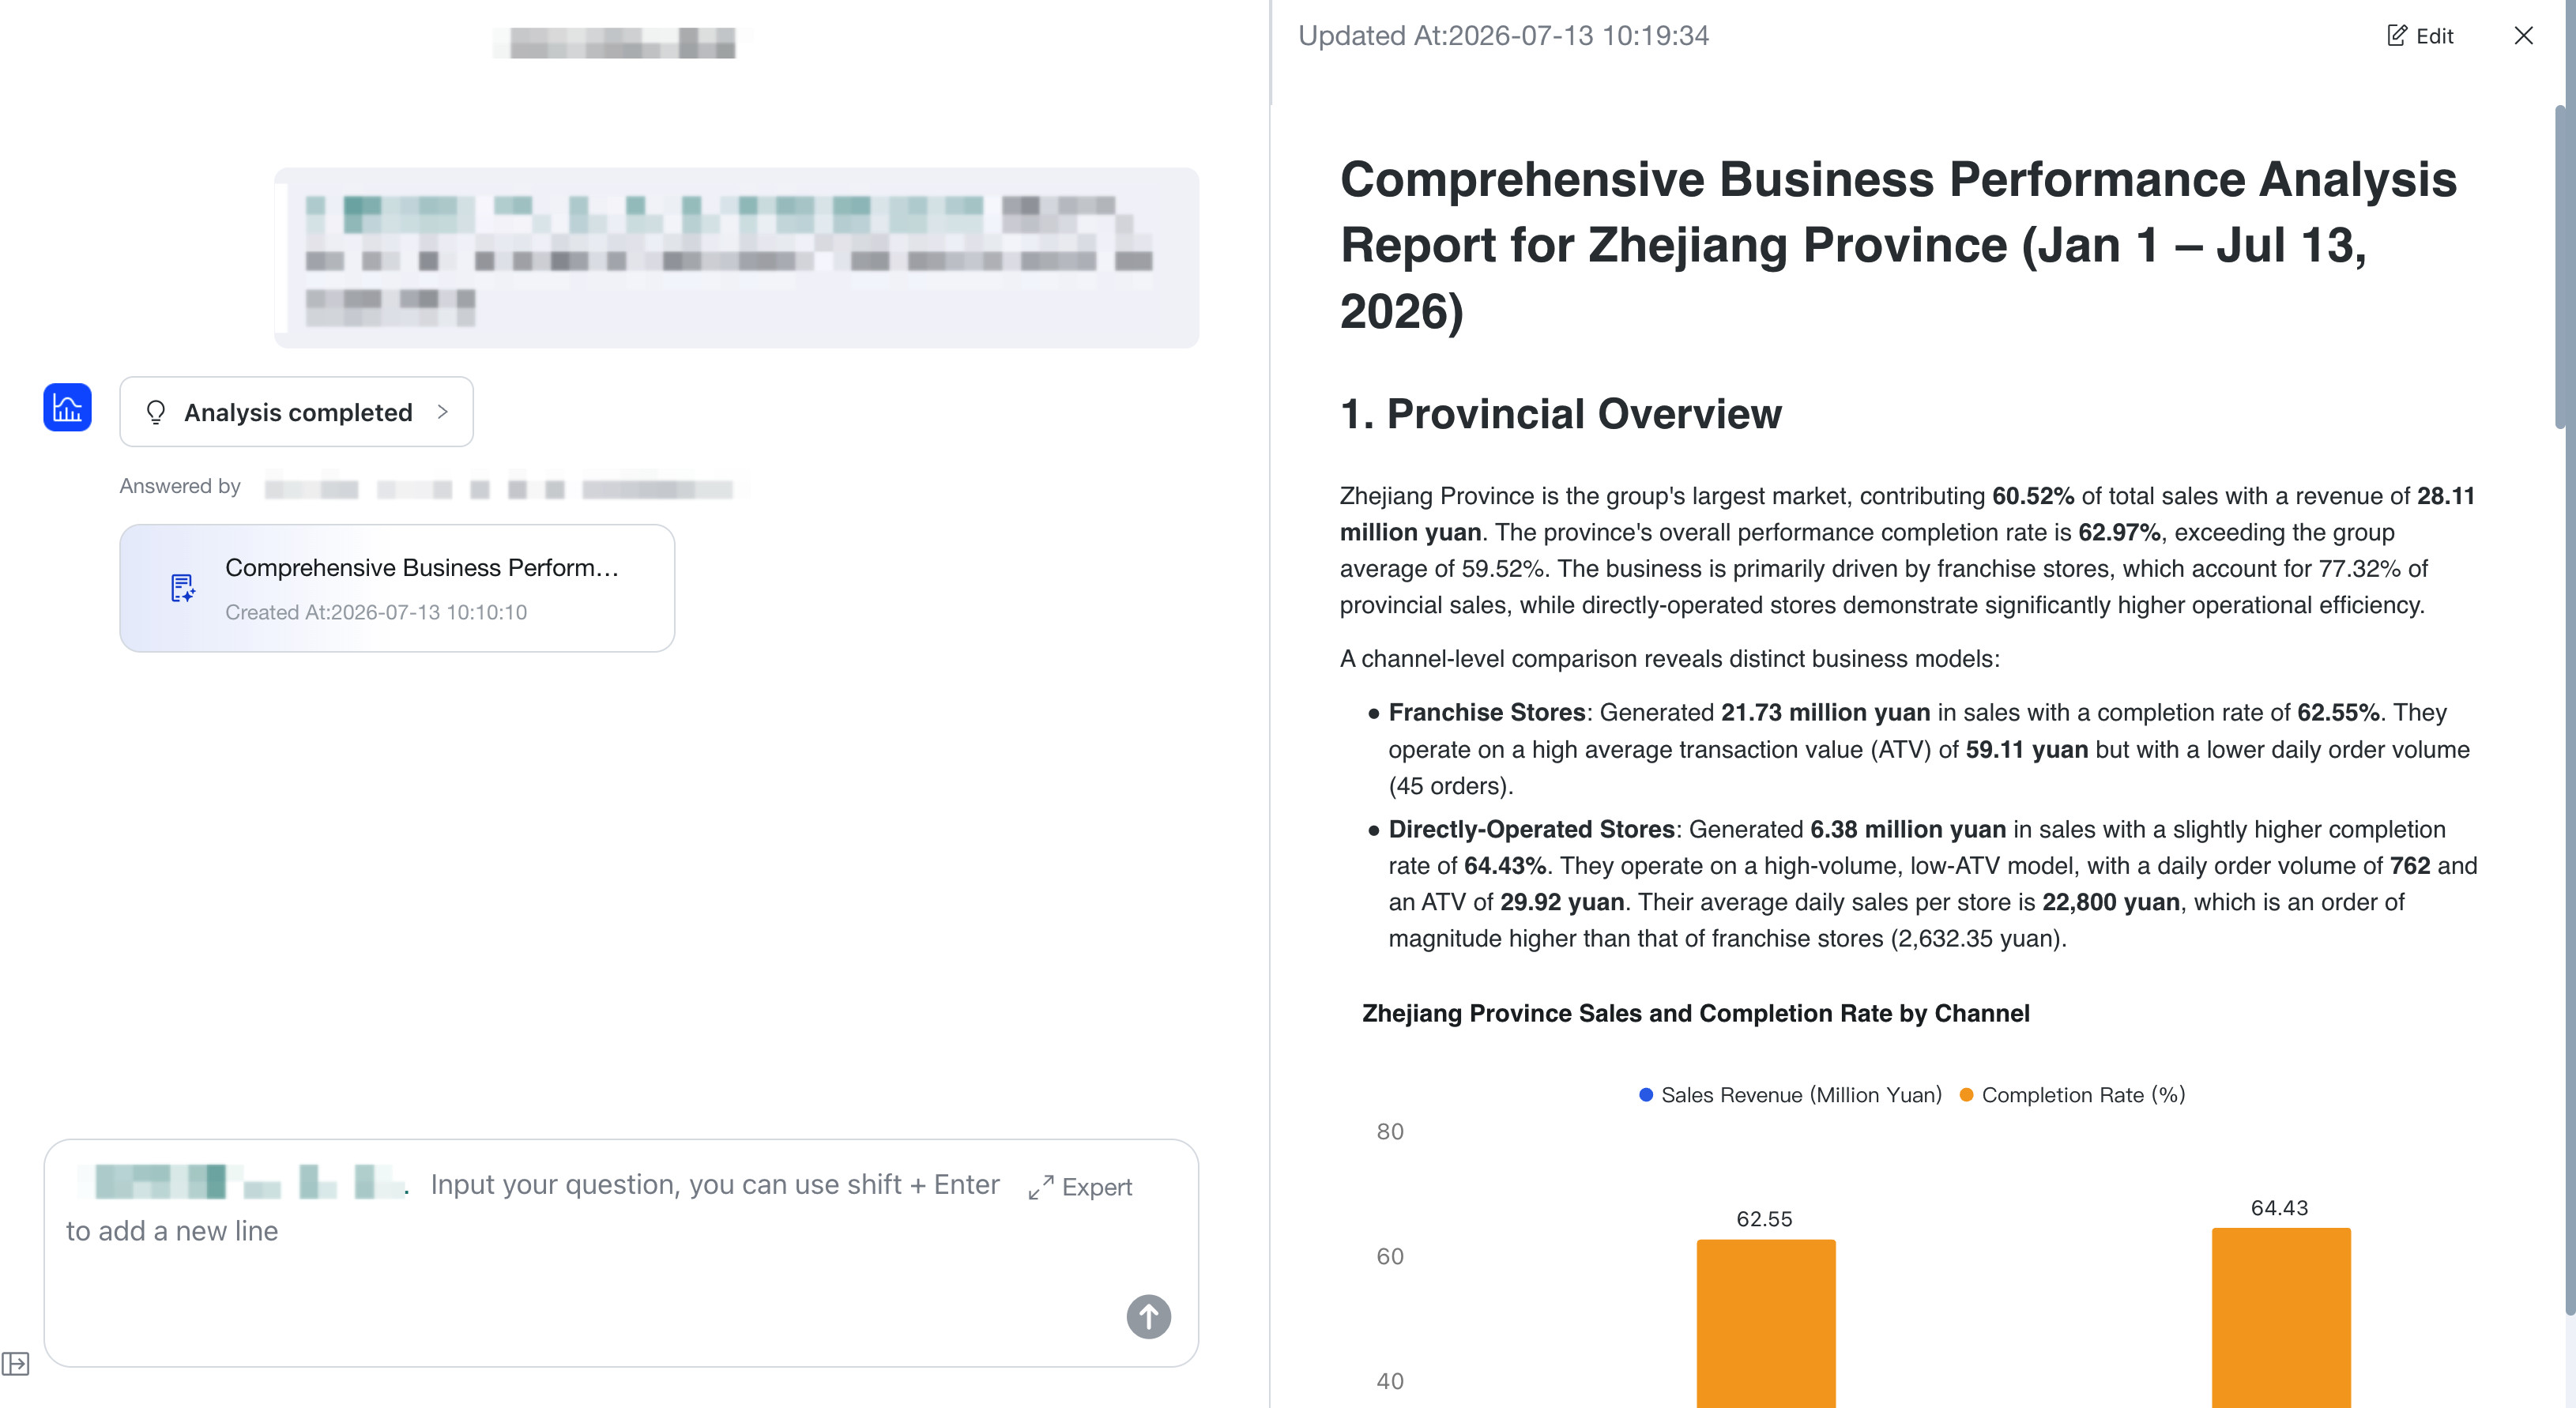
View Mixed Text-and-Chart Report
If the Expert specifies a Chart Type in the Report Mode section settings, the system generates corresponding Charts based on analysis results and displays them mixed with text conclusions.
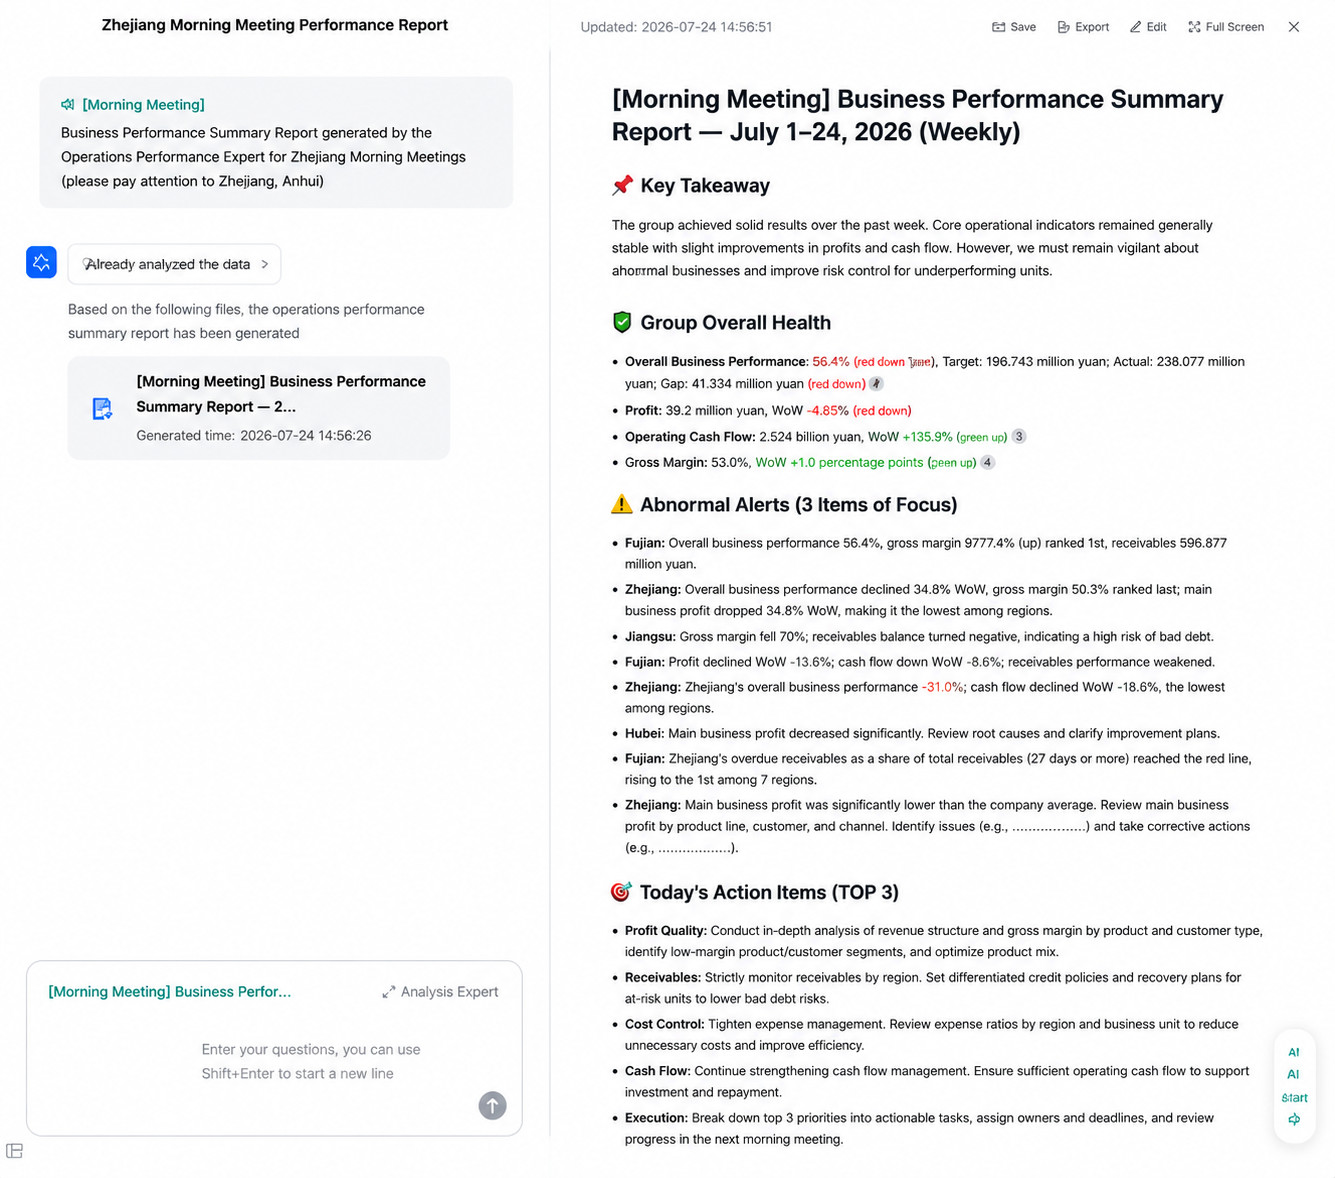
View Key Data Changes
The report automatically highlights key content based on business semantics of data changes. For example, decreasing or risk data is displayed in red, while increasing or improving data is displayed in green, making it easy to quickly identify anomalies and positive changes.
Send Report via Email
-
Click
Emailin the upper-right corner of the report to open theMessage Pushwindow.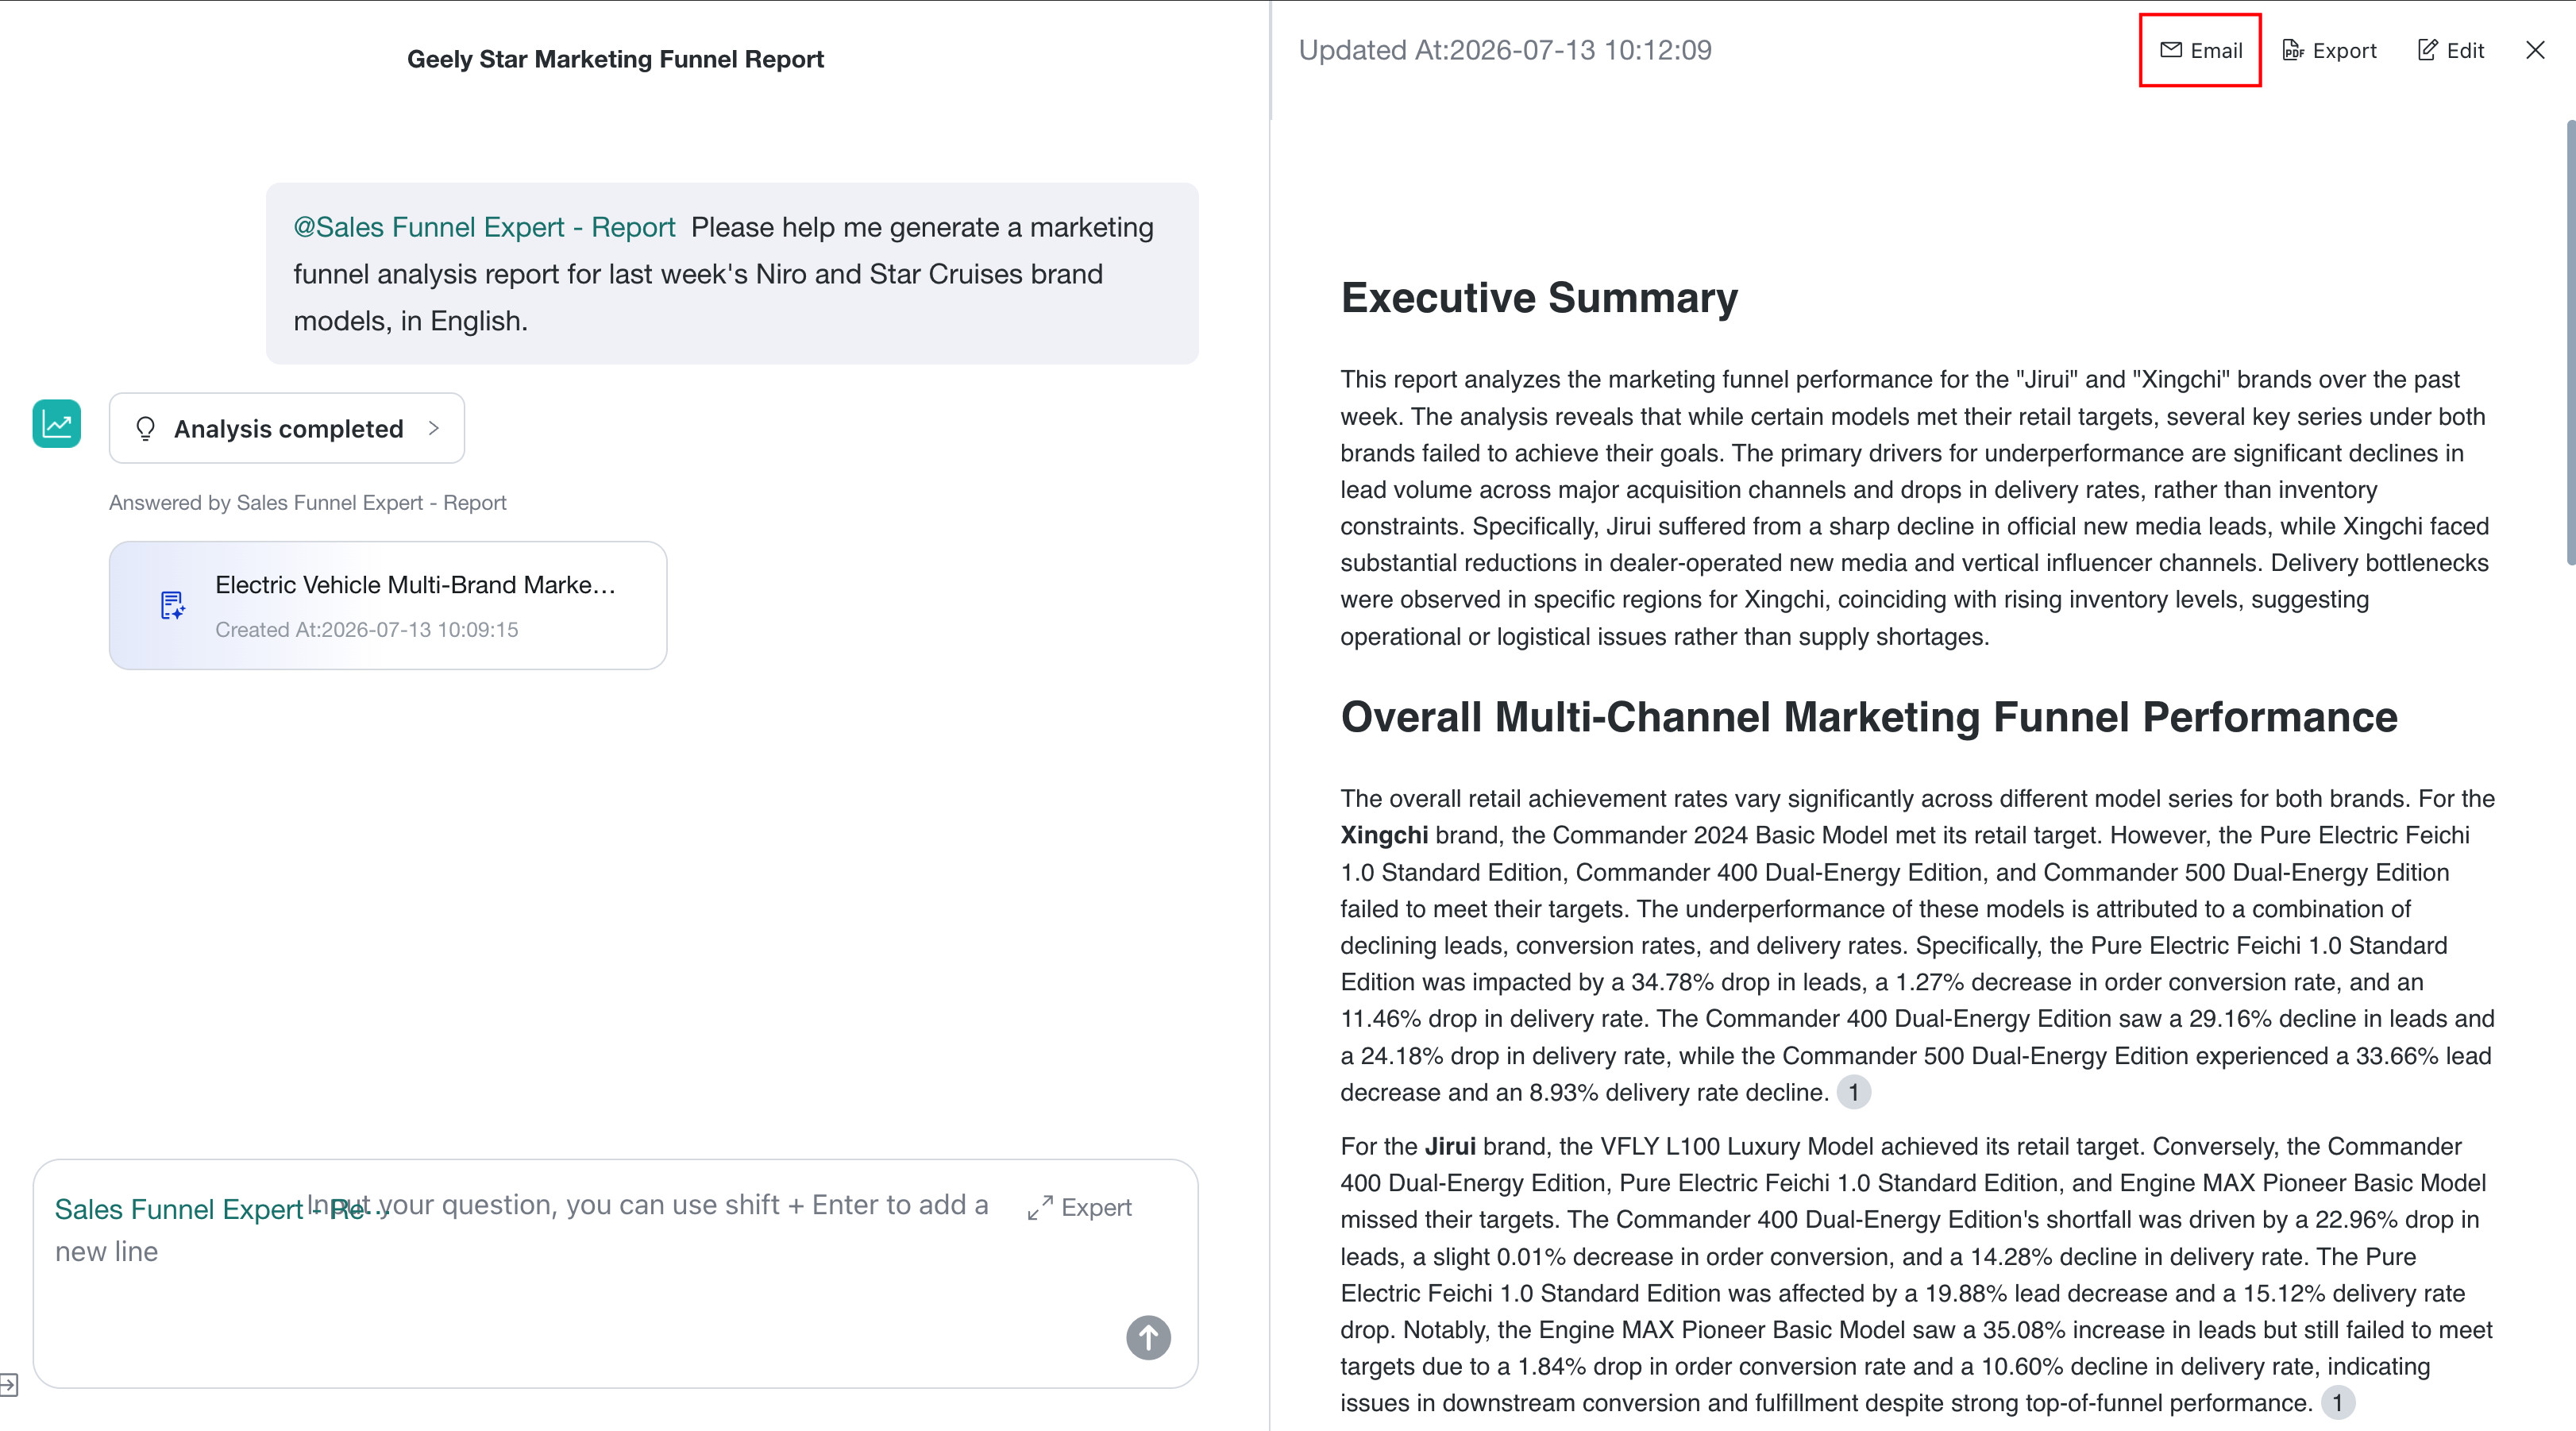
-
Select the sender and recipients. Add CC or BCC recipients as needed.
-
Set the email subject and body, then click
OKto send.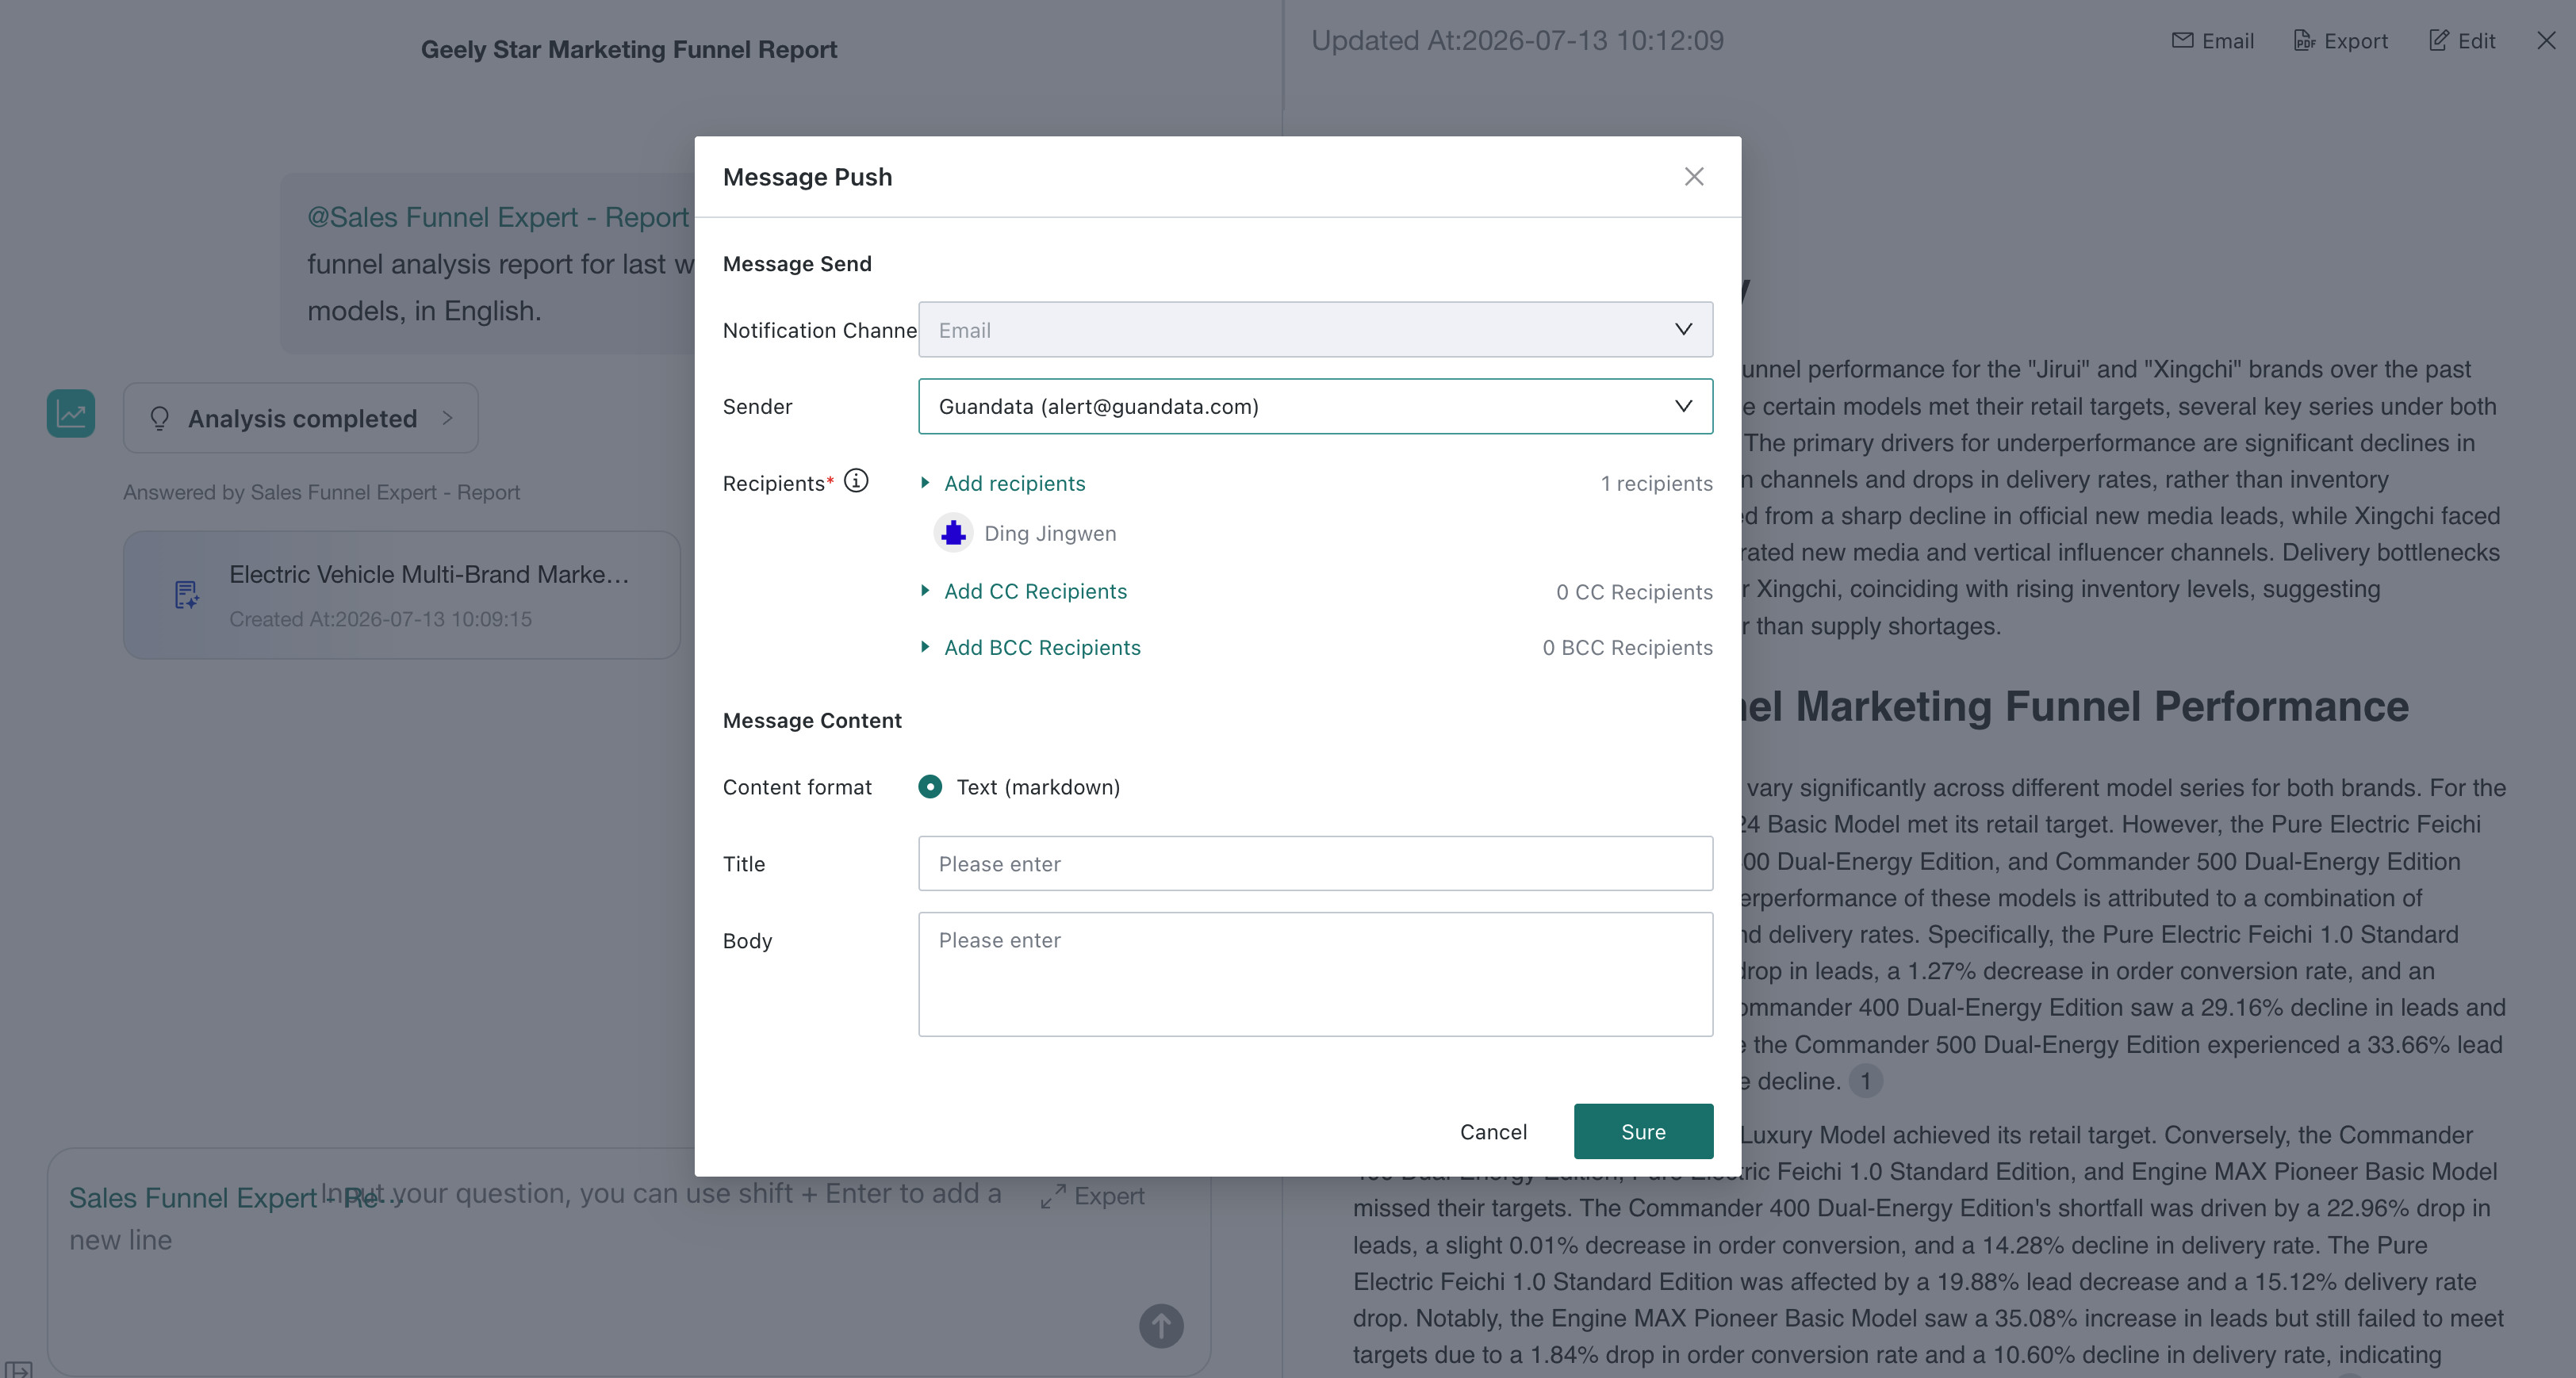
Export PDF Report
-
Click
Exportin the upper-right corner of the report. The system creates a PDF export task.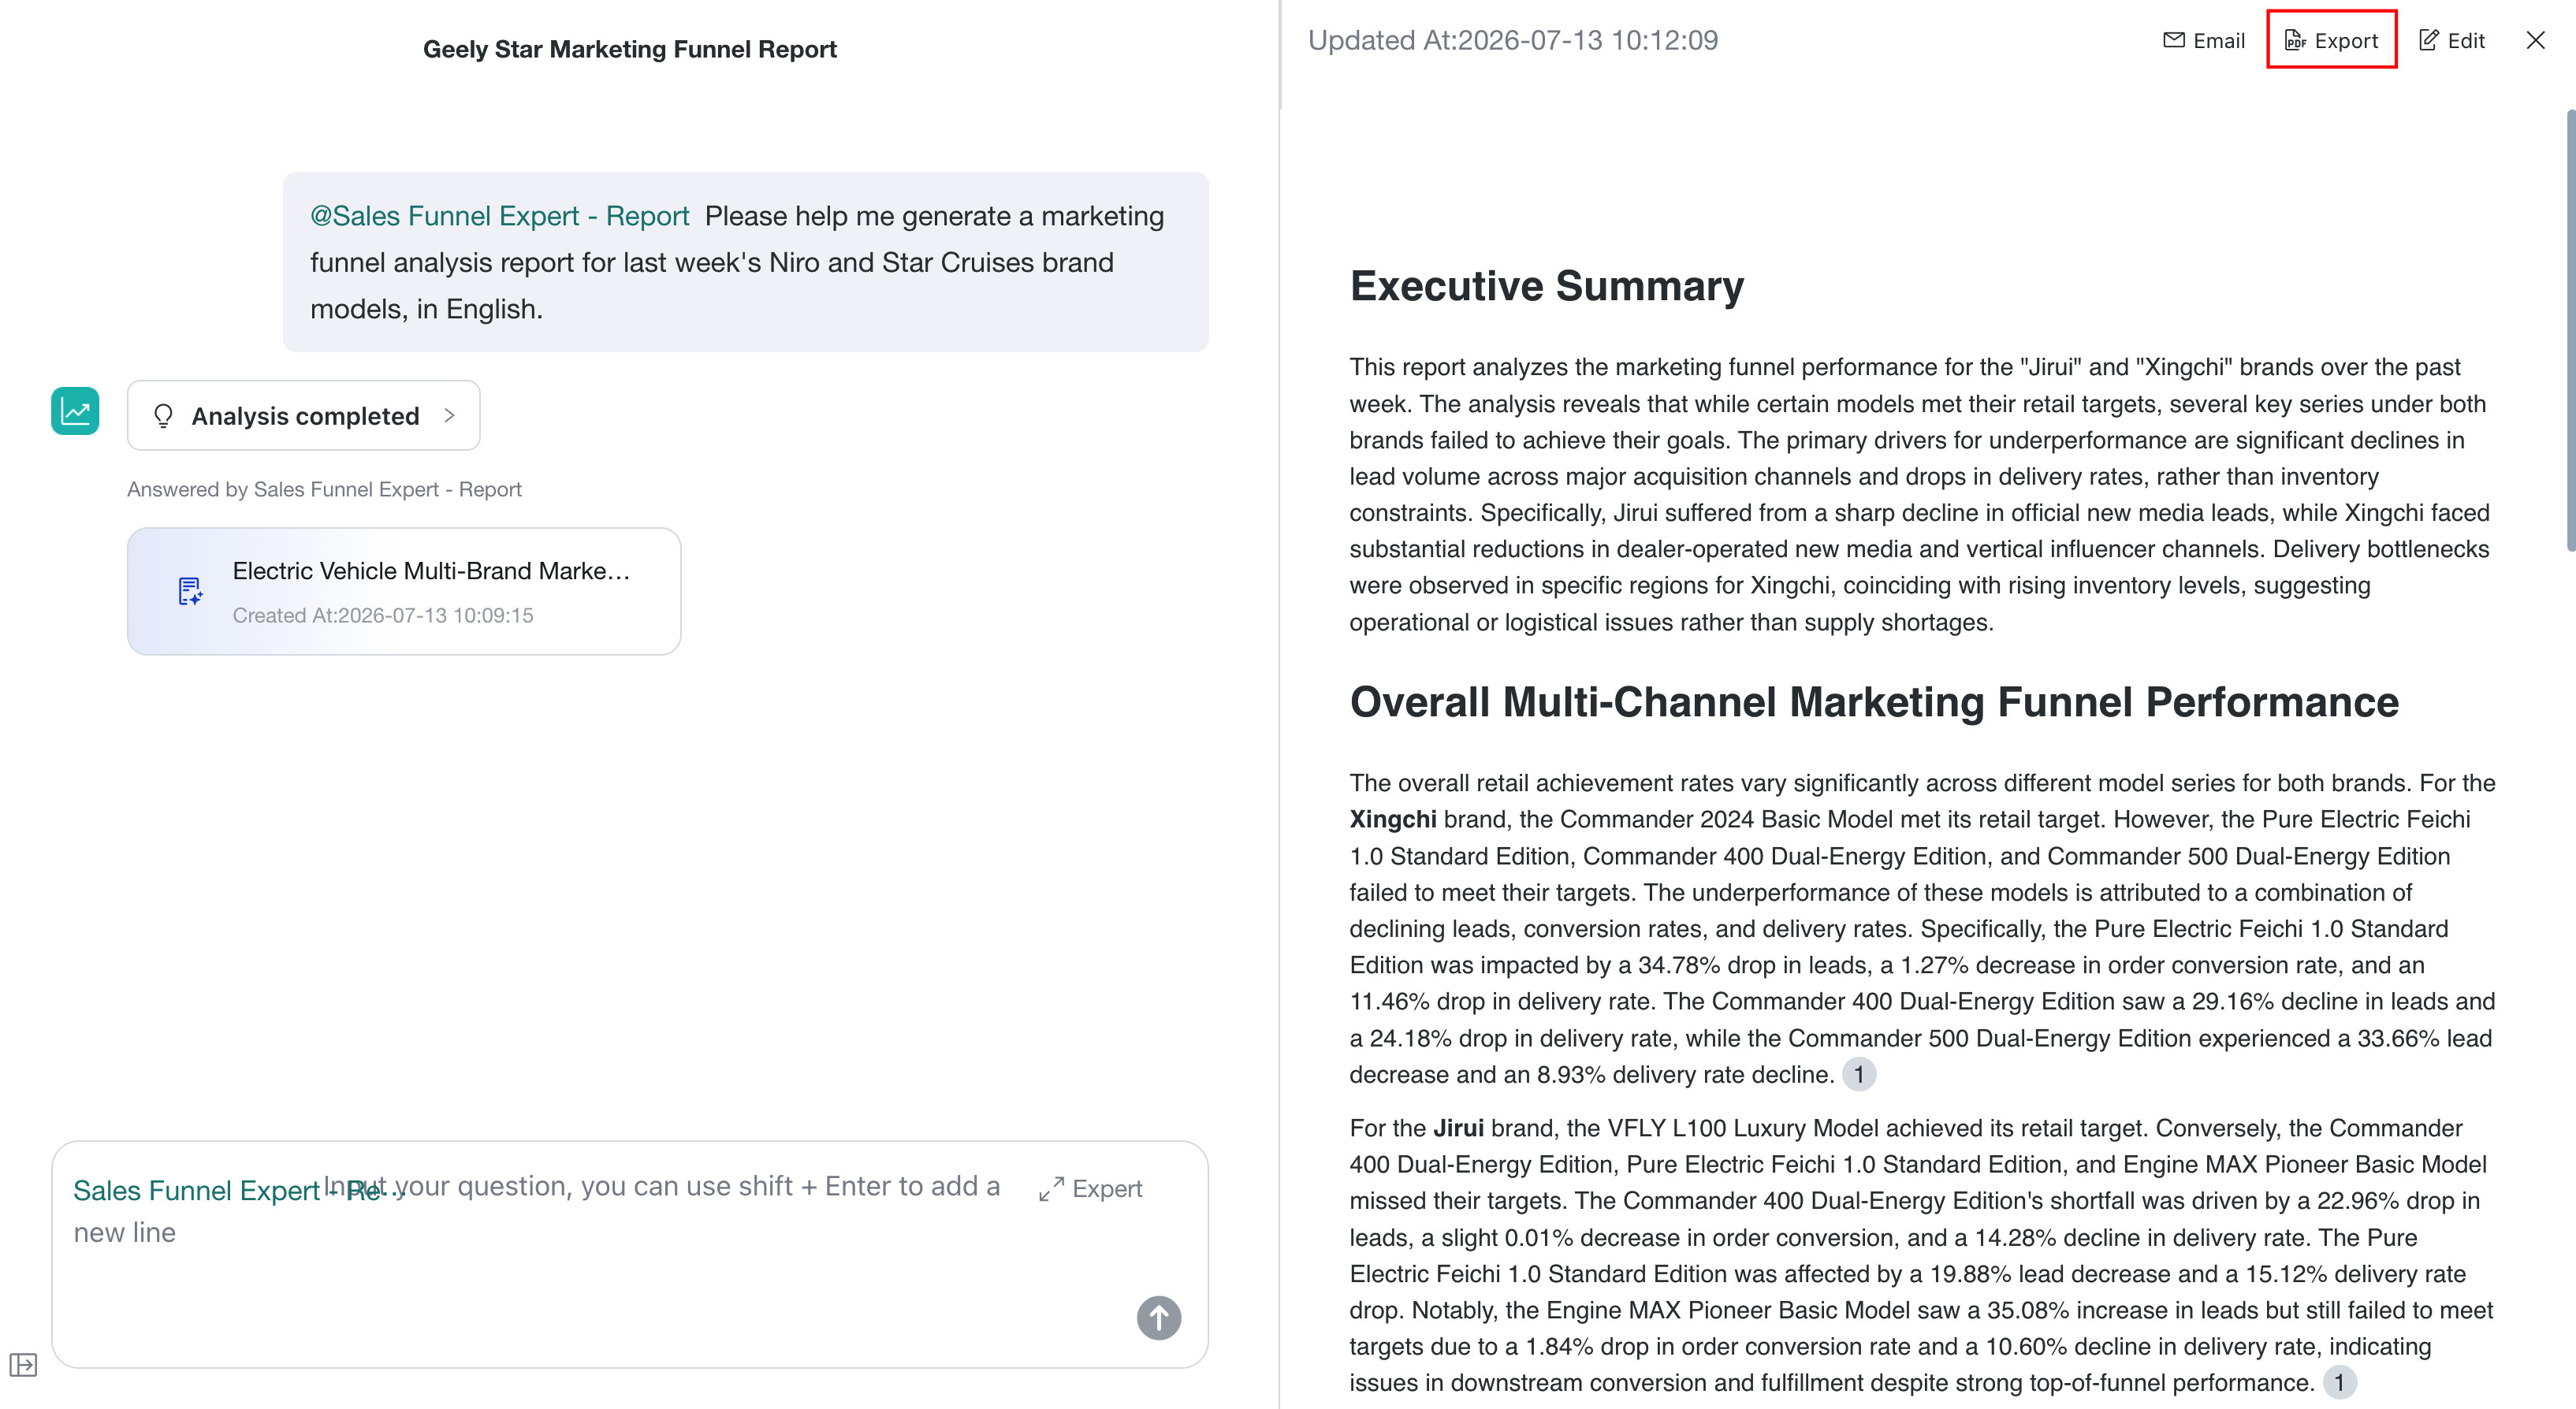
-
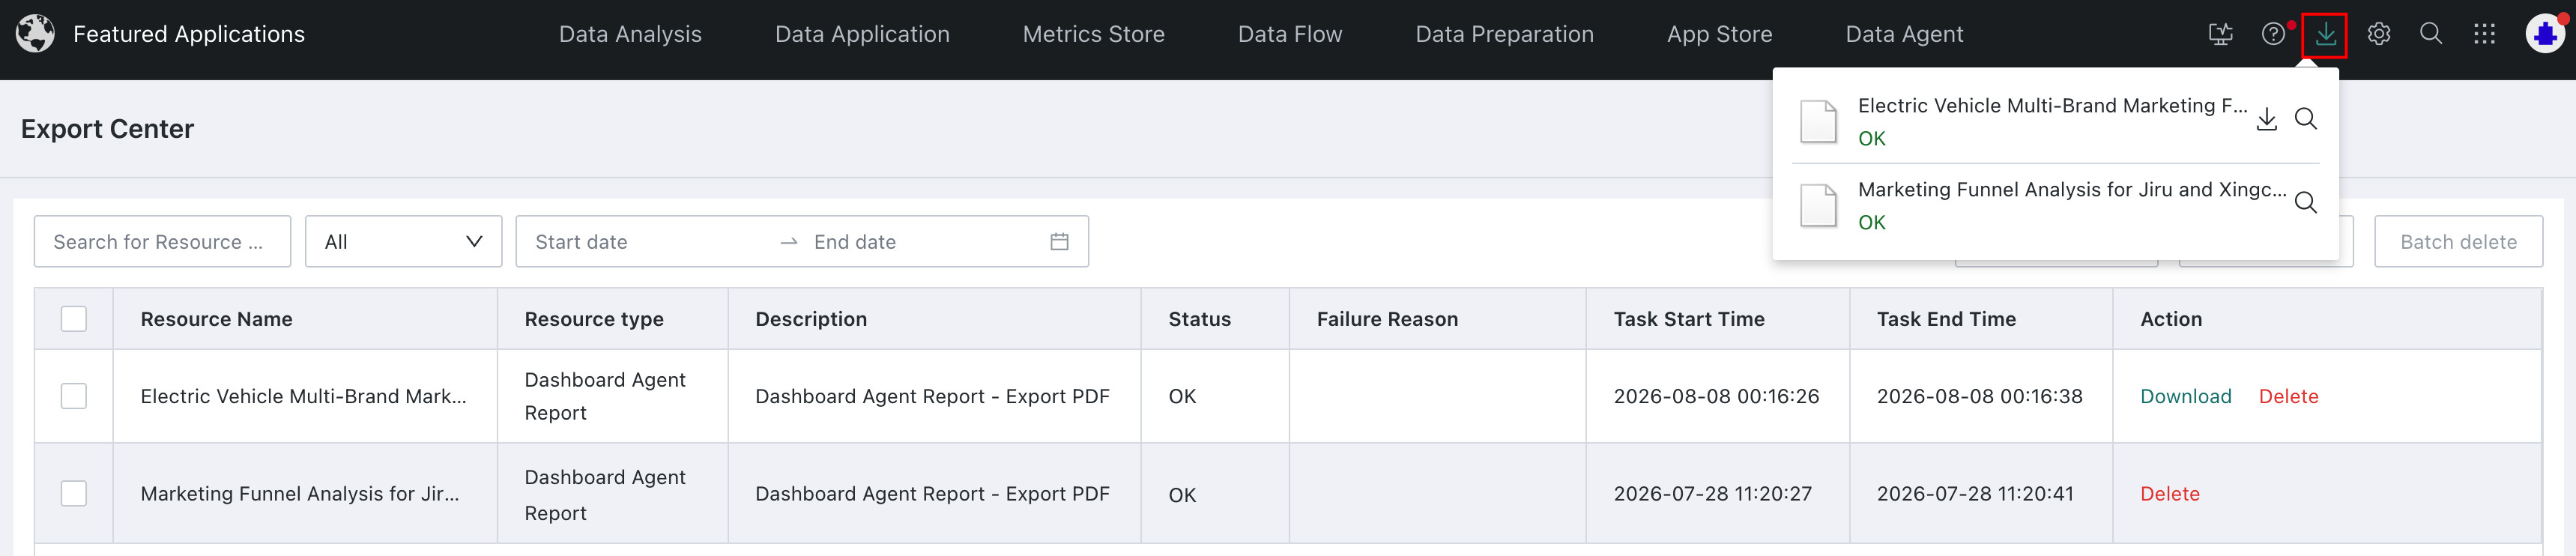
Click the export center entry at the top of the page to view the task status. After the task is complete, you can download or delete the exported report; the export center also supports filtering tasks by resource name, resource type, and submission date.
Edit Report
- Click
Editin the upper-right corner of the report to enter the report editing page. - Use the top toolbar to modify report content and format. Supports rich text editing features such as undo and redo, text styles, color, alignment, lists, indentation, links, quotes, and code.
- After editing, click
Saveto apply changes; clickExitto return to the report viewing page.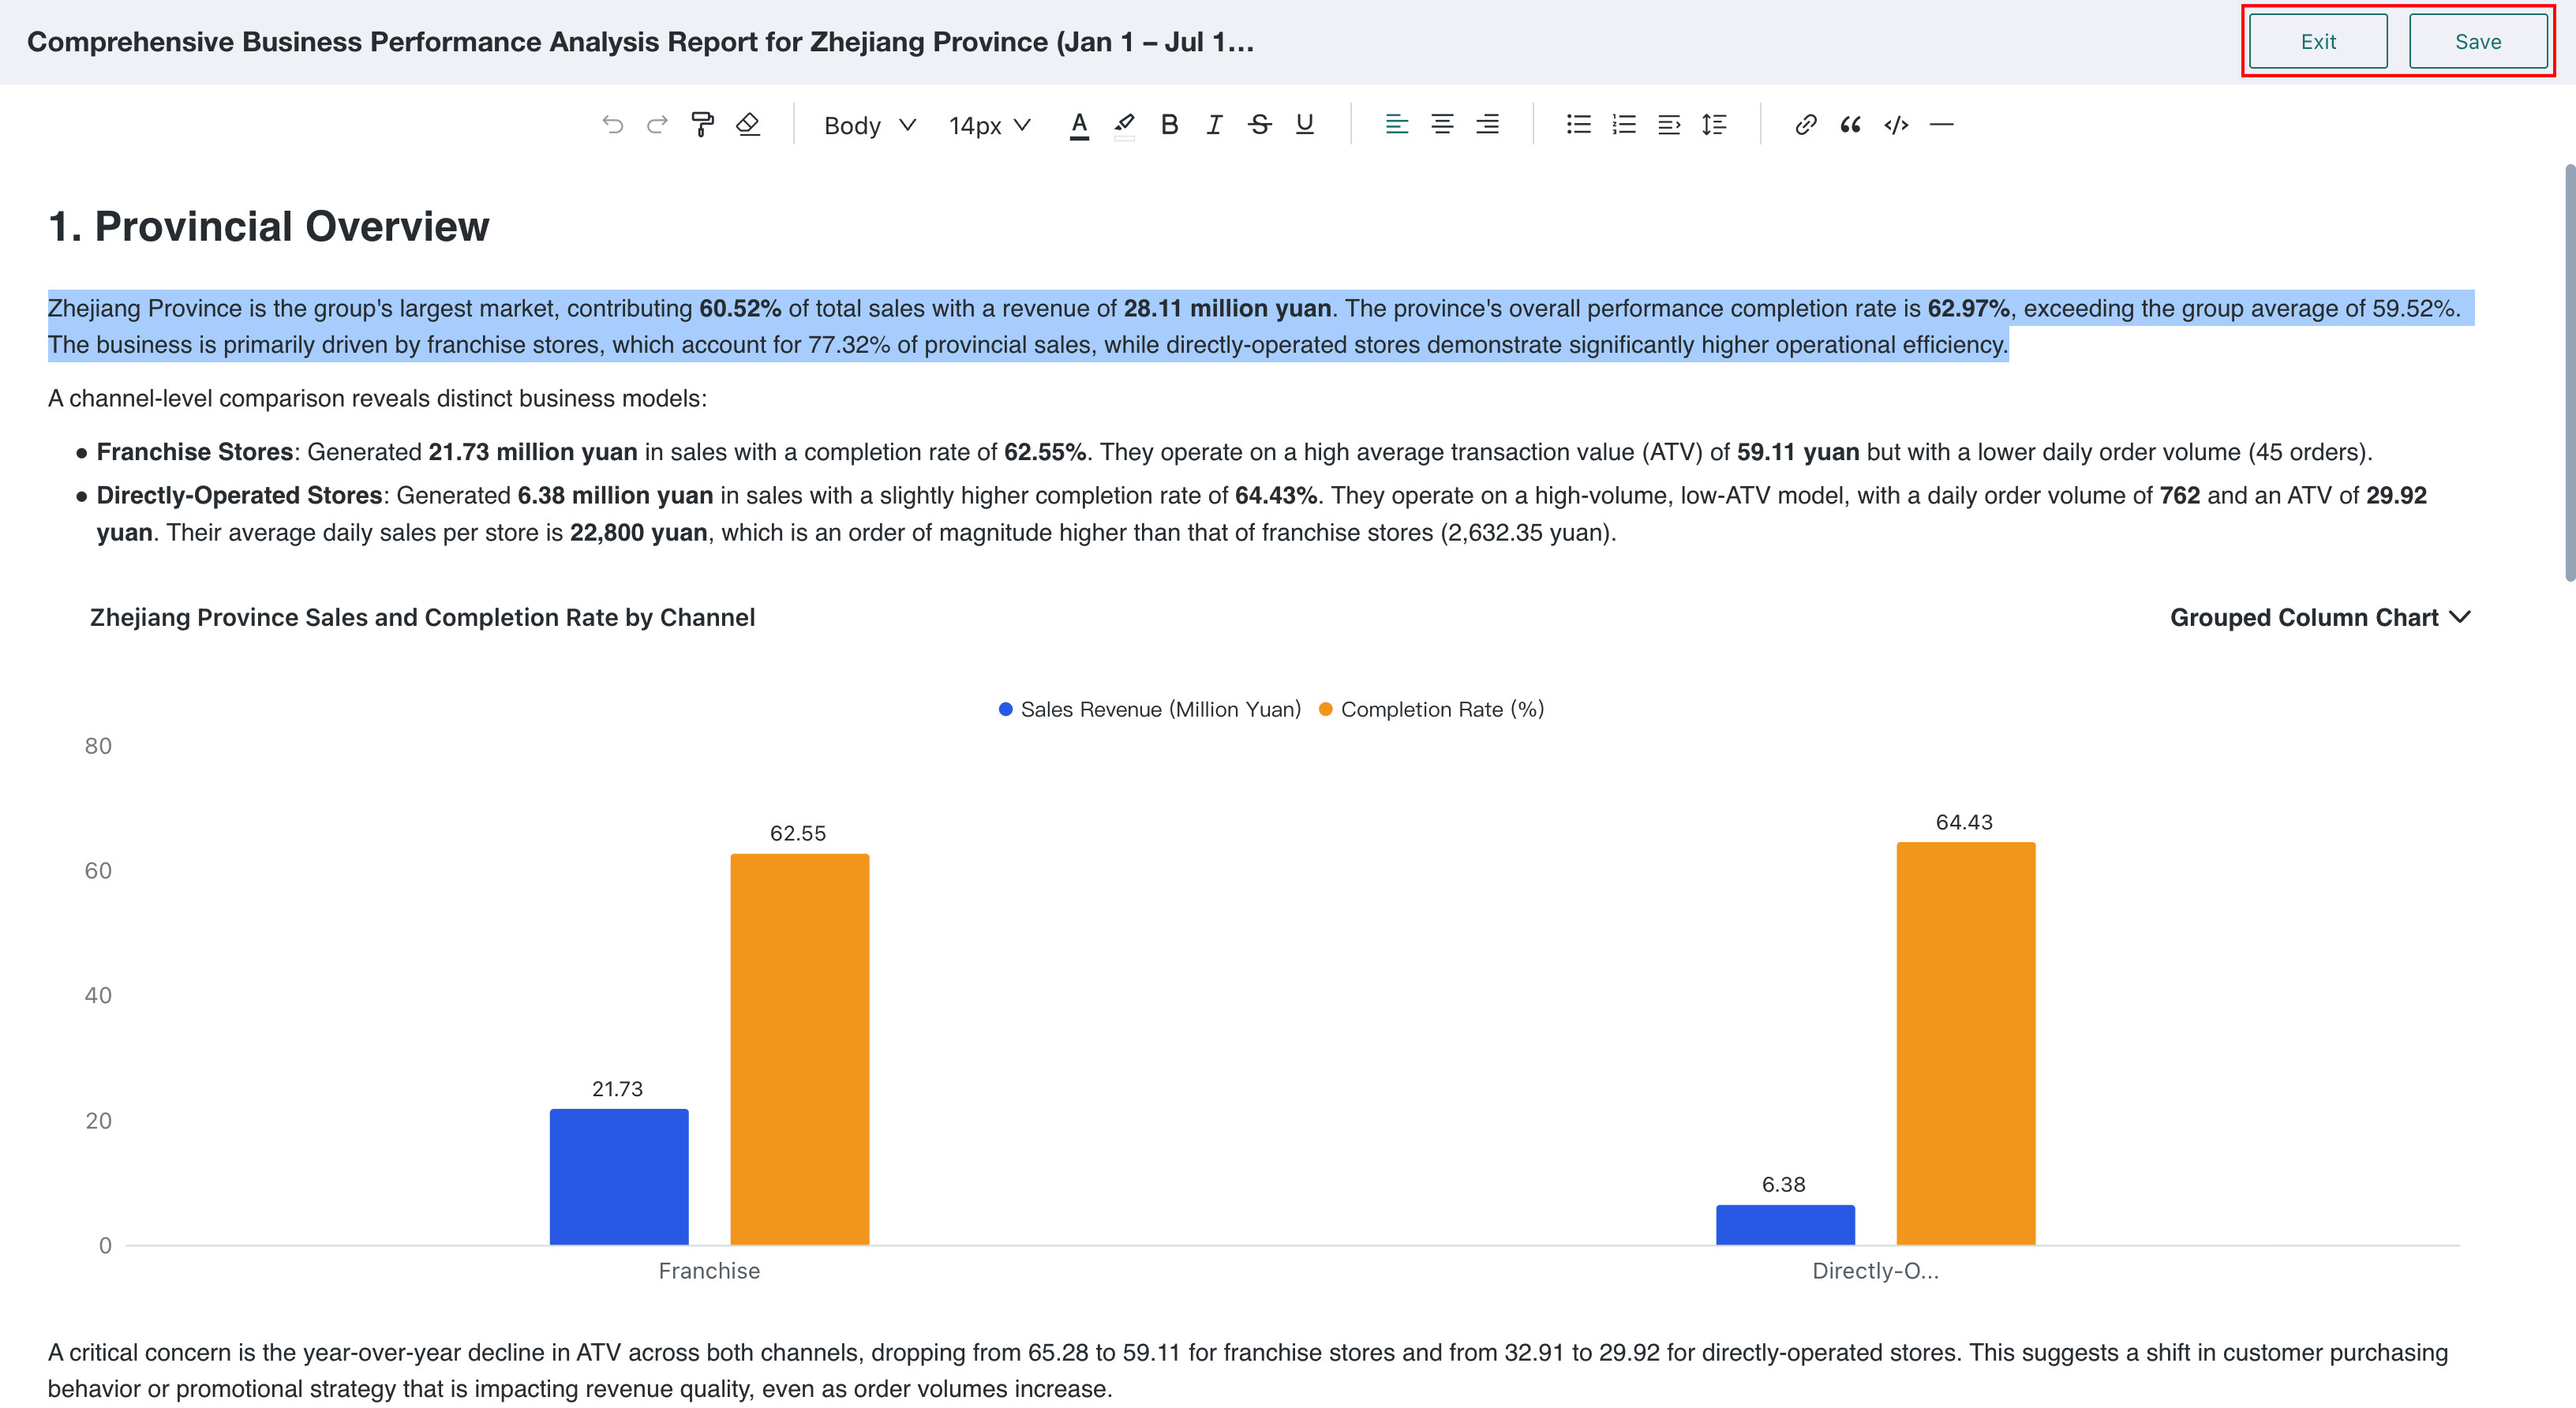
Multi-turn In-depth Follow-up Questions
Continue entering questions in the dialog box and click Send to ask multi-turn in-depth follow-up questions about the current Insight Conclusion.
During follow-up questions, you can still select an Expert or switch Experts at any time to handle flexible, open-ended question paths.