Group By
Overview
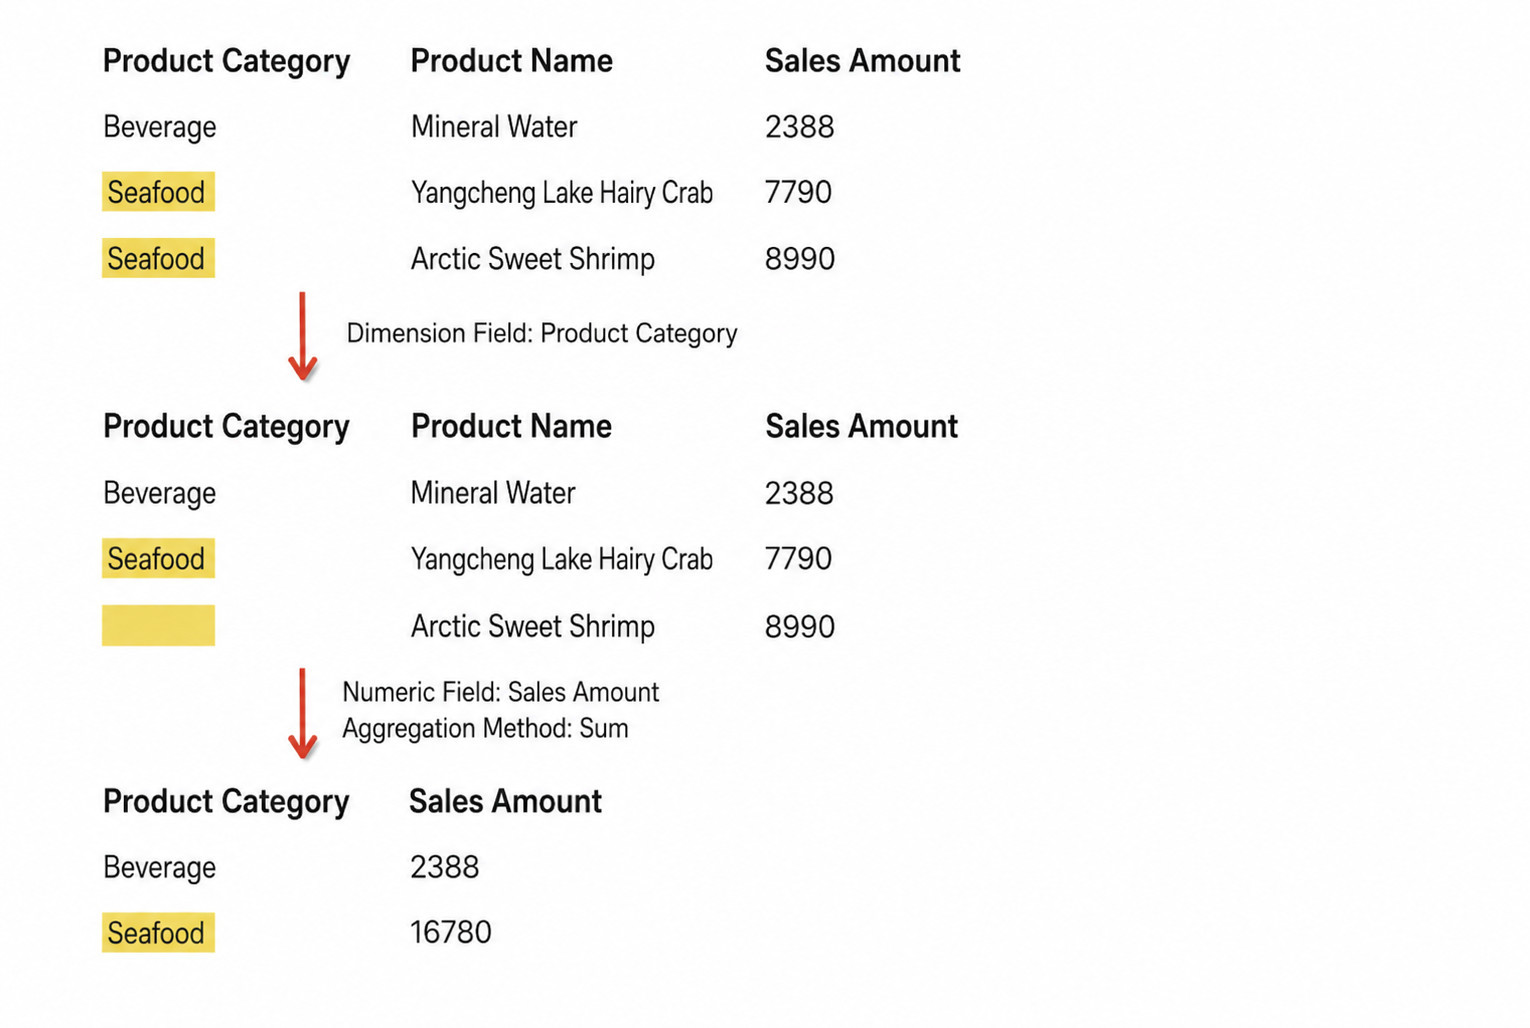
Group By processes measure values based on one or more dimensions and aggregates multiple rows into one row by dimension. When multiple dimensions are selected, aggregation is performed at the most granular dimension level.
For example, in retail sales analysis, data with the same product category can be grouped together and the corresponding total sales amount can be calculated.
Procedure
-
Drag the
Group Byoperator from the dataflow operator panel into the canvas on the right.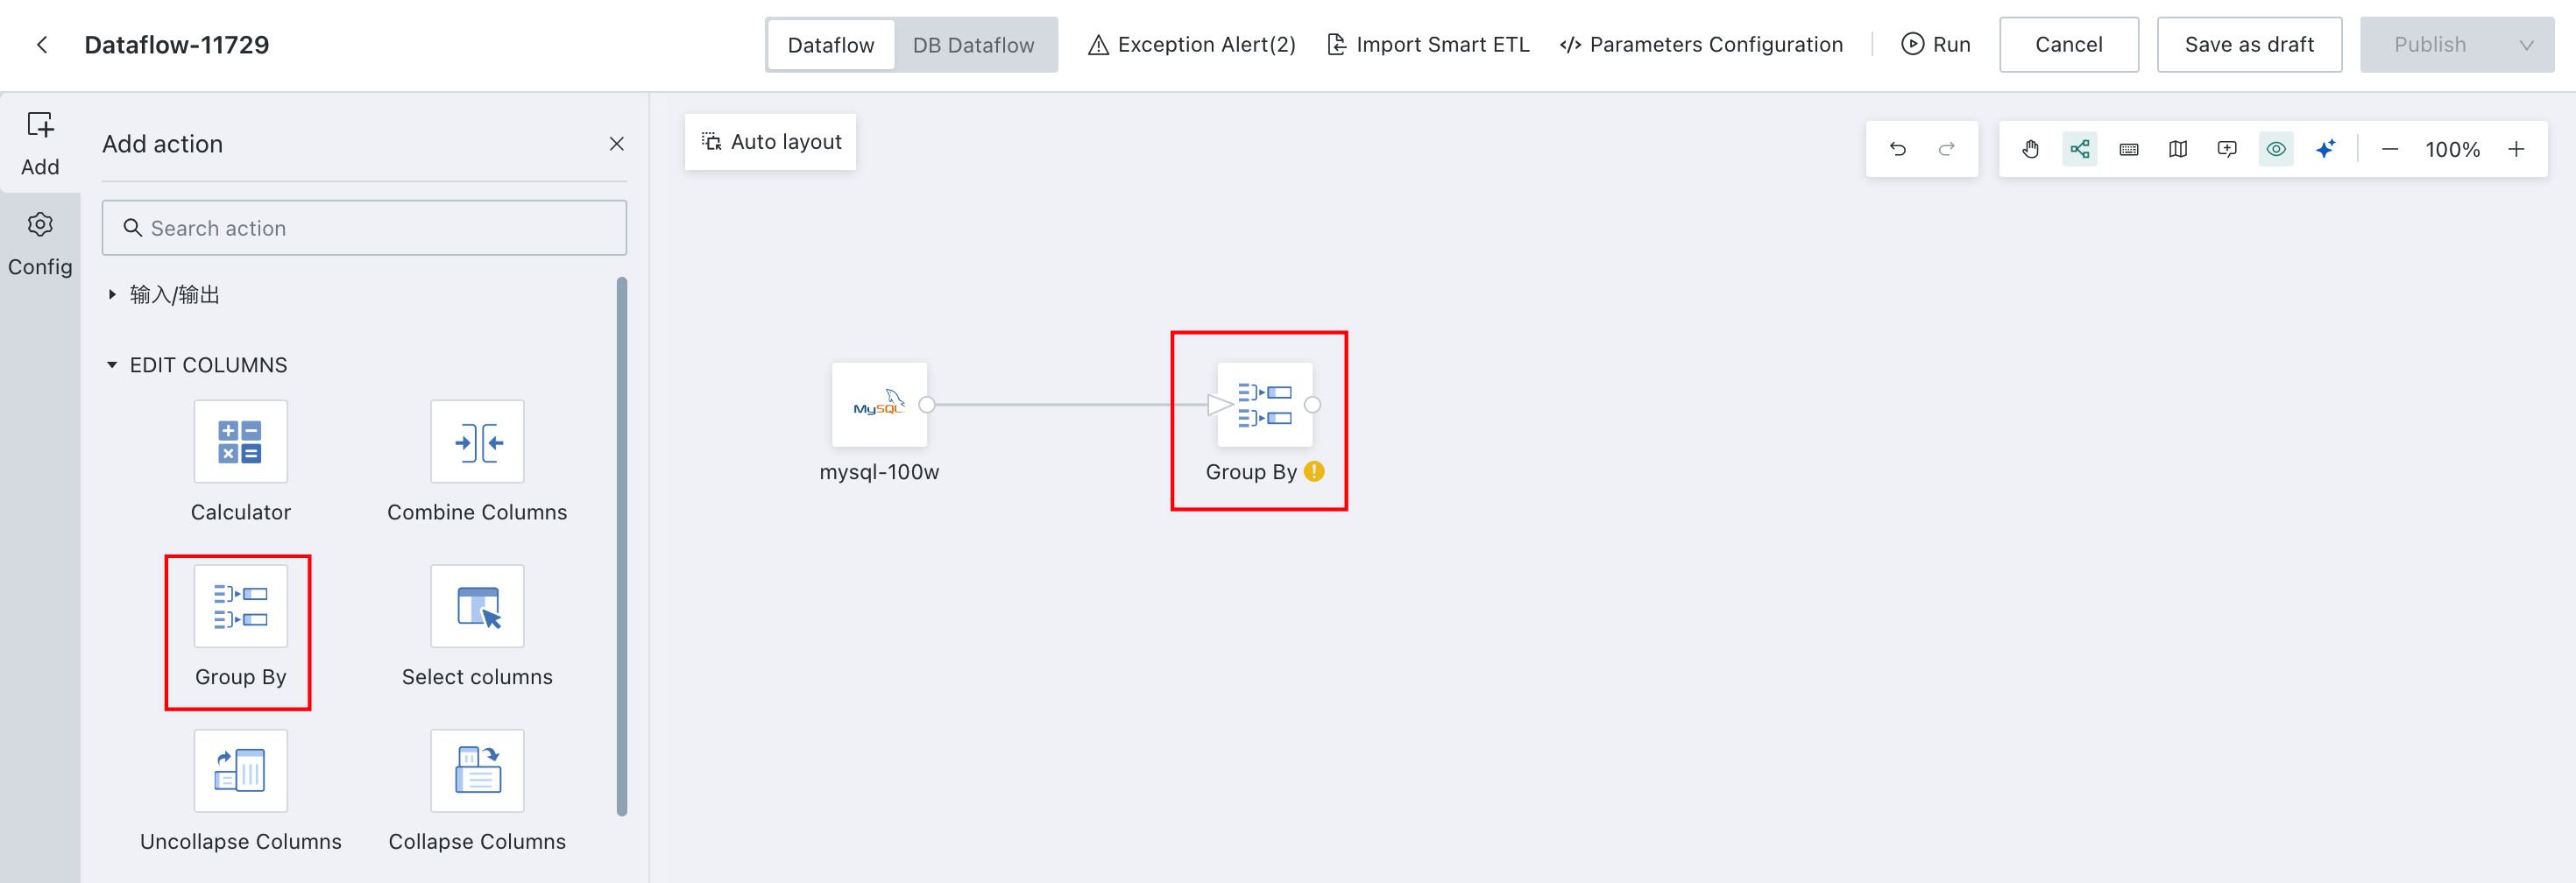
-
Click the
Group Byoperator and drag fields into theDimensionsarea and theMetricsarea.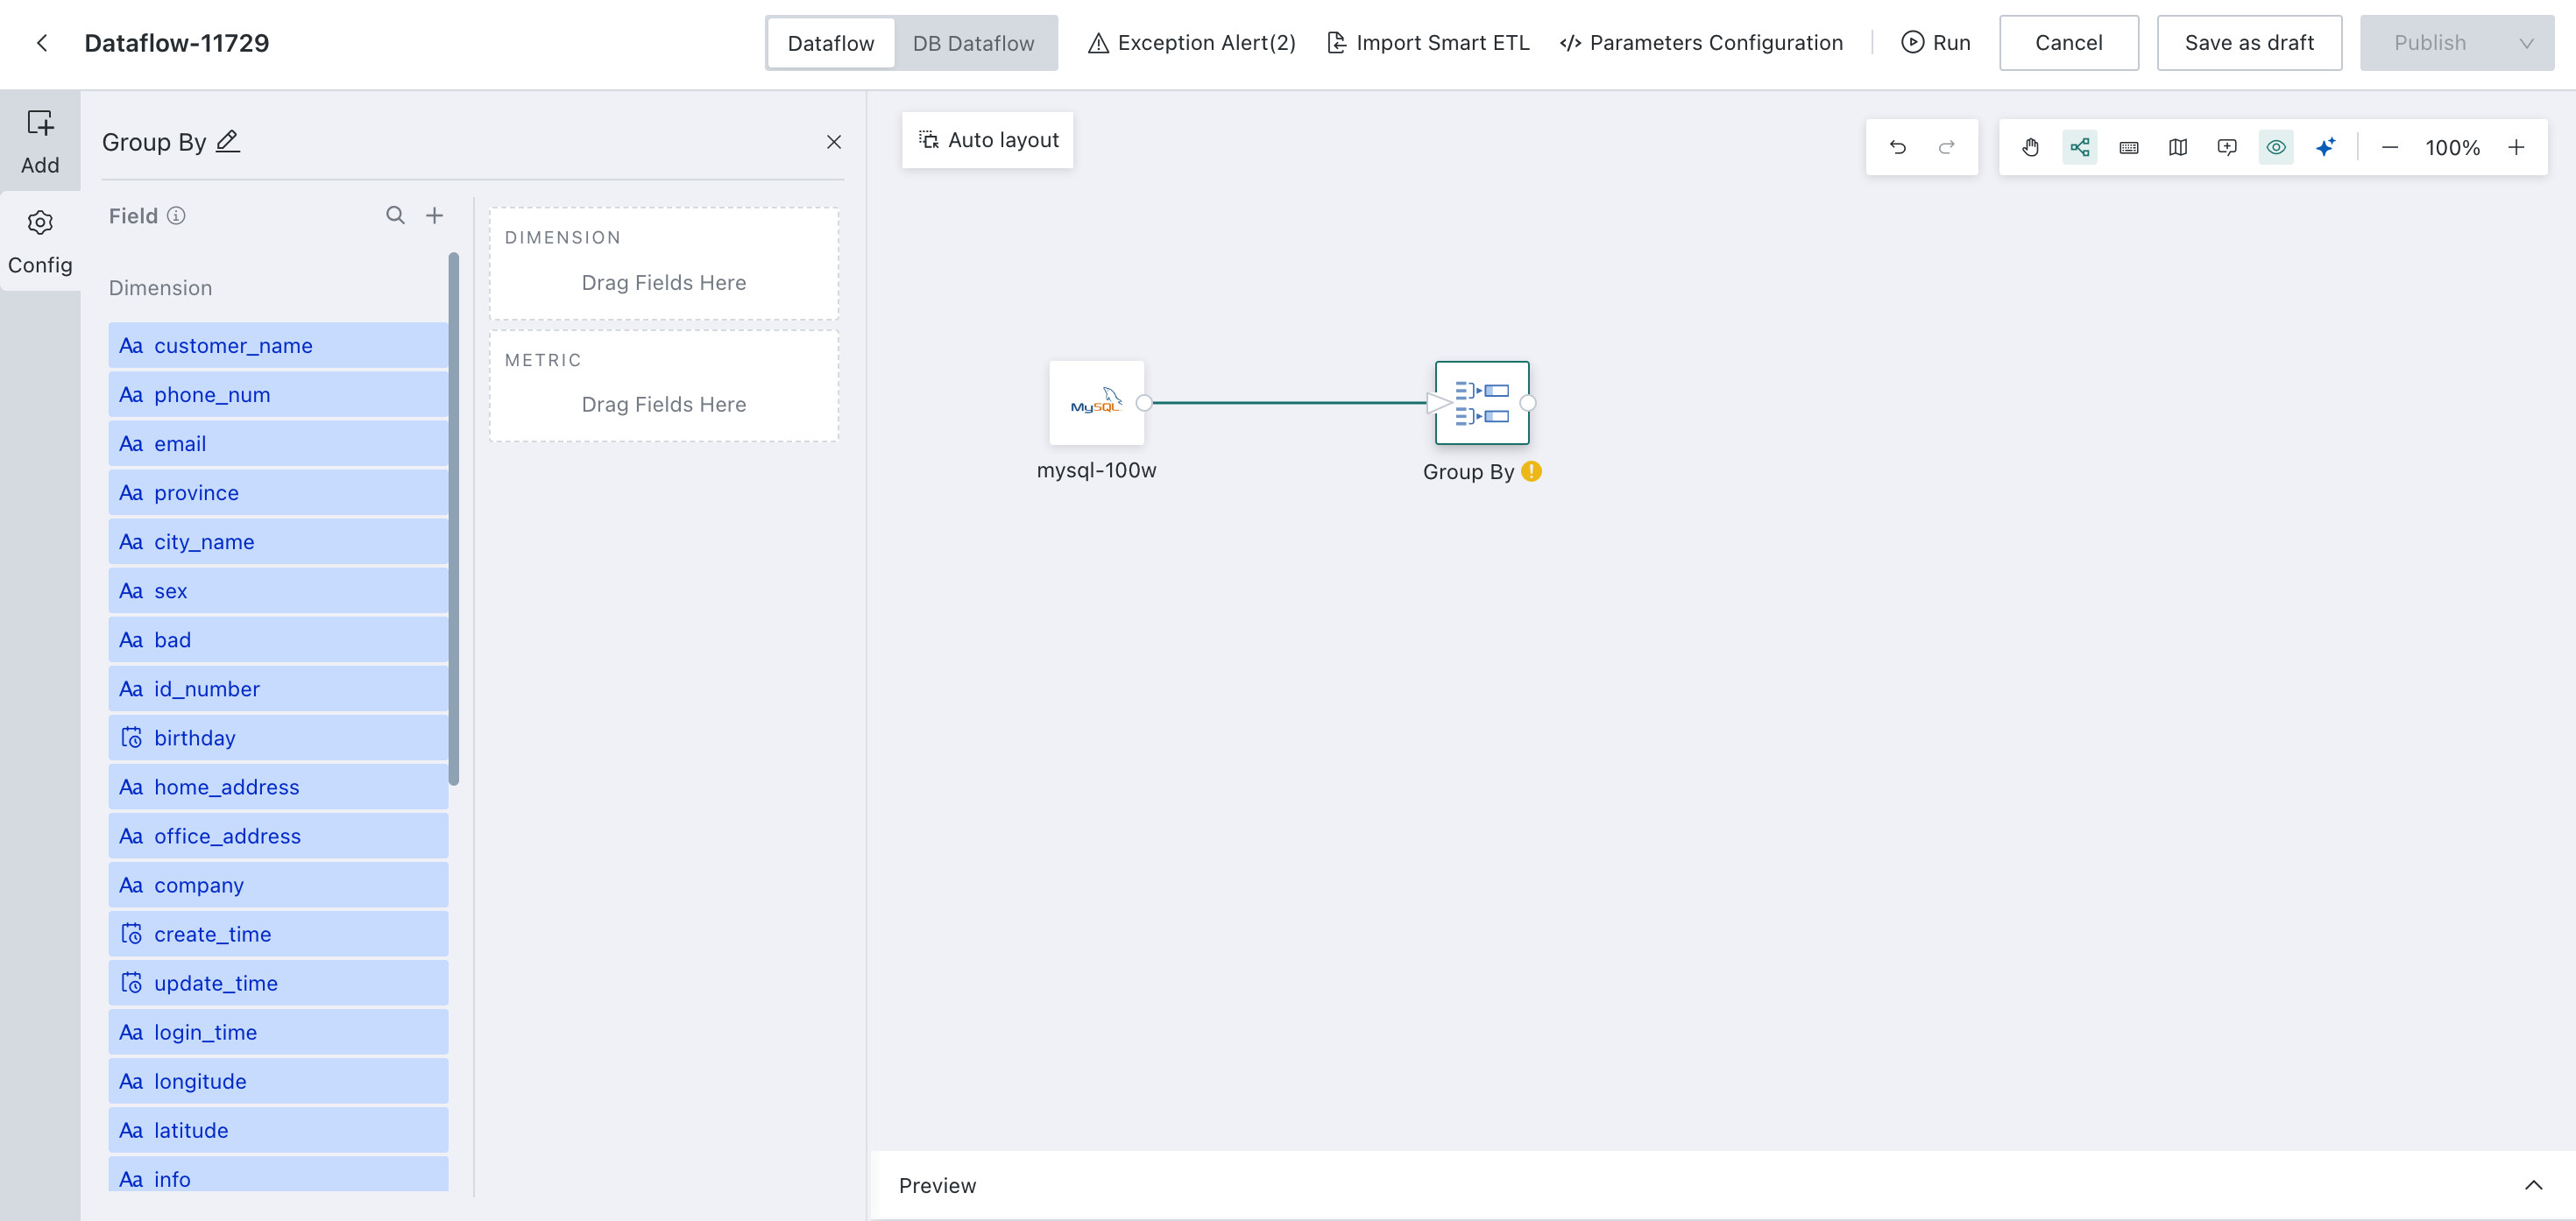
-
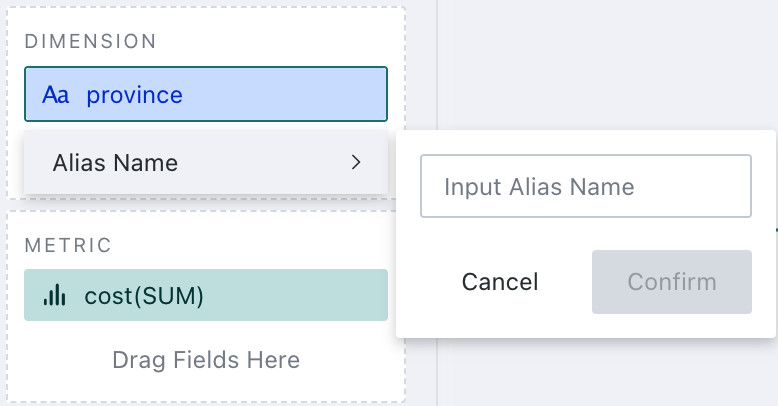
Click the dragged field, set a field alias if needed, and choose an aggregation method.
-
Click
Previewon the current node to confirm the result.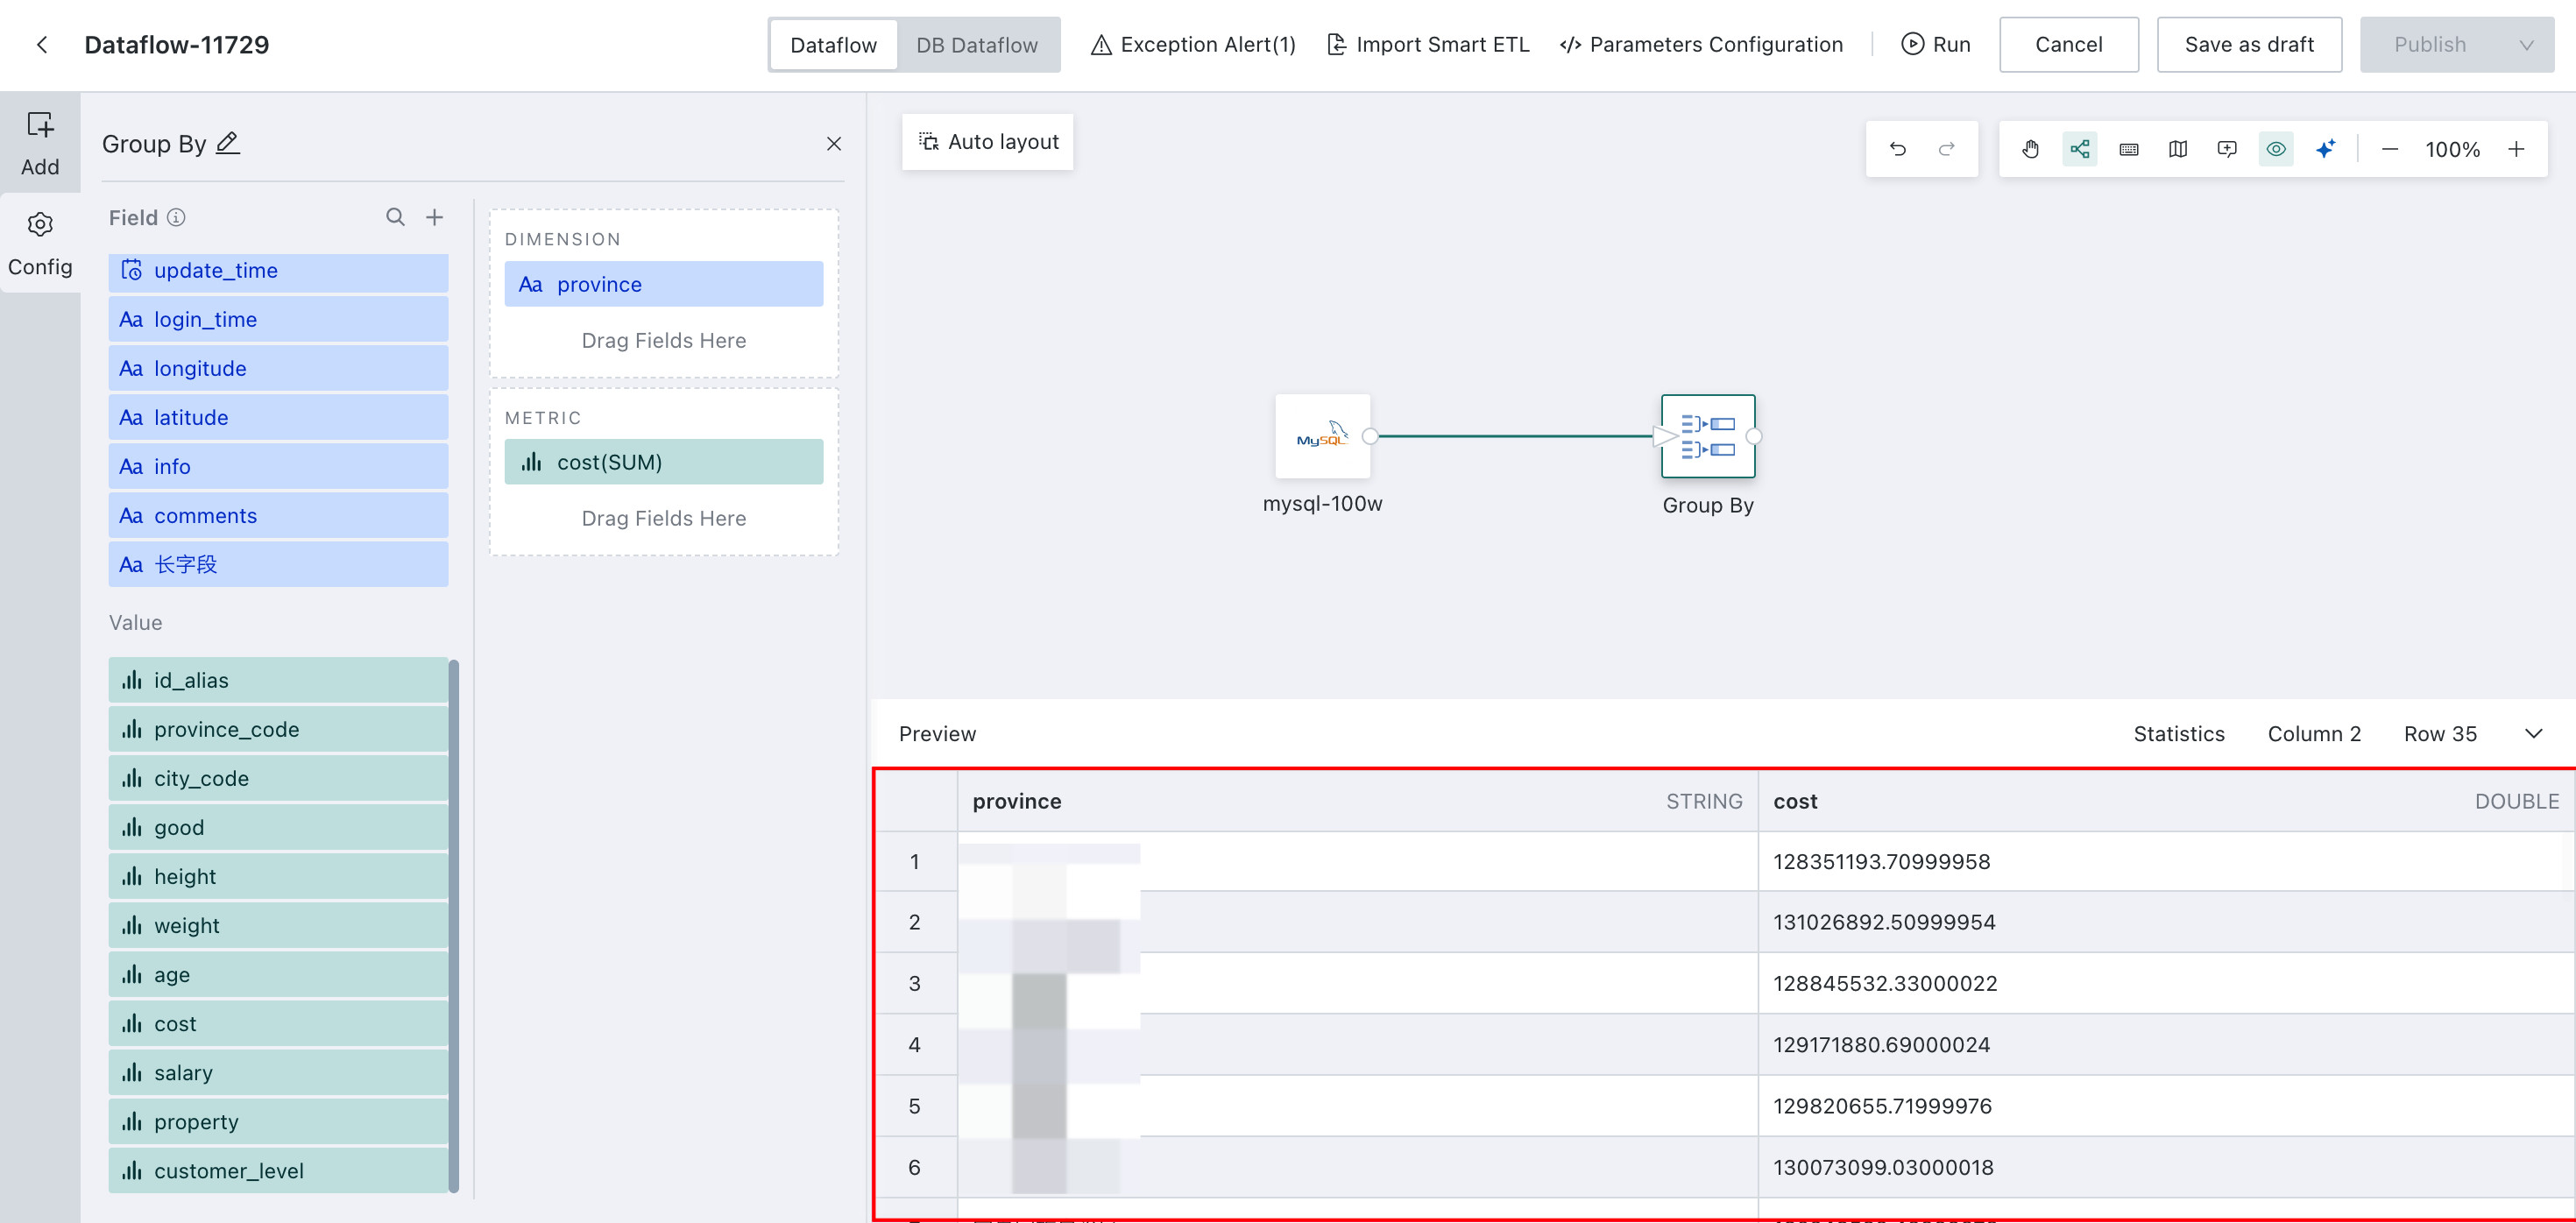
Example
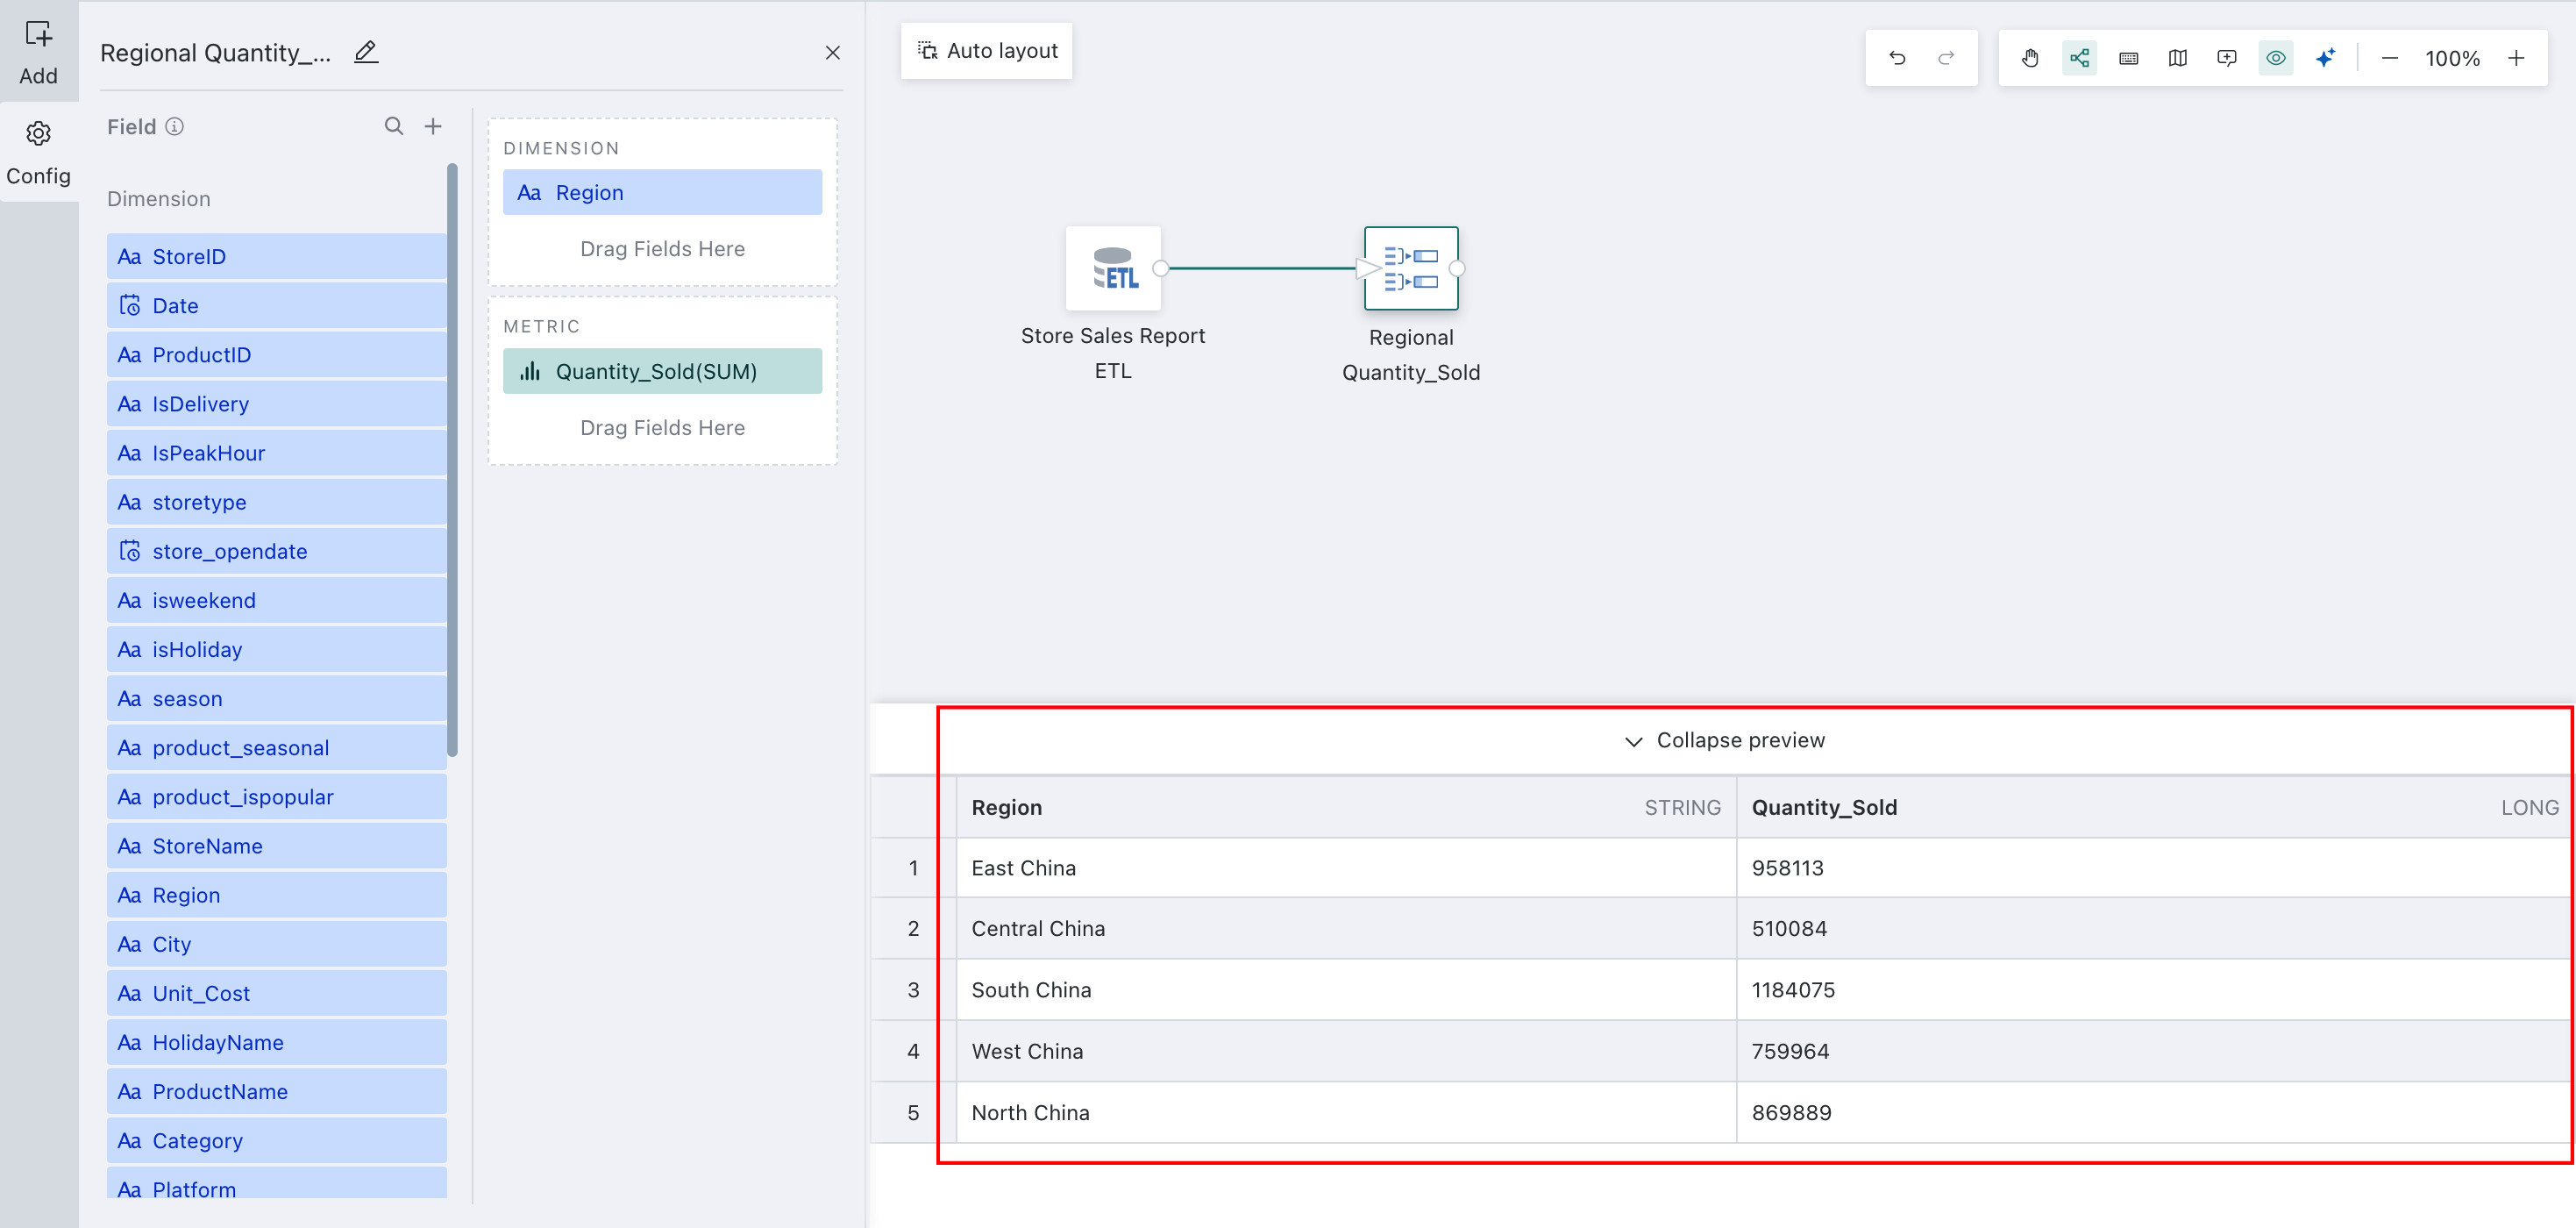
The following example shows how to configure Regional Revenue.
Aggregate sales quantities by store region and group them together. Preview before aggregation:
-
Drag the
Group Byoperator from the ETL operator area to the canvas on the right and connect it to the upstream node. -
Click the
Group Byoperator. The left panel becomes the current operator configuration area. Rename it based on business needs, for exampleRegional Quantity_Sold.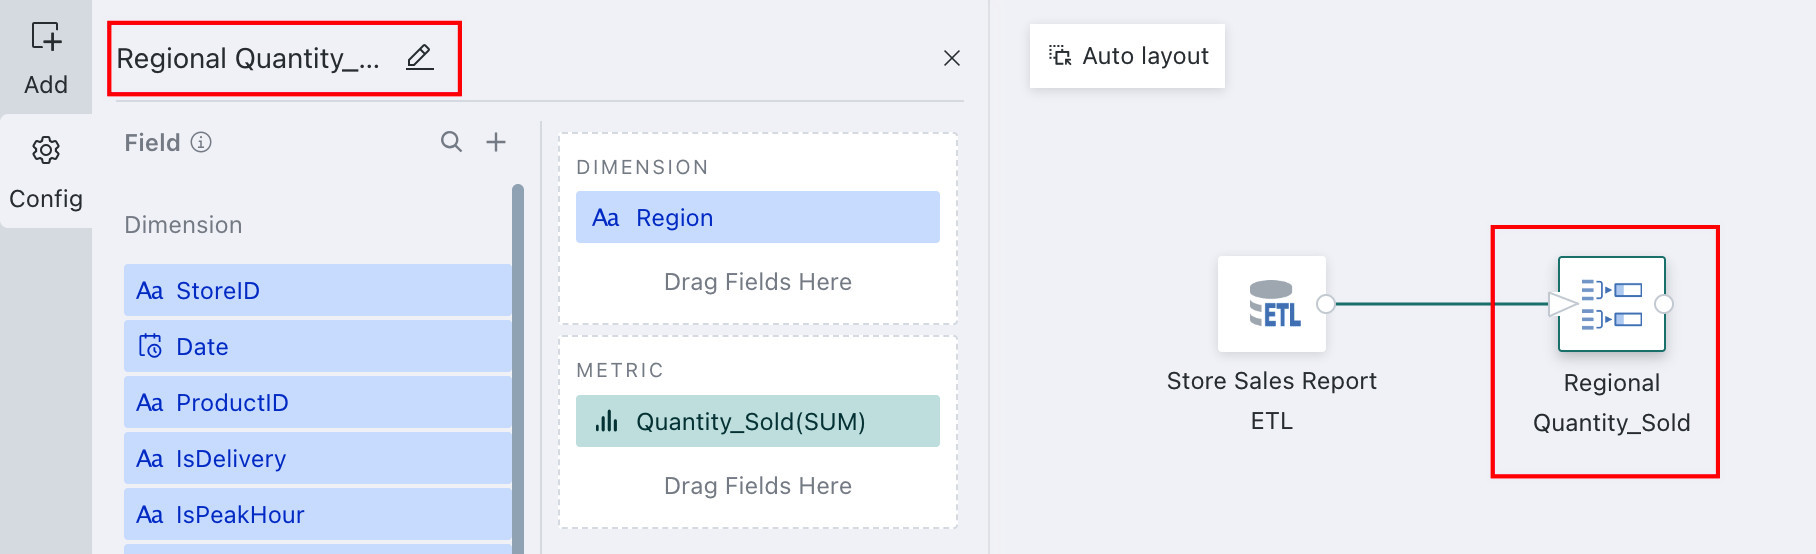
-
Drag
Regioninto theDimensionssection, then click the field and configure its alias as needed.NoteThe default aggregation for fields in the
Measuressection isCountfor text fields andSumfor numeric fields.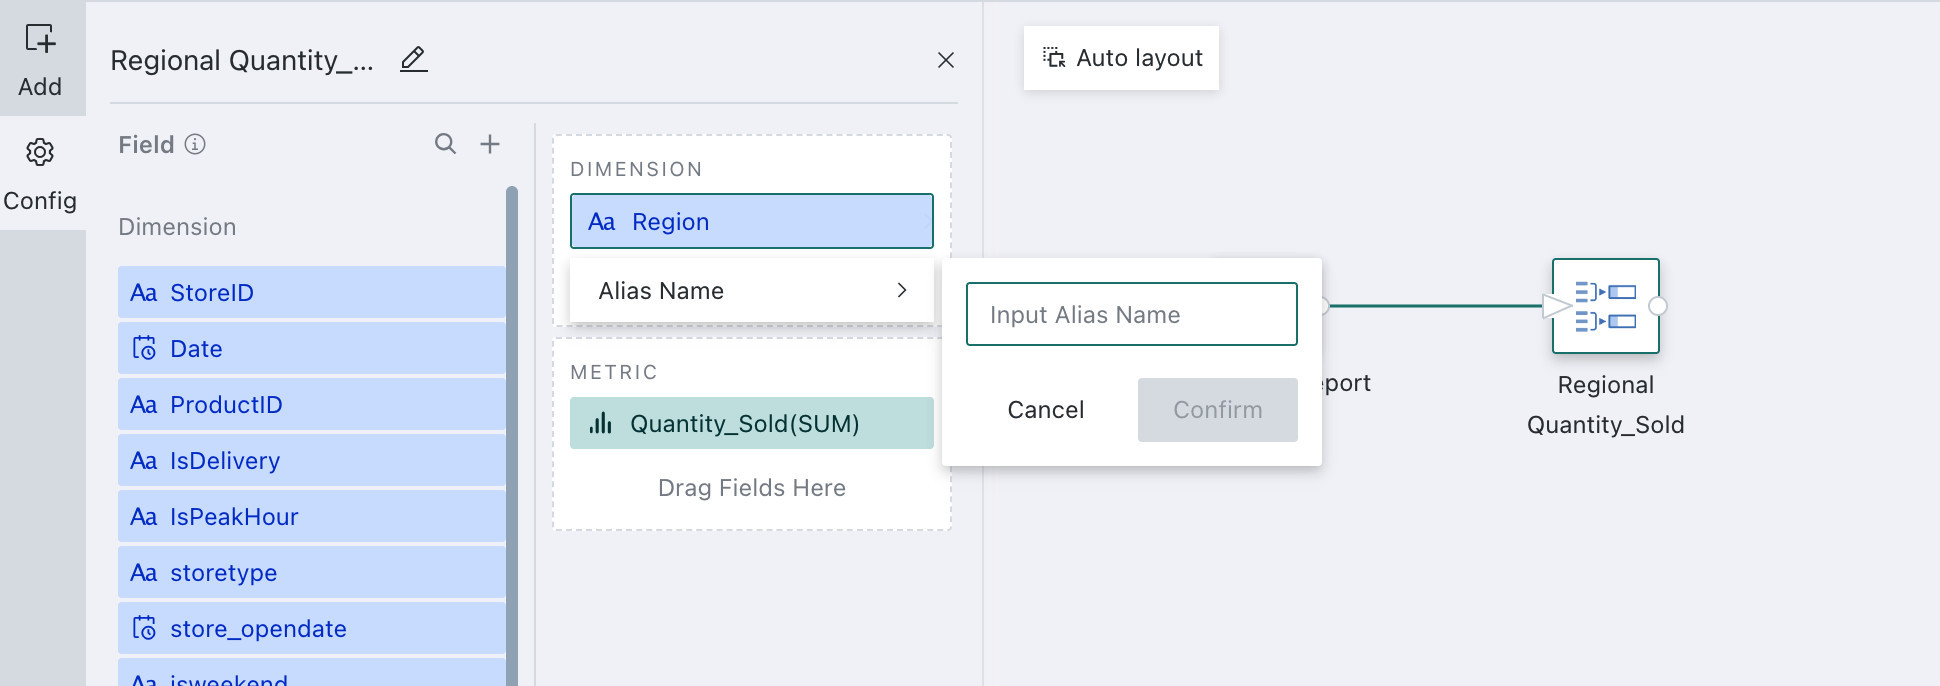
-
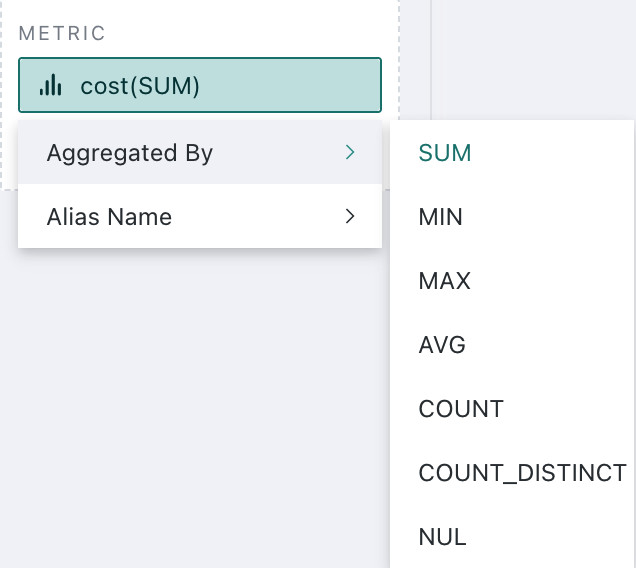
Drag
Quantity_Soldinto theMetricsection, click the field, chooseSumas the aggregation method, and configure the field alias if needed.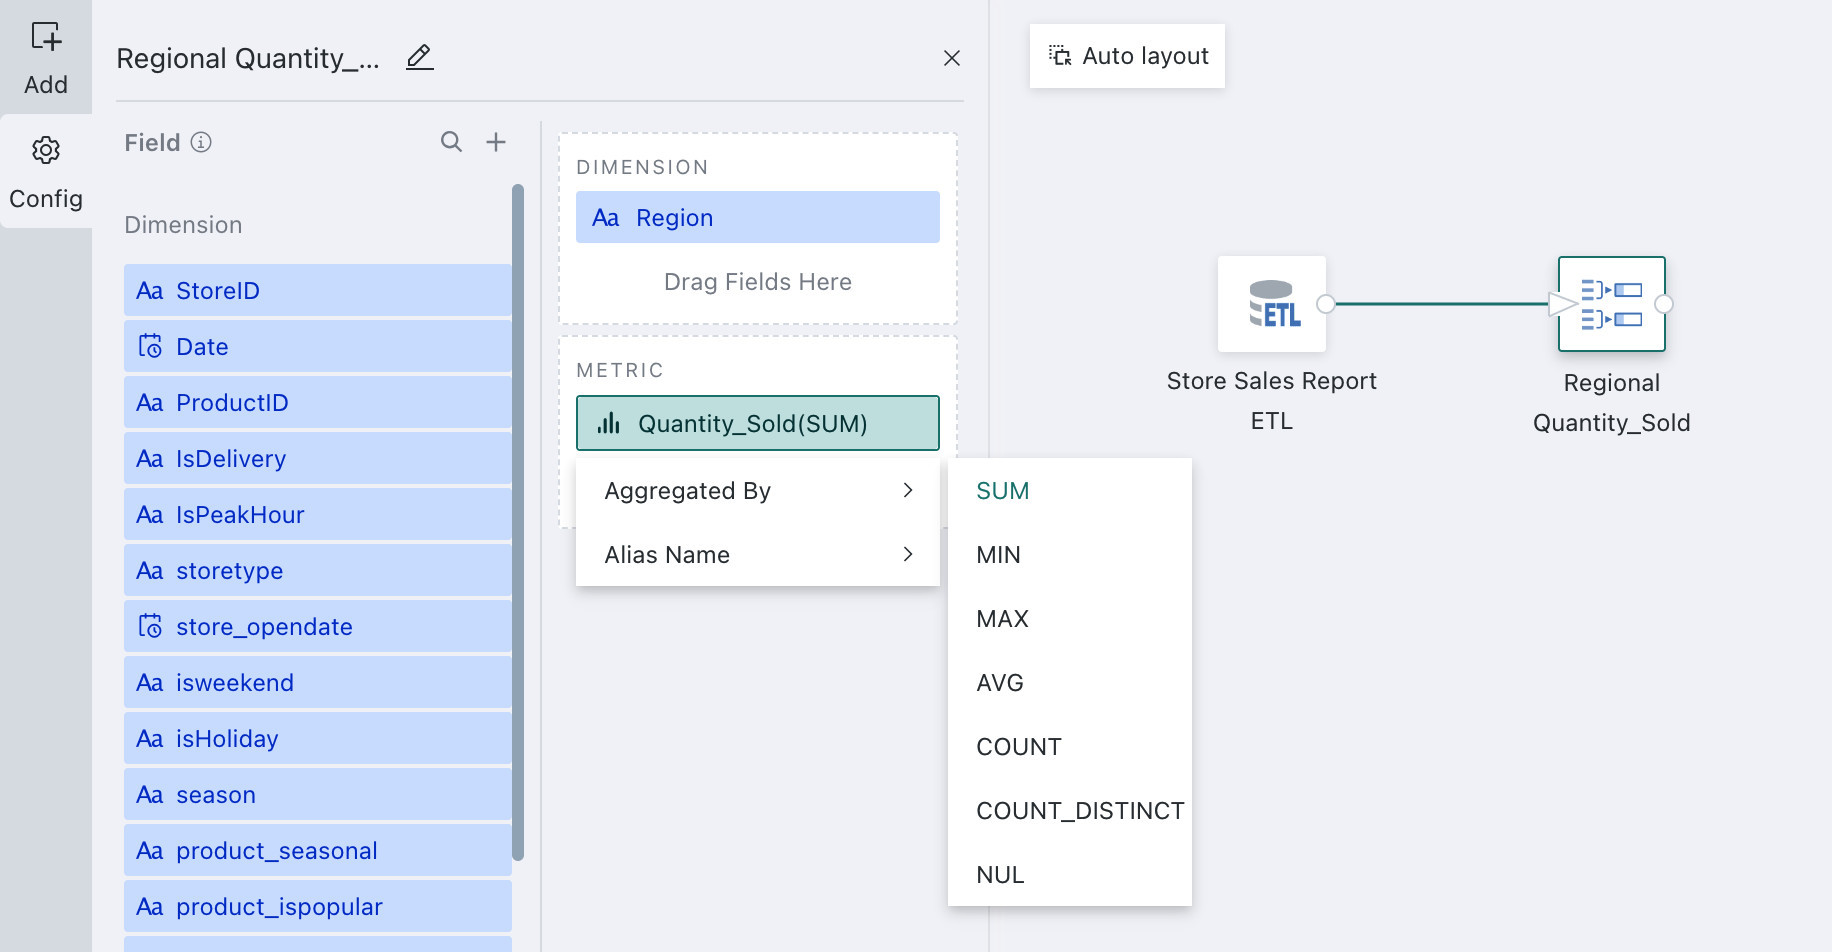
Seven aggregation methods are supported, including
Sum,Minimum, andMaximum, as shown below.
| Aggregation Method | Purpose | Scenario | Example |
|---|---|---|---|
| Sum | Add measure values under a specified dimension and calculate the total | When measure values are additive | Monthly total sales, daily website visits |
| Minimum | Retrieve the minimum measure value under a specified dimension | When the measure has a minimum concept | Lowest selling price per product, monthly minimum temperature |
| Maximum | Retrieve the maximum measure value under a specified dimension | When the measure has a maximum concept | Highest selling price per product, monthly maximum temperature |
| Average | Calculate the average measure value under a specified dimension | When the measure can be averaged | Average monthly sales, average weekly user logins |
| Count | Count the number of records under a specified dimension | When you need the number of records under a dimension | Number of records under a given dimension |
| Distinct Count | Count distinct records under a specified dimension | When you need the number of different values under a dimension | Monthly sales count by distinct products, distinct customer count per region |
| None | - | - | - |
-
Click
Previewto preview the data result and ensure the aggregated data matches expectations and does not contain errors or abnormal values.