Best Practices
Dashboard Design Best Practices
1. Semantic Clarification: Make Good Use of Card Titles and Card Information
Core Principle: Card titles and card information are the first entry point for large models to understand business, and must follow the principle of "clear semantics, clear dimensions", avoiding semantic ambiguity or information overload.
- Implementation Points
- Title Uniqueness: Card titles within the same dashboard need to be named differently.
- Information Structuring: The card information area needs to supplement background such as analysis caliber and calculation logic.
- Avoidance Guide
| Avoid | Recommendation |
|---|---|
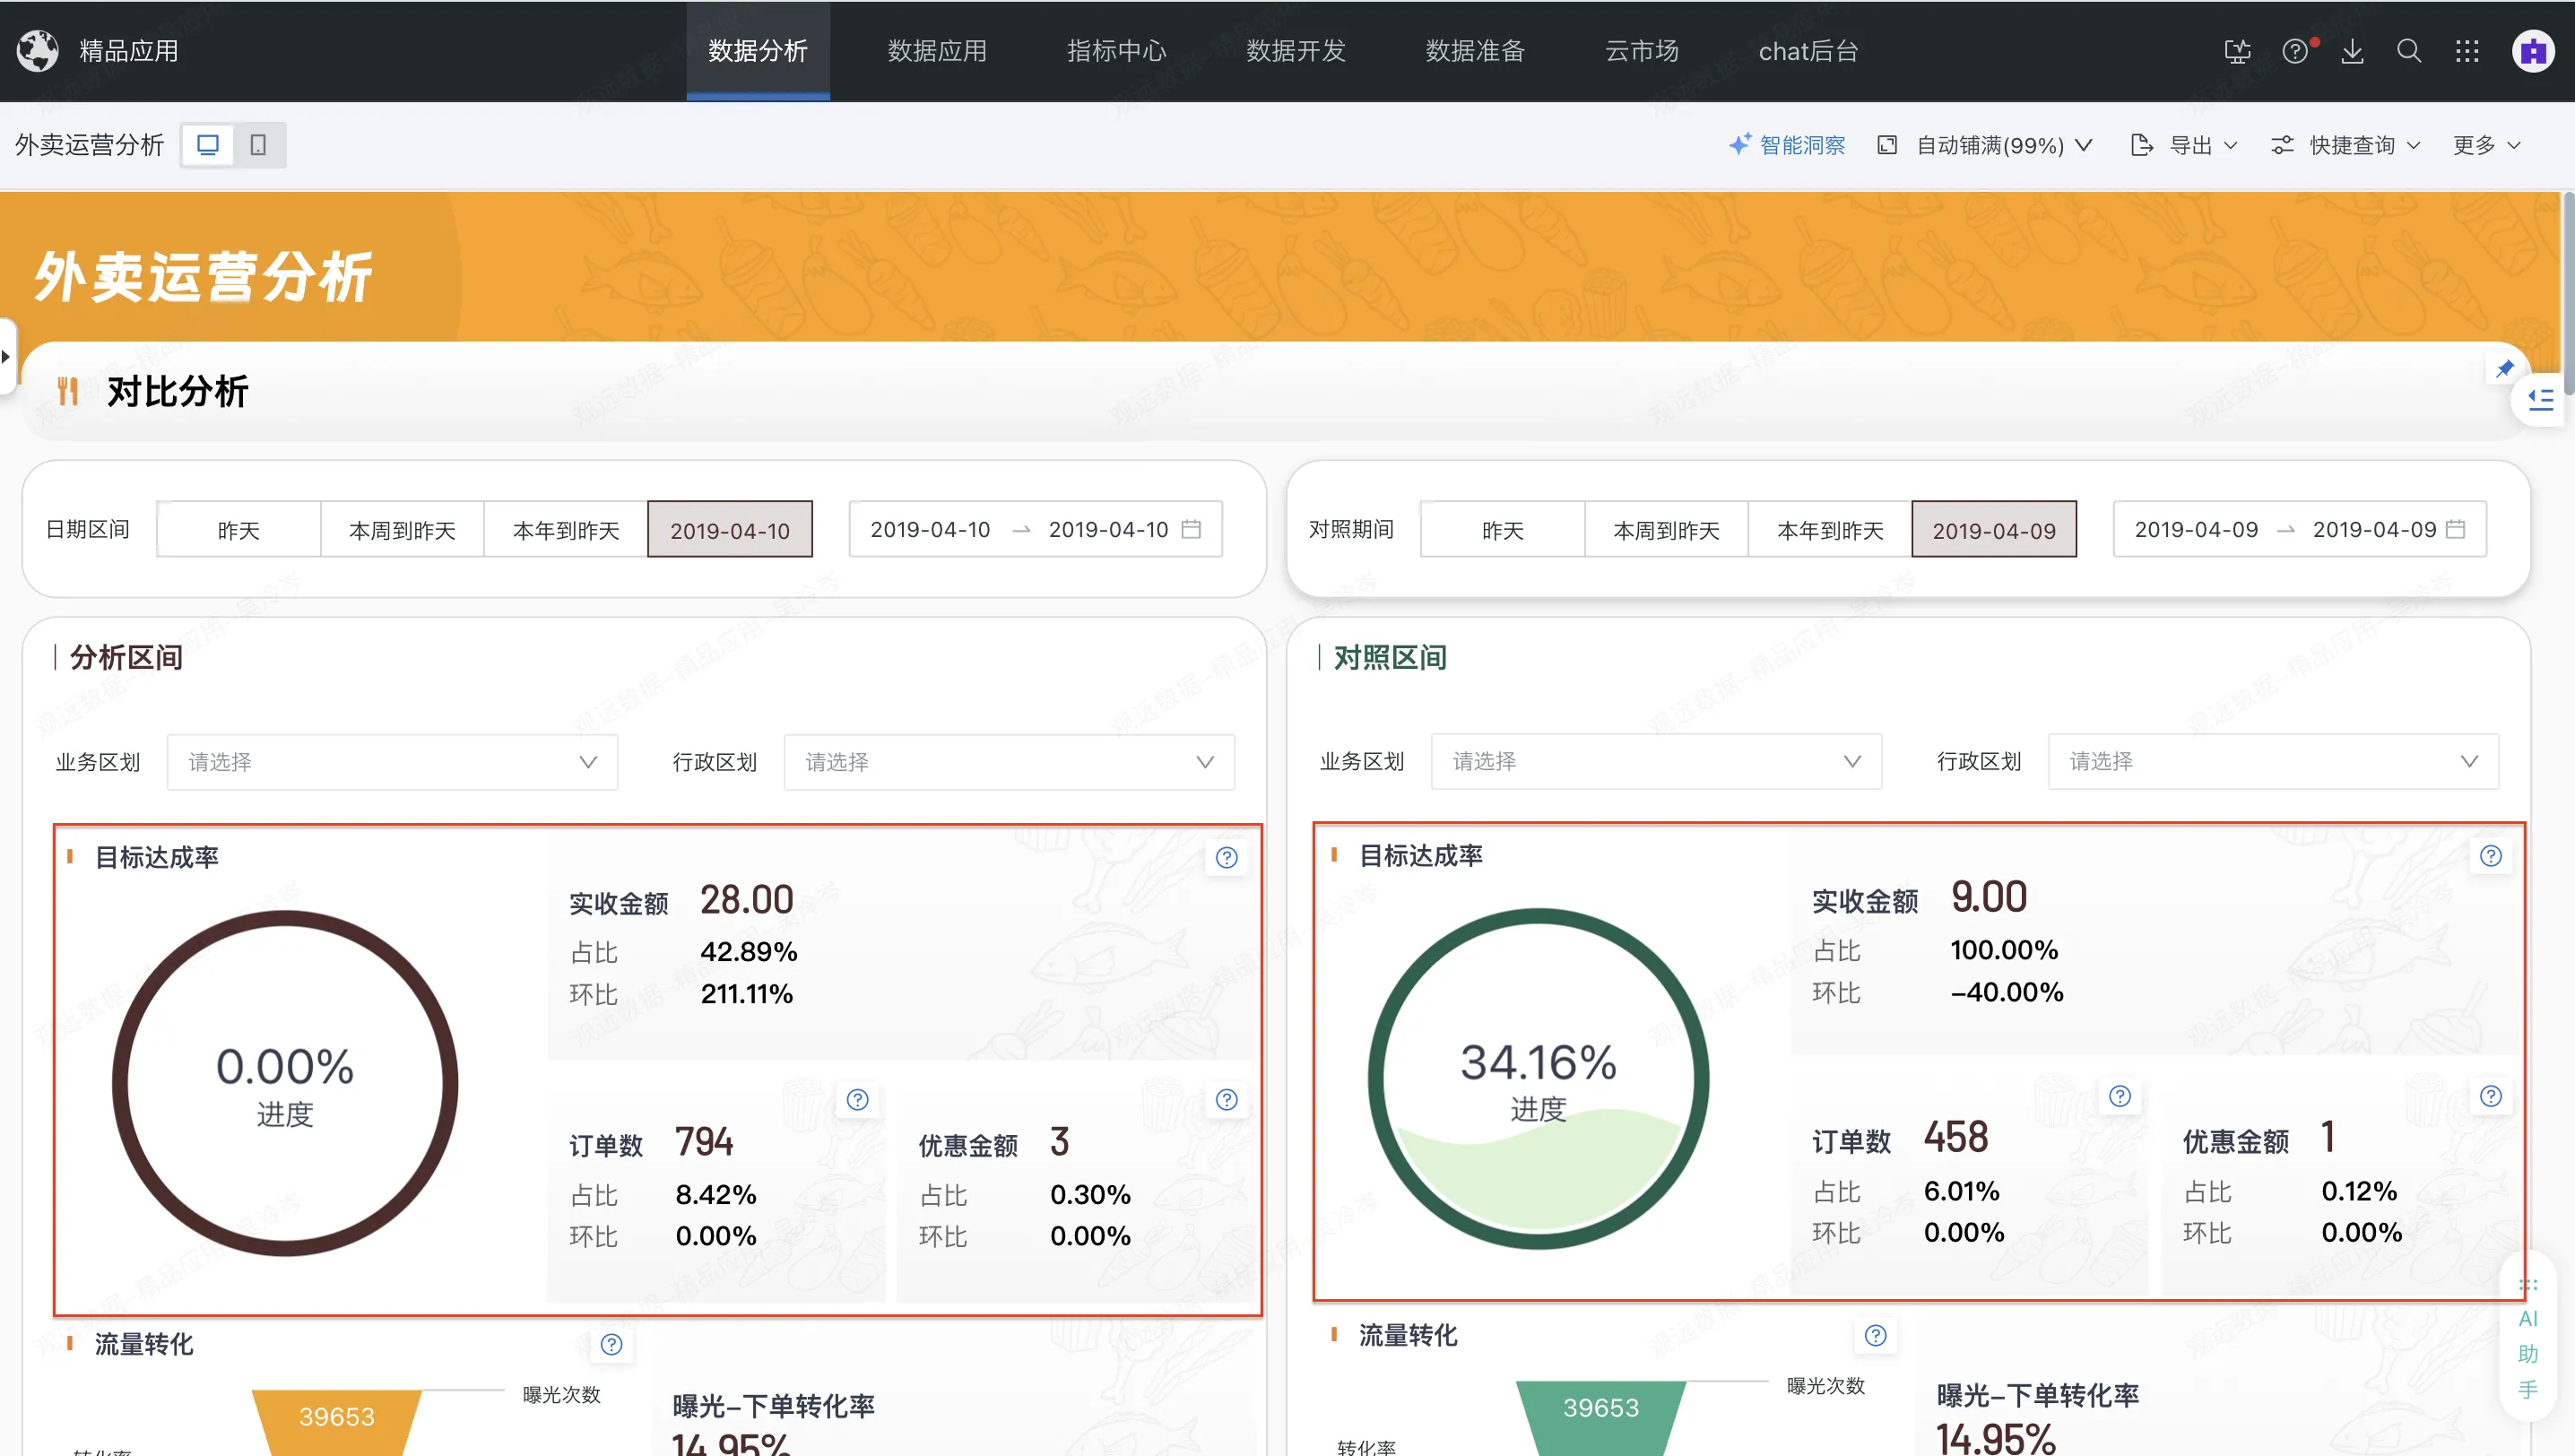
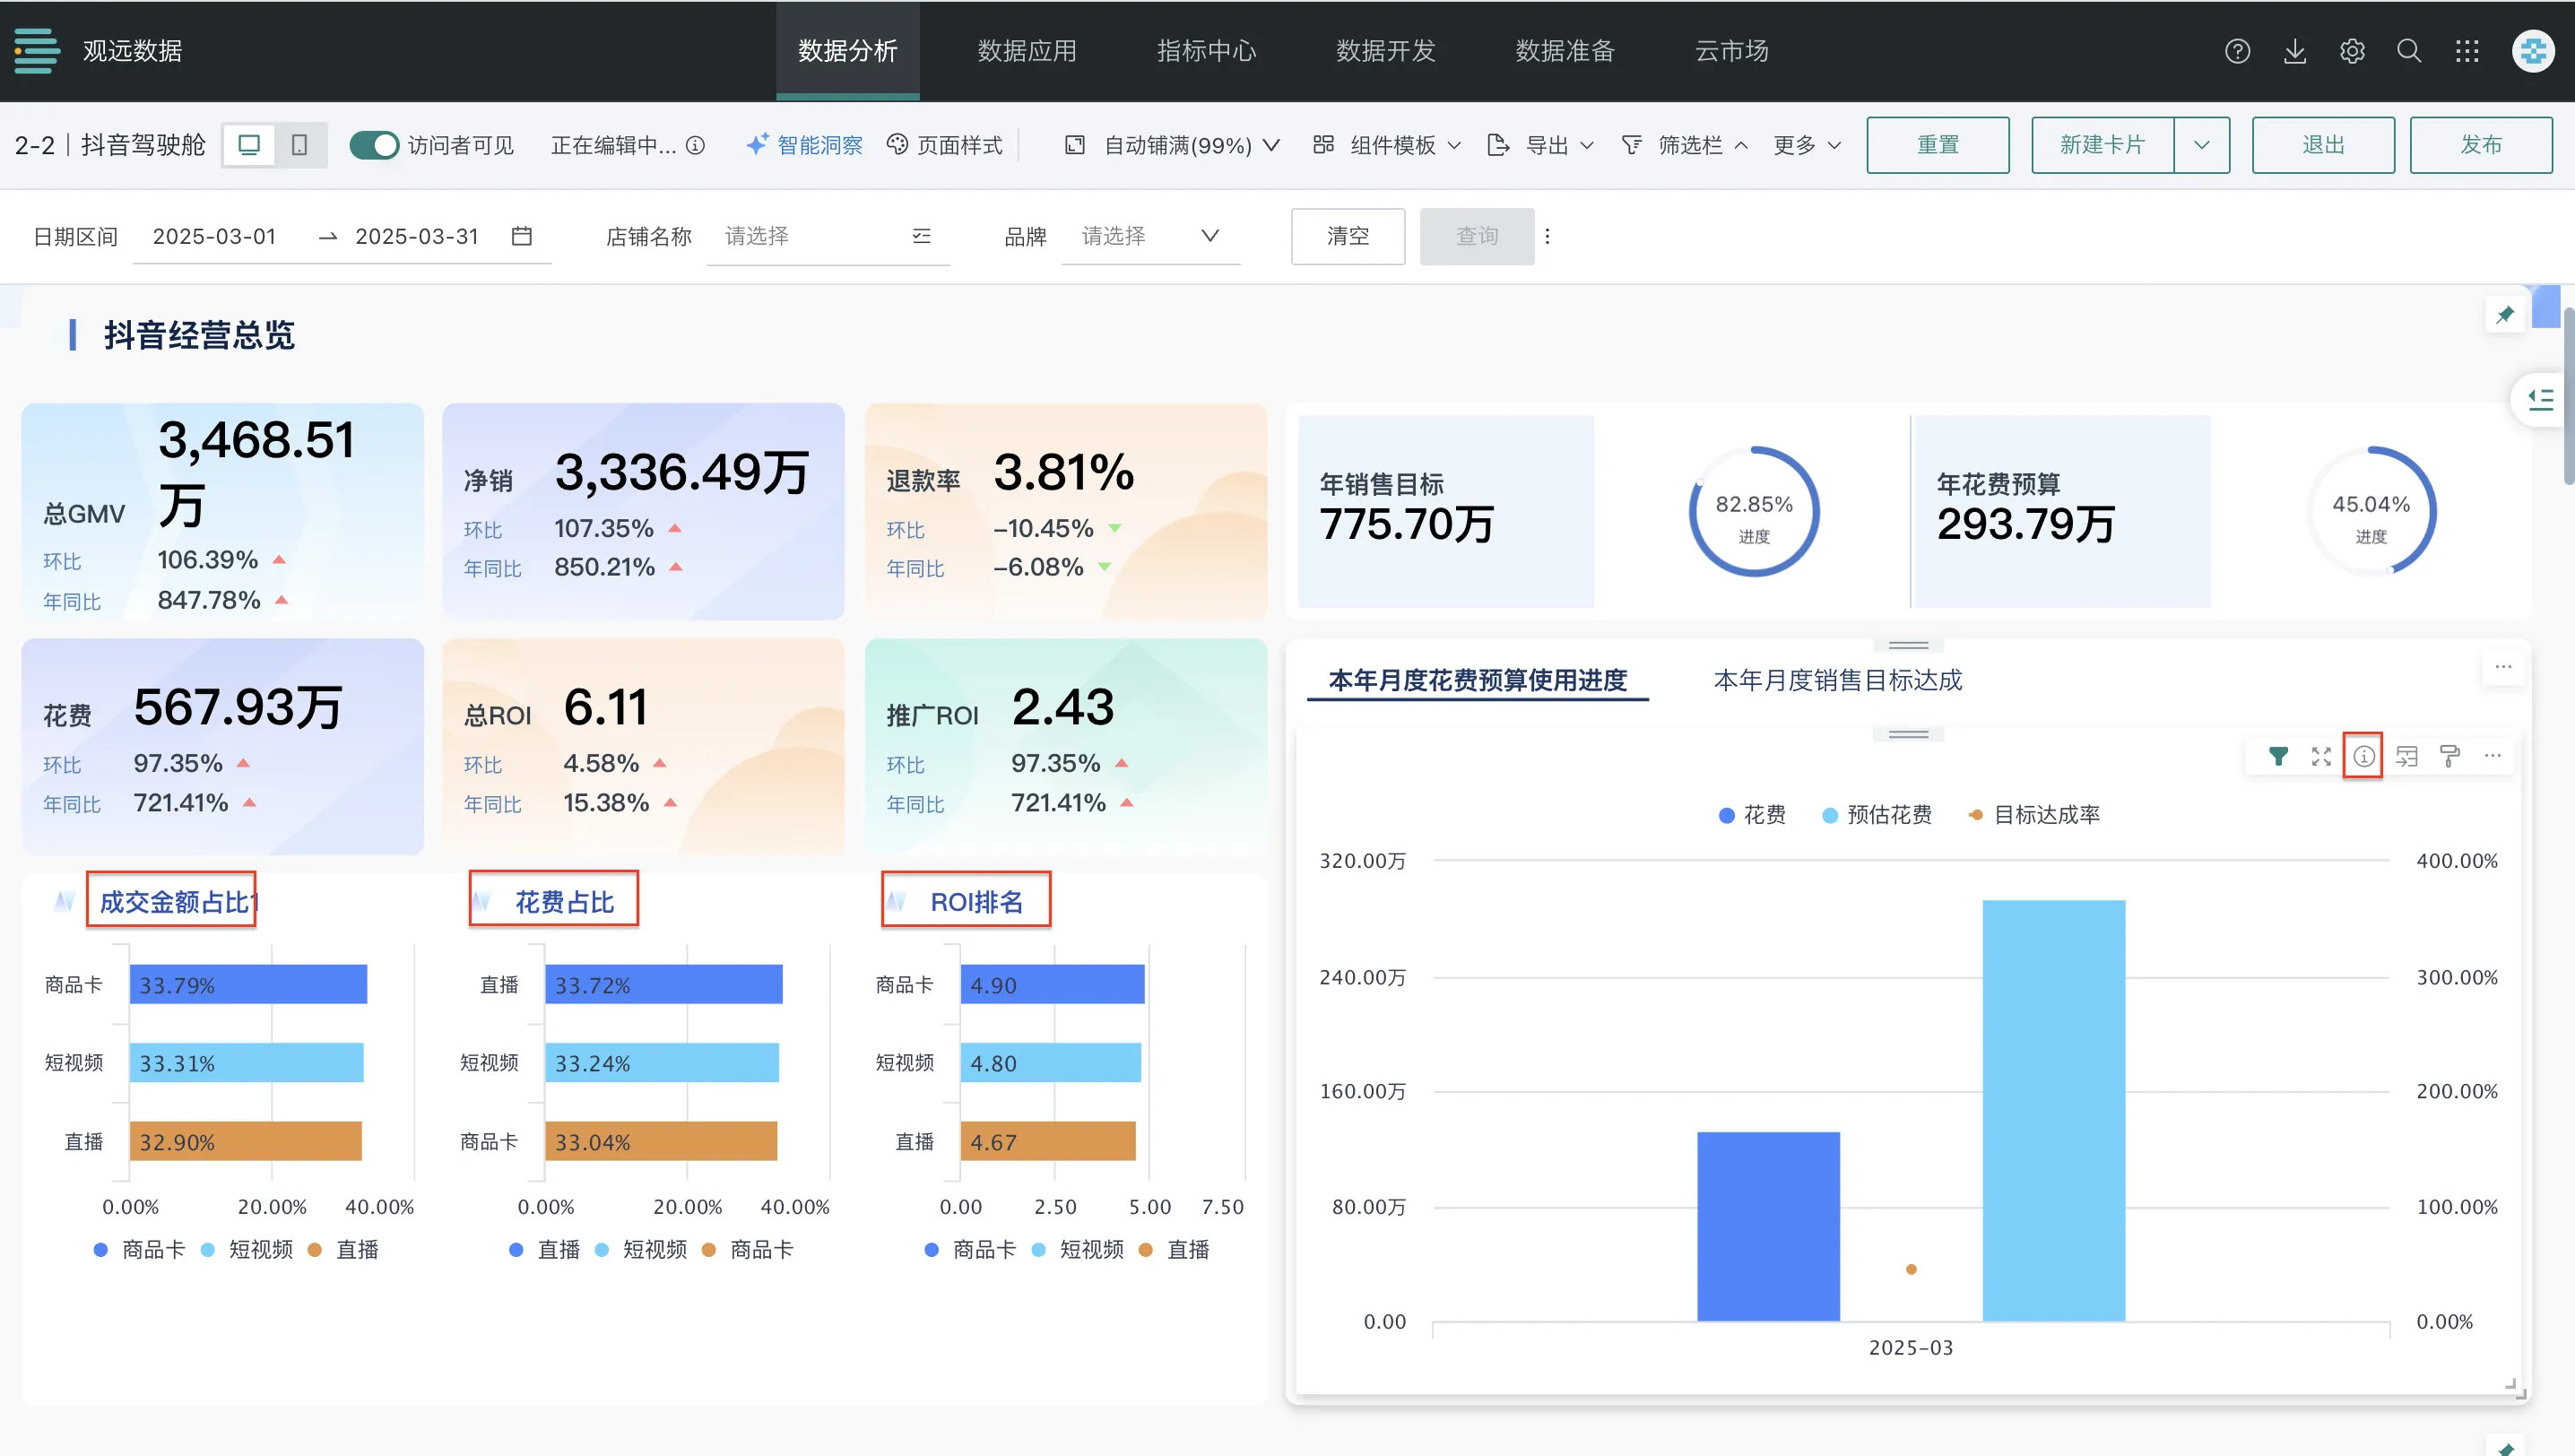
| A large number of similar card titles will cause much interference to large model analysis (such as "Target Achievement Rate" and "Traffic Conversion" appearing repeatedly) | Use "Card Title" and "Card Information" to clearly describe the analysis content of the current card, which can help large models understand more accurately based on semantics |
 |  |
2. Calculation Preprocessing: Complete Data Preprocessing in Cards
Core Principle: Large models are good at semantic analysis but lack precise calculation capabilities, so data cleaning, aggregation, and logic arrangement need to be completed at the card level.
- Implementation Points
- Built-in Complex Calculations: Complete data cleaning, conditional filtering, grouping aggregation and other operations in ETL or reporting tools.
- Avoidance Guide
| Avoid | Recommendation |
|---|---|
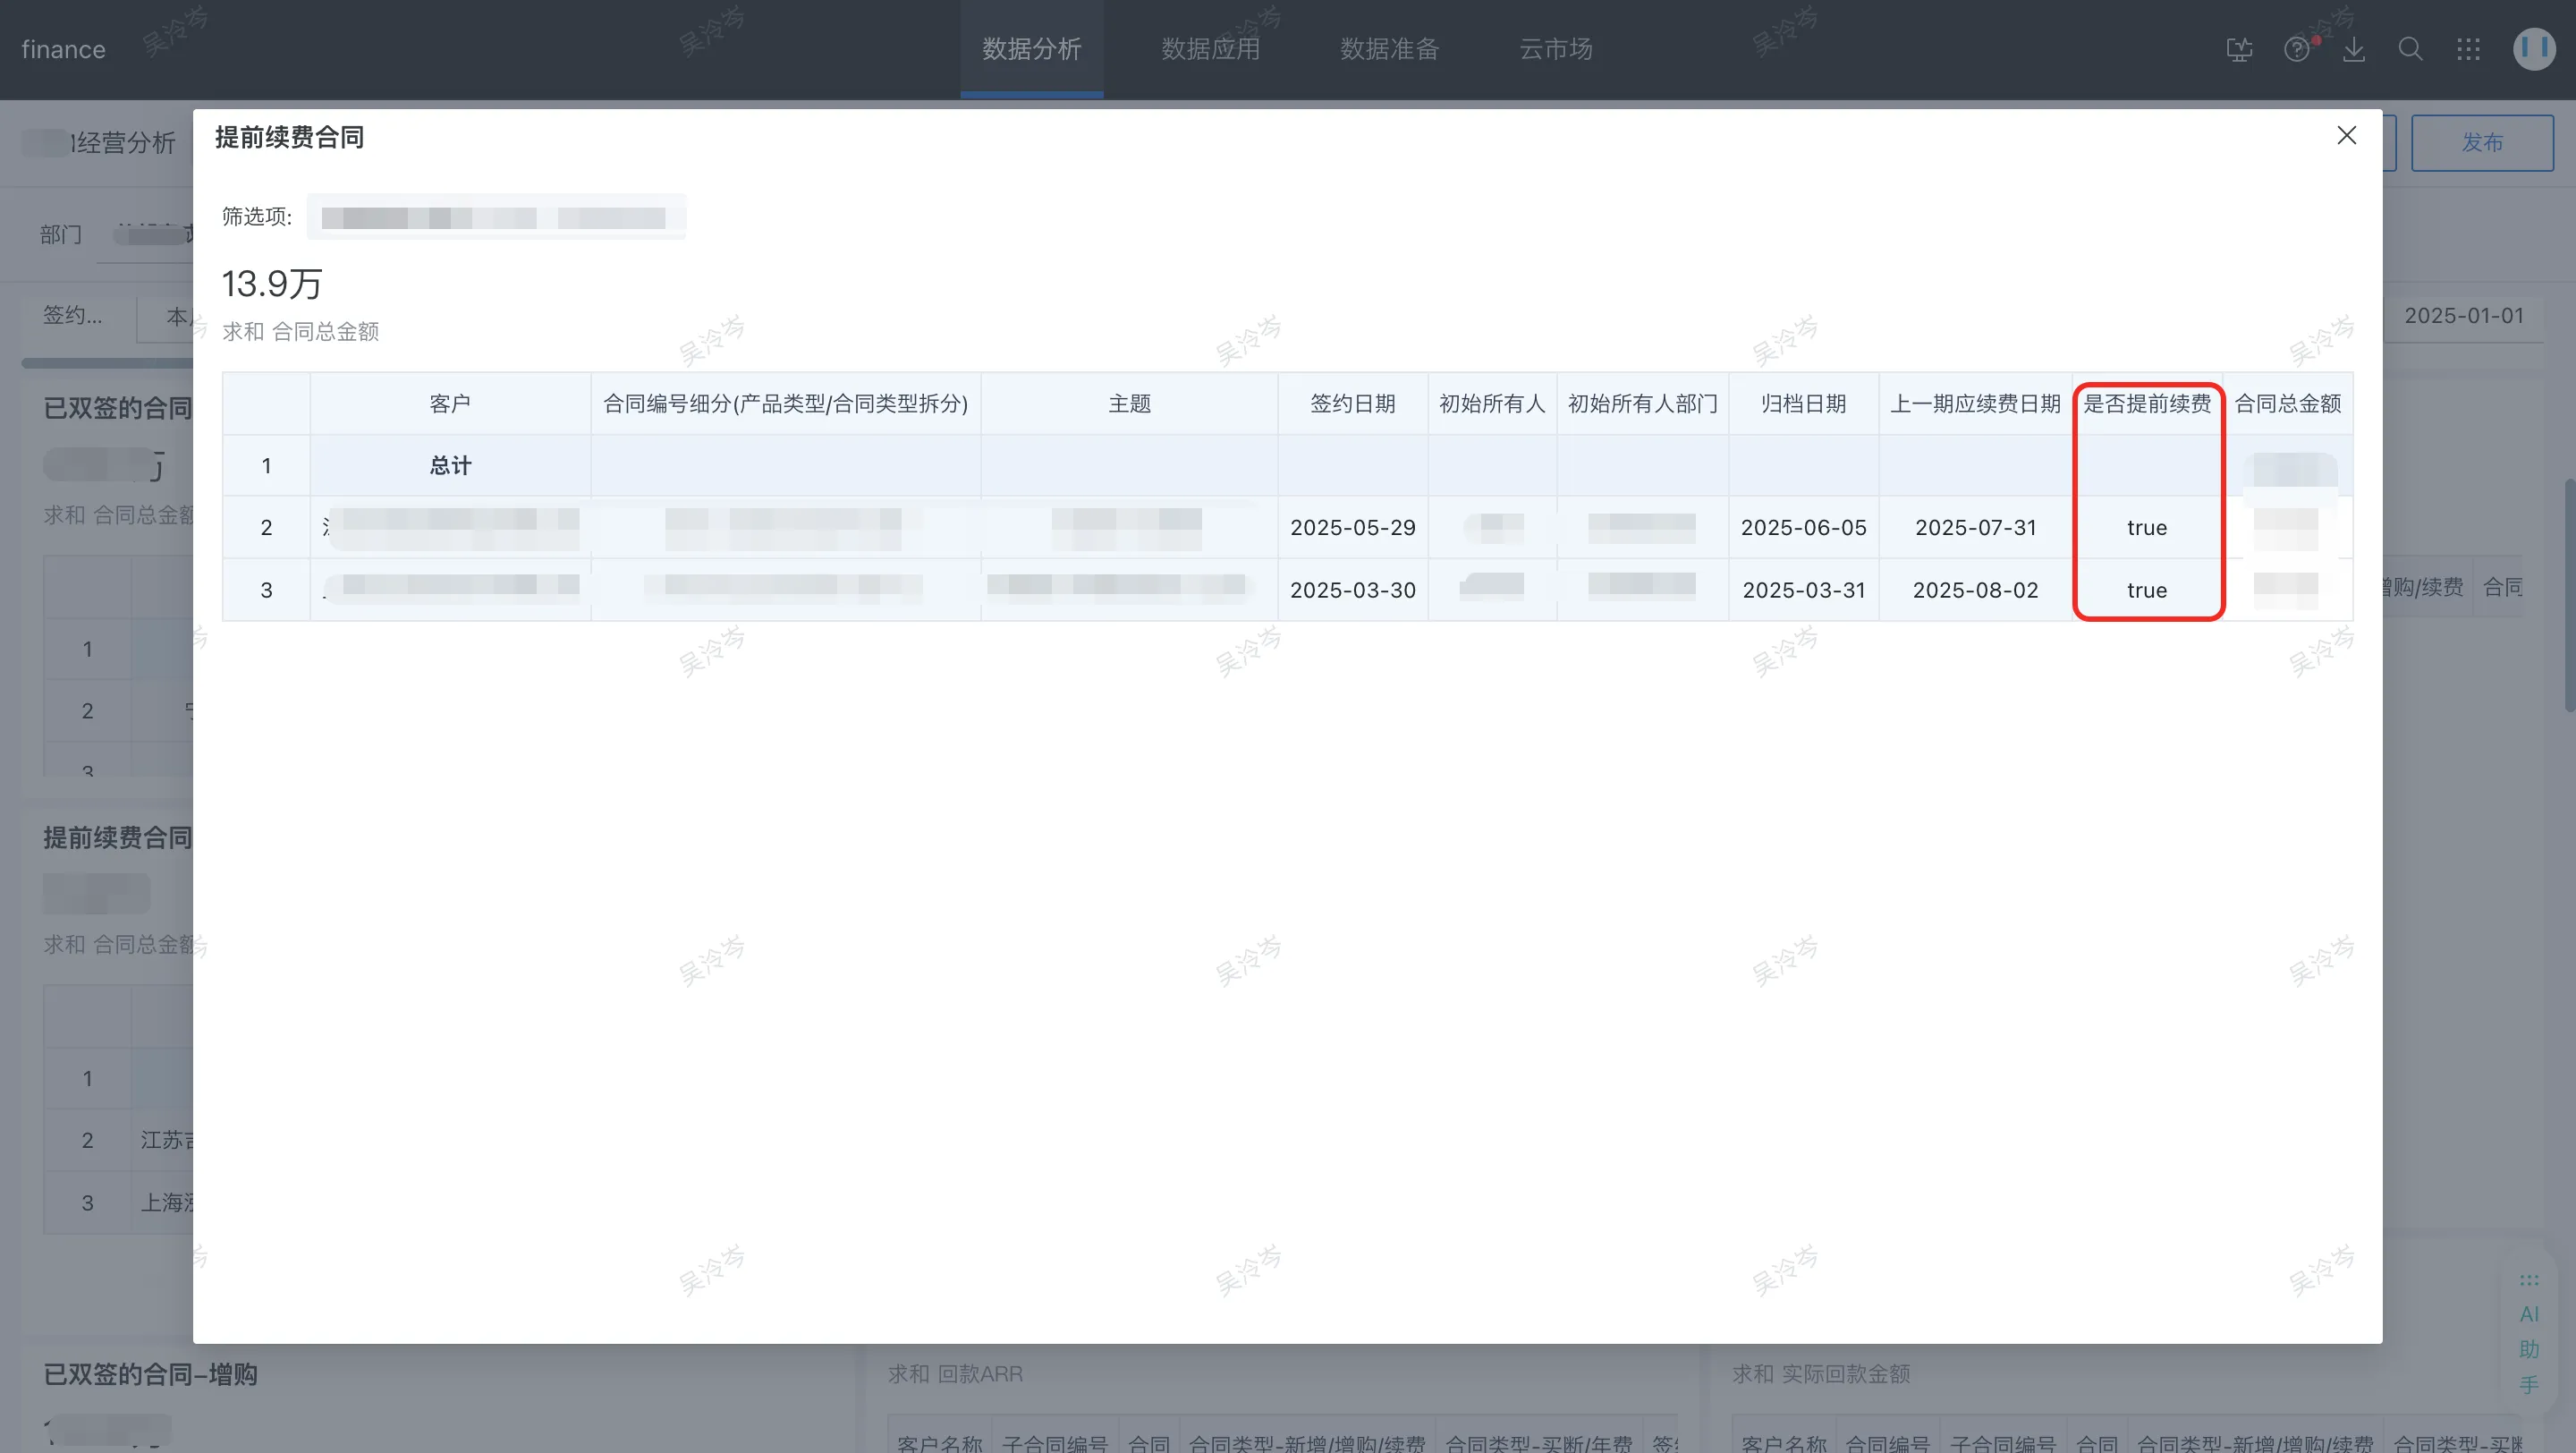
| Trying to let large models perform conditional judgment or data filtering at the semantic level | Provide necessary data foundation for large models through rigorous data calculation and logic arrangement in cards |
 |  |
3. Data Aggregation: Focus on Core Metrics Rather Than Detailed Data
Core Principle: Large models have limited context windows. When processing large-scale data, batch summarization or information abandonment strategies must be adopted. At the same time, the larger the context, the more sparse the distribution of attention weights becomes, making it difficult for large models to focus on relevant information.
- Implementation Points
- Necessary Data Presentation: The dashboard needs to present core aggregated data rather than full detailed data.
- Avoidance Guide
| Avoid | Recommendation |
|---|---|
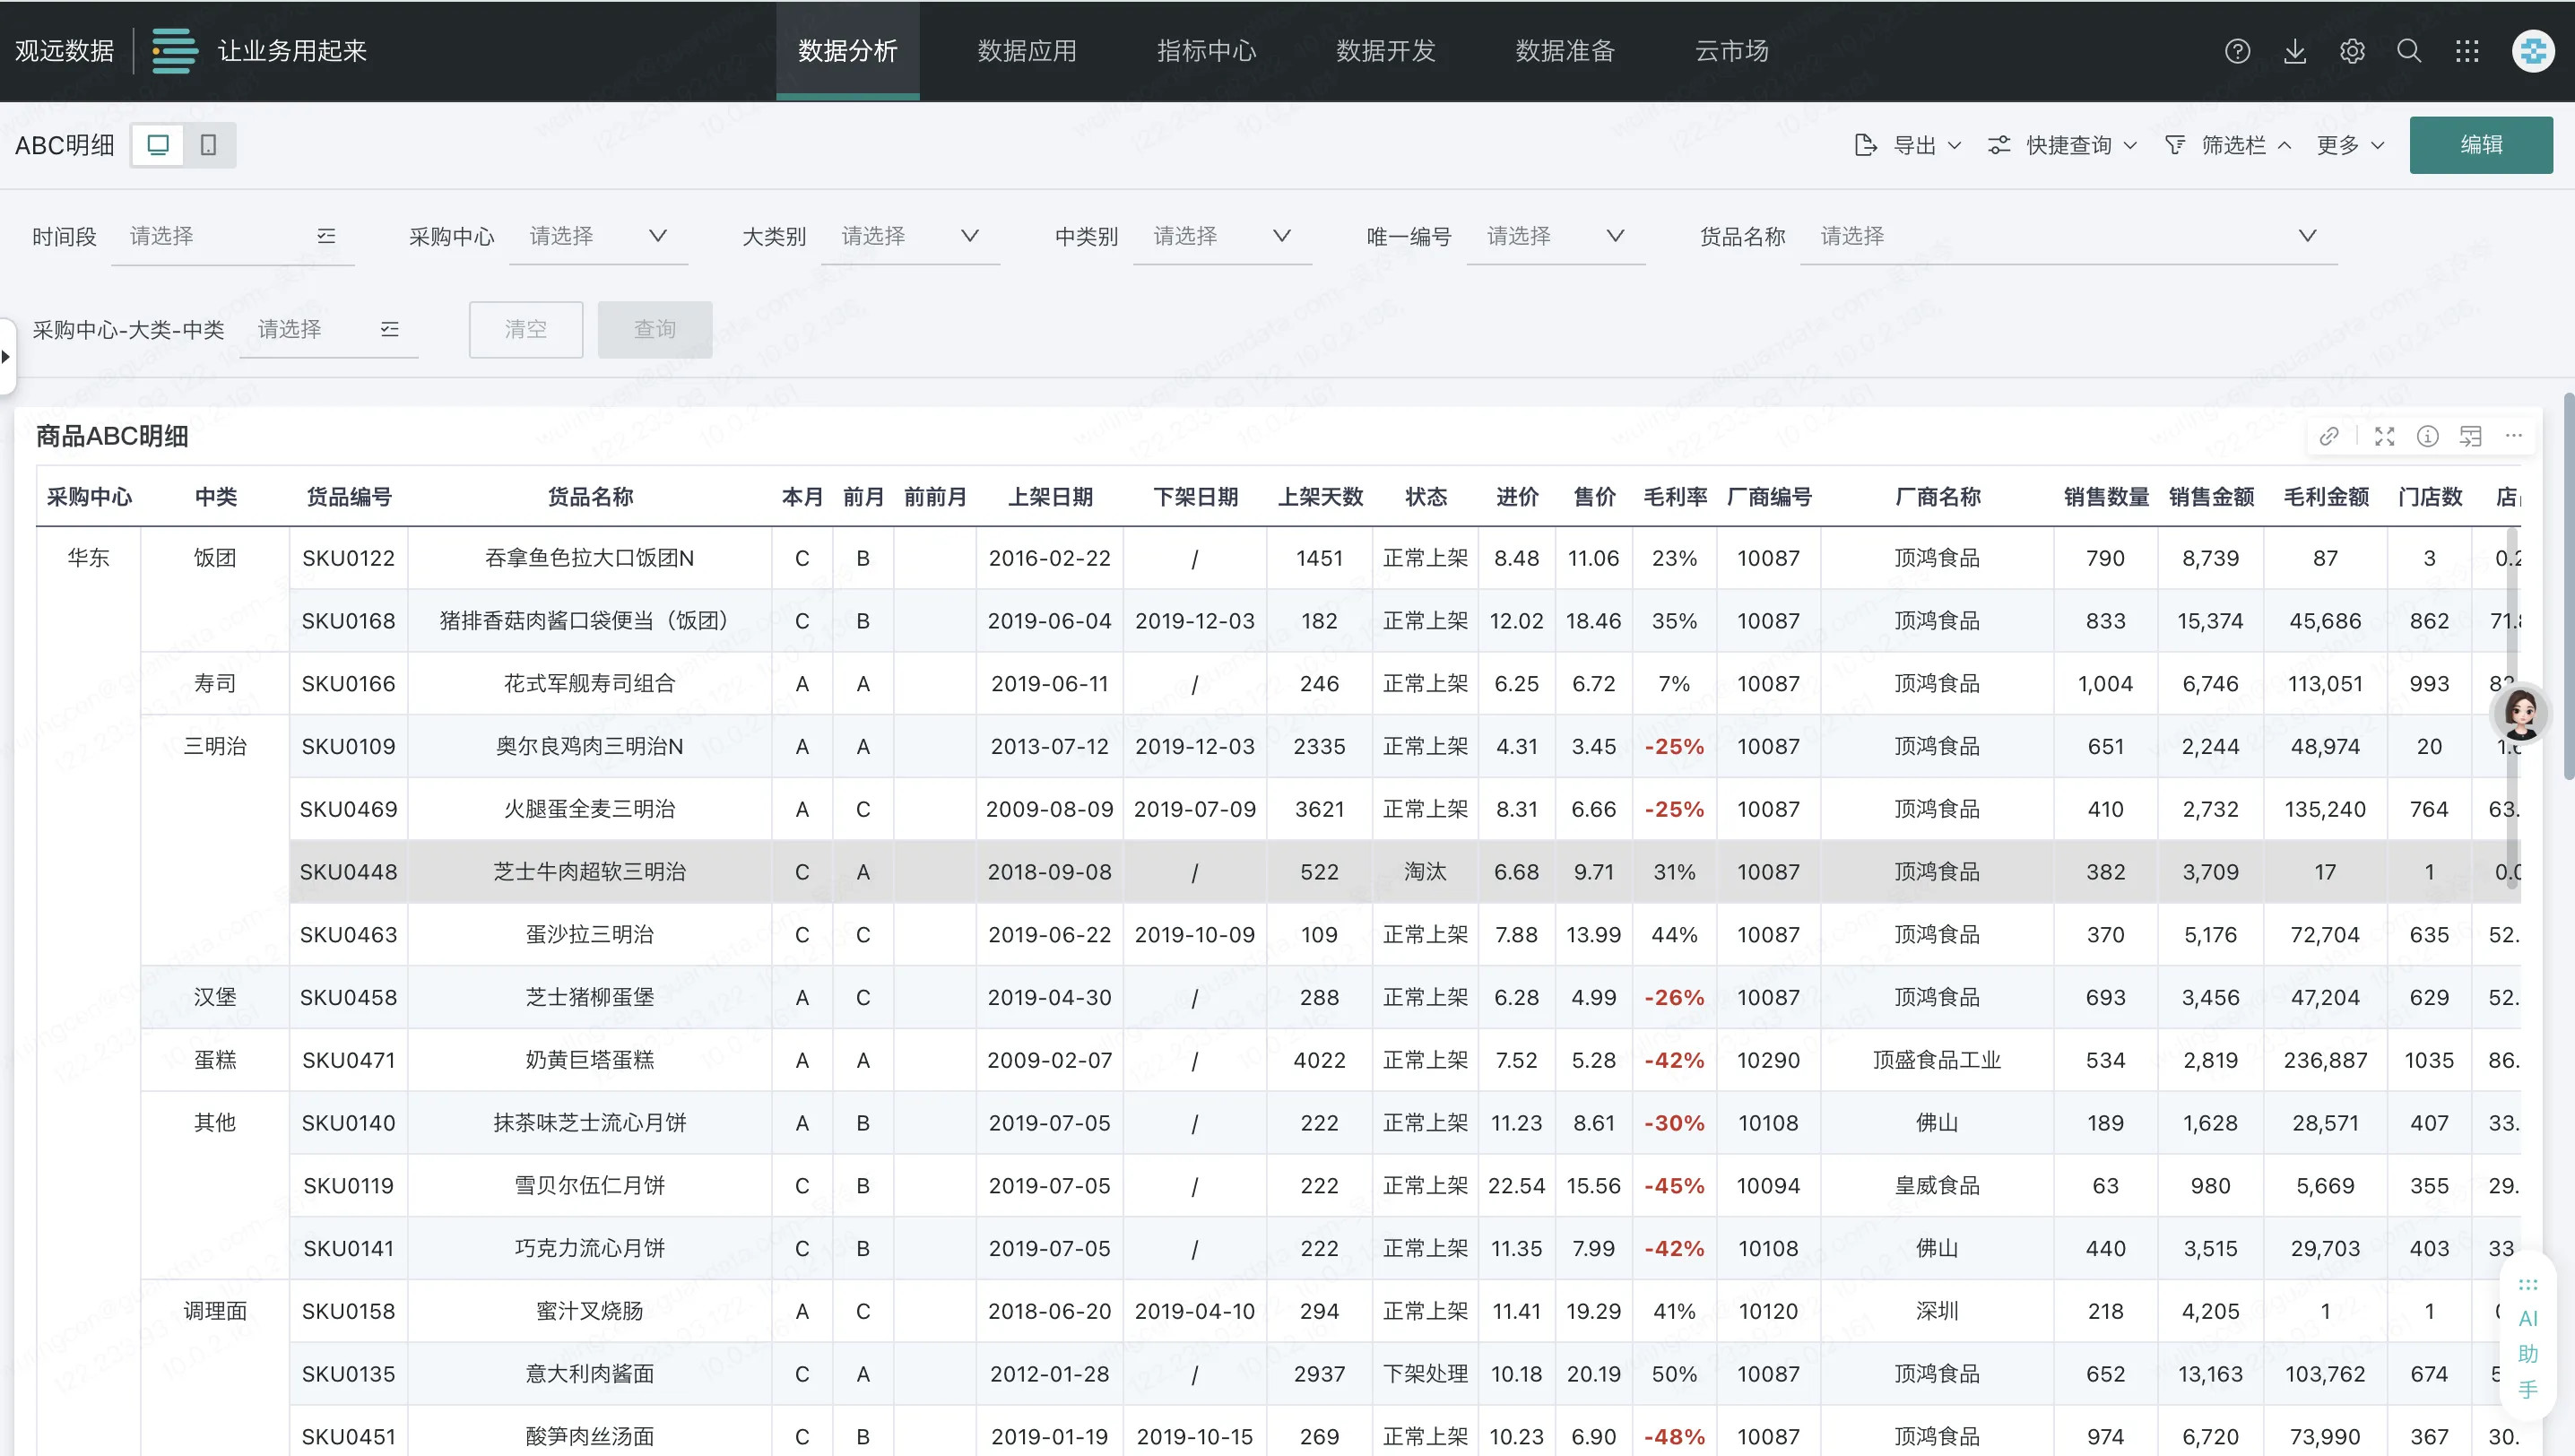
| Presenting detailed table data with numerous columns and huge data volumes in the dashboard, with a large amount of redundant information | Present necessary aggregated data in the dashboard, highlighting key metrics |
 |  |
Prompt Writing Best Practices
1. Question Listing: Guide Insight Direction with Structured Questions
Core Principle: Clearly list the questions that dashboard users care about in "Insight Ideas" to help large models better adapt to business scenarios, and focus on answering the core questions that business users care about in insight conclusions.
Scenario: Enterprise Business Analysis--Opportunity Analysis
Insight Ideas Example:
Please provide concise and clear analysis conclusions and suggestions based on the following analysis framework, highlighting key findings and feasible improvement directions.
1. Summary
	Summarize all conclusions and highlight key points
2. YTD New Creation Trend Analysis
	What is the trend of YTD new opportunities? How many are ABM type opportunities and what is the proportion?
	What are the channel proportion changes in 2025 compared to 2024?
	What are the opportunity source proportion changes in 2025 compared to 2024?
3. Recent Opportunity Creation Situation
	How many new opportunities were created in the last 4 weeks? What is the corresponding opportunity ARR? How do the regions compare?
	Has the weekly opportunity creation trend changed? What is the proportion of market sources and sales self-development sources?
	Among these opportunities, which ones have been won? Which ones have progressed to S5 stage, close to signing? Which ones are in S4 stage, entering quotation? Whose are the rapidly progressing opportunities?
4. Large Deal Opportunity Details
	What are the TOP3 large deal opportunities? (Show all people, opportunity names, opportunity ARR, opportunity amounts). Arrange by opportunity amount from large to small
	What are the TOP3 implementation large deals? (Show all people, opportunity names, opportunity ARR, opportunity amounts, implementation amounts) Arrange by implementation amount from large to small
5. Team and Sales Individual Comparison
	Under this team (take data from this team ranking), which sales people who created the least opportunities need attention?
	Among all sales people (take data from all sales ranking), which sales people (teams) created the most opportunities? Who are the TOP3 sales people (teams) who created the most ABM opportunities among all sales people (teams)? Who are the TOP3 sales people (teams) who created the most network opportunities among all sales people (teams)?
2. Business Knowledge Perfection: Precisely Define Business Scenarios, Metric Names, Business Terms, and Business Logic in Business Knowledge
Core Principle: Clearly define business scenarios, metric names, business terms, and business logic in business knowledge to calibrate large model understanding, avoid ambiguity and misjudgment, and ensure the accuracy and business relevance of insight output.
- Clarify Business Scenarios: Clearly define the business scenario analyzed by the current dashboard in business knowledge, which can provide necessary background knowledge for large model insights.
The business scenario is ToB enterprise sales opportunity creation related analysis.
The business scenario is ToB enterprise customer success department renewal and upsell performance related analysis.
- Precisely Define Metric Names: Declare different names for the same metric in business knowledge to avoid large model confusion.
Performance targets include 3 targets: payment equivalent ARR, payment, and contract amount. These three metrics should never be mixed together.
Contract amount = contract value, payment ARR = payment equivalent ARR
- Supplement Business Terms: For more professional business terms, their meanings and calculation logic need to be explained in business knowledge.
New V sales represent performance contributions brought by the ability to develop new customers, old V sales represent performance contributions achieved through maintaining and converting old customers for repurchase, sales = new V sales + old V sales + non-member sales.
Contract amount includes software products and implementation parts, only renewals or product upsells or maintenance count as equivalent ARR, implementation has no equivalent ARR.
Poor opportunity progress: few new opportunities created, few sales self-development opportunities.
- Calibrate Business Logic: Declare business common sense through business knowledge to prevent large model misjudgment.
Appropriate early renewal is not a problem, but should not be excessive. If the early renewal proportion is too high, it means overdrawing future performance in advance.
Implementation sales are an important way to increase contract amounts, so software product sales, implementation sales, and contract amounts are equally important. Do not recommend any strategies to reduce sales.
3. Template Standardization: Use Structured Templates to Standardize Output Format
Core Principle: Provide preset report templates in the form of text cards to ensure insight conclusions conform to business reporting scenarios (such as weekly meetings, business analysis meetings).