GuanOps Operations Service Platform
Overview
GuanOps is an intelligent operations platform designed to simplify daily BI system operations and improve operational efficiency and security. Without logging in to the server, users can complete core operations tasks such as data cleanup, log collection, fault analysis, health checks, and network diagnostics through a unified and secure web interface, enabling efficient management and maintenance of Guandata BI systems.
Prerequisites
-
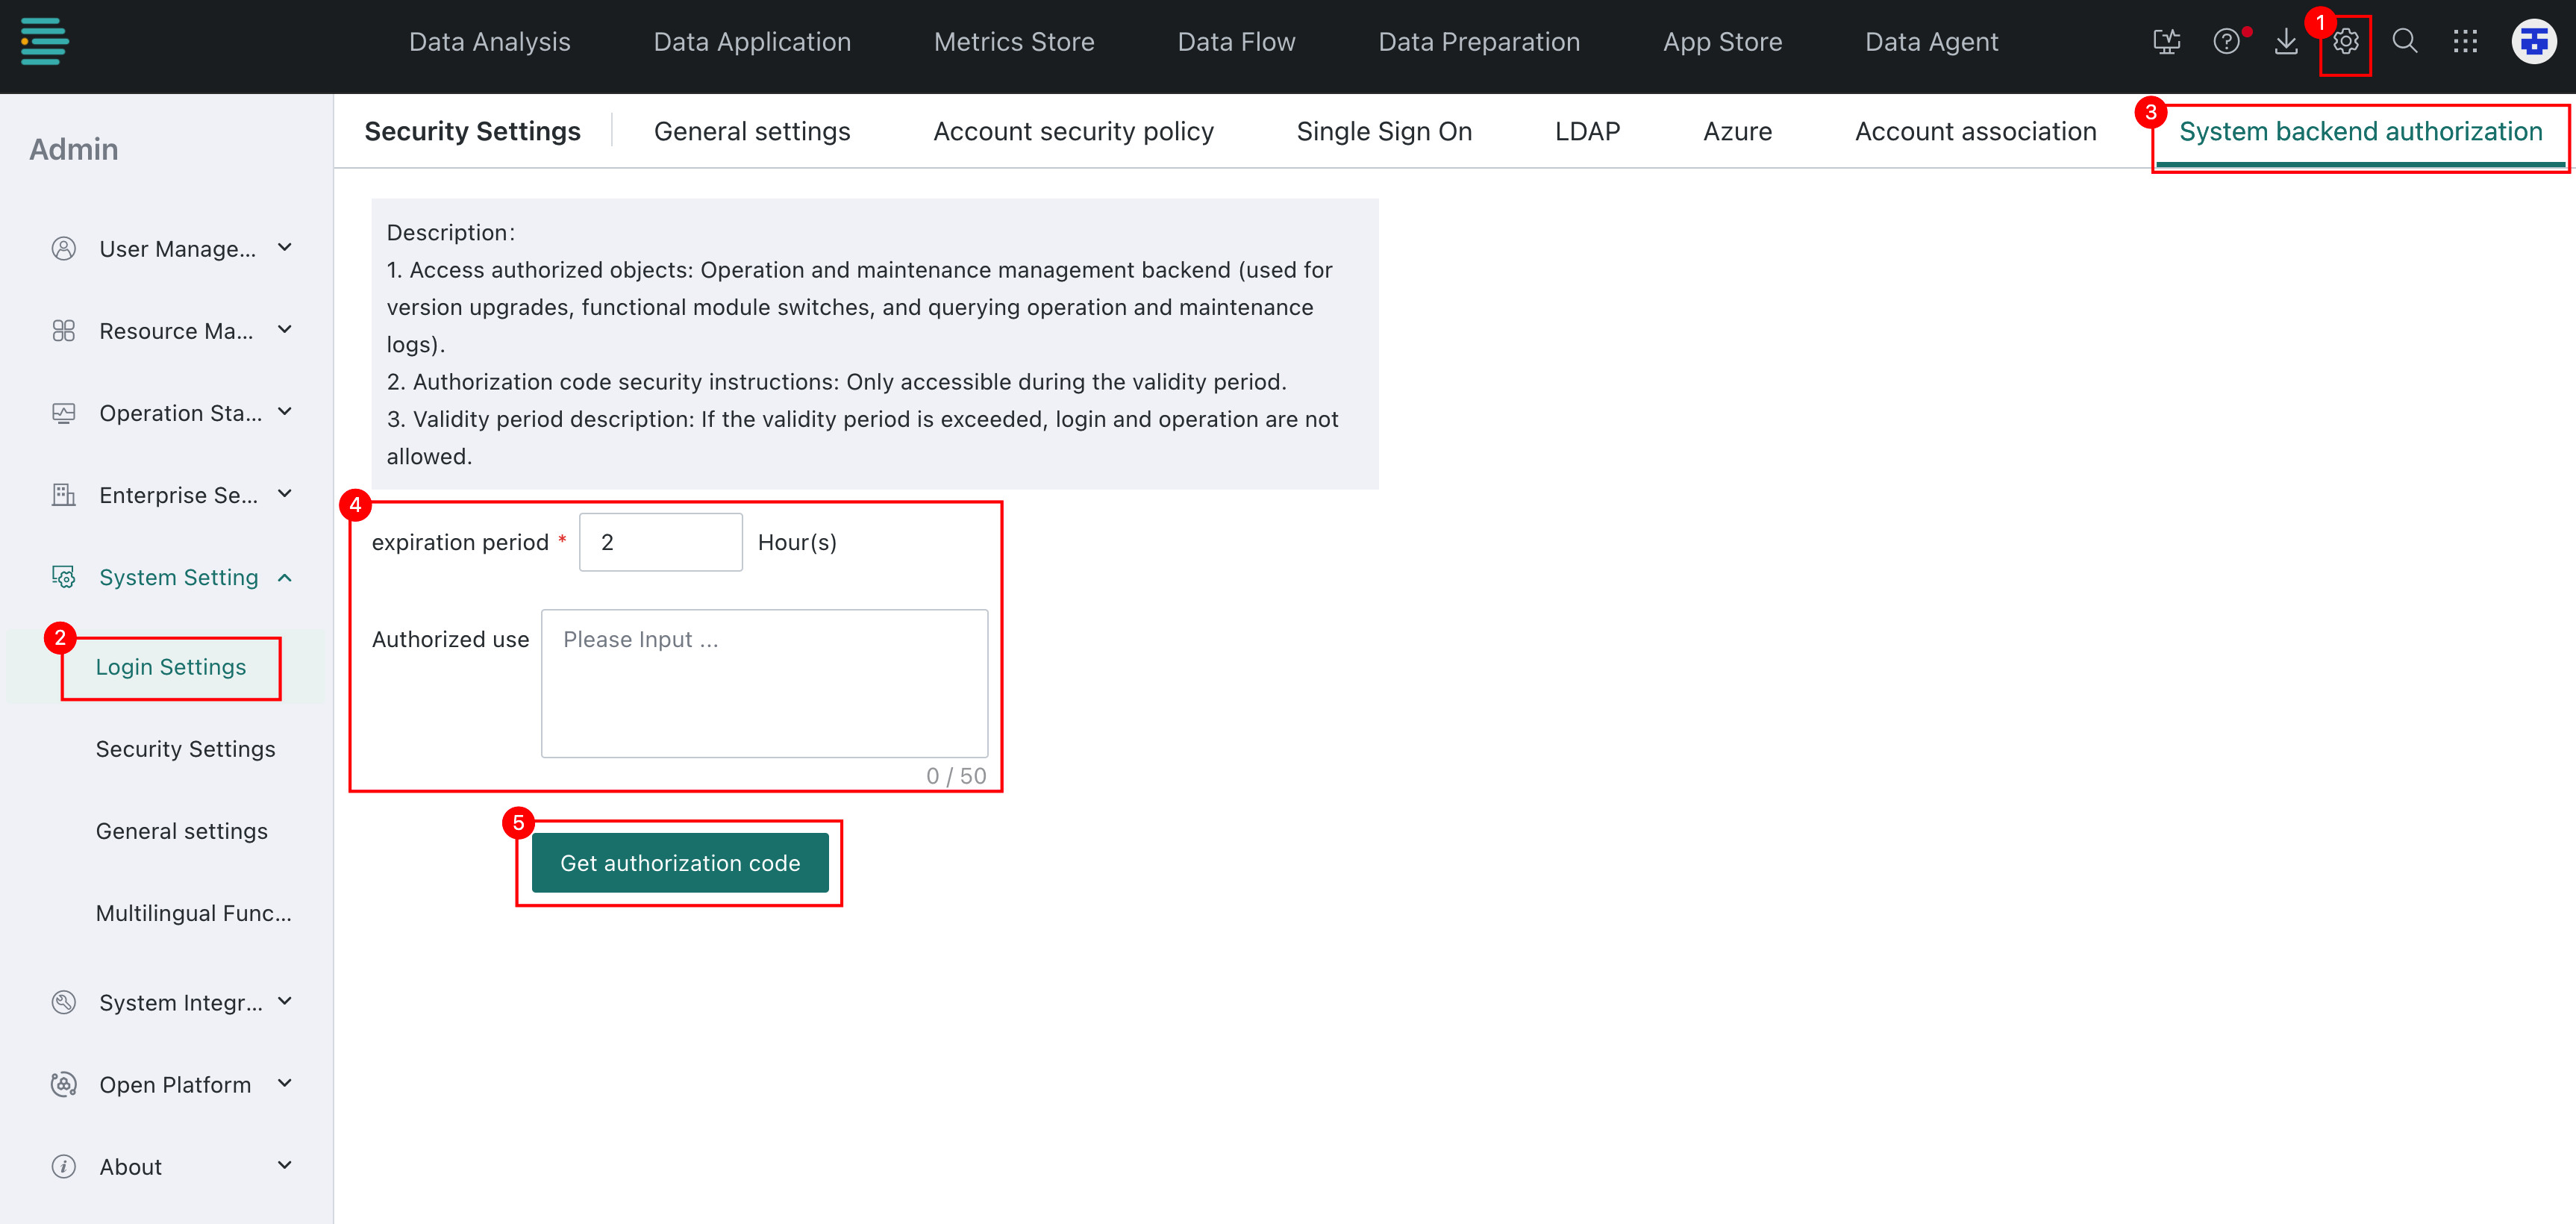
Obtain the authorization code: Management Center > System Settings > Login Settings > Admin Backend Authorization.
-
In the browser, enter
domain/system-backendto access the admin backend.The GuanOps entry is shown below:

Usage Guide
Data Cleanup
Core value: Helps resolve high disk space usage and provides cleanup strategies of different intensities based on business impact risk.
-
Scenario: When system monitoring or alerts indicate high disk usage.
-
General procedure:
- Select the required cleanup type (light cleanup or deep cleanup) or analysis feature (data directory analysis).
- Click the execution button for the corresponding feature.
- The page displays execution logs in real time, making it easy to track progress and results.
- After the operation is complete, view the cleanup result.
Light Cleanup
- Applicable scenario: Disk usage is high, for example >85%, but services are running normally. Use this option to release space gently.
- Execution rules:
- Clean cached data.
- Keep the latest three image versions.
- Keep backups from the last three days.
- Lightly clean temporary data.
- Run the Spark cleanup script.
- Risk and impact (low risk): The operation has no direct impact on currently running services, and tasks can run normally.
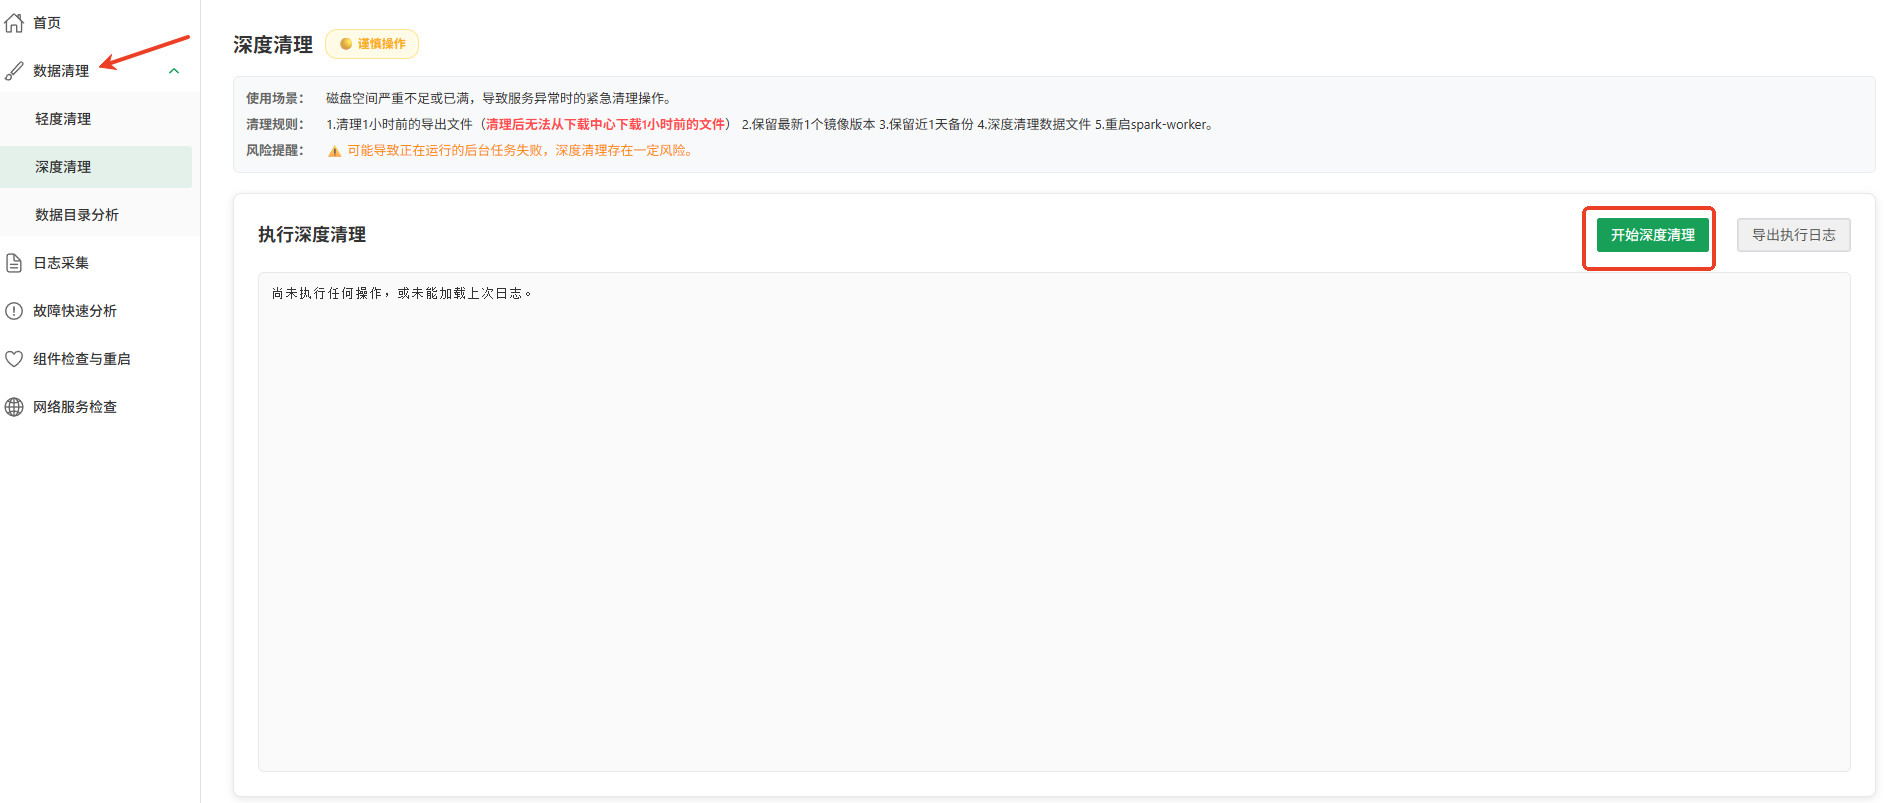
Deep Cleanup
-
Applicable scenario: Disk space is critically low or full, for example >95%, and may cause service exceptions. Use this option for emergency cleanup to restore basic services.
-
Execution rules:
-
Clean exported files older than one hour.
NoteAfter cleanup, files older than one hour cannot be downloaded from the Download Center.
-
Keep the latest image version.
-
Keep backups from the last day.
-
Deep-clean data cache files.
-
Restart the Spark-worker service.
NoteRestarting may interrupt tasks.
-
-
Risk and impact (high risk):
- Backend computing tasks running during cleanup may fail.
- This is an emergency recovery operation and should be used only when services are abnormal or serious alerts occur.
Data Directory Analysis
- Description: Deeply analyzes disk space usage details to locate major space consumers and abnormal usage.
- Analysis content:
- Disk usage size and ranking of each directory or file.
- Identify abnormally growing large files or directories.
- Provide visualized or detailed reports that show space distribution.
- Recommendations:
- Run during off-peak hours because scanning many files consumes I/O resources.
- Execution time is directly related to data volume.
Log Collection
Core value: When a system exception occurs, quickly collects key operations diagnostics information and packages it for download, helping Guandata technical support efficiently locate the root cause.
-
Applicable scenario: When the system has faults, errors, or performance exceptions and the cause needs to be analyzed.
-
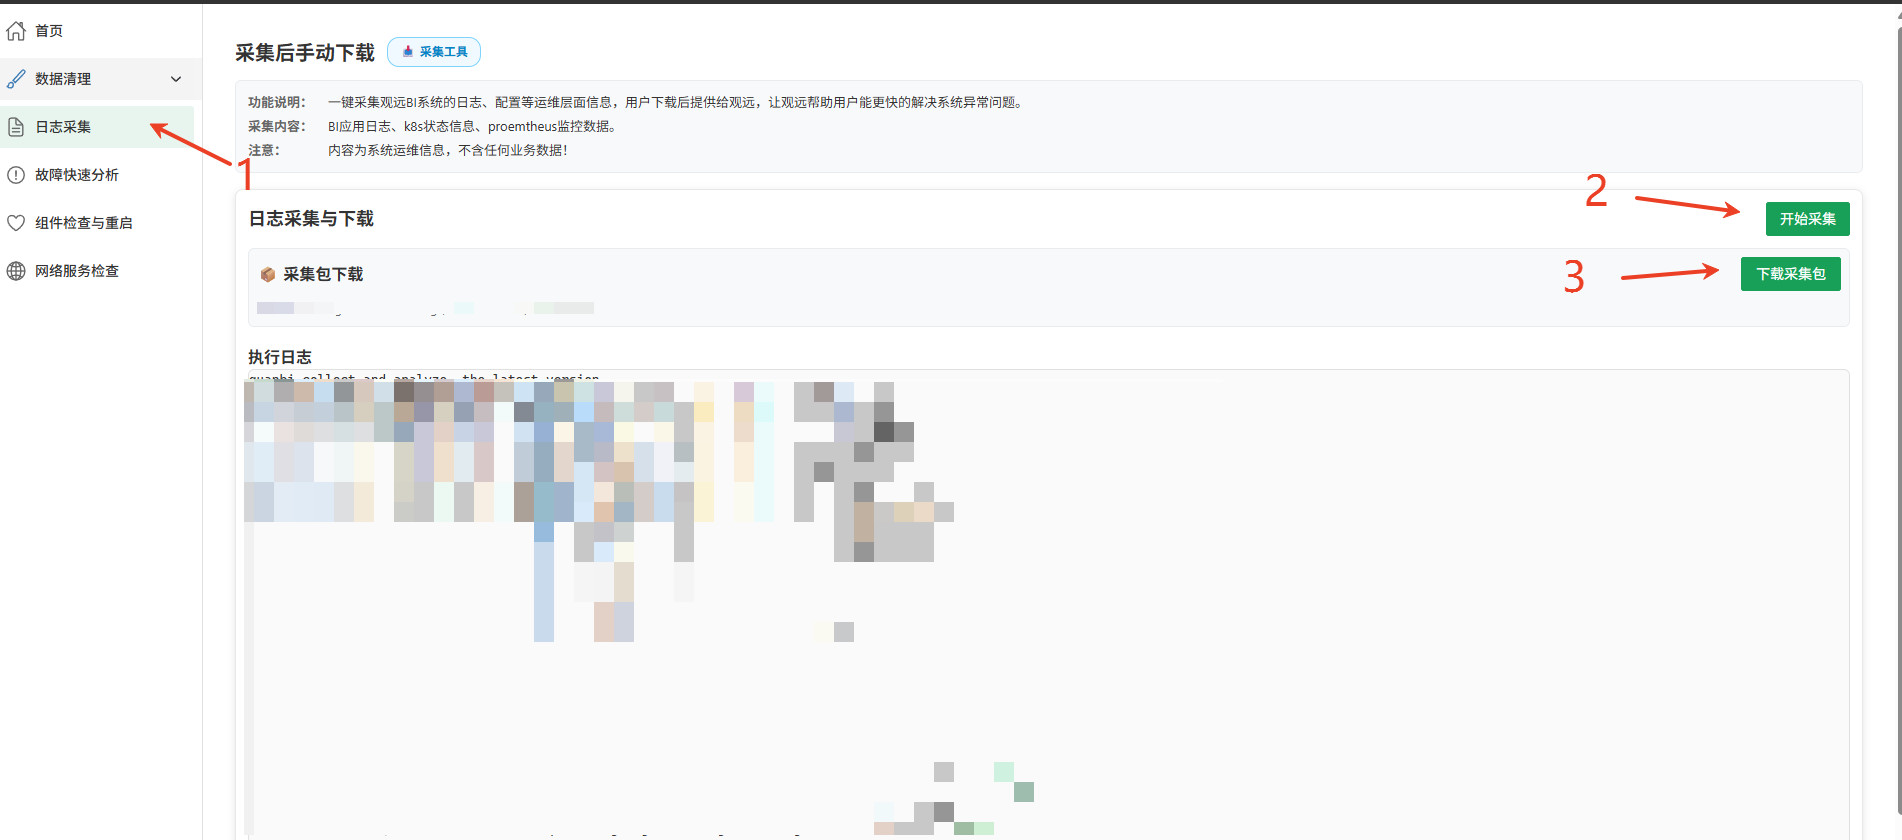
Procedure:
- Click Start Collection.
- Collection usually takes a few minutes. Please wait.
- After the page shows that collection is complete, click Download Package to obtain the compressed file.
- Provide the collection package to Guandata technical support for analysis.
-
Collected content:
- Guandata BI application logs, including key error information.
- Kubernetes (k8s) cluster status information, such as Pods and Events.
- Prometheus monitoring metrics, including some system status data.
-
Security note: The collected content contains only operations-level logs, configurations, and service status information. It does not contain specific business data.
Component Check and Restart
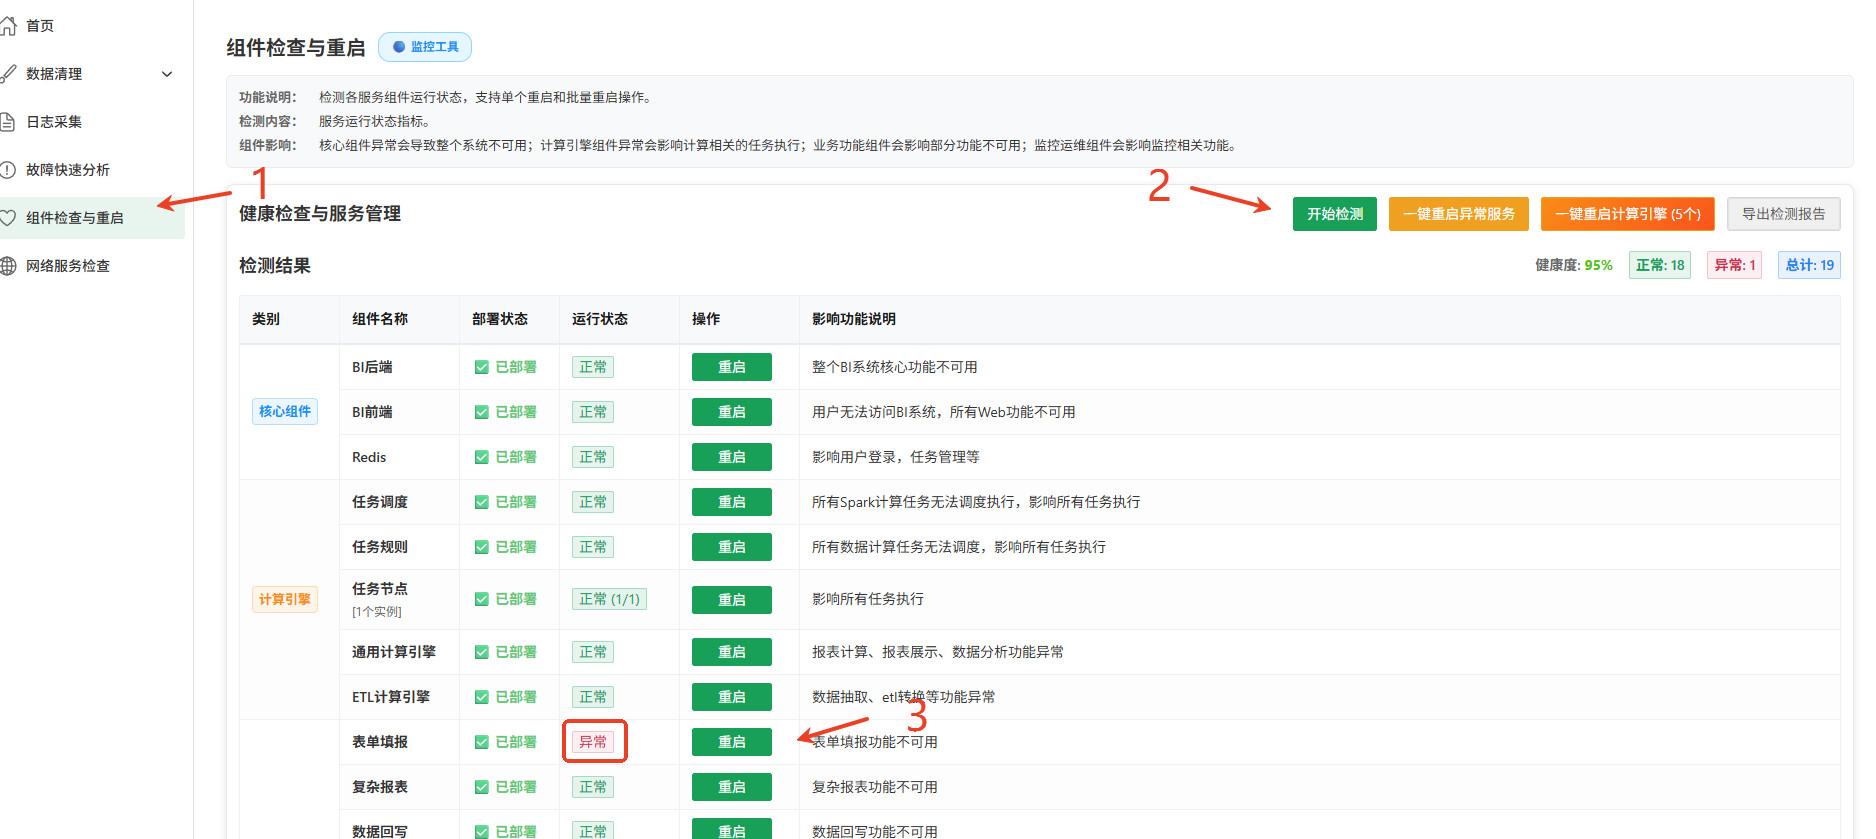
Core value: Centrally monitors the running status of Guandata BI service components and provides safe, controllable restart operations to recover abnormal components or perform routine maintenance.
- Key points:
- Click Start Check, and the platform automatically checks the real-time status of all components.
- After the check is complete, the health status of each component is clearly displayed in the list.
- For components with abnormal status:
- Select the component.
- Click Restart.
- You can also select and restart a component in normal status, for example to release blocked tasks.
- Component impact:
- Core components: Exceptions make the entire BI system inaccessible.
- Compute engine components: Exceptions affect execution of data preparation, ETL, card, and related tasks.
- Business function components: Exceptions affect specific feature modules.
- Monitoring and operations components: Exceptions mainly affect monitoring data collection and display.
Network Service Check
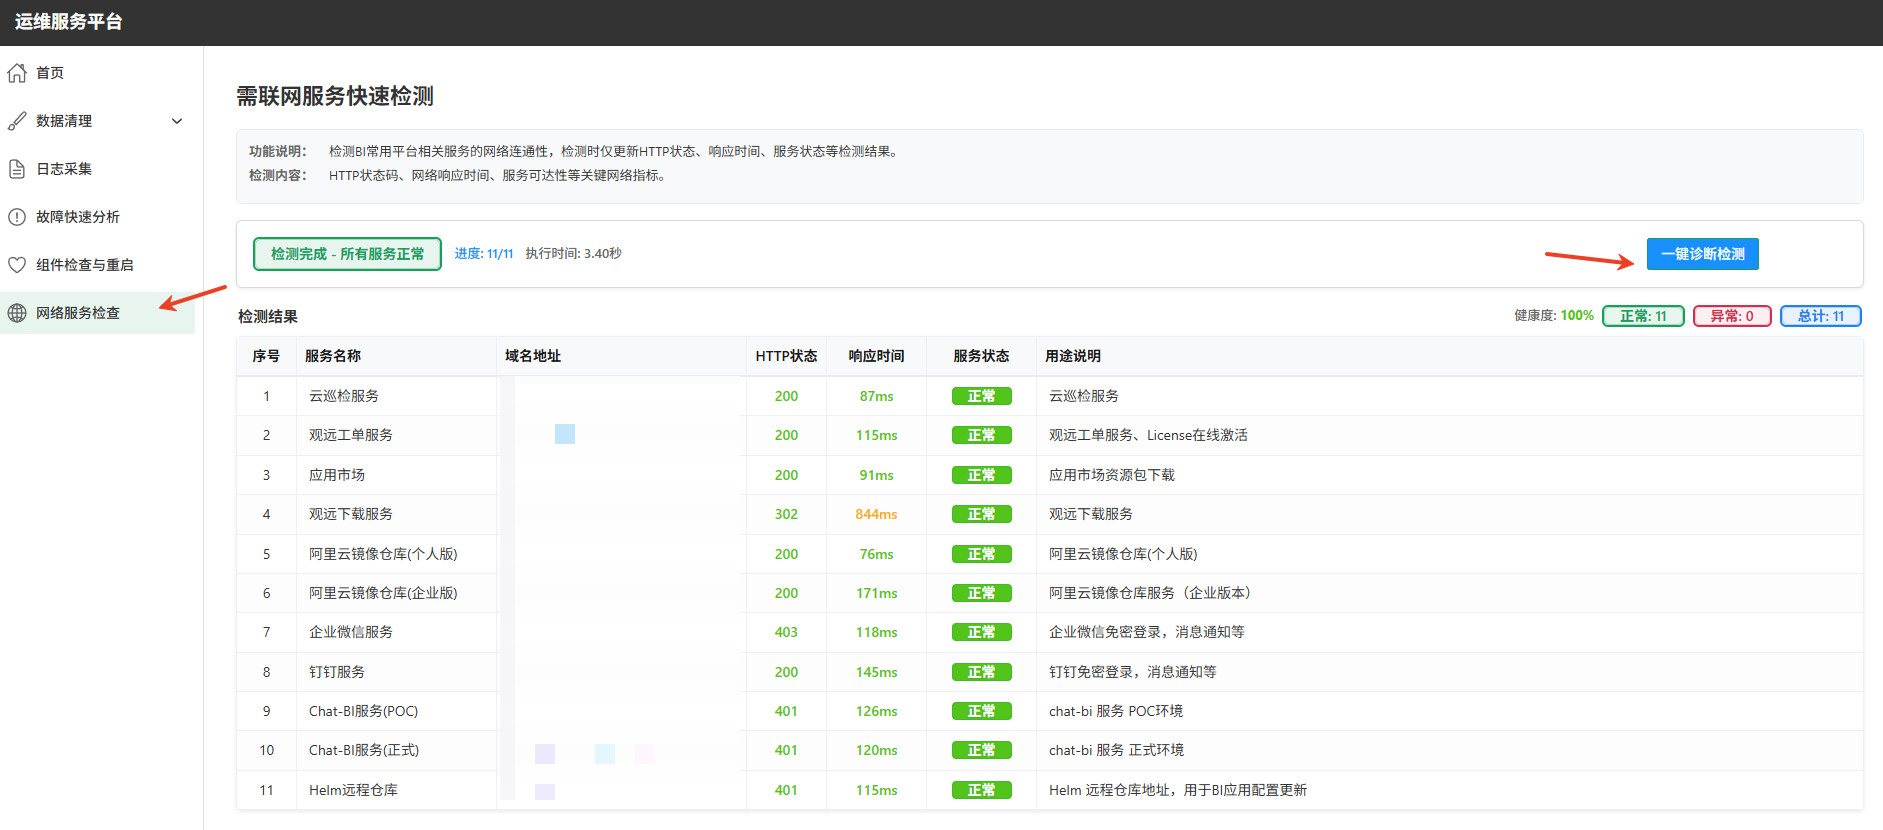
Core value: Quickly verifies the network connectivity and availability of common BI system dependency services or external APIs, narrowing the scope of network troubleshooting.
- Procedure: Click One-click Diagnosis to start the check.
- Check result display: The platform automatically refreshes and shows the following key metrics:
- Service name: The service or URL being checked.
- HTTP status code: For example, 200 (success), 403 (forbidden), 502 (bad gateway), or timeout (no response).
- Network response time: The latency from sending the request to receiving the first response byte, in ms.
- Service status: Summary labels such as Normal or Abnormal.
- Behavior: Each diagnosis click performs only one round of checks and updates the result. It does not perform continuous monitoring and is mainly used for active probing.
System Inspection
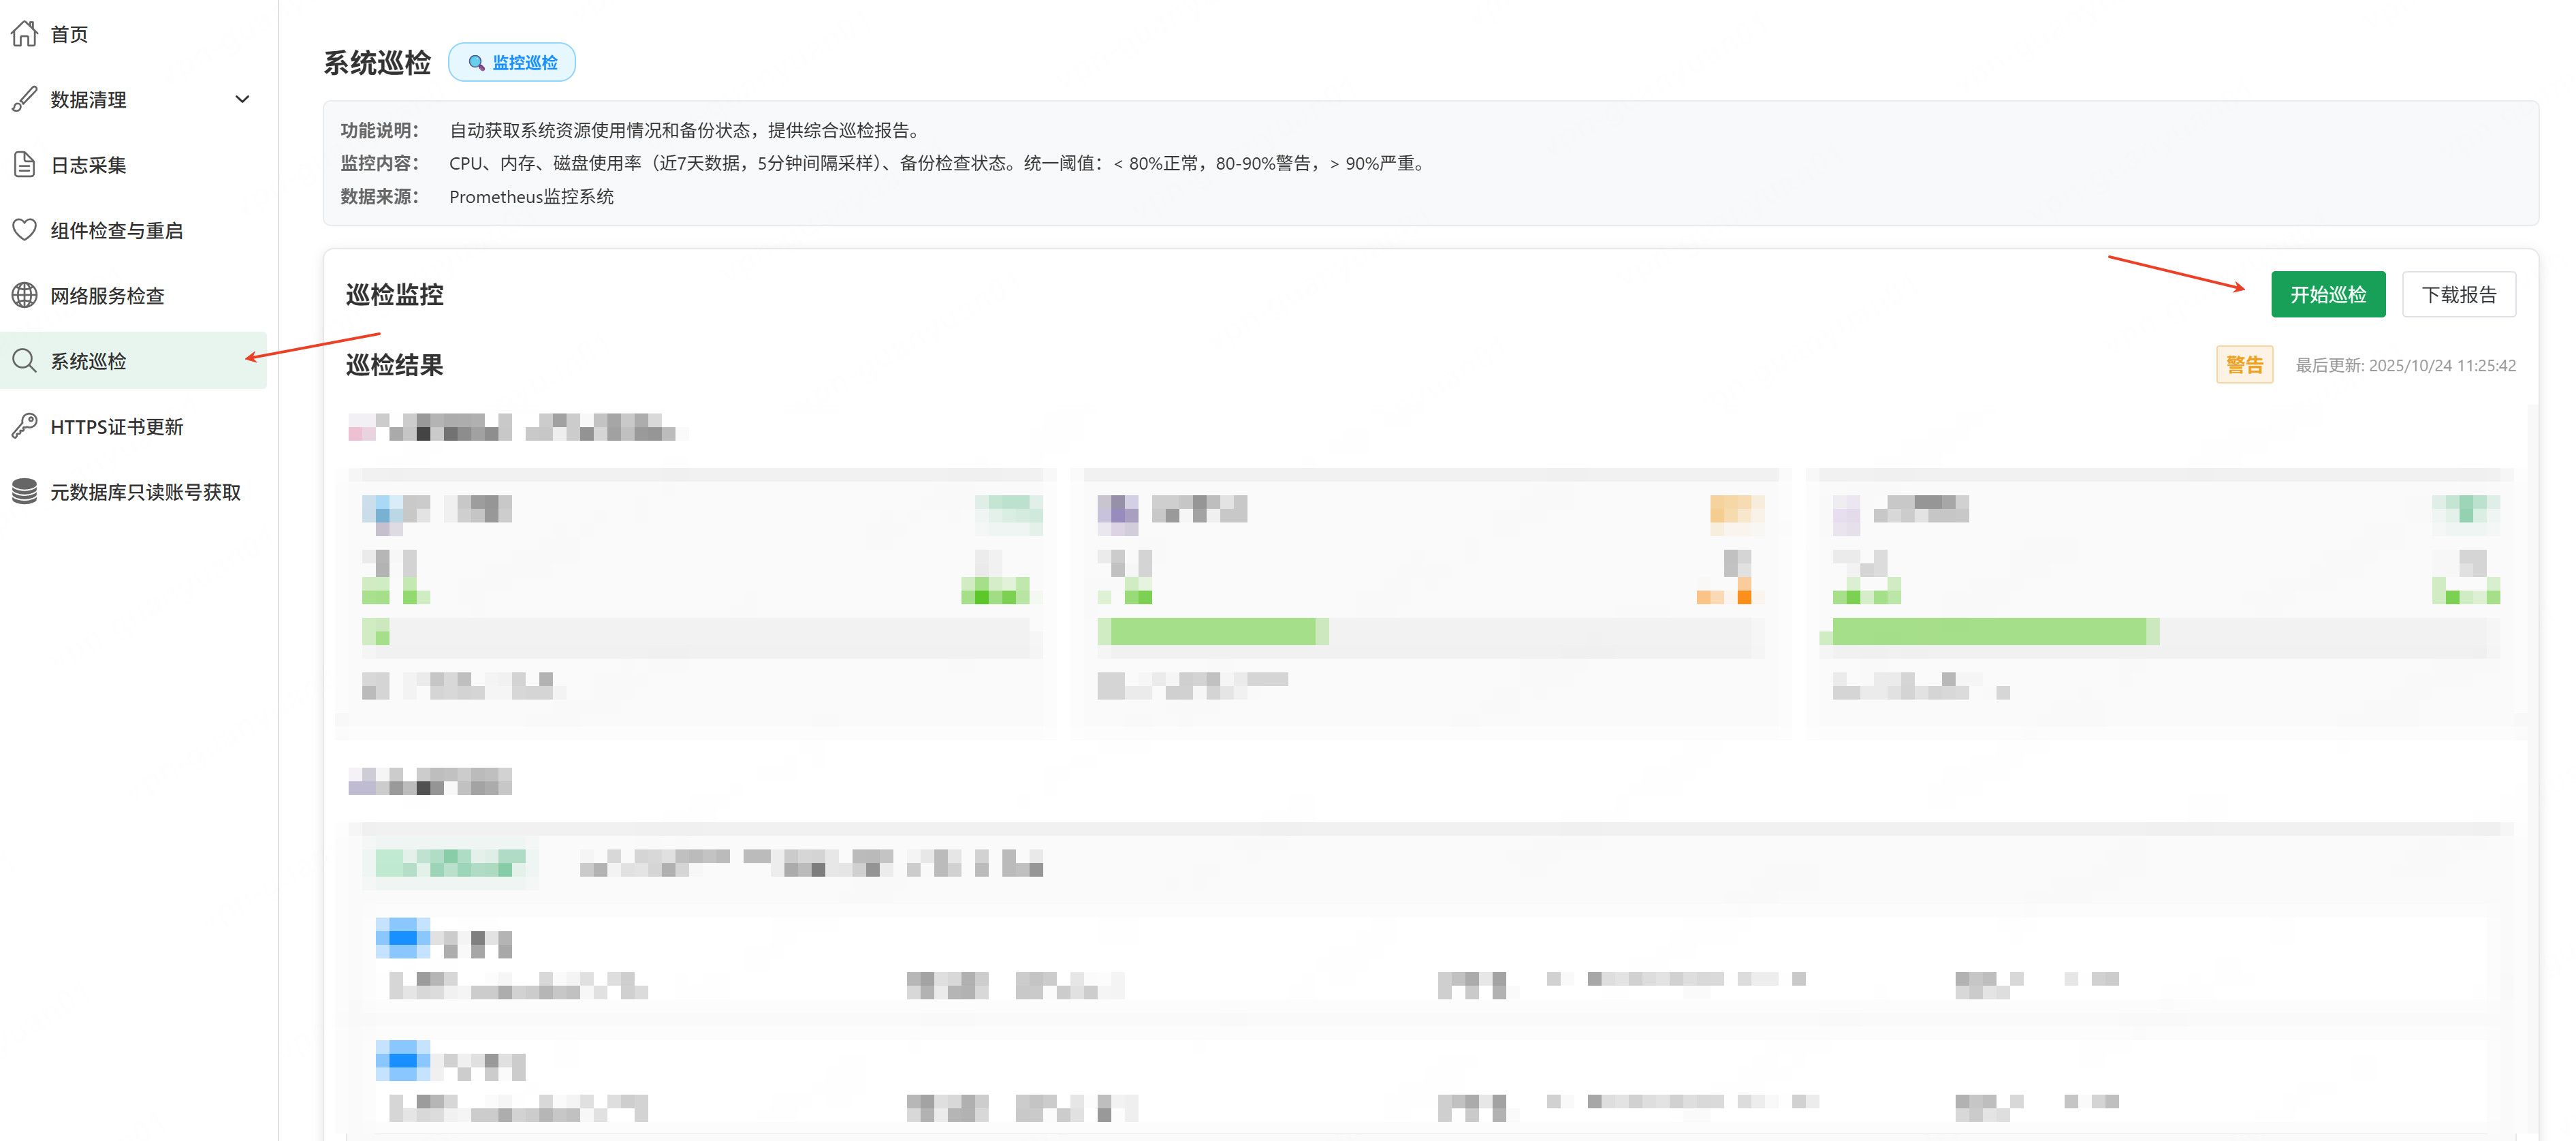
Core value: Automatically obtains resource usage and backup check status for the last seven days, generates an inspection report (Word) with one click, and provides comprehensive health conclusions and remediation suggestions.
-
Inspection content:
- Resource usage: CPU, memory, and disk, sampled every five minutes. Thresholds: <80% normal, 80-90% warning, >90% critical.
- Backup check: Whether backups exist, record count, host count, and latest backup time.
- Inspection suggestions: Generate graded suggestions based on resource and backup status, and provide suggestions for priority issues based on fault analysis results.
-
Report style (Word):
- Resource status: Normal is marked green, warning yellow, and critical red.
- Backup status: Existing backups are marked green, and no backups are marked red.
- Fault item priority: High red, Medium yellow, Low green. The page uses the same colors.
-
Procedure:
- Click Start Inspection.
- After completion, view the inspection information on the page or click Download Report to obtain the Word document.
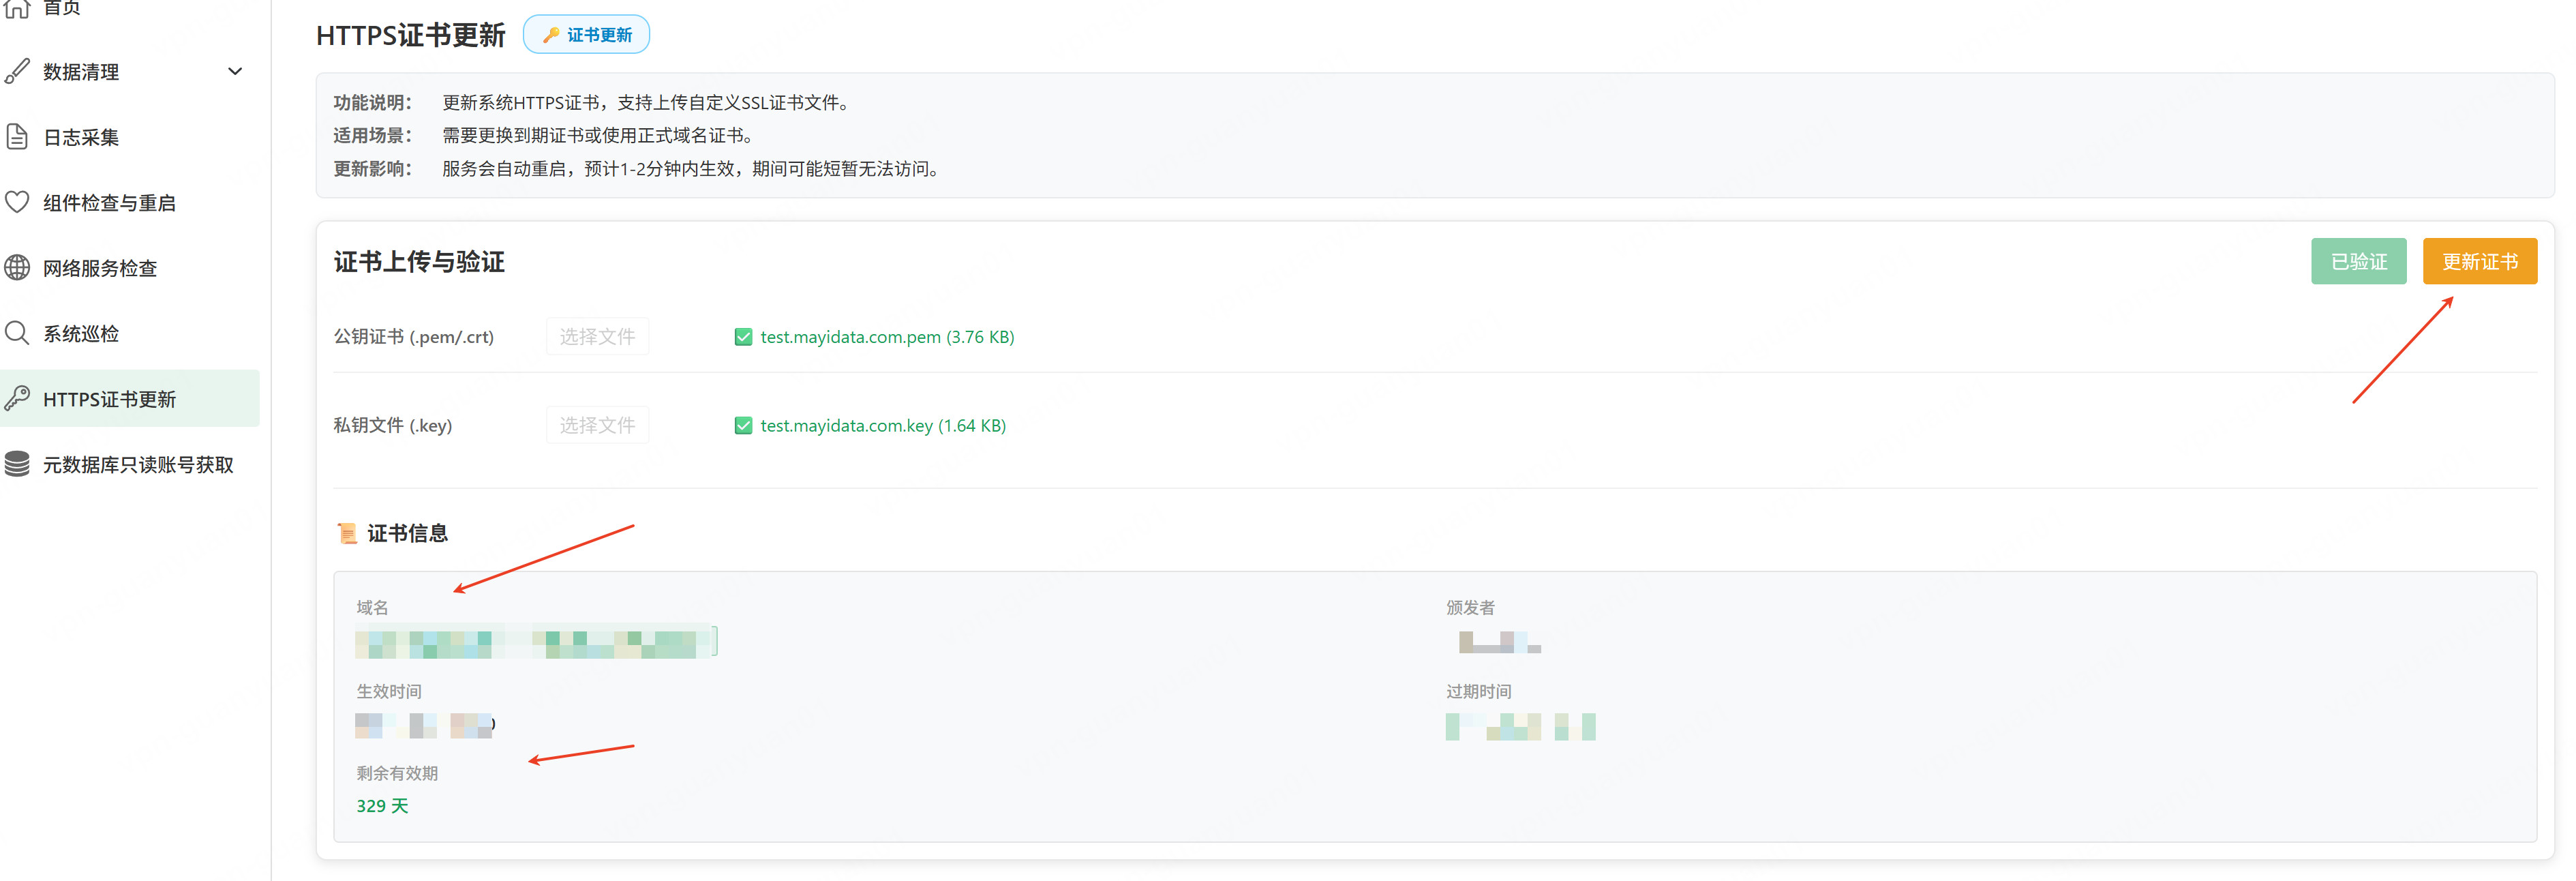
HTTPS Certificate Update
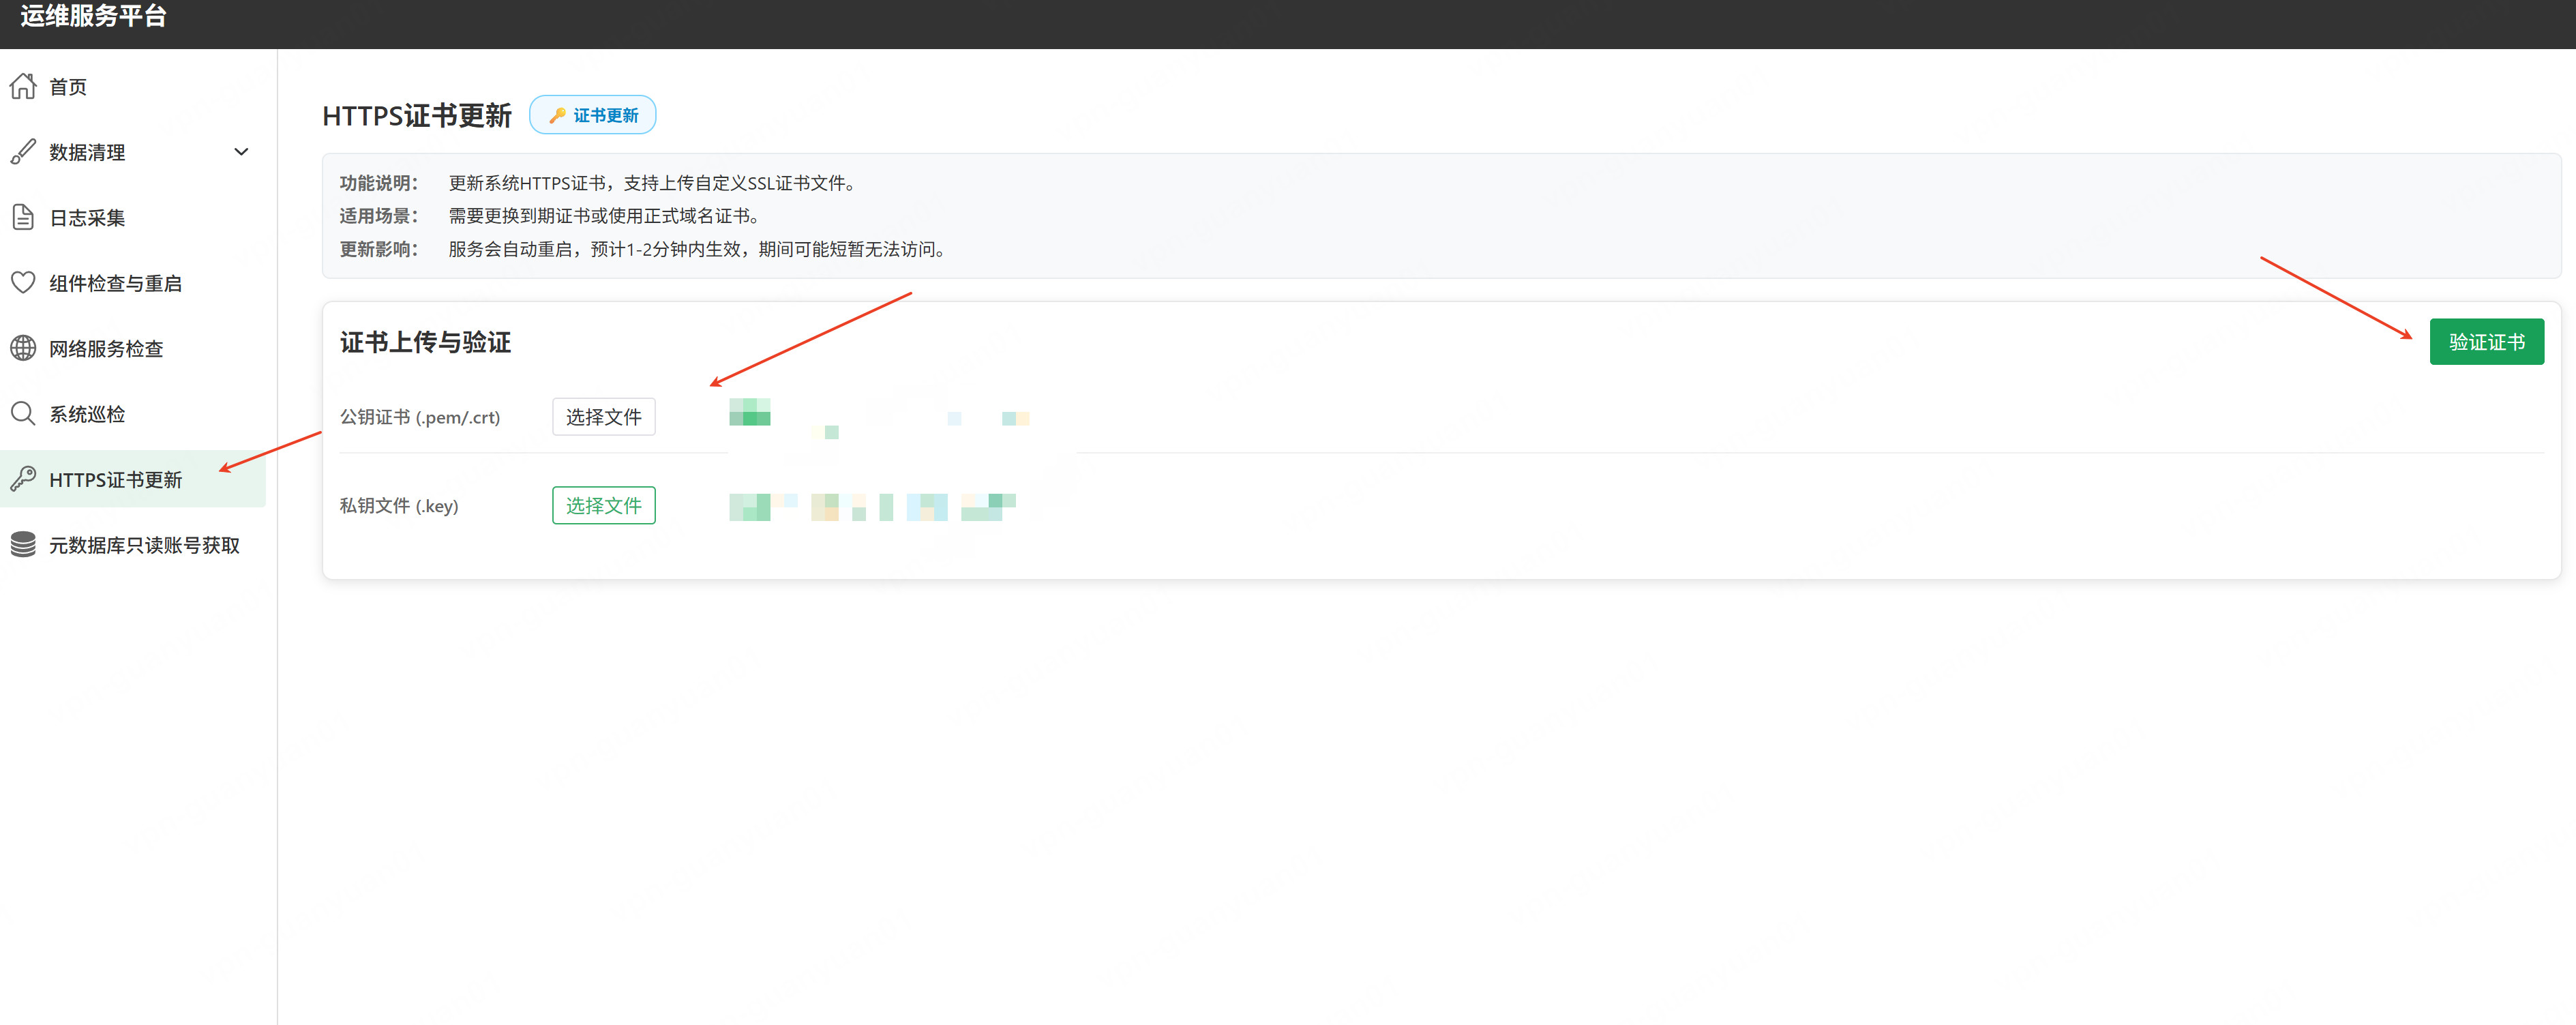
Core value: Safely updates the platform HTTPS certificate through the web interface.
-
Scenario: The certificate is about to expire or needs to be replaced.
-
Procedure:
- Upload the new certificate and private key on the certificate management page.
- Click Validate Certificate to confirm that the domain and expiration time are correct.
- If everything is correct, click Update Certificate. The platform automatically completes replacement and service restart.
- The page displays update progress and results, including prompts while waiting for service restart.
-
Risk note: The update process may briefly affect external access. Perform it during off-peak hours.
If a non-standard deployment is detected, the system displays: nginx-proxy service not detected. Certificate update cannot be used.
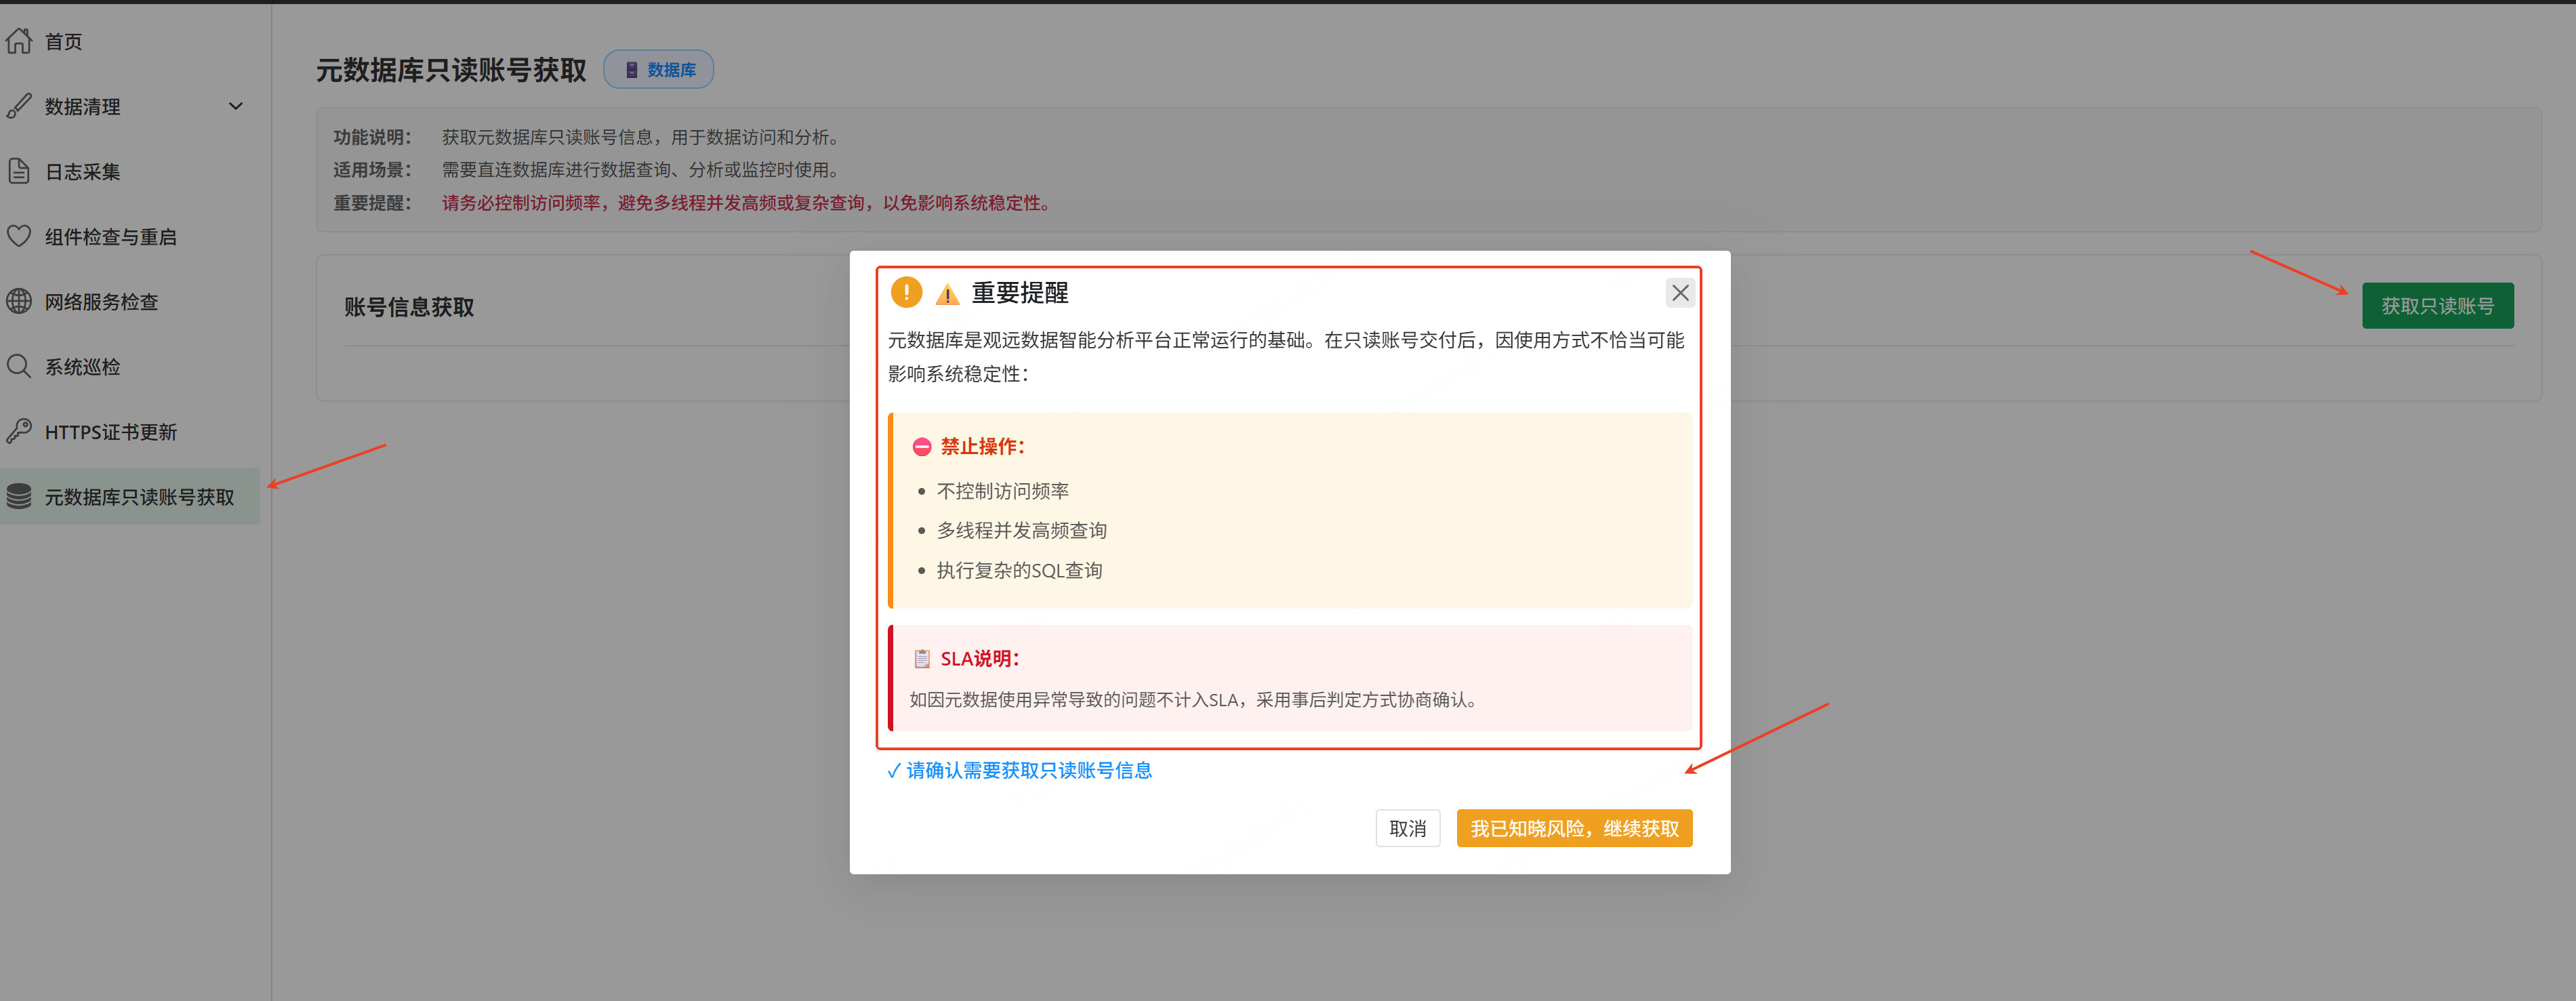
Obtain a Read-only Metadata Database Account
Core value: Provides a secure and compliant database account for read-only analysis.
-
Scenario: System metadata needs to be queried for analysis and diagnosis without write operations.
-
Procedure:
- Open the Read-only Account page and click Obtain Read-only Account.
- Carefully review the risk prompt. After confirming it is correct, click Obtain.
-
Security note: Control the access frequency and avoid high-frequency concurrent multi-threaded or complex queries, so system stability is not affected.