Getting Started Example
Overview
Through this case, quickly experience the entire process from metric definition to analysis. This case will create the following sales-related metrics based on the order table and present visualization effects on the data analysis card to analyze the sales profitability of each province.
| Metric Name | Metric Type | Calculation Method | Business Caliber |
|---|---|---|---|
| Total Cost Price | Atomic Metric | sum(Order Table Cost Price) | Valid total cost amount |
| Total Sales Amount | Atomic Metric | sum(Order Table Sales Amount) | Valid total sales amount |
| Sales Gross Profit | Composite Metric | Total Sales Amount - Total Cost Price | Sales Gross Profit = Sales Amount - Cost Price |
| Sales Gross Profit YoY | Derived Metric | YoY/MoM - Annual MoM - Growth Rate | Sales Gross Profit YoY ratio |
Operation Steps
Step 1: Integrate Dataset
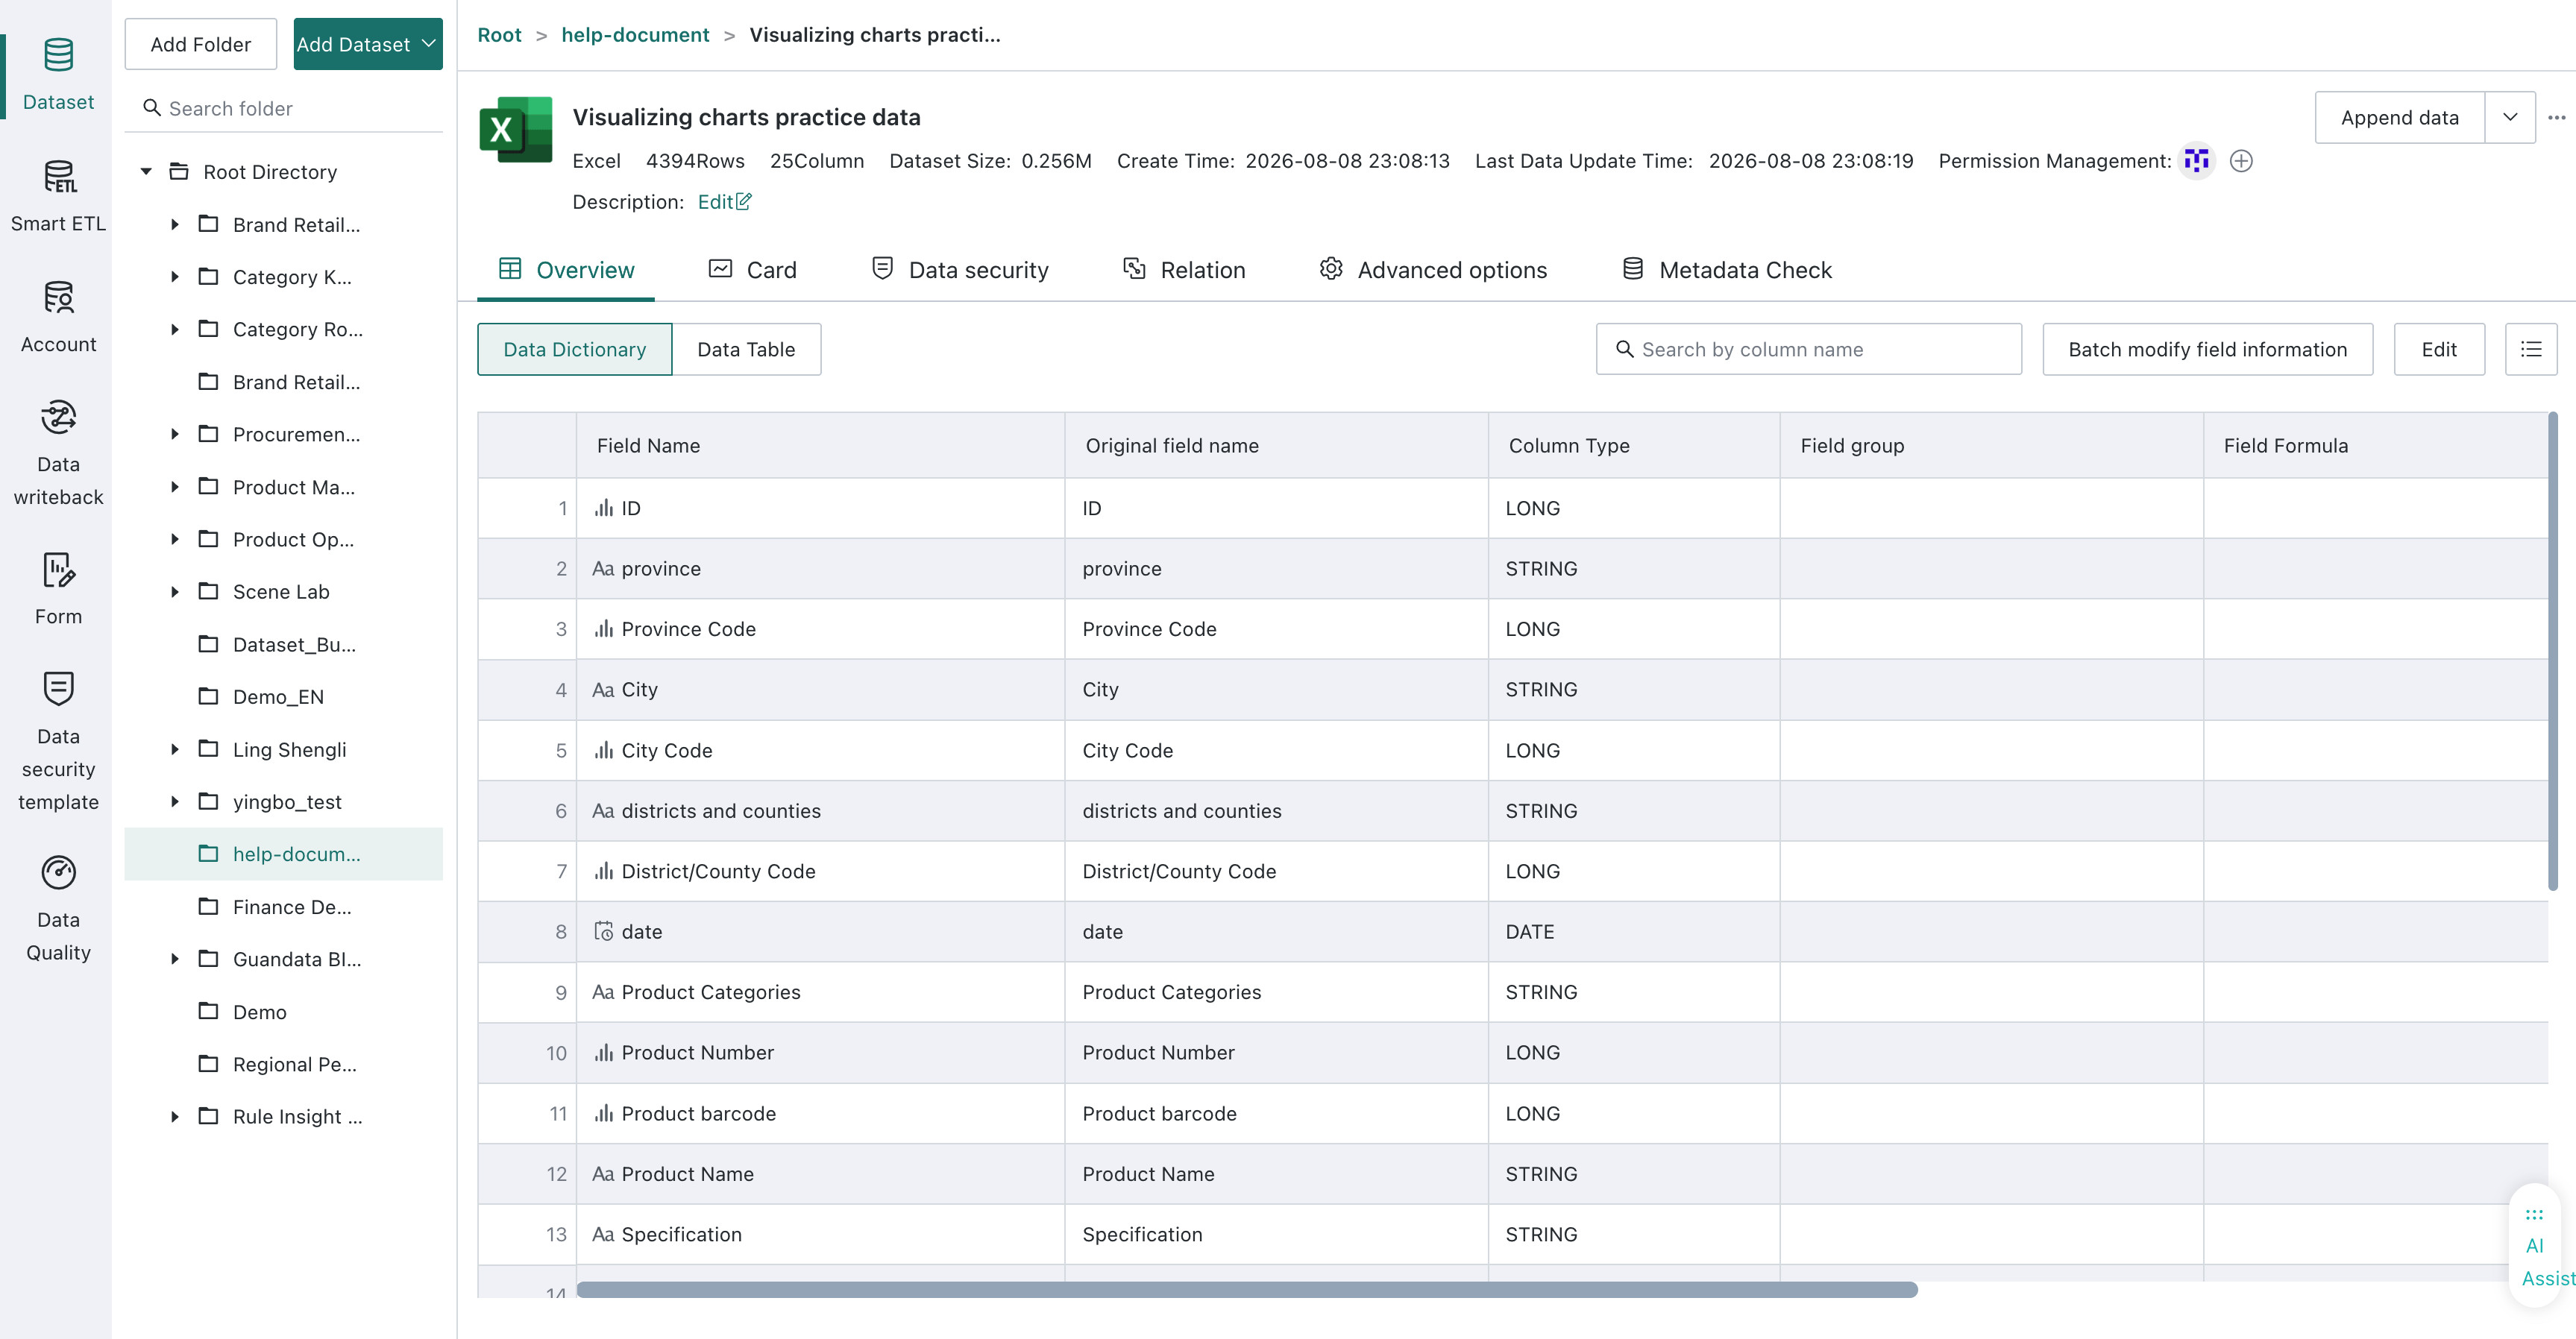
In the "Data Preparation" module of Guandata BI, integrate the dataset needed for creating metrics. This example uses local Excel file import. For specific operations, see Local Files
Original data table: Visualization Chart Practice Data
Step 2: Create Public Dimensions
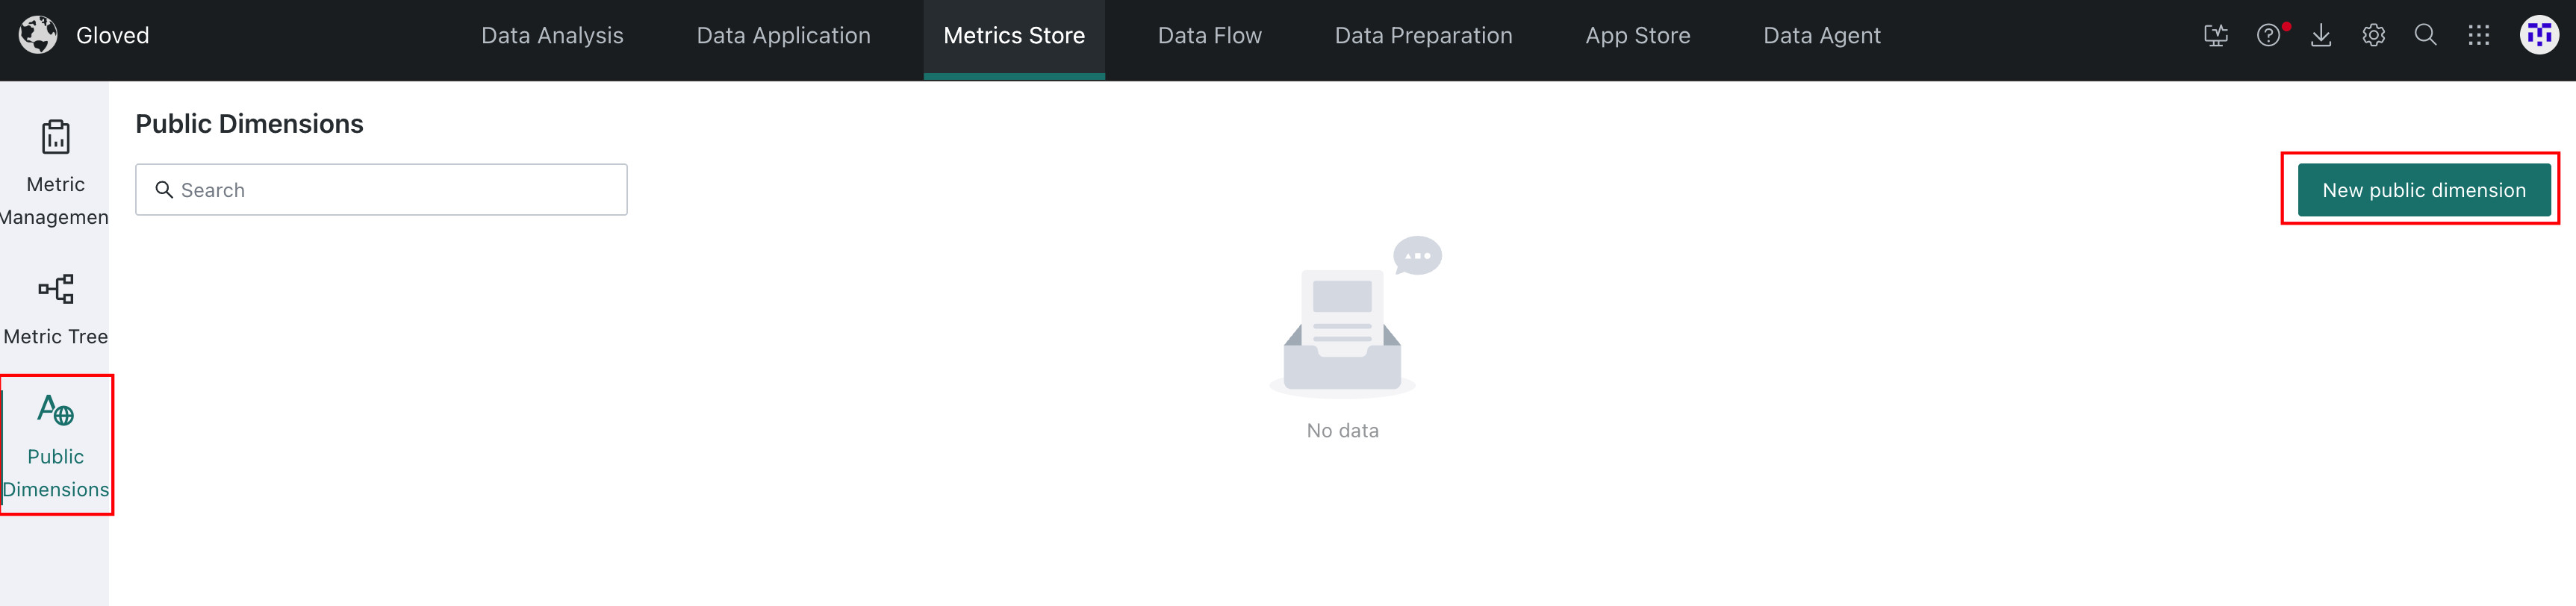
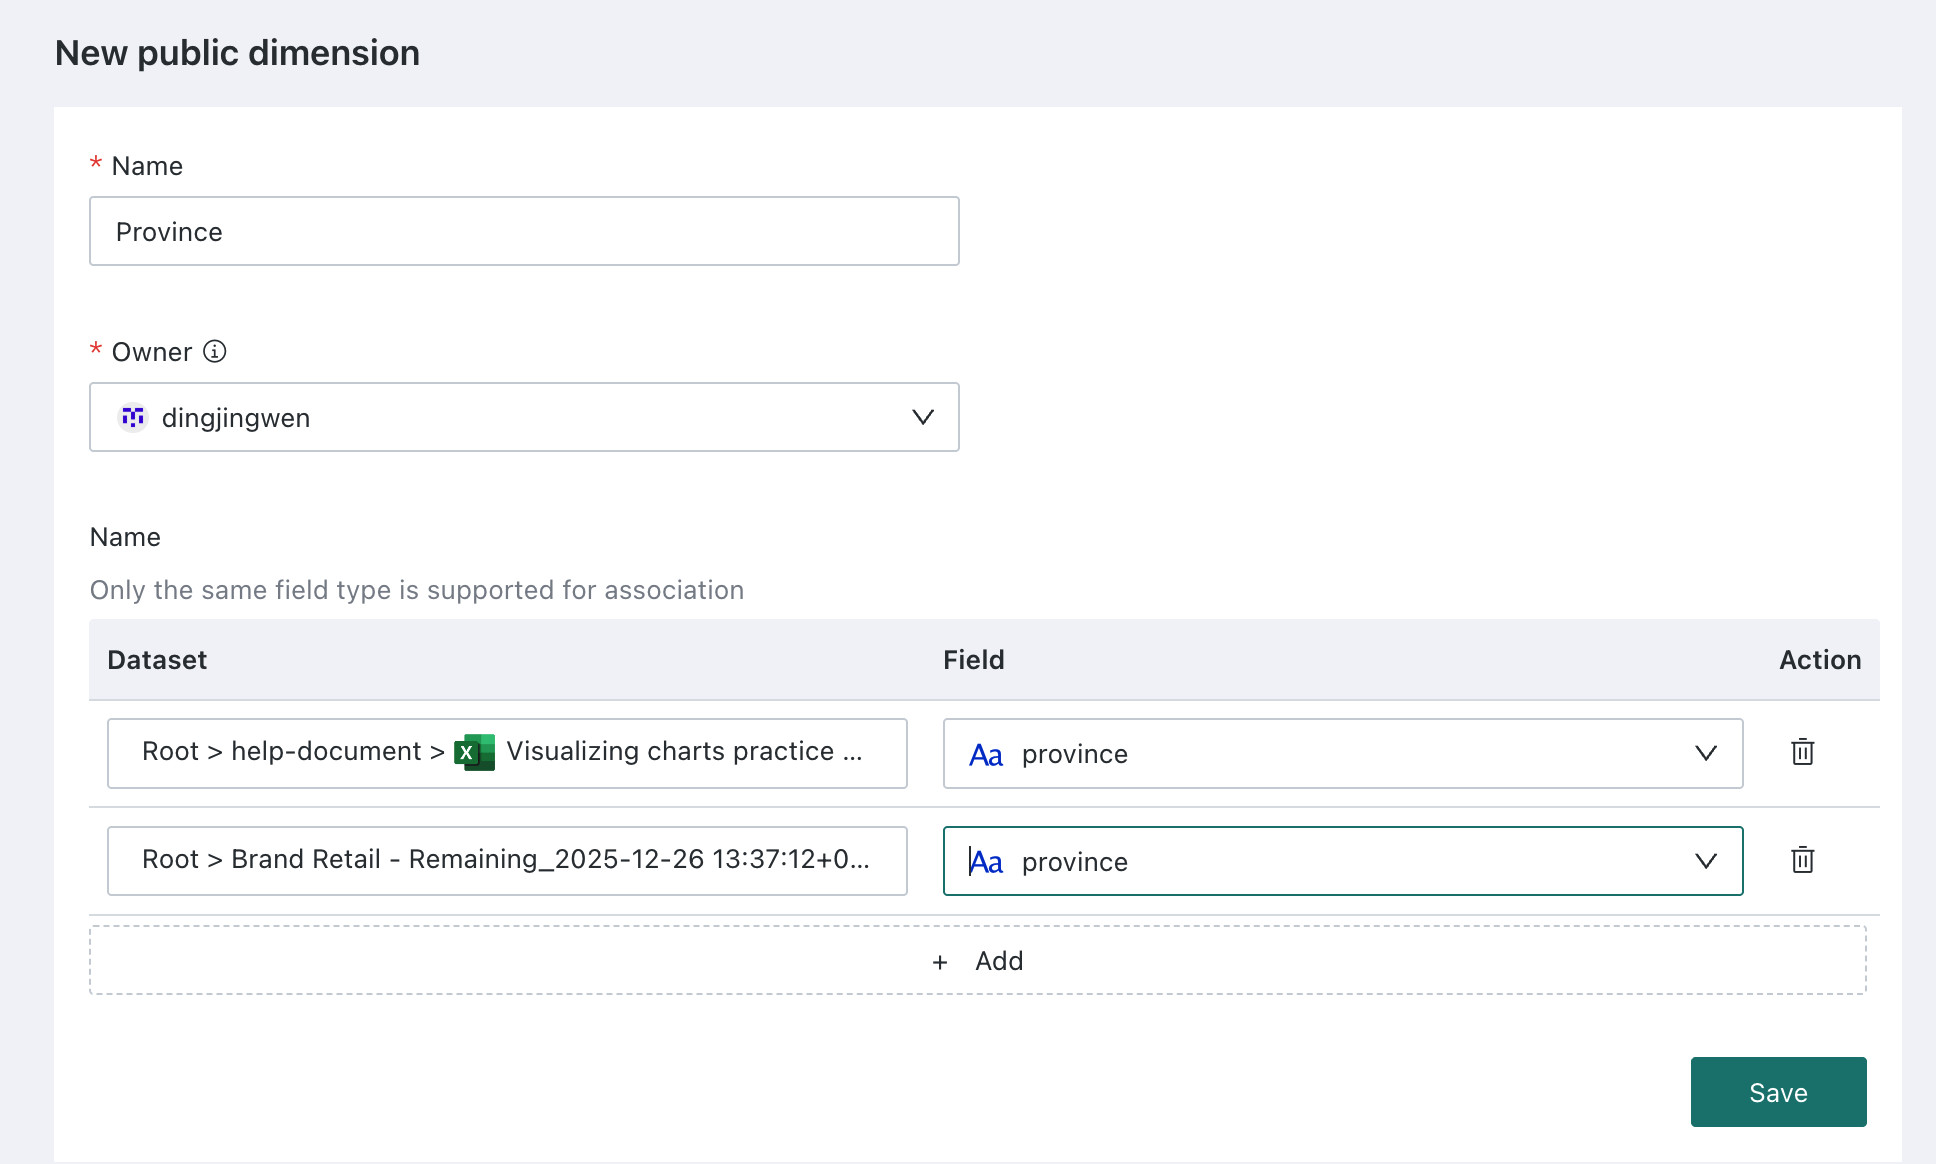
Enter the "Public Dimensions" module. According to the needs of dimension analysis, we set Province as a public dimension. Associate the province field in the datasets that will be used later with it, so that the dimension representing the province in different metrics will be uniformly named as "Province".
Step 3: Create Metrics
Create Metric Topic and Folder
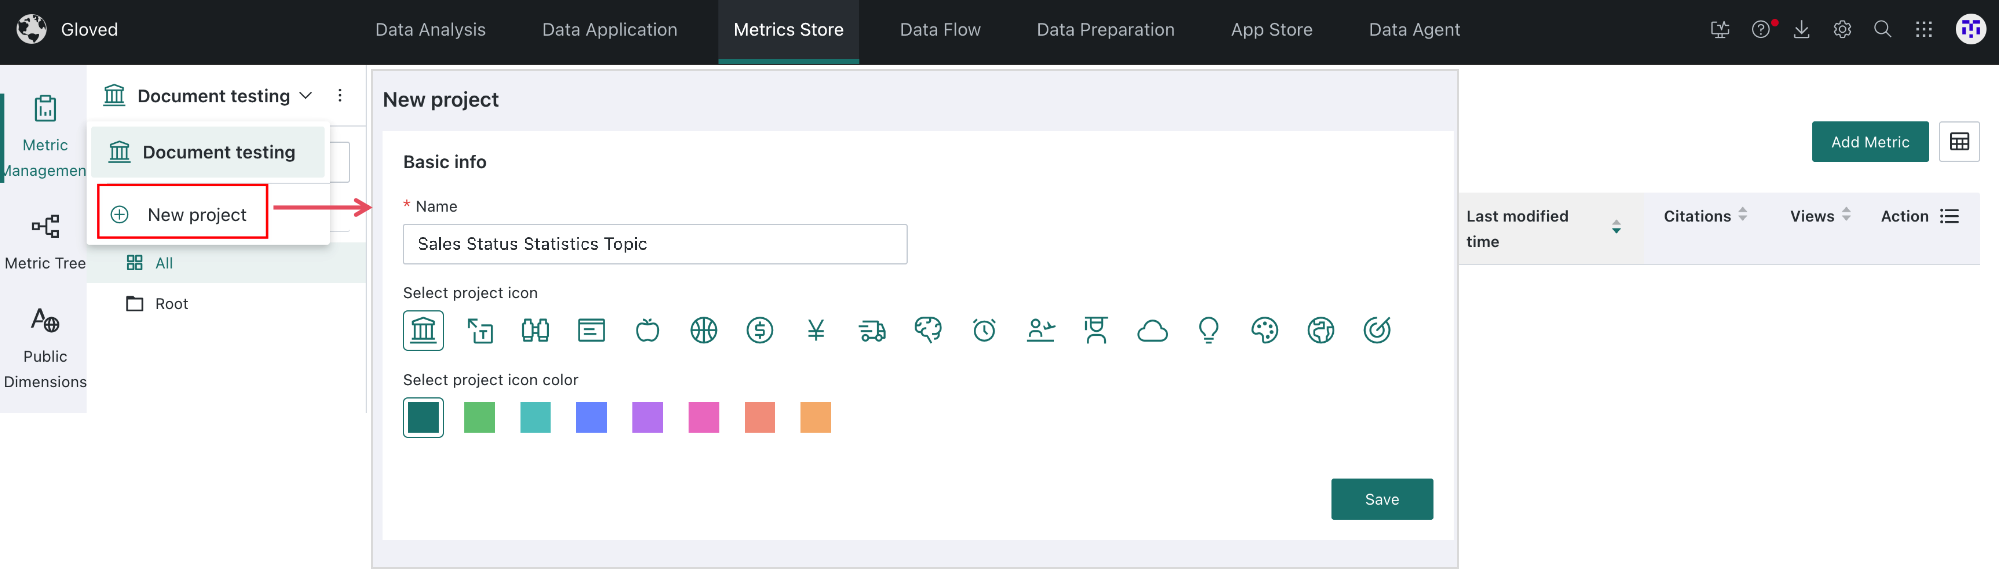
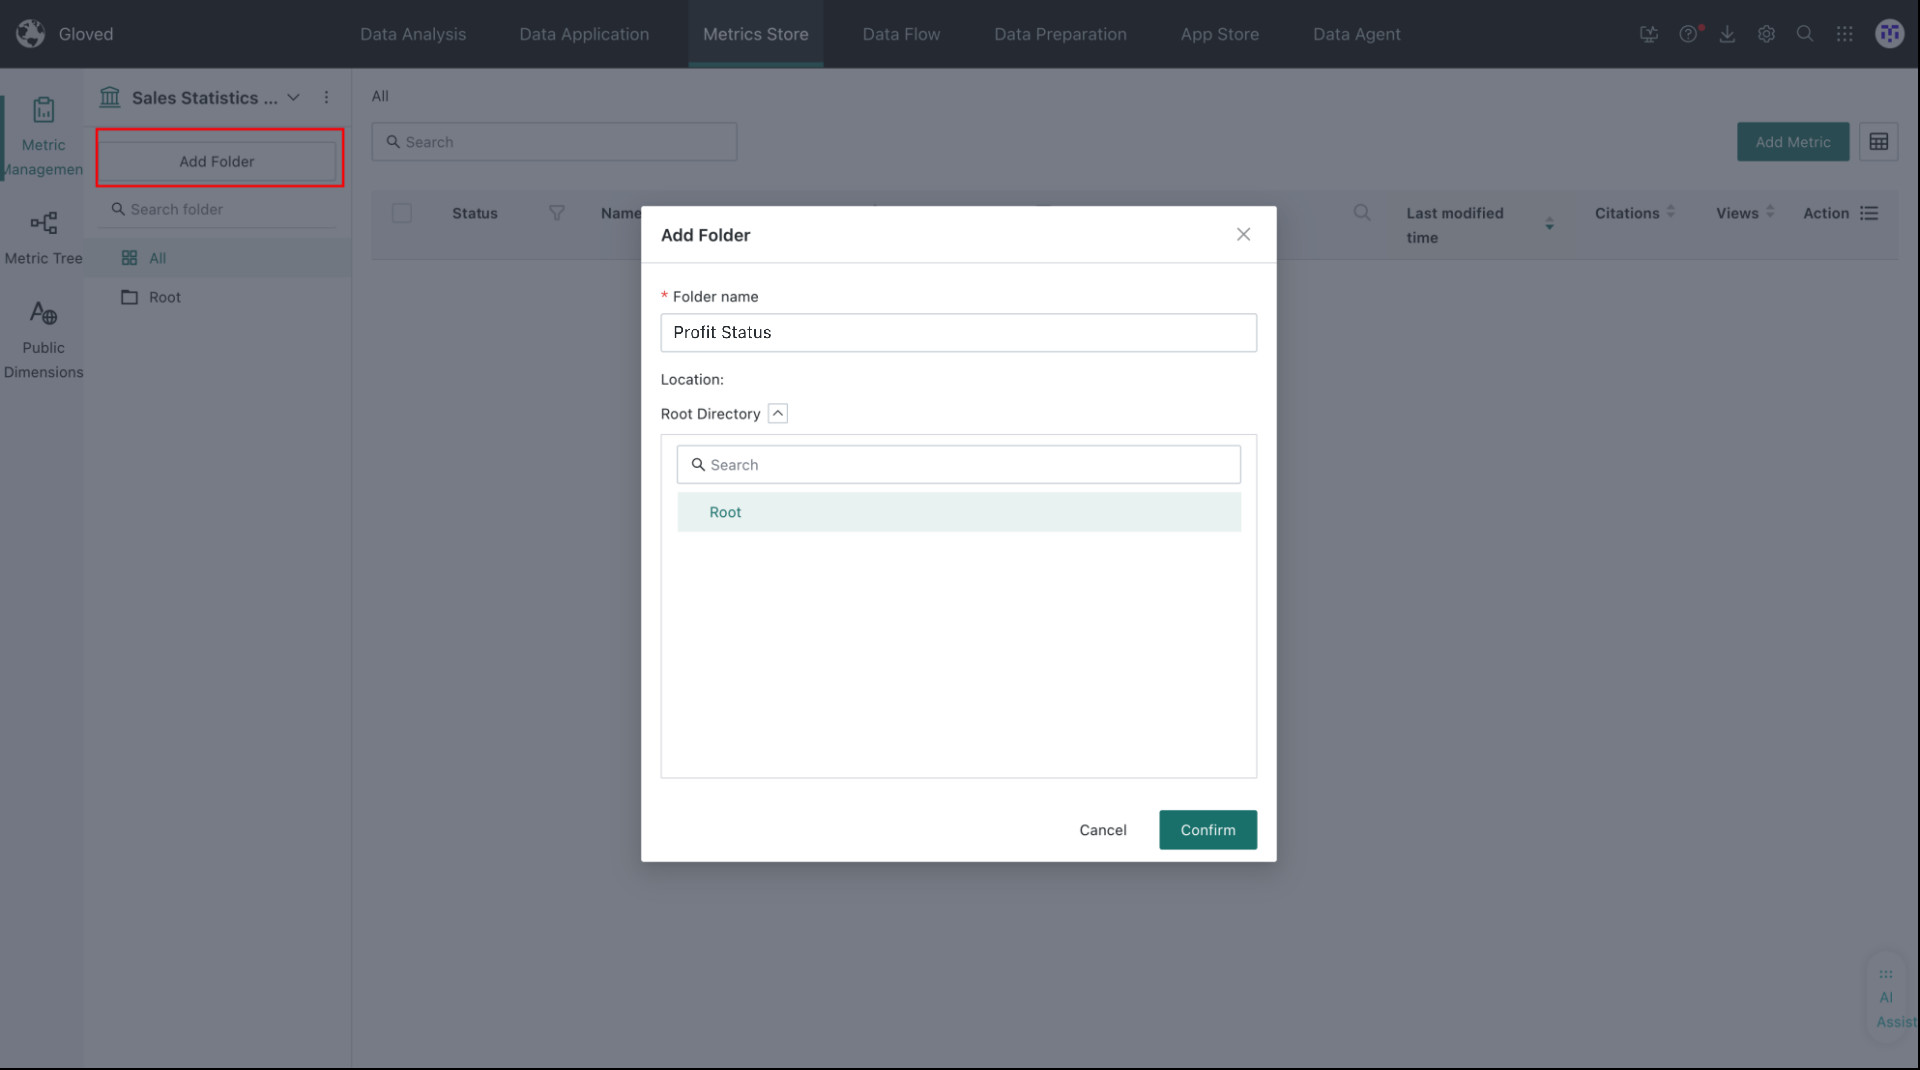
Enter the "Metric Topic" module and create a new "Sales Status Statistics Topic" and "Profit Status" folder to create metrics related to sales status statistics and profit status.
Create Atomic Metrics
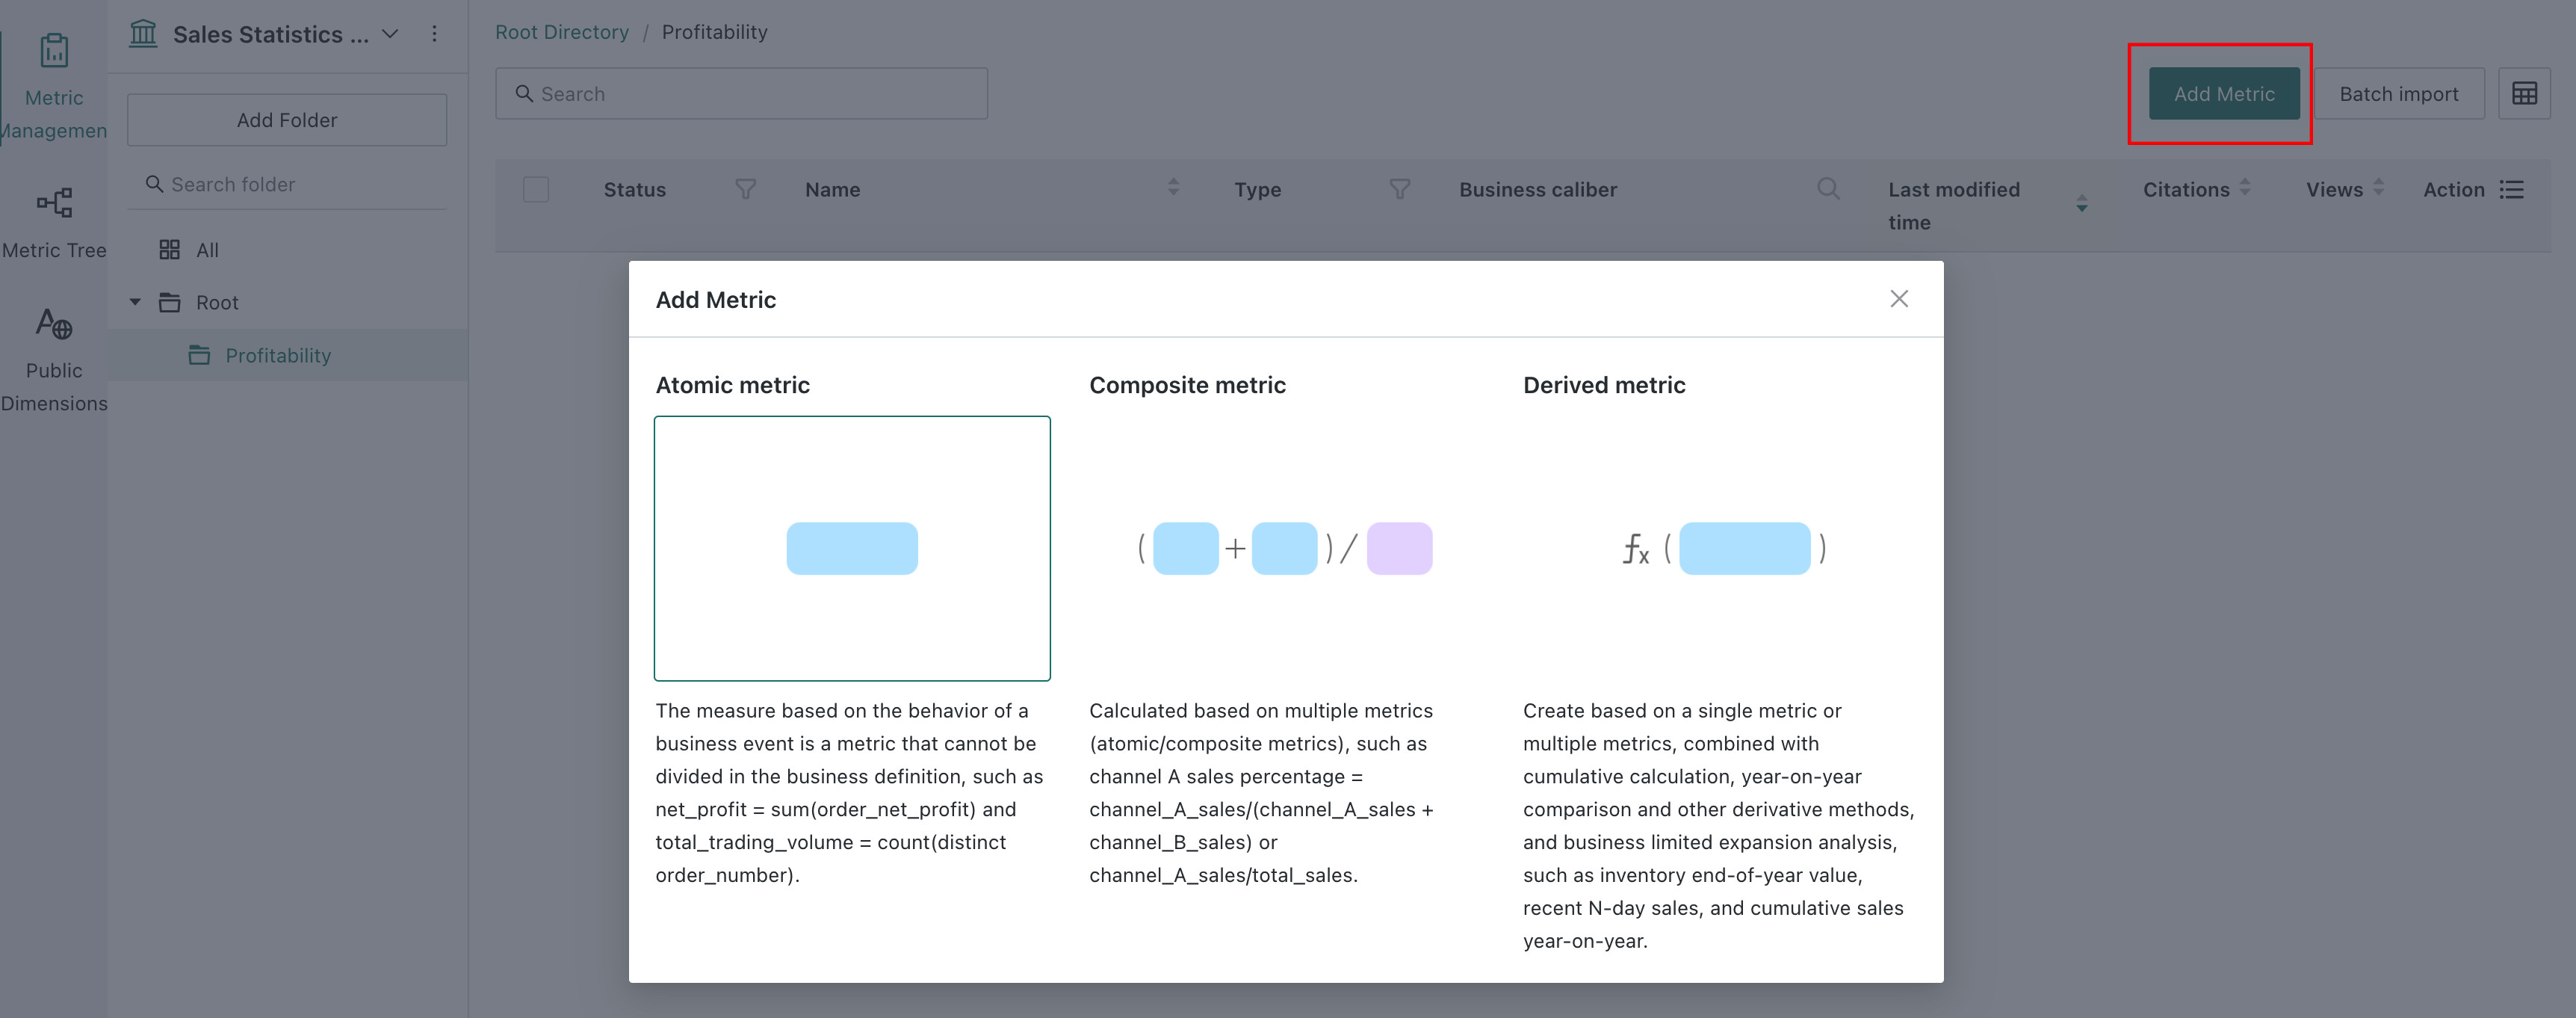
Click "Add Metric" in the "Metric Topic" module and select Atomic Metric.
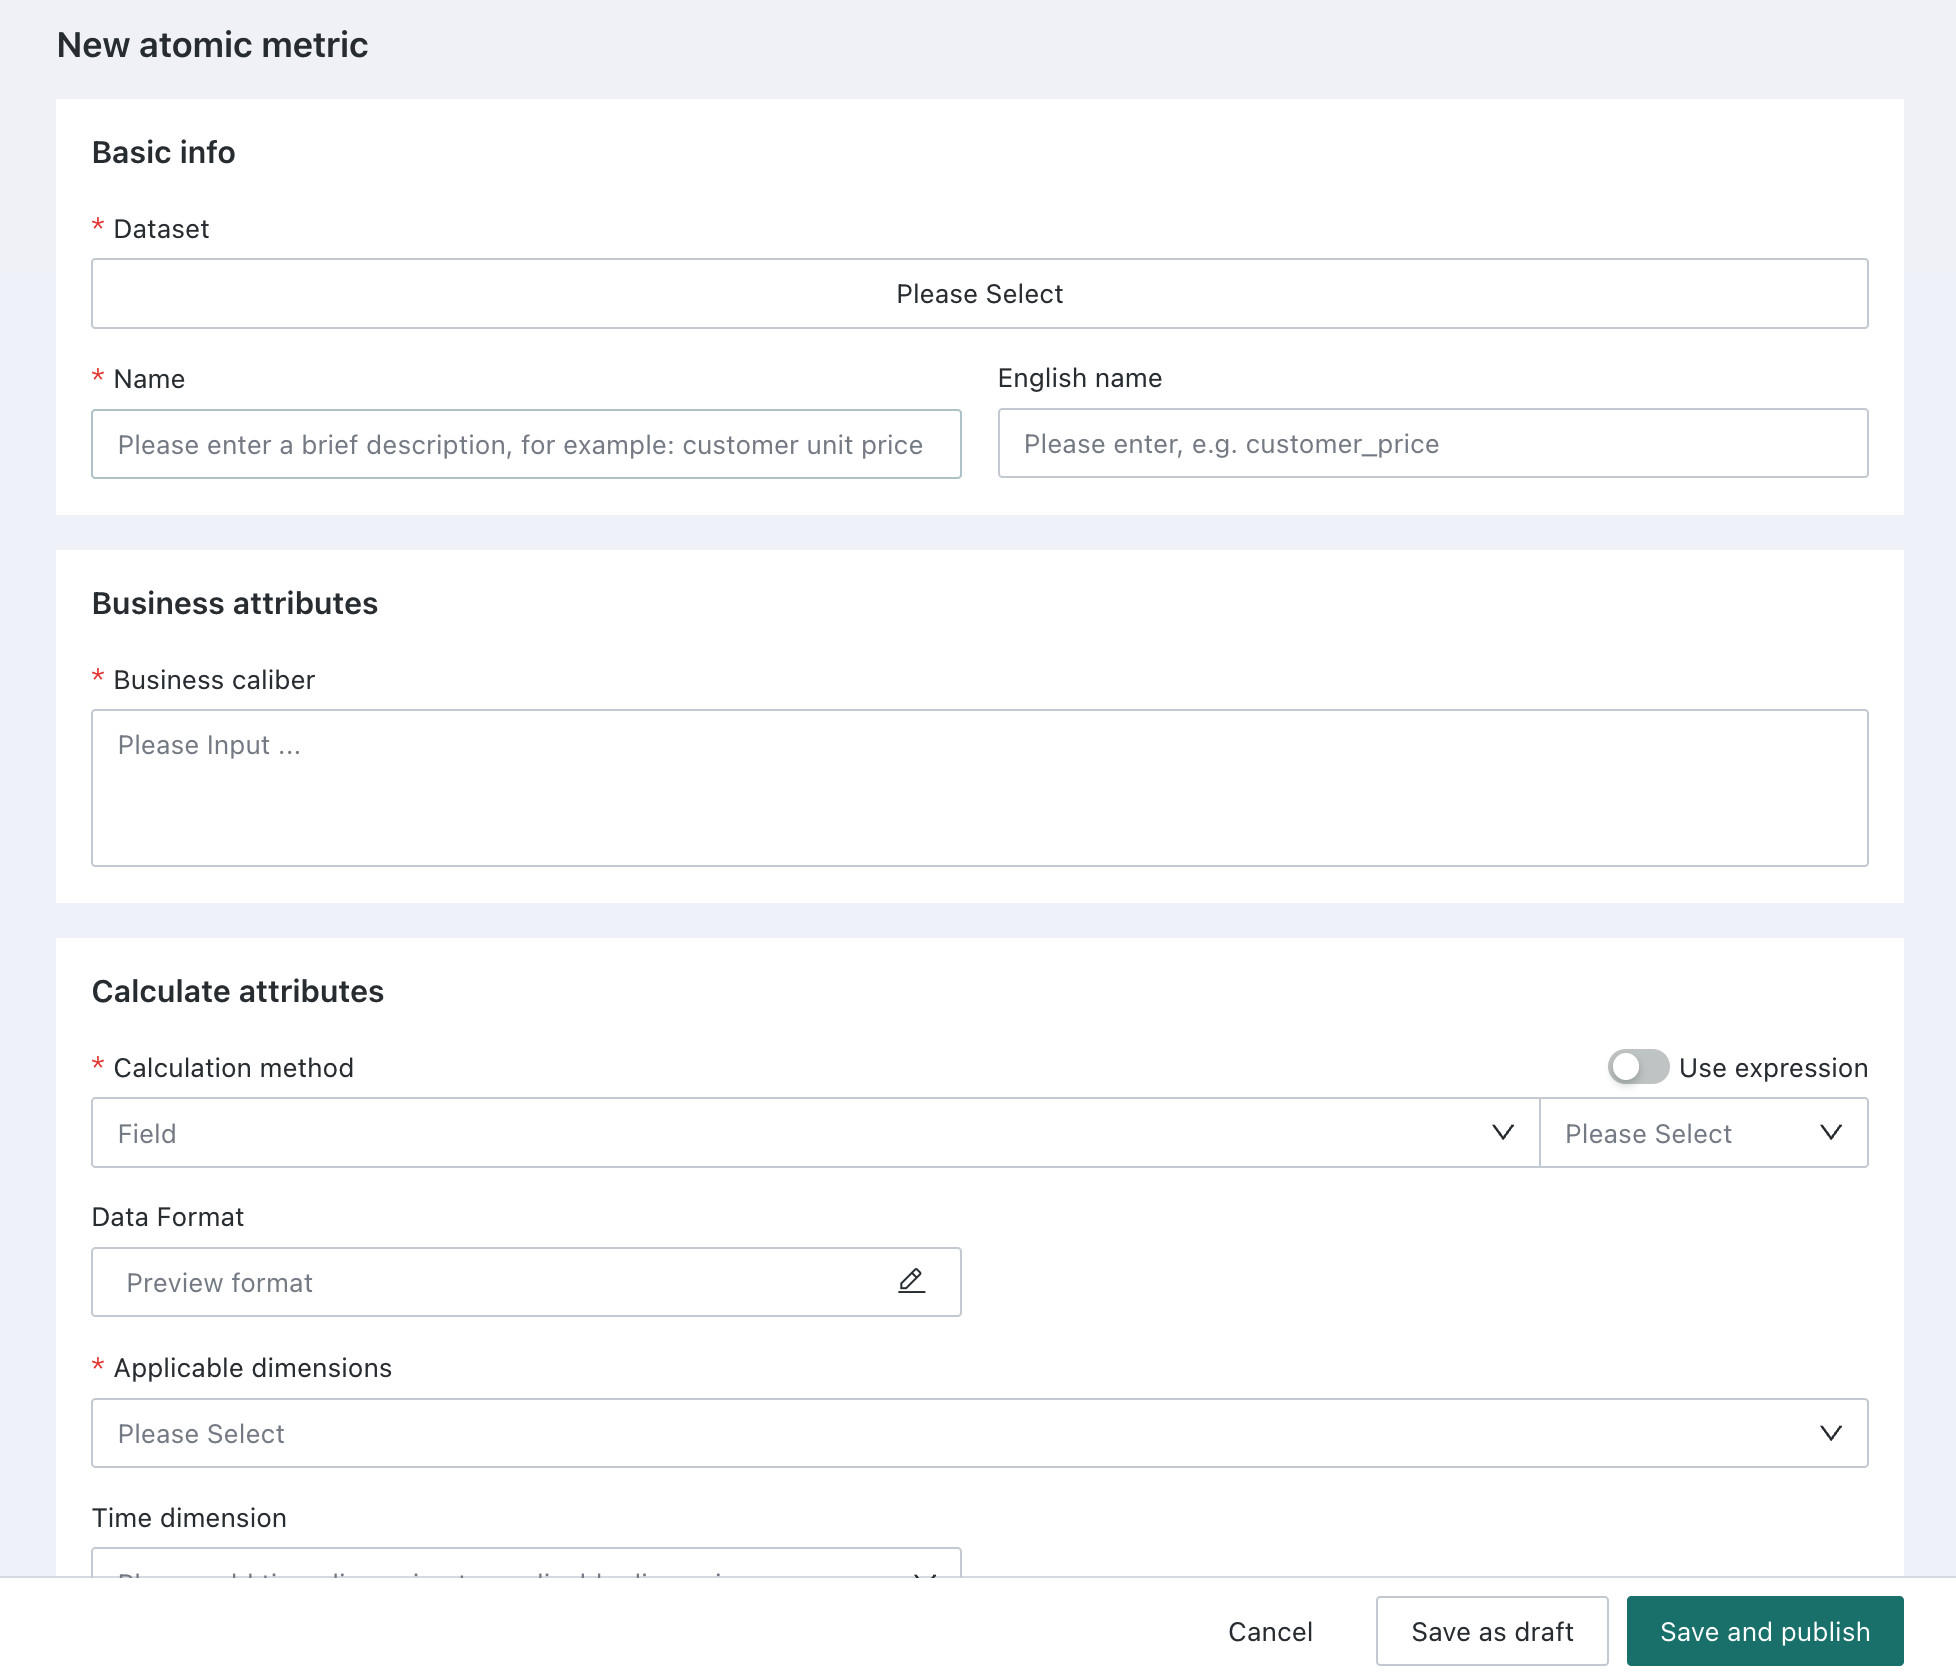
Create the first metric "Total Cost Price". After filling in the information, click "Save". The configuration items are as follows:
- Dataset: Select the required Order Table
- Source Field: Select Cost Price
- Calculation Method: Select Sum
- Data Format: Select Currency
- Applicable Dimensions: Select as needed, recommended to select Date and Province
- Filter Condition: To ensure the metric data is valid and can guide future business strategies, configure the condition as Cost Price > 0 and Inventory Status != 0
- Business Caliber: Valid total cost amount
- Save to: Profit Status folder
Create the second metric "Total Sales Amount". After filling in the information, click "Save". The configuration items are as follows:
- Dataset: Select the required Order Table
- Source Field: Select Sales Amount
- Calculation Method: Select Sum
- Data Format: Select Currency
- Applicable Dimensions: Select as needed, recommended to select Date and Province
- Filter Condition: To ensure the metric data is valid and can guide future business strategies, configure the condition as Cost Price > 0 and Inventory Status != 0
- Business Caliber: Valid total sales amount
- Save to: Profit Status folder
Create Composite Metric
Click "New Metric" in the "Metric Topic" module and select Composite Metric.
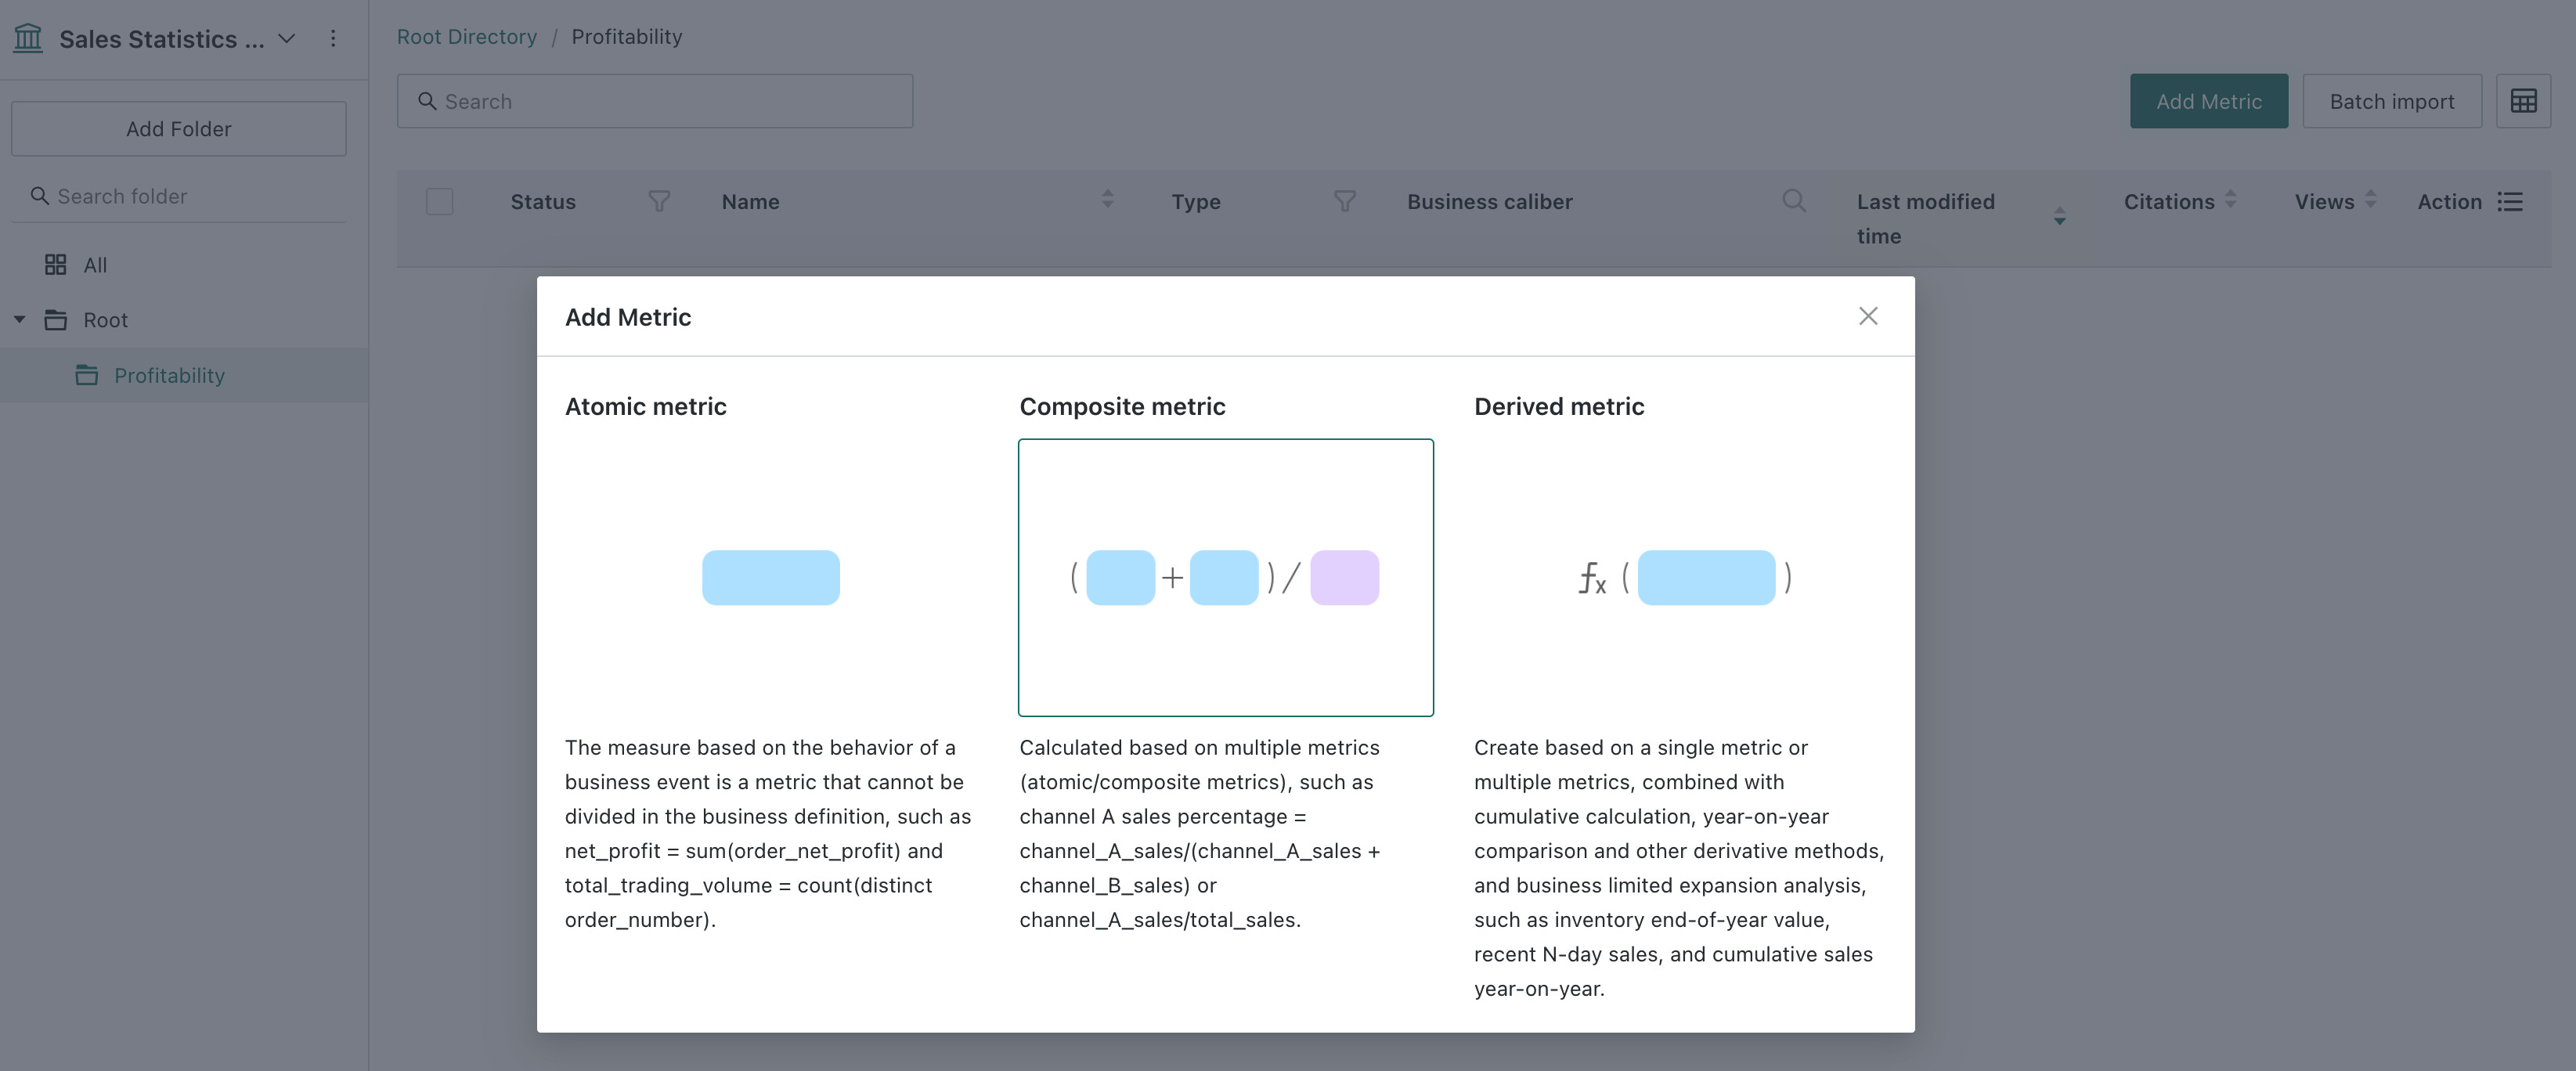
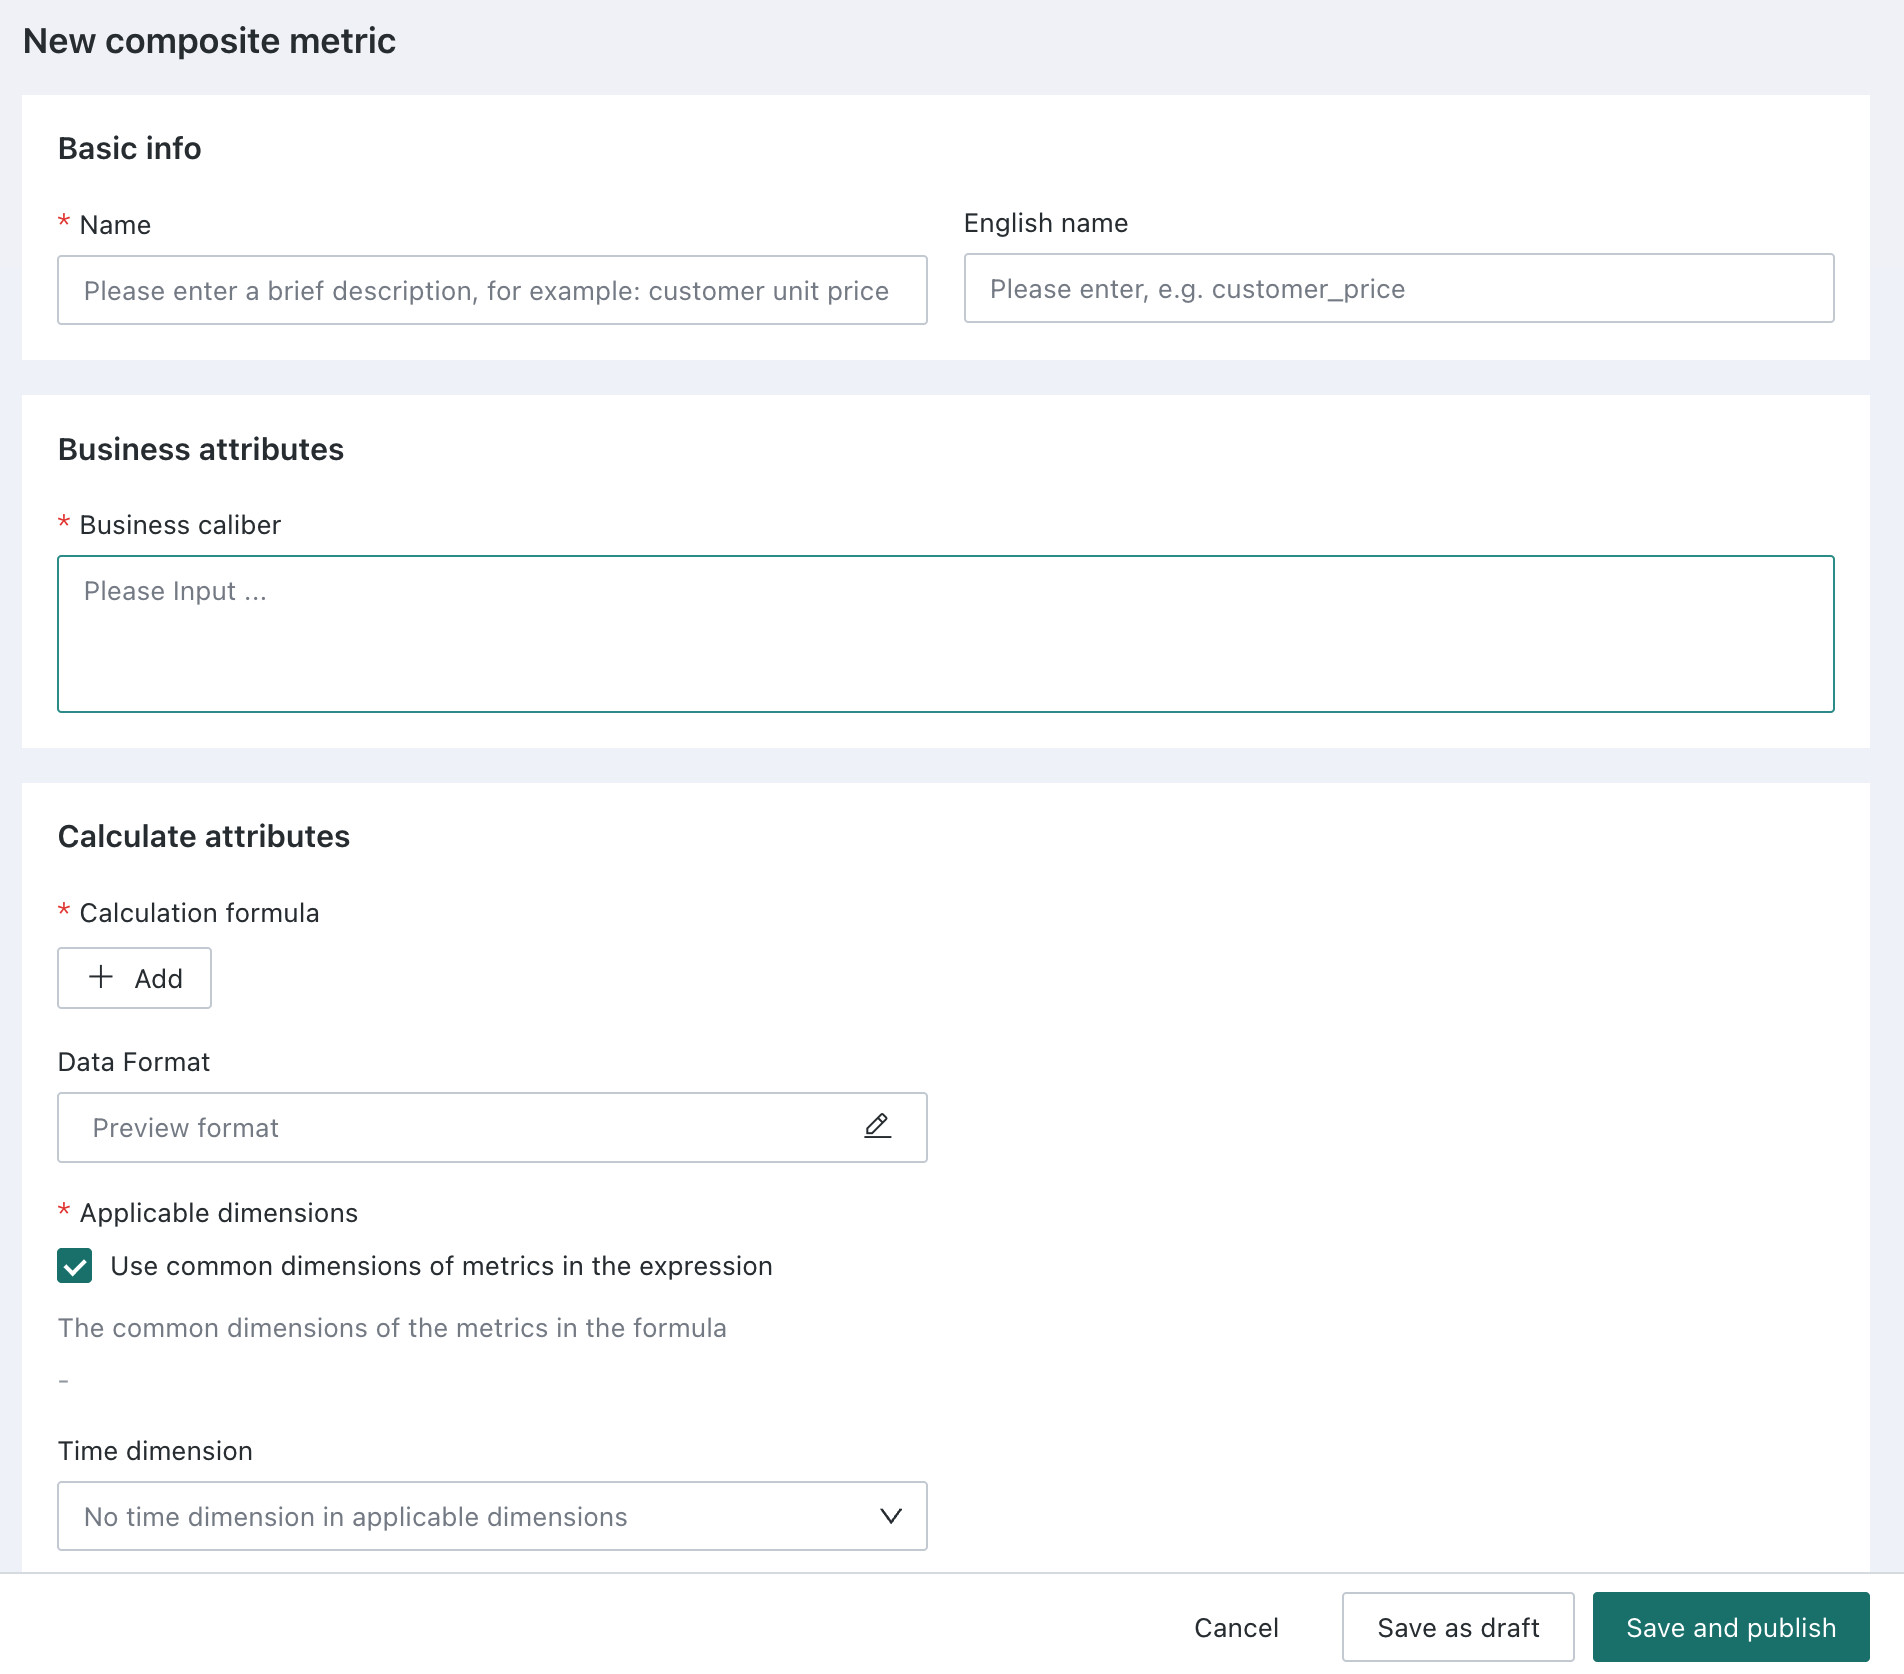
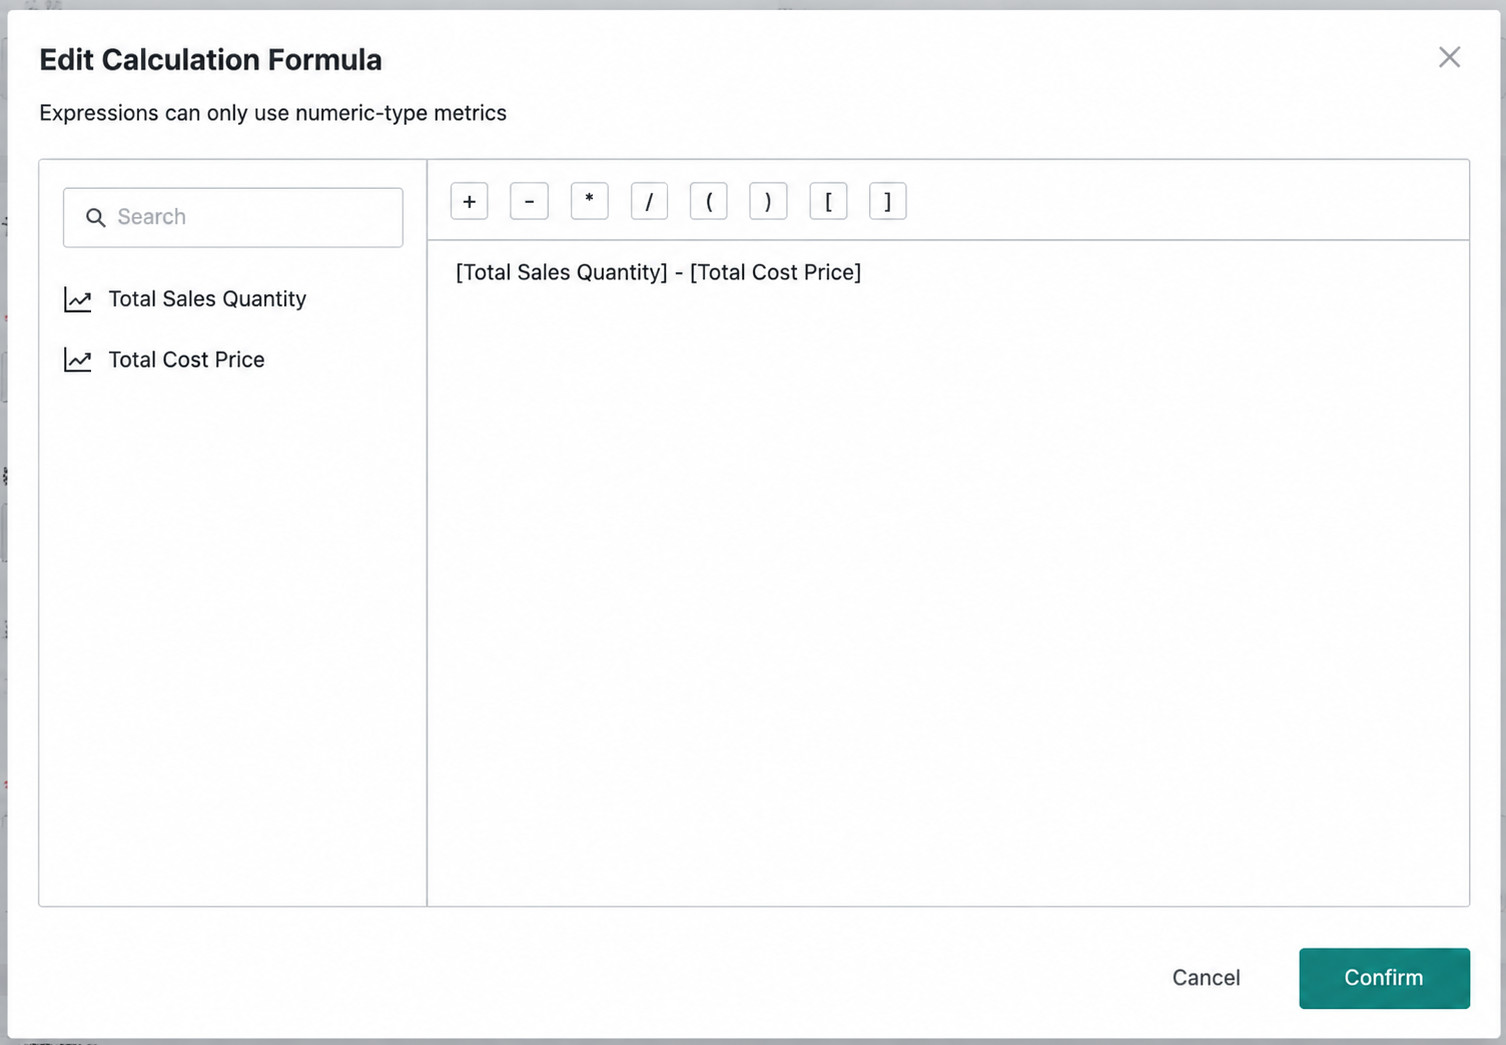
Create the third metric "Sales Gross Profit". After filling in the information, click "Save". The configuration items are as follows:
- Calculation Formula: Atomic Metric Sales Amount - Atomic Metric Cost Price
- Data Format: Select Currency
- Applicable Dimensions: Inherited from source metrics, cannot be modified
- Business Caliber: Sales Gross Profit = Sales Amount - Cost Price
- Save to: Profit Status folder
Create Derived Metric
In the "Metric Topic" module, click "New Metric" and select Derived Metric.
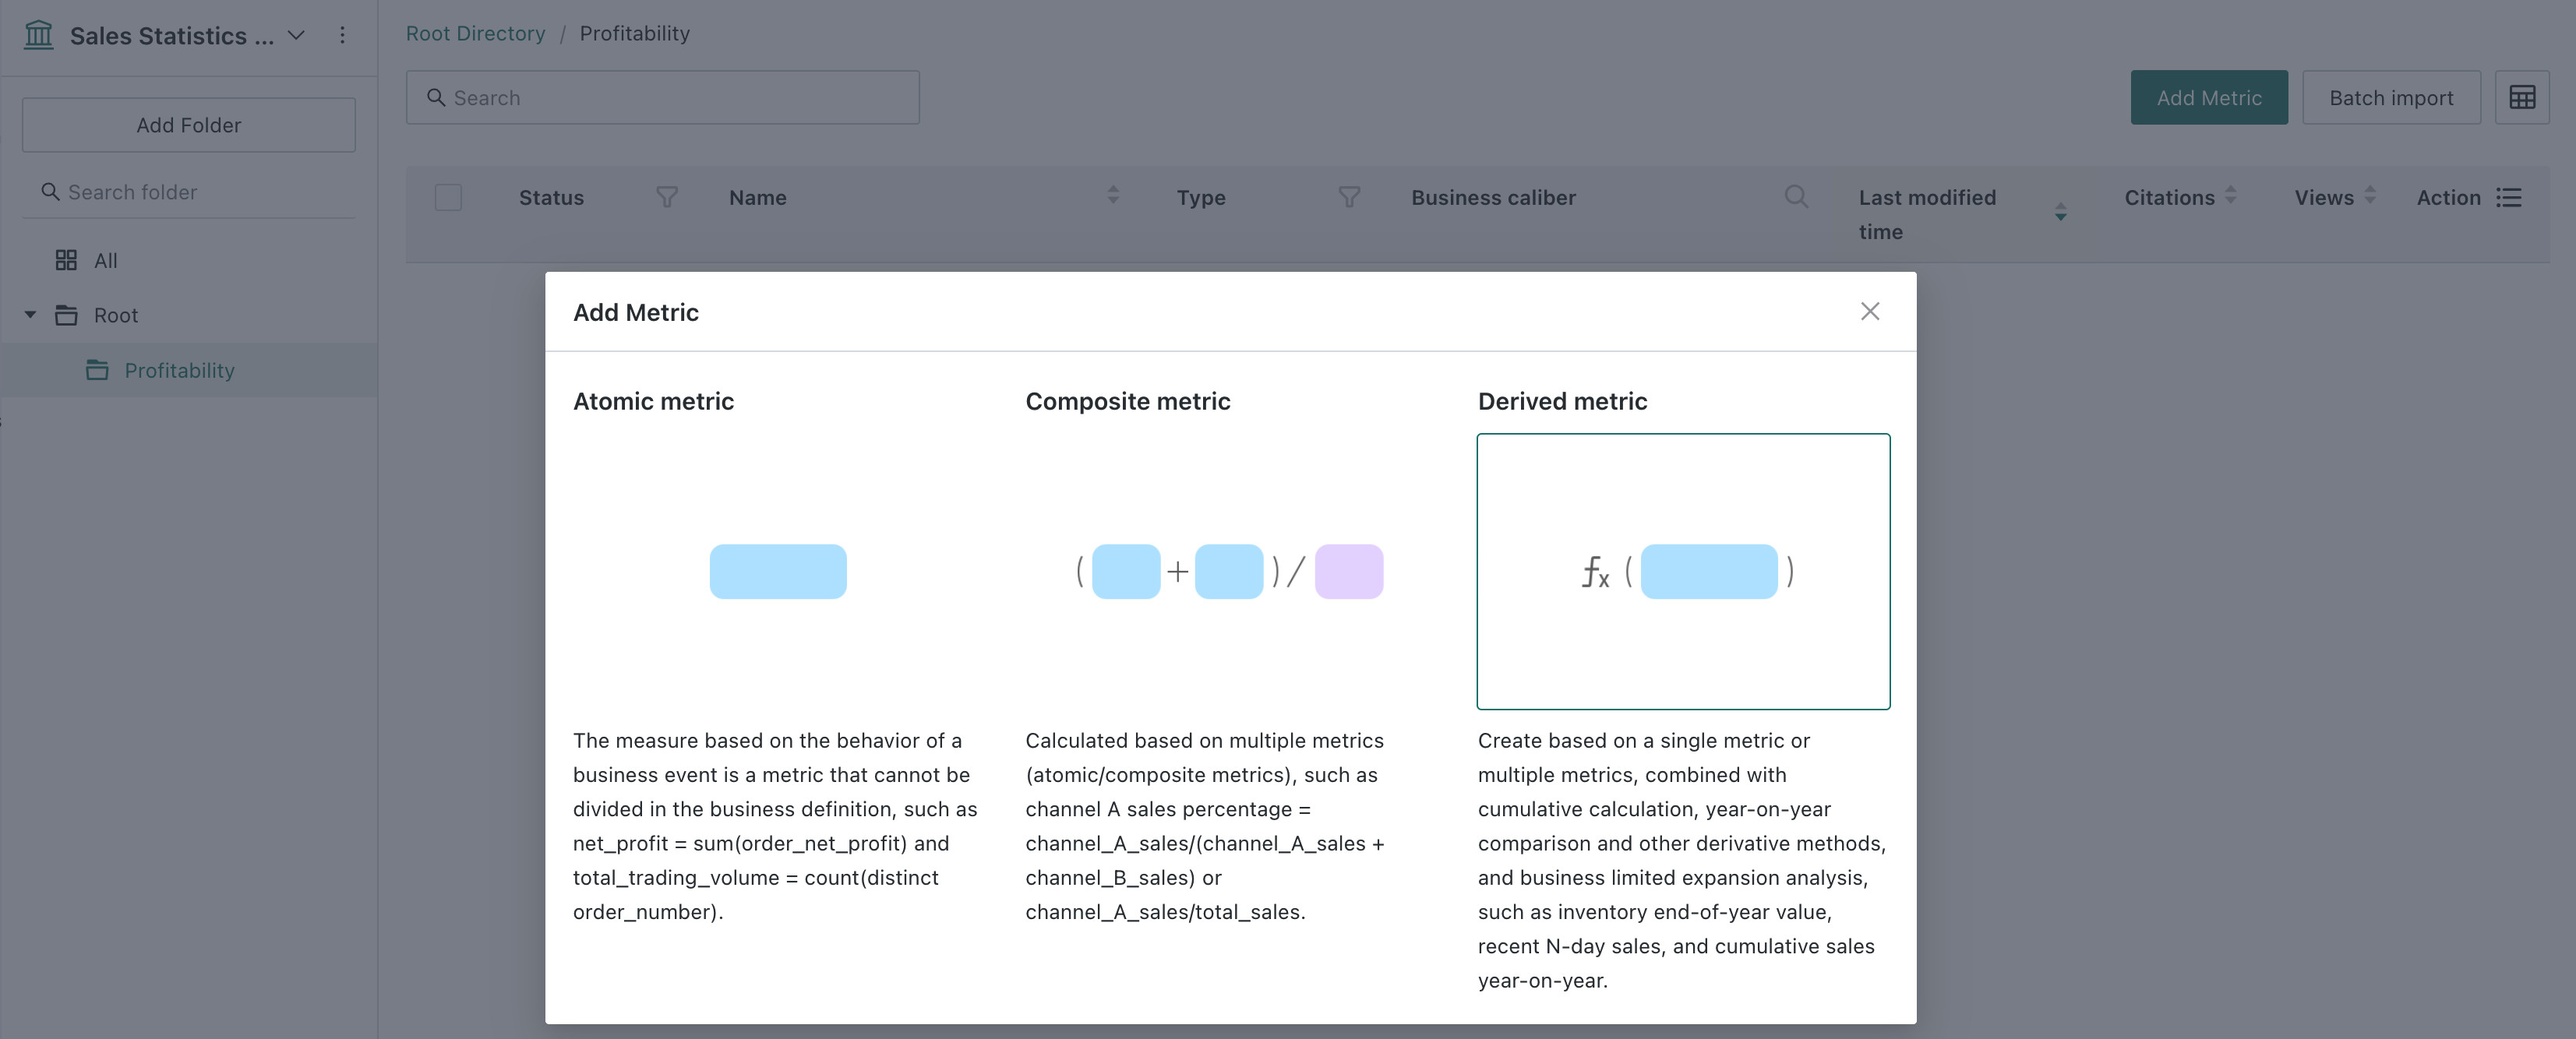
Create the third metric "Sales Gross Profit YoY". After filling in the information, click "Save". The configuration items are as follows:
- Derived From: Select metric Sales Gross Profit
- Applicable Dimensions: Inherited from source metrics, cannot be modified
- Time Dimension: Inherited from source metrics, cannot be modified
- Derived Type: YoY/MoM
- Time Granularity: Year
- Default Current Period Time Range: This year
- Comparison Type: YoY/MoM - Annual MoM
- Value Setting: Growth Rate; Calculation Method: (Current Period Data - Previous Period Data) / abs(Previous Period Data) * 100%
- Data Format: Percentage
- Business Caliber: Sales Gross Profit YoY ratio
- Save to: Profit Status folder
Step 4: Create Metric Analysis Card
Enter the "Data Analysis" module, create a new page and click "New Card" to create a metric analysis card.
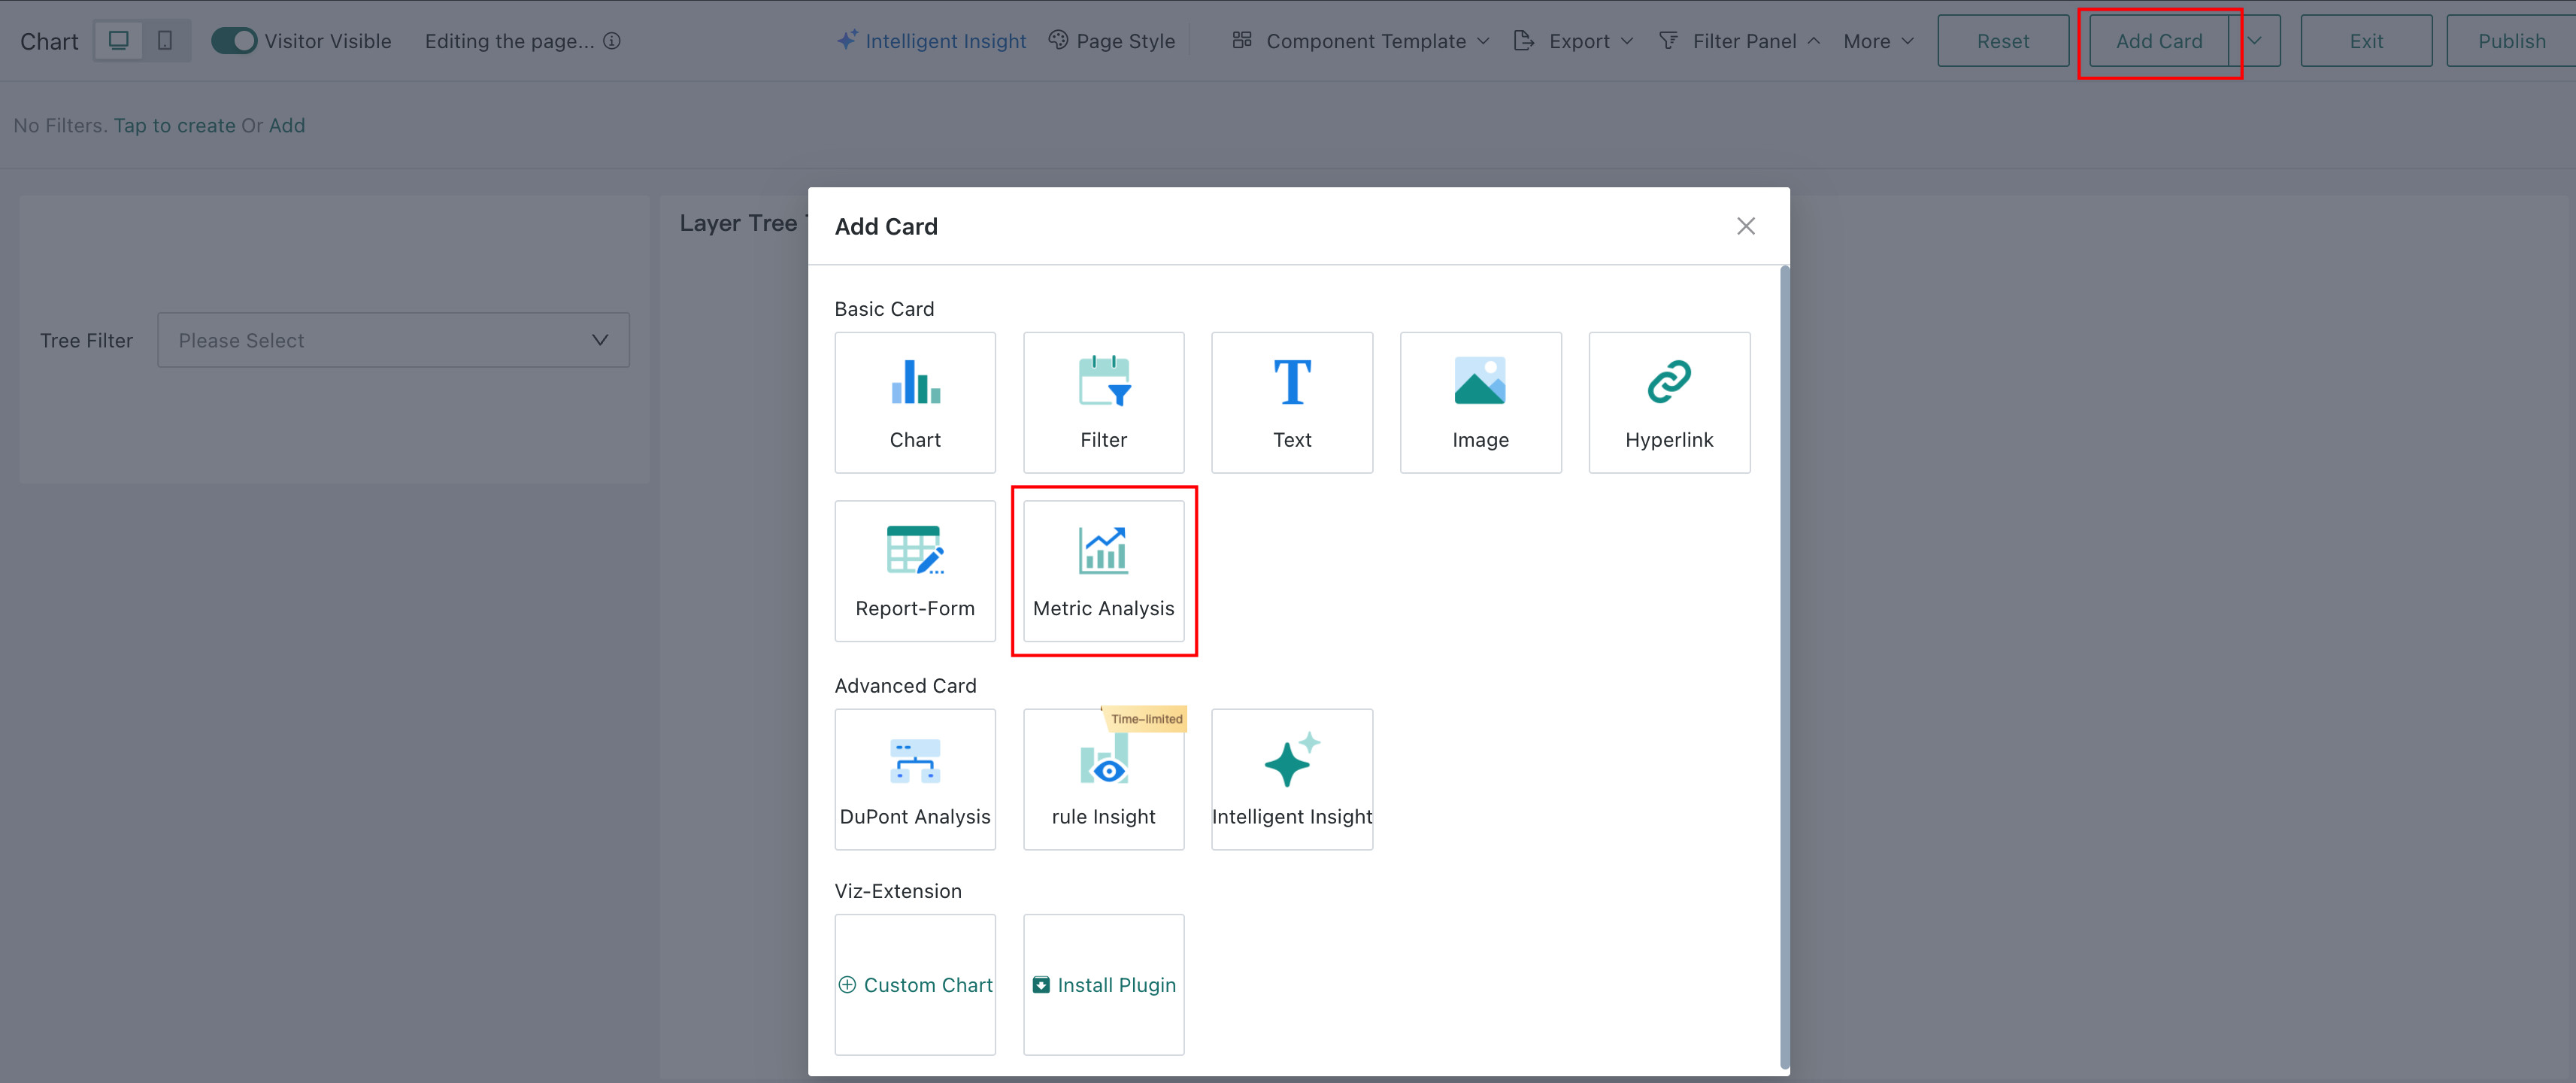
Create the first metric analysis card, using a table format to comprehensively display the data of Total Cost Price, Total Sales Amount, and Sales Gross Profit for each province.
- Visualization Method: Select Table
- Metric: Select Total Cost Price, Total Sales Amount, and Sales Gross Profit
- Dimension Selection: Province
Create the second metric analysis card, using a single line chart to show the monthly profit trend in Zhejiang Province.
- Visualization Method: Single Line Chart
- Metric: Select Sales Gross Profit
- Dimension Selection: Select Date (Month)
- Filter: Select Province and select Zhejiang Province
Drag and layout the created cards in the dashboard. The cards can also be applied to mobile applications and large screens later. The usage method is the same as other BI visualization analysis cards, which will not be expanded here.