Intelligent Attribution
1. Overview
1.1. Function Description
Intelligent Attribution is a smart analysis product that provides deep insights around enterprise key business indicators. Based on attribution strategy configuration, it automatically performs multi-dimensional and multi-indicator breakdown analysis on indicator fluctuations or comparison gaps, mines potential influencing factors, locates abnormal units and main factor contributions, helping enterprises quickly understand business and make agile decisions.
1.2. Application Scenarios
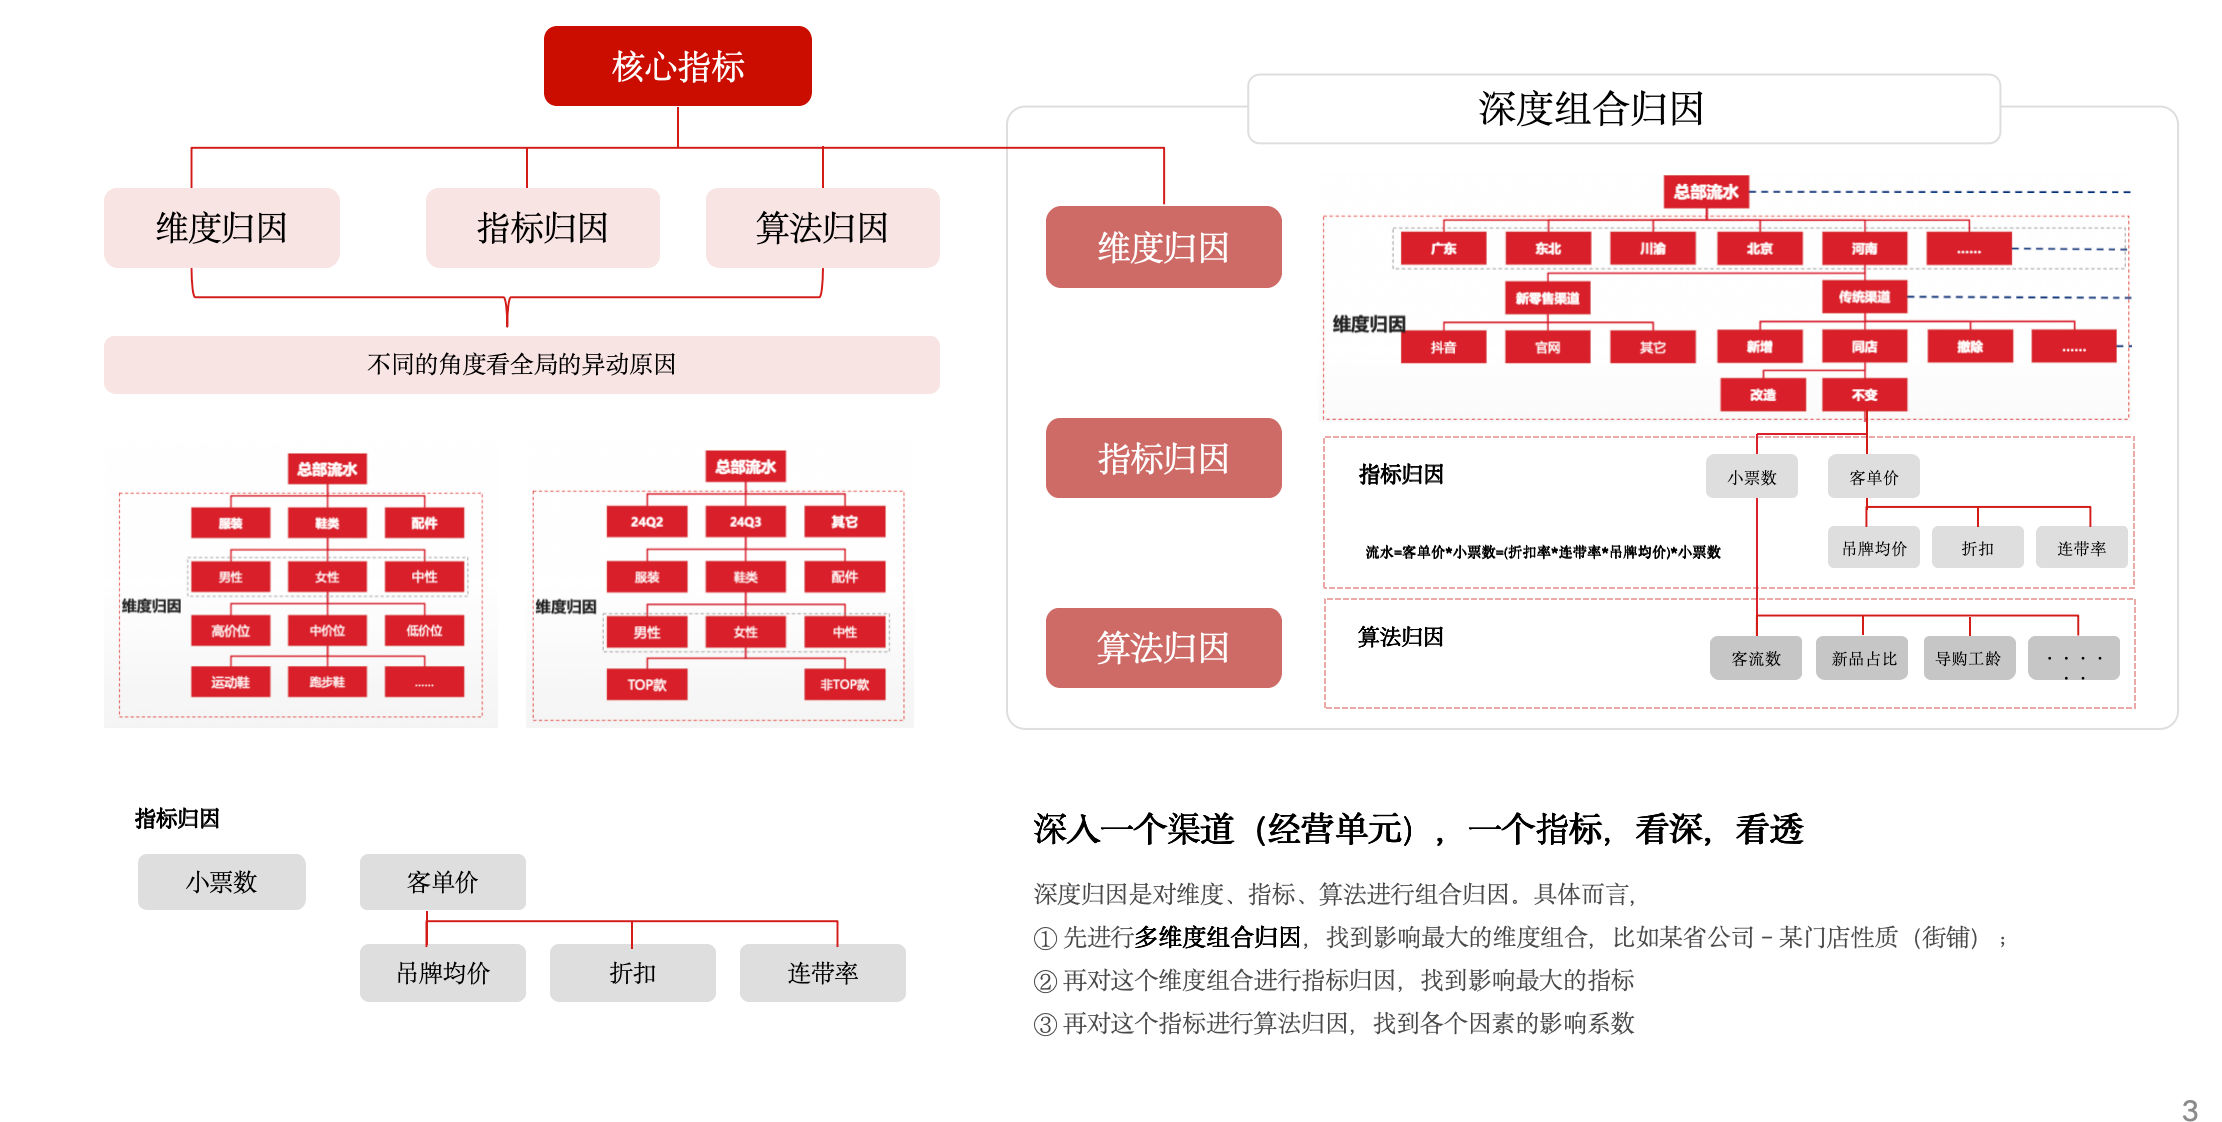
1. Monitor and analyze North Star indicators (total indicators)
For example, when company revenue this total indicator drops by 5%, management needs to know what happened and why it happened. Using intelligent attribution, data attribution from multiple perspectives such as channels, products, and users can help management find structural changes and provide operational direction; analysis from business perspectives such as attachment rate, unit price, and sales volume can help management find business operation changes and provide operational direction.
2. Analyze key quality and efficiency indicators (ratio indicators)
For example, when company discount rate this ratio indicator drops by 10%, management needs to know what the reason is. Using intelligent attribution, data attribution from multiple perspectives such as channels, products, and users can objectively evaluate the contribution of different channels to changes and provide comparable indicators.
2. Operation Steps
2.1. Create Intelligent Attribution
After preparing the attribution dataset, create an intelligent attribution page.
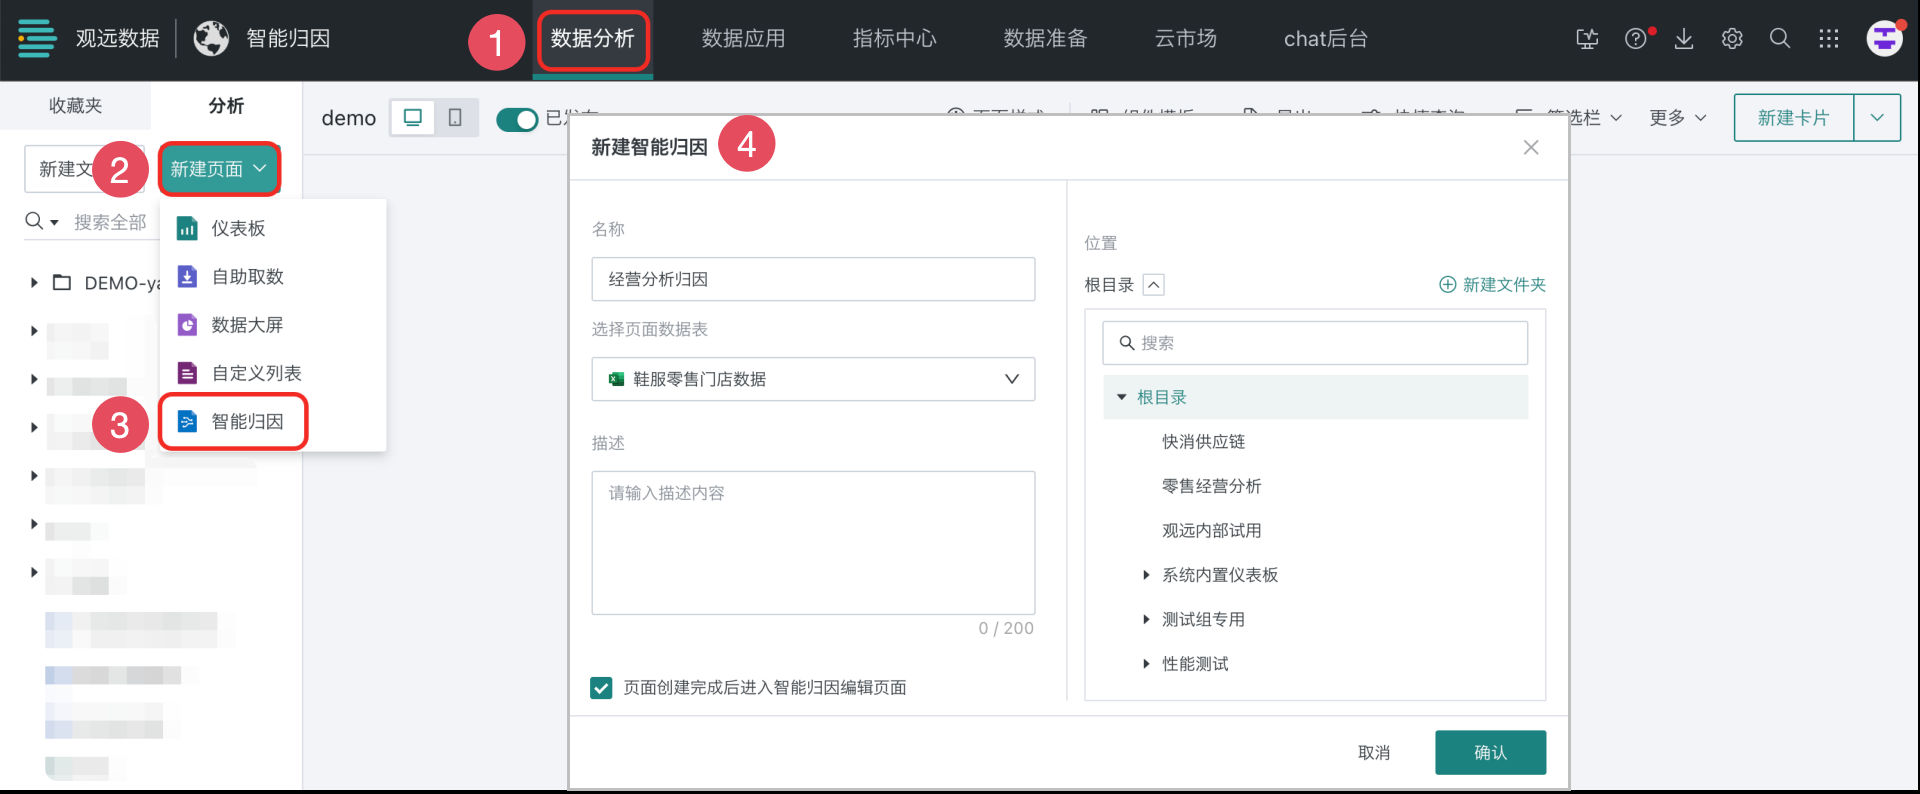
- Enter the "Data Analysis" module, select "New Page > Intelligent Attribution".
- In the "New Intelligent Attribution" dialog, configure the attribution page name, description, location, and select the dataset that needs attribution. After completion, confirm and enter the intelligent attribution configuration interface.
2.2. Configure Intelligent Attribution
After creating the intelligent attribution page, configure the attribution indicators, attribution methods, etc.
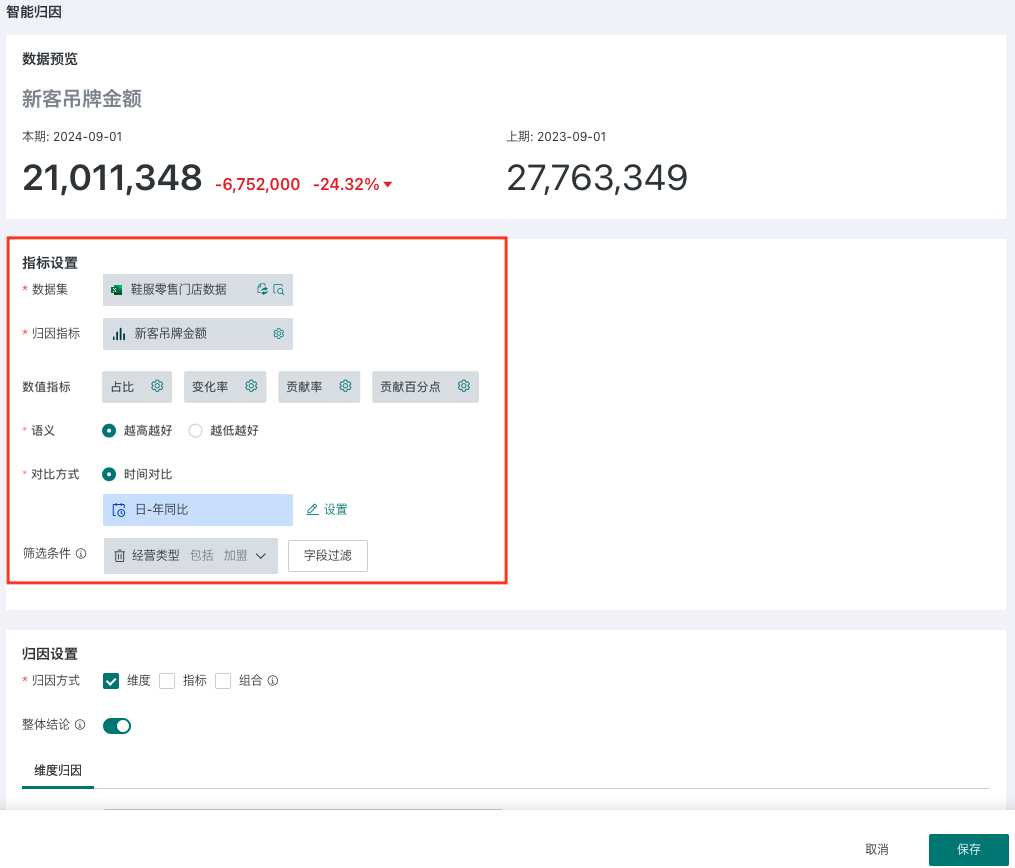
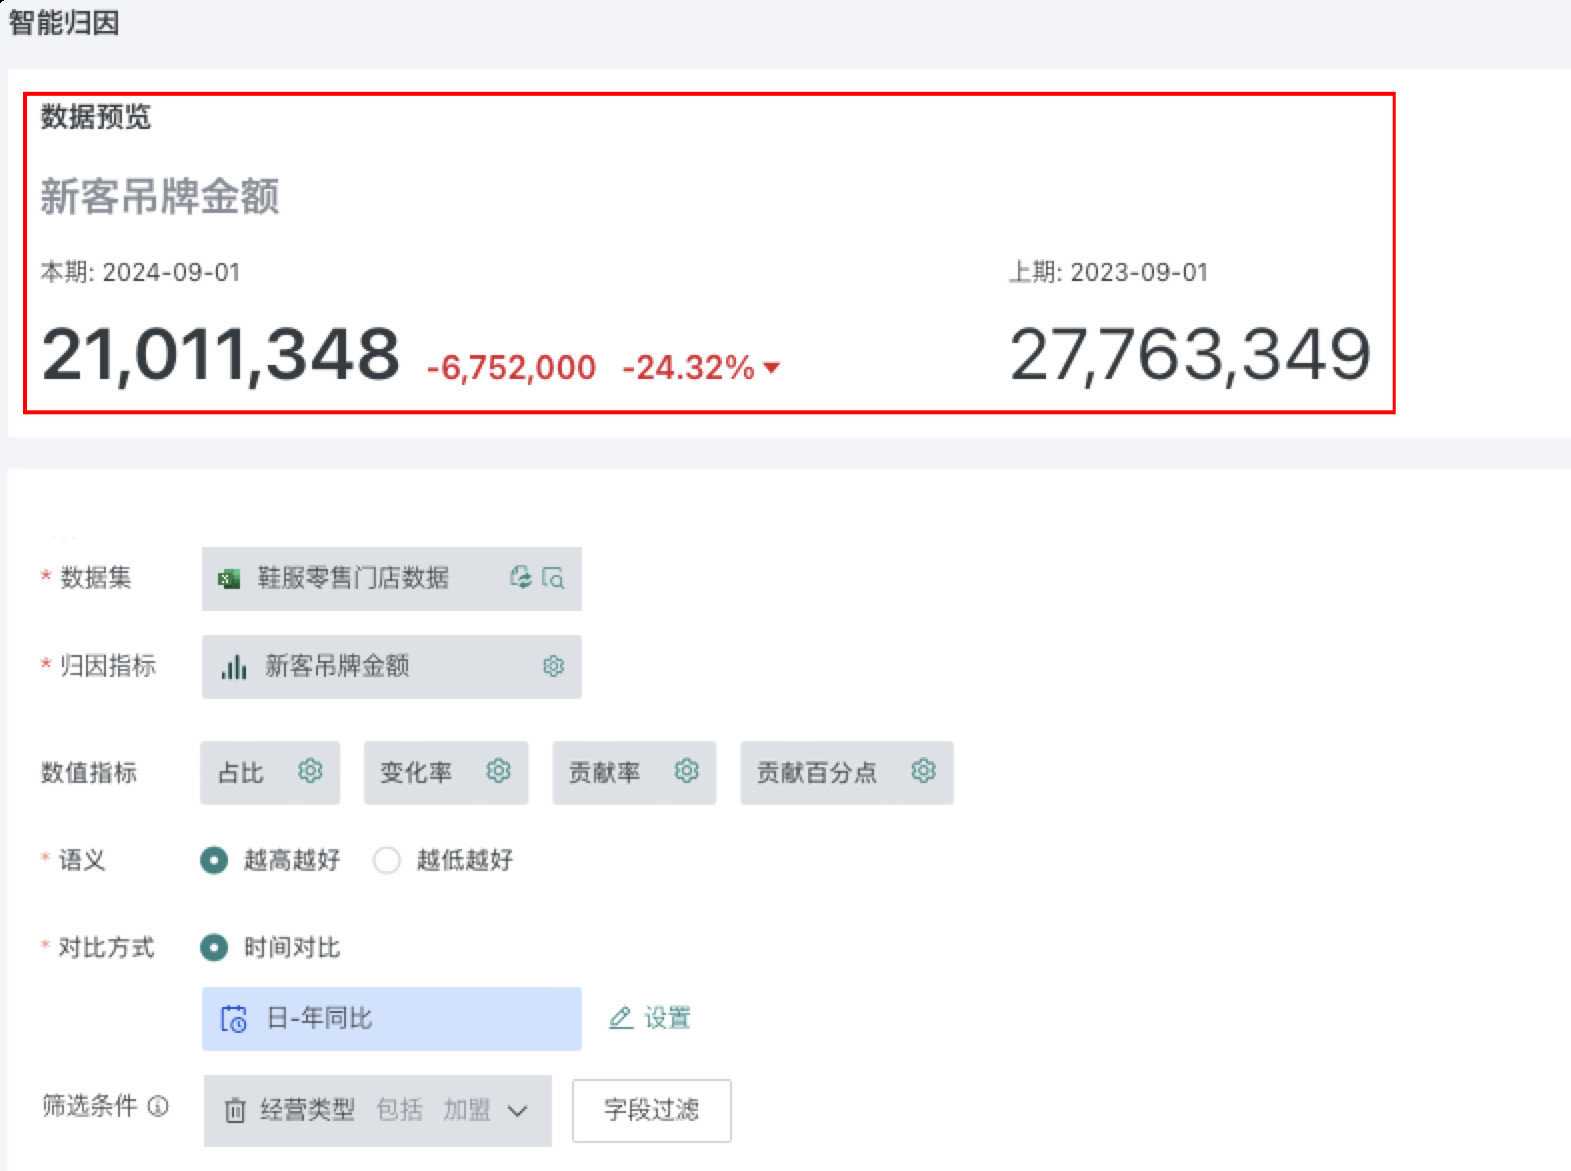
- Configure related configuration items in the "Indicator Settings" area.
| Configuration Item | Description | |
|---|---|---|
| Dataset | Datasets that users have permissions for, all datasets supported by Guandata BI. | |
| Attribution Indicator | The key indicator that needs to be analyzed and monitored in this attribution. | |
| Numeric Indicators | Supports configuration of data format-decimal places for percentage indicators such as proportion, change rate, contribution rate, and contribution percentage, and supports preview, default is two decimal places. | |
| Semantics | Configure the semantics of the attribution indicator (for example, if the attribution indicator is retail amount, then the semantics is the higher the better). After semantic configuration, it will affect the style color of change values and change rates in the data preview area. | |
| Comparison Method | Choose the comparison method for the target indicator, currently supports "Time Comparison".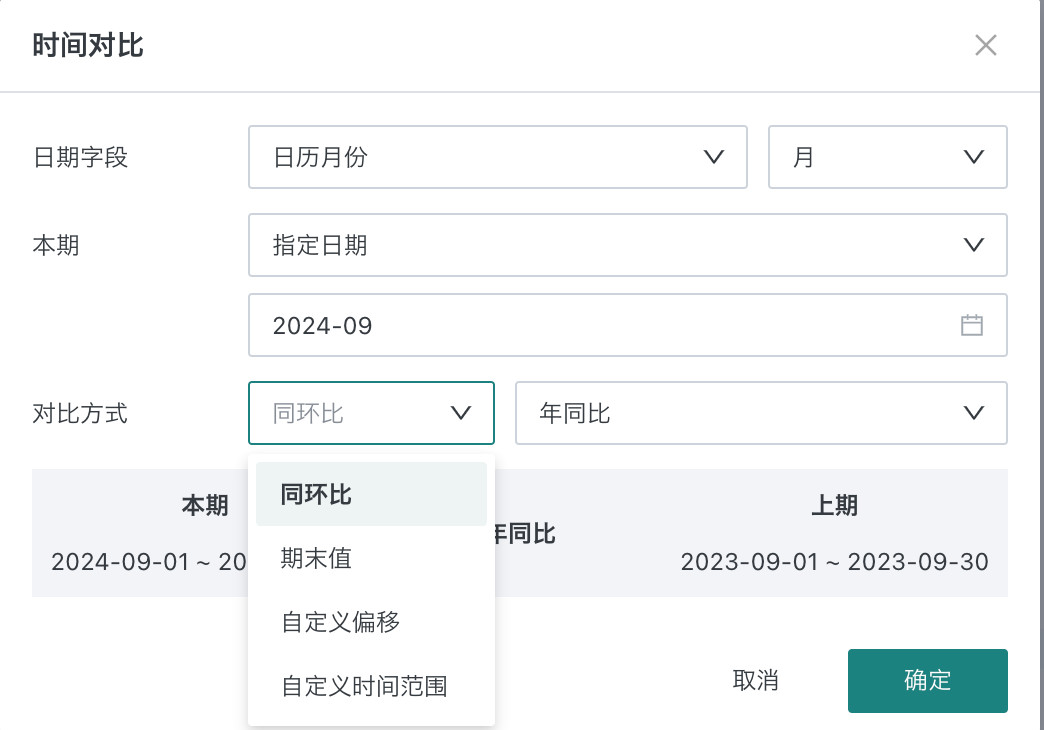 Click "Settings" to enter the dialog to configure the specific time for comparison. After configuration, the current period and previous period time for attribution comparison analysis are automatically displayed for confirmation. | |
| Filter Conditions | The sampling range selected for attribution data, all subsequent attributions are based on the current filtered dataset. |
- After completing the configuration in the "Indicator Settings" area, view the comparison changes of the attribution indicator in the "Data Preview" area. The data preview area displays the current value, previous period value, and year-over-year comparison of the attribution indicator.
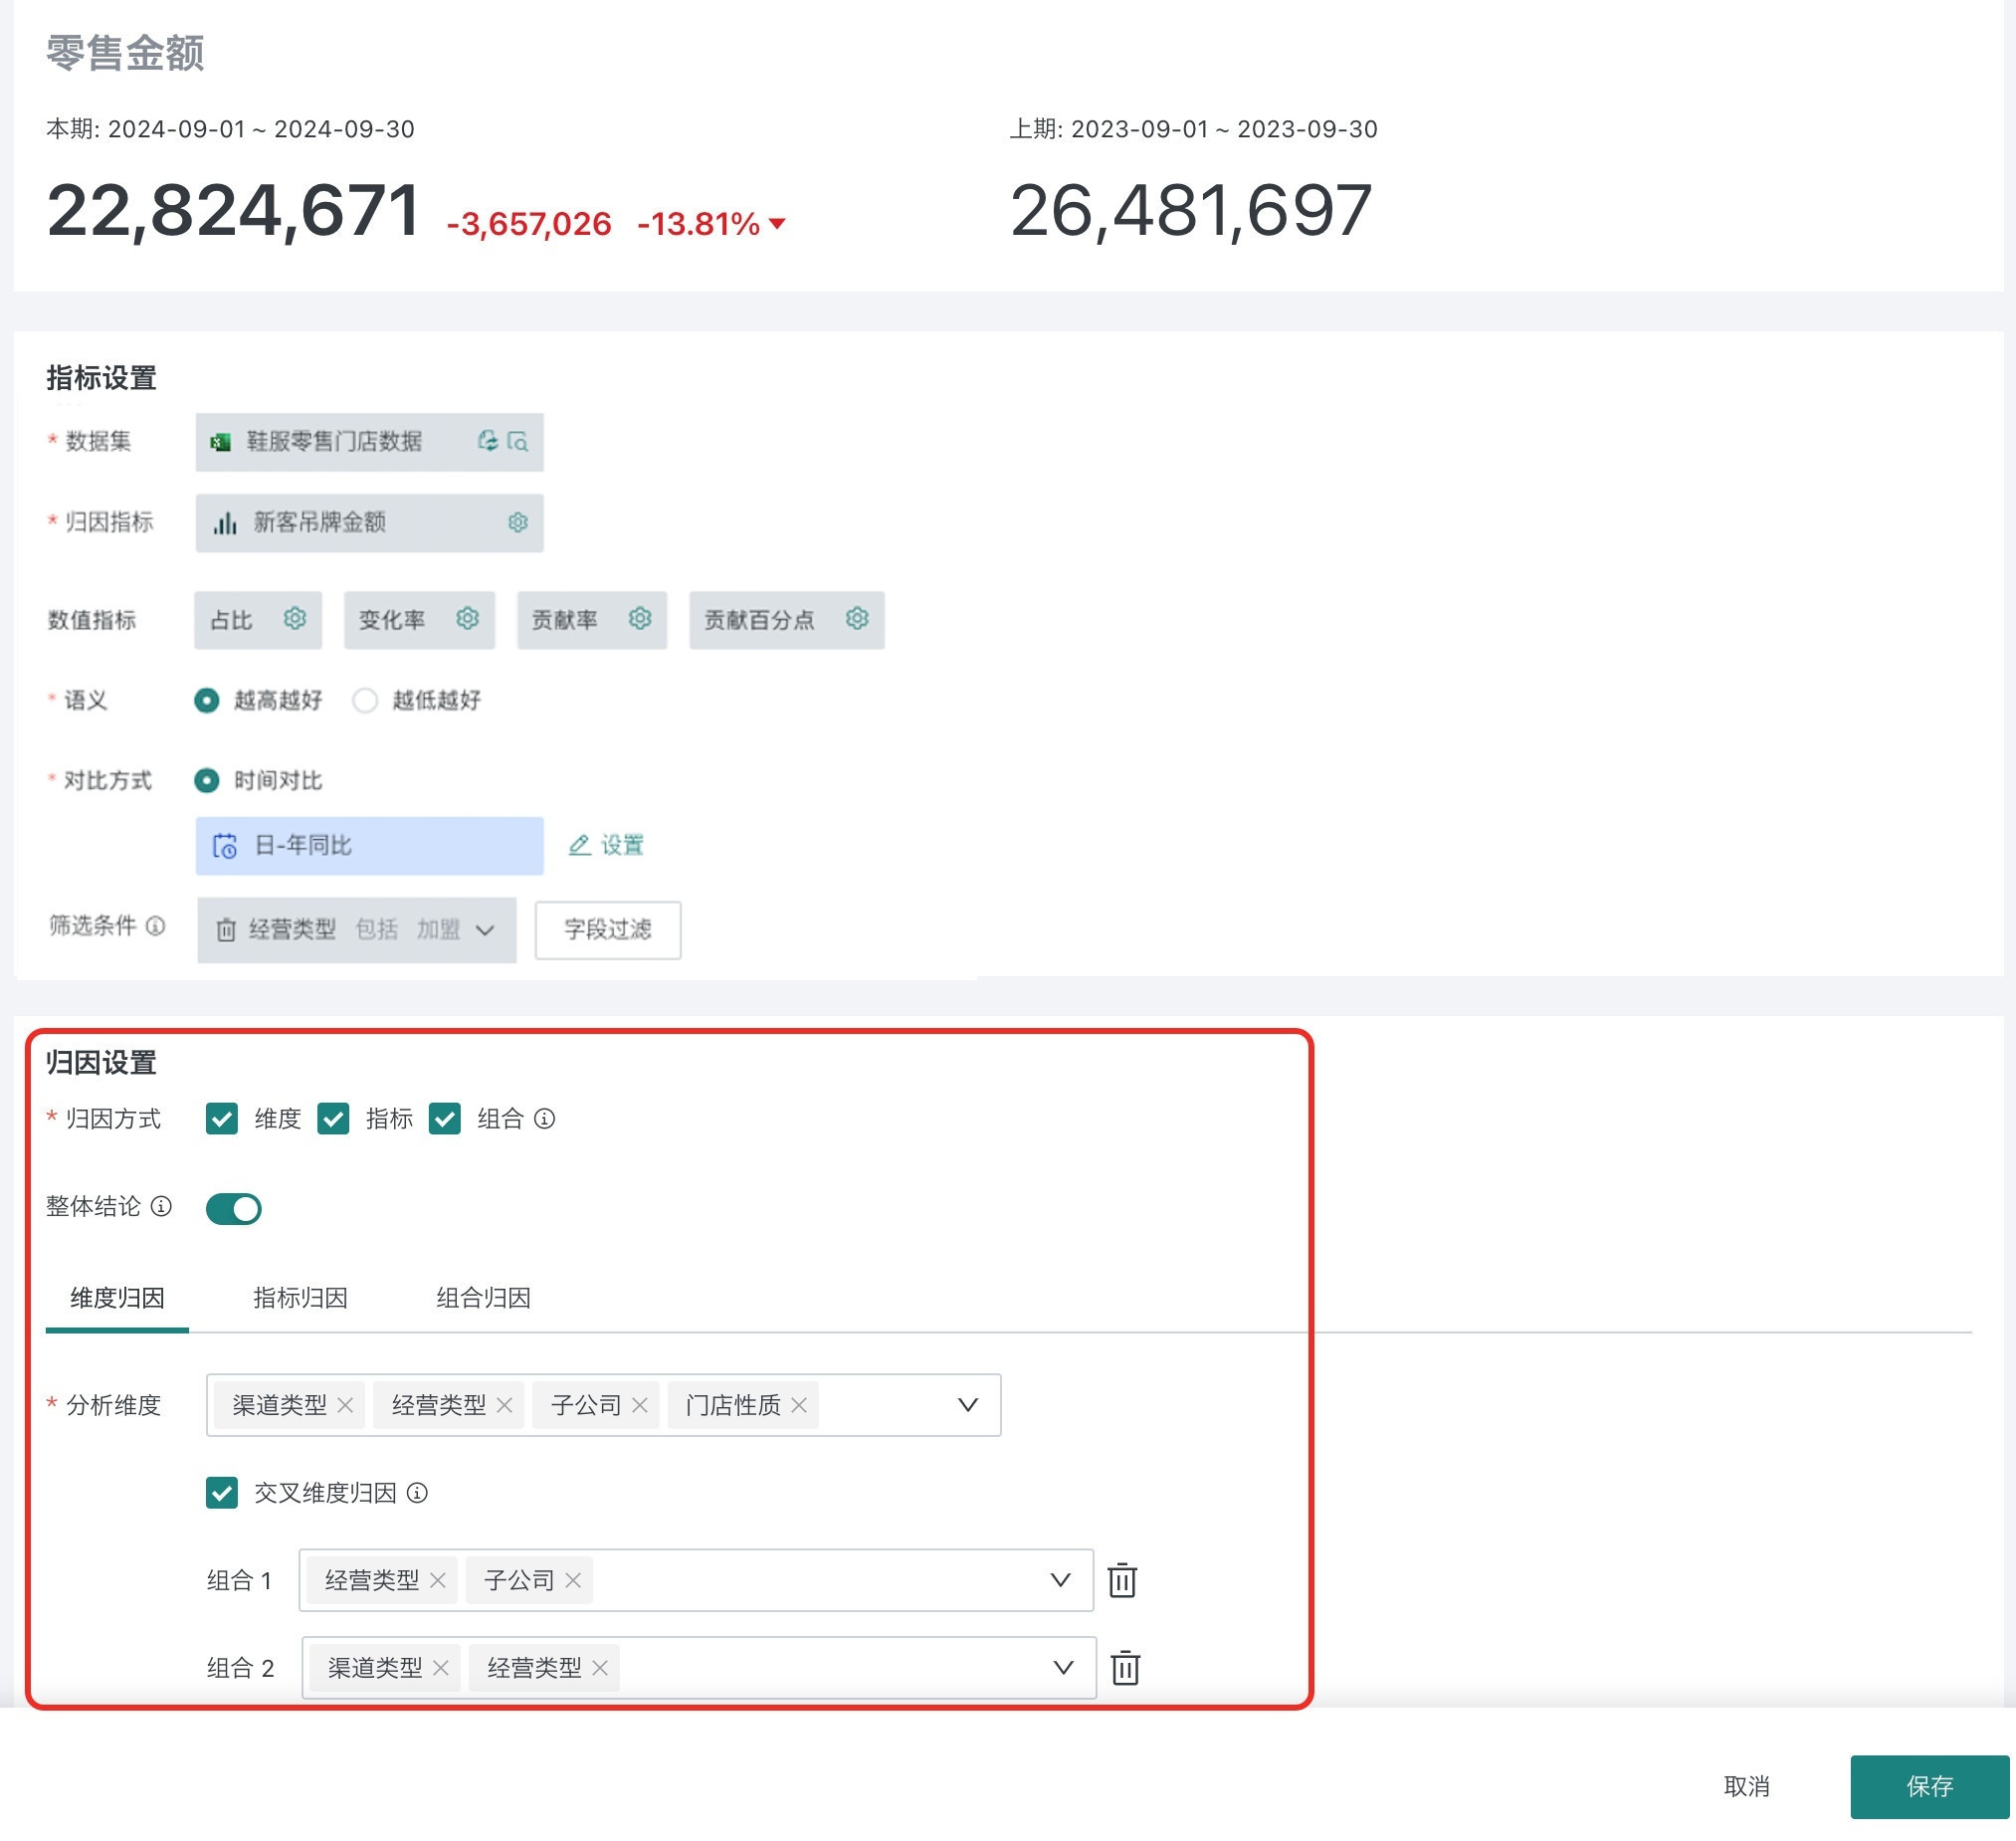
- In the "Attribution Settings" area, configure attribution methods, dimensions and indicators that need attribution, etc.
| Configuration Item | Description |
|---|---|
| Attribution Method | Choose attribution method: |
| Overall Conclusion | Whether to display overall conclusion in the result interface. |
| Dimension Attribution | |
| Indicator Attribution | After configuration, the attribution result page will display the impact of each indicator on the attribution indicator according to the configured indicator relationships. |
| Combination Attribution | Check dimension drilling, attribution will be performed according to the set dimension levels, and attribution will continue for dimension values that meet the contribution threshold, and indicator attribution will be performed for the last-level dimension values. |
- After configuration is complete, click "Save" to enter the attribution result page to view conclusions.
2.3. View Attribution Results
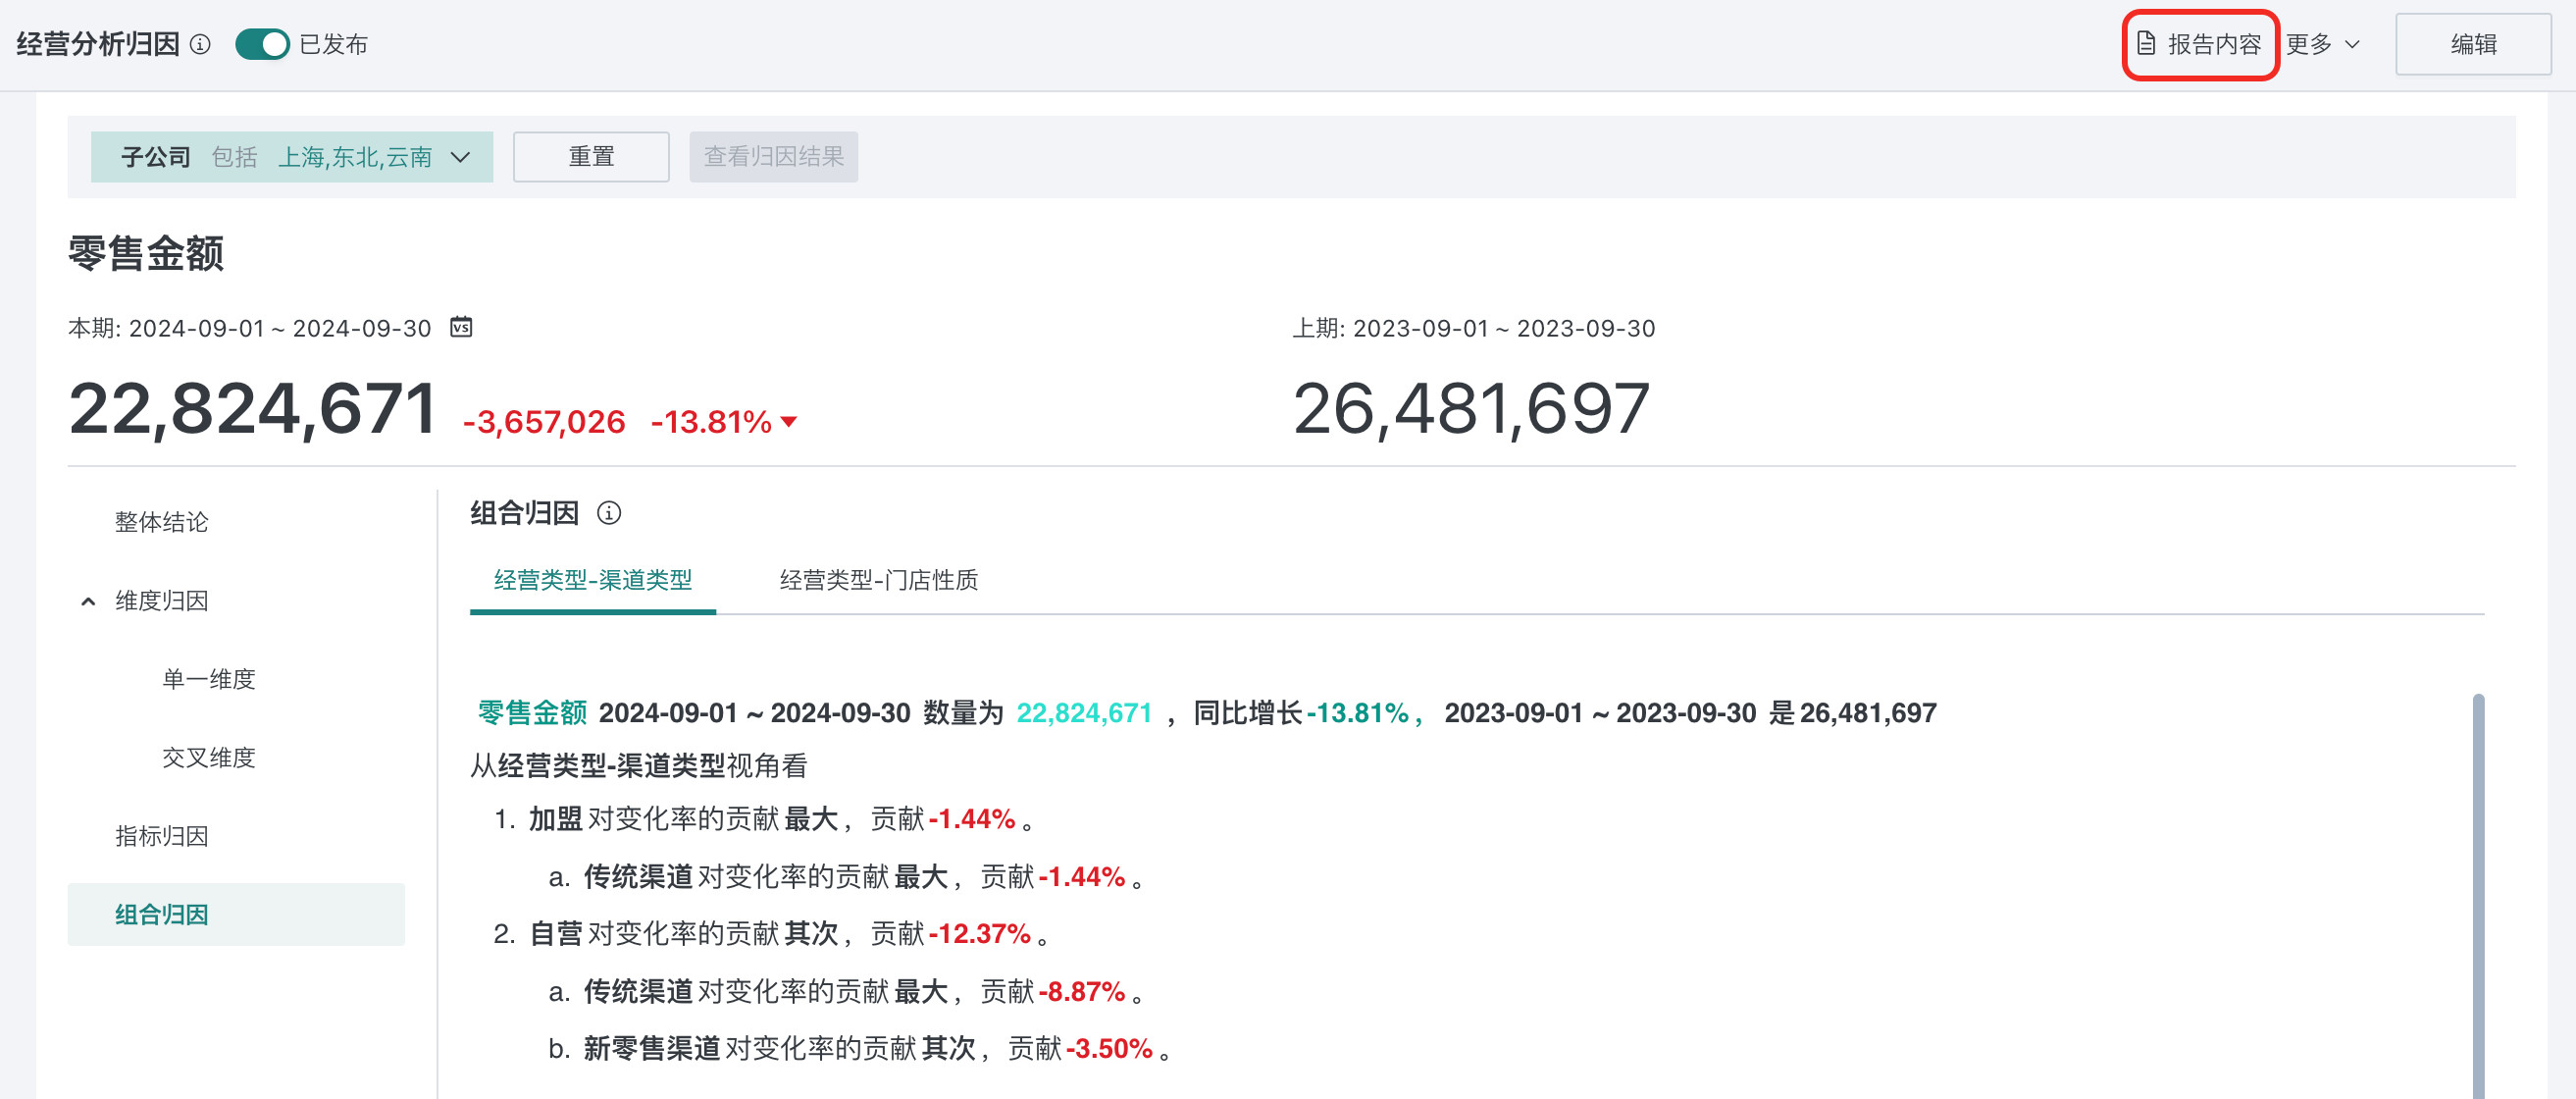
2.3.1. View Overall Conclusion
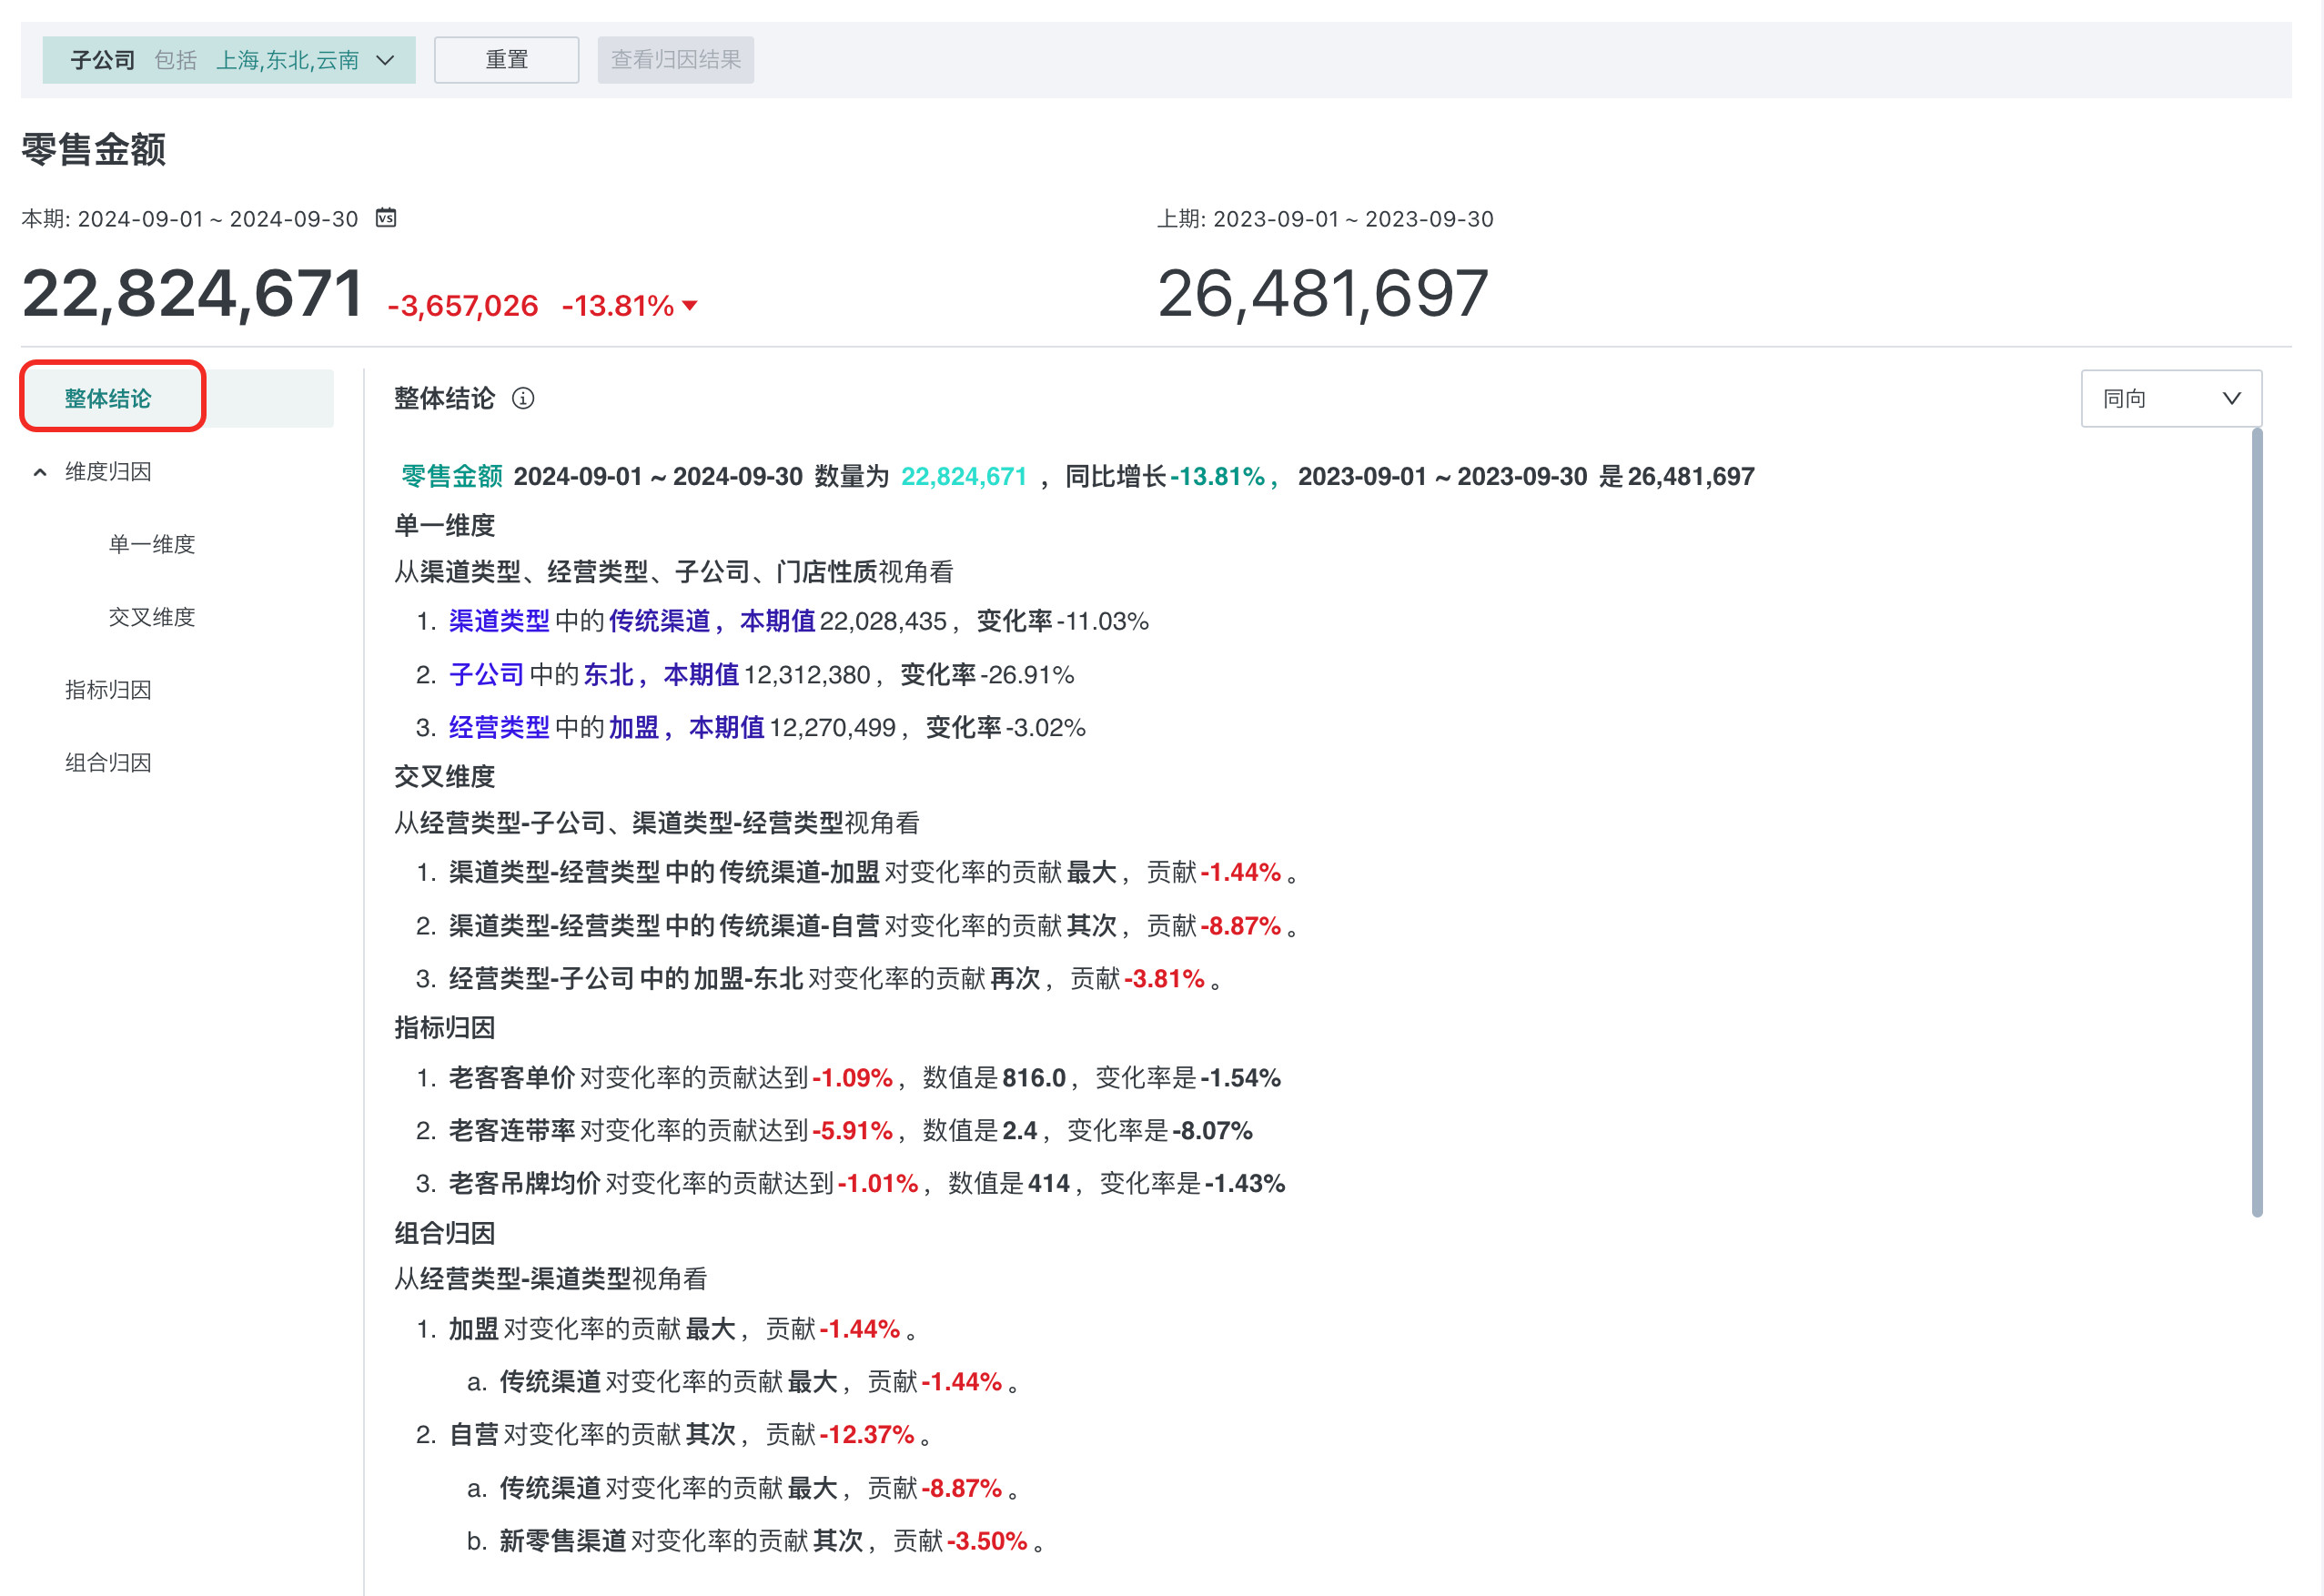
Enter the attribution result page and first view the overall conclusion. The overall conclusion supports including opening words, dimension attribution results, indicator attribution results, and combination attribution results, which can be customized. For details, see 2.4. Configure Report Content.
You can choose to display same-direction, reverse-direction, or all attribution dimensions. For the meaning of same-direction and reverse-direction, see Appendix: Concept Explanation.
2.3.2. Dimension Attribution Results
Dimension attribution calculates data contribution from the structural changes of business operations, helping management discover structural changes behind indicator changes. Management often corresponds to specific responsible persons. Among them, single dimension attribution is a relatively coarse-grained analysis perspective, and cross-dimension corresponds to business management perspective providing macro analysis perspective (such as: each operation specifically corresponds to regional categories).
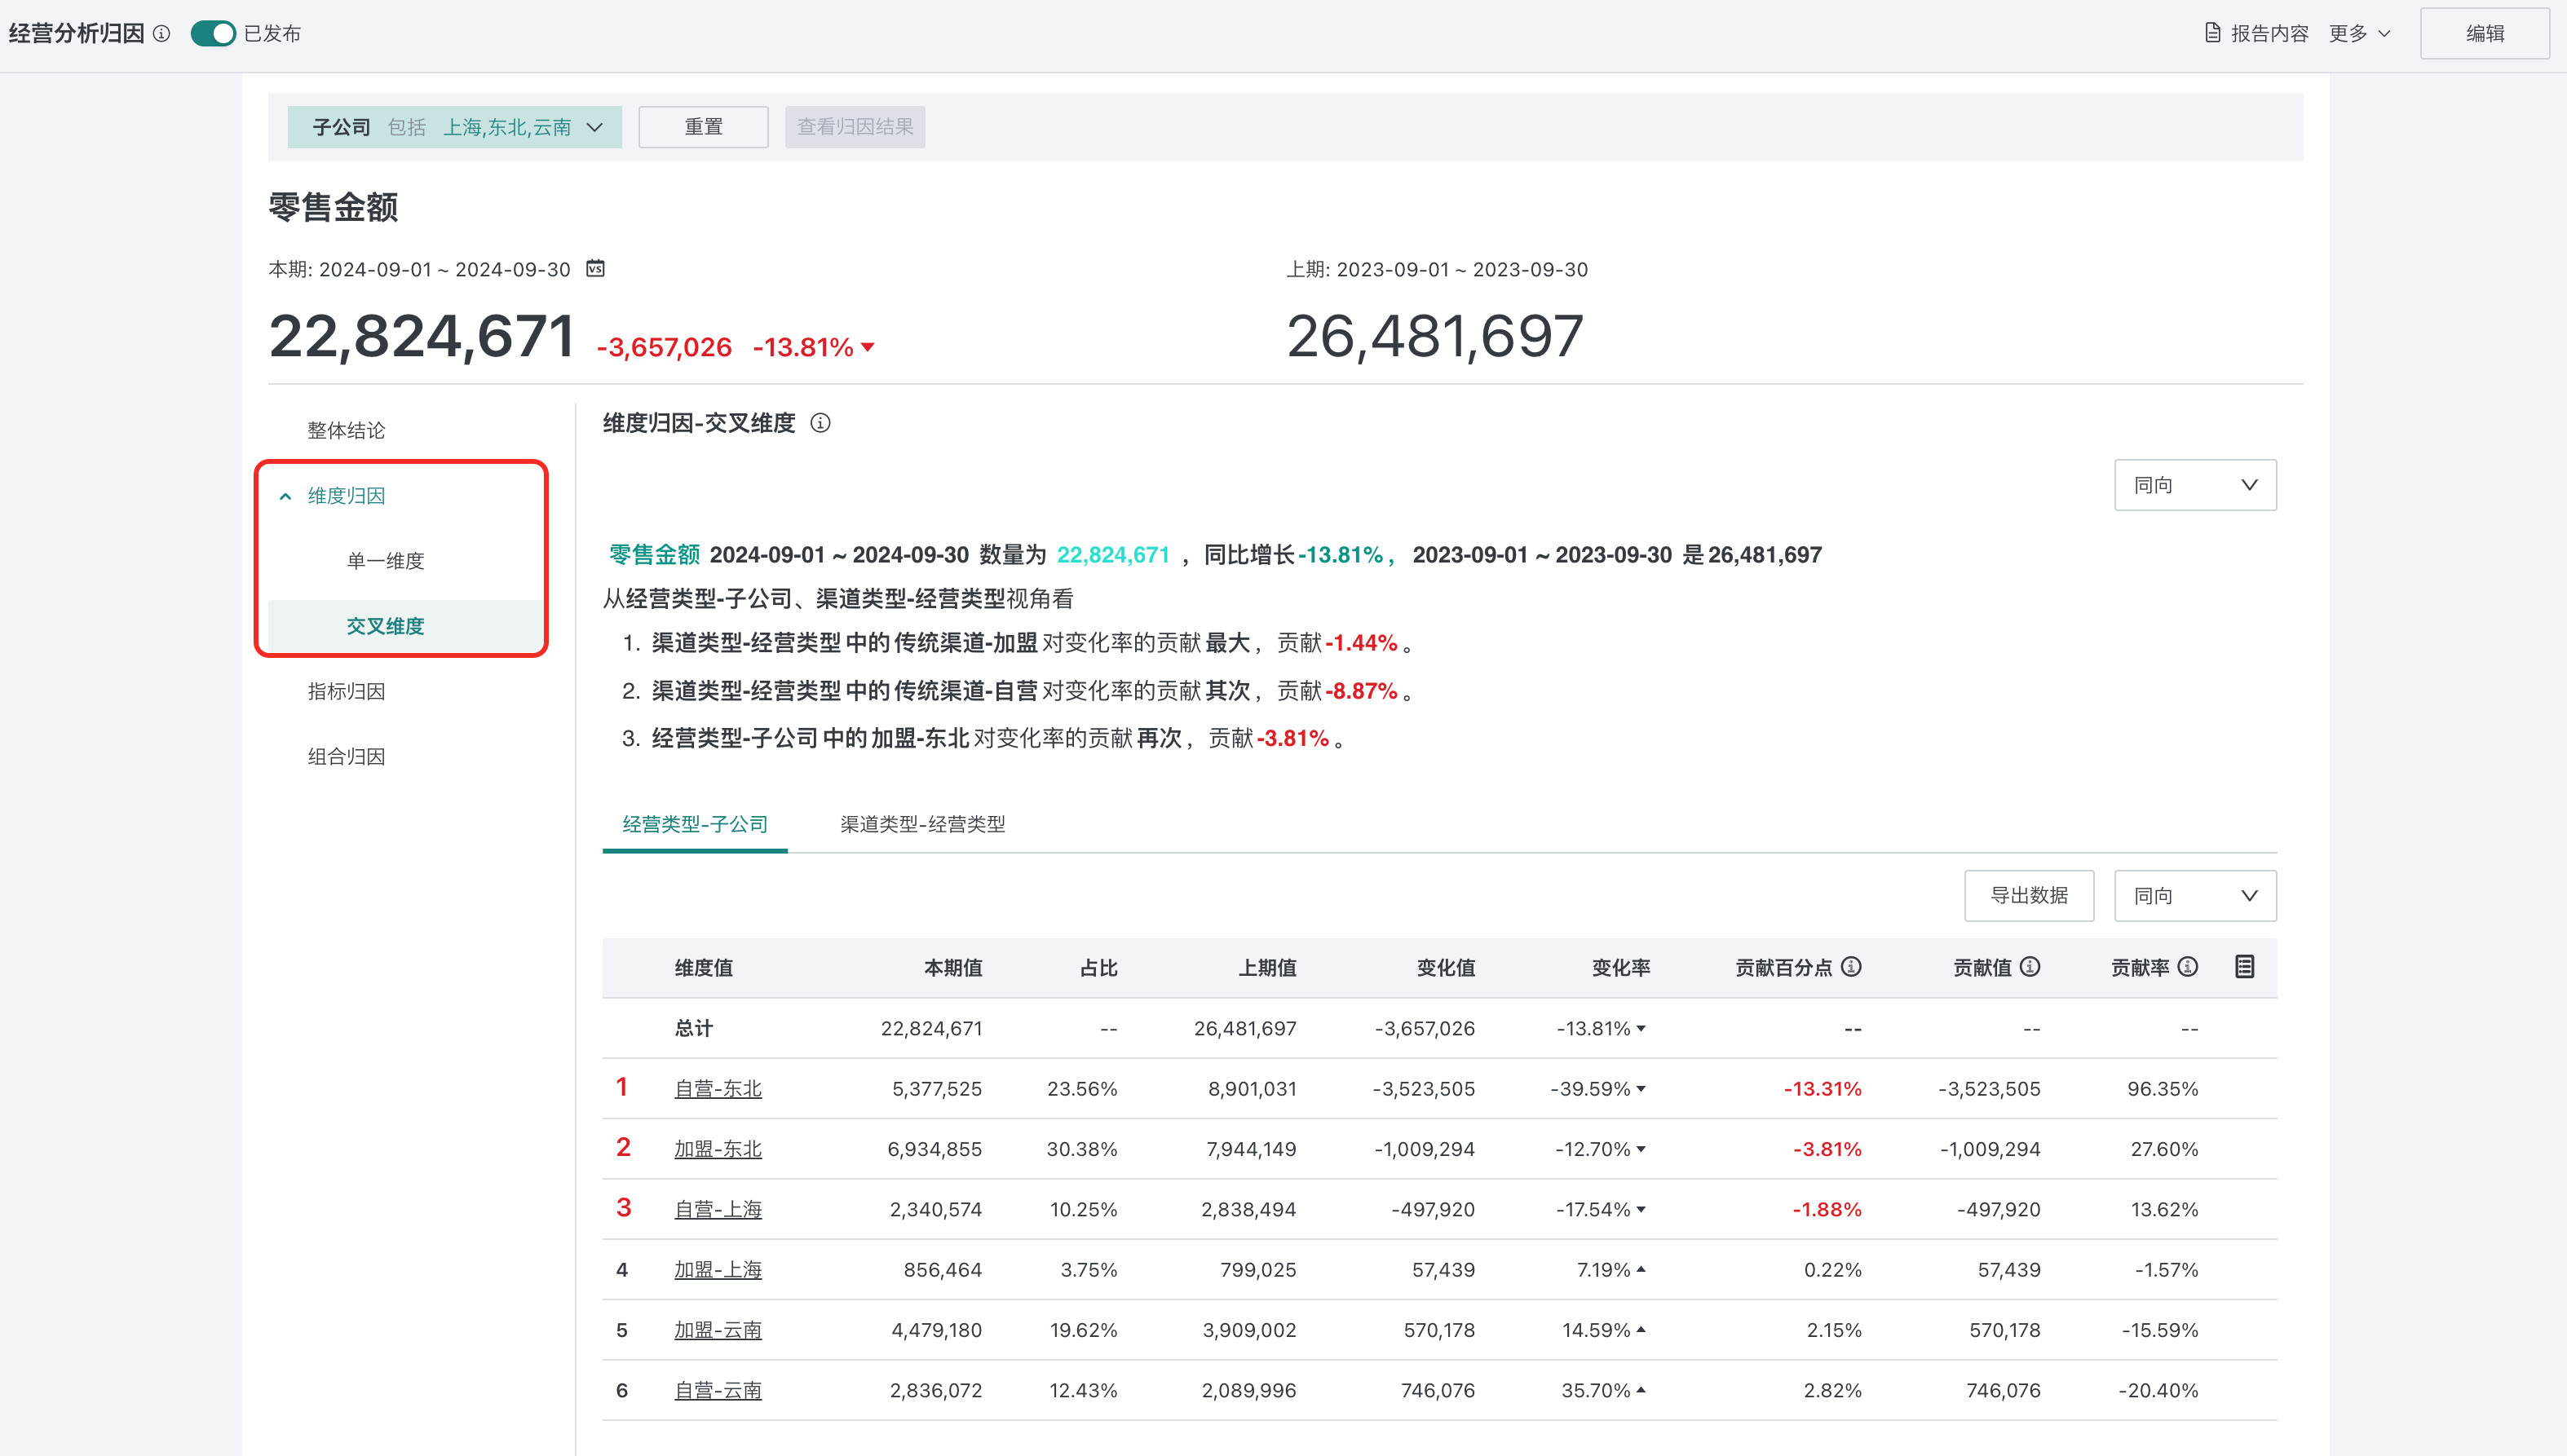
2.3.2.1. Attribution Conclusion
The dimension attribution result displays the impact of the configured dimensions on the target attribution indicator. The text part of the page includes opening words and dimension attribution conclusions.
The conclusion template for dimension attribution can be customized by clicking "Report Content". The conclusion supports configured content (for details, see 2.4. Configure Report Content):
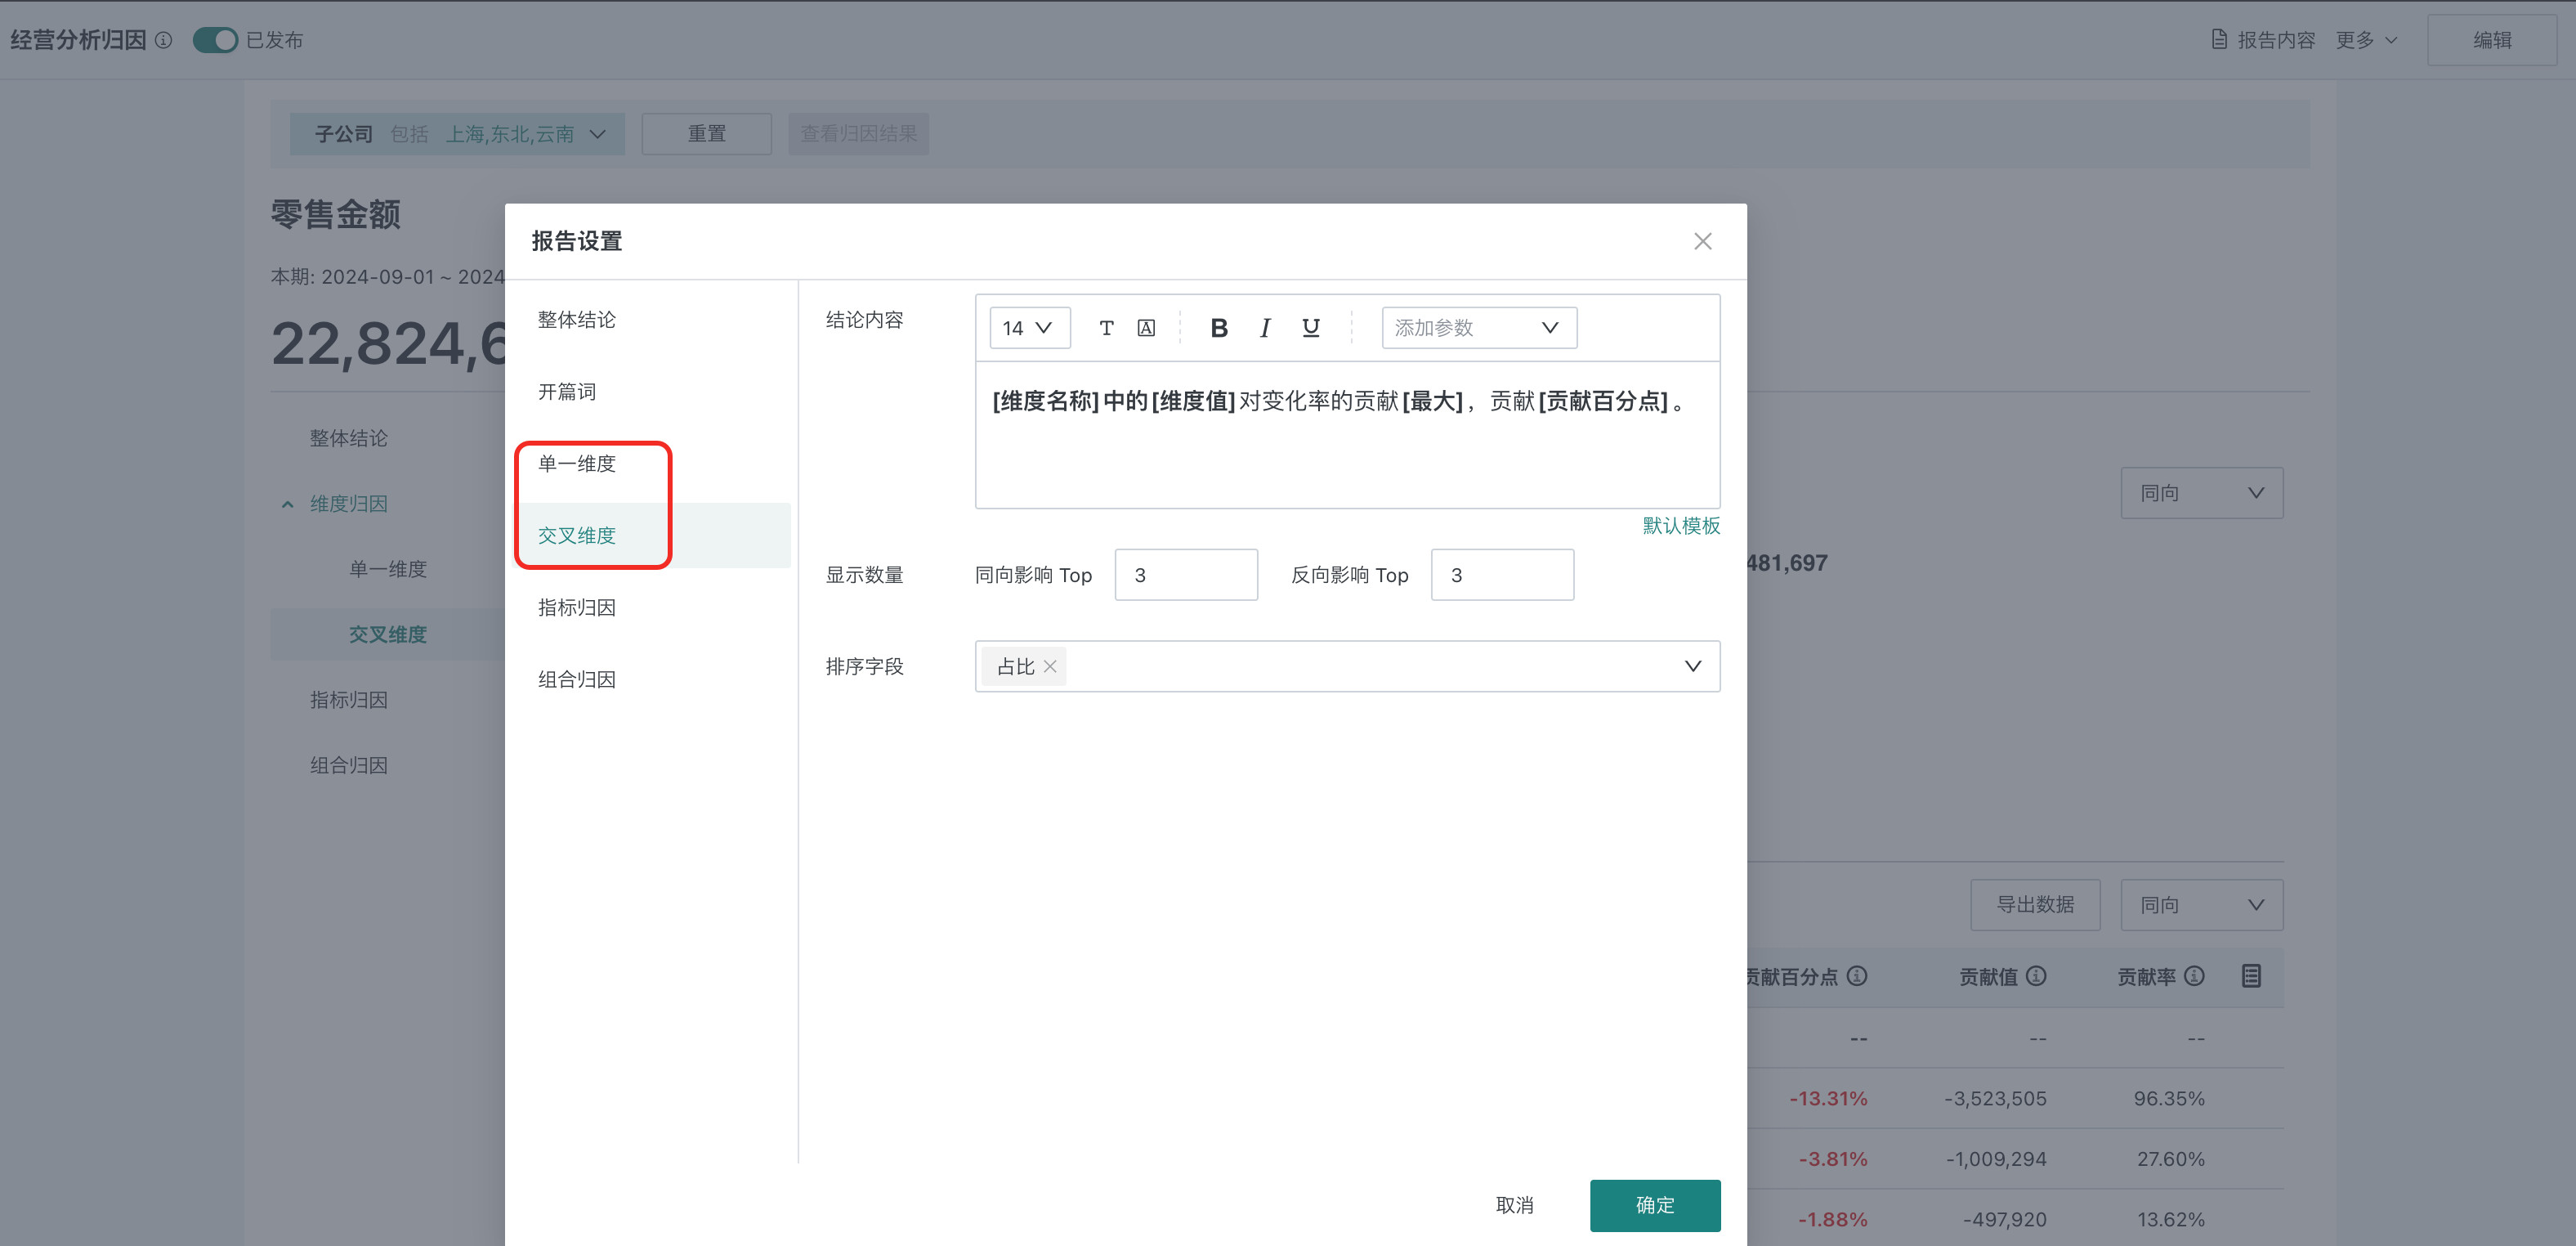
- Text style: Size, font, color and other common configurations.
- Text parameters: Including dimension name, dimension value, maximum, current period value, previous period value, change value, change rate, proportion, contribution value, contribution percentage points, contribution rate. Users can reference detail parameters in the text, and related parameters will be filled with actual data.
- Display quantity: The number of attribution items displayed in the conclusion, configured separately for same-direction and reverse-direction. It will be sorted based on all dimension value combinations in different dimensions.
- Sort field: Supports descending order based on detail indicators.
2.3.2.2. View Attribution Details
On the dimension attribution result page, you can perform the following operations to view dimension attribution detail data.
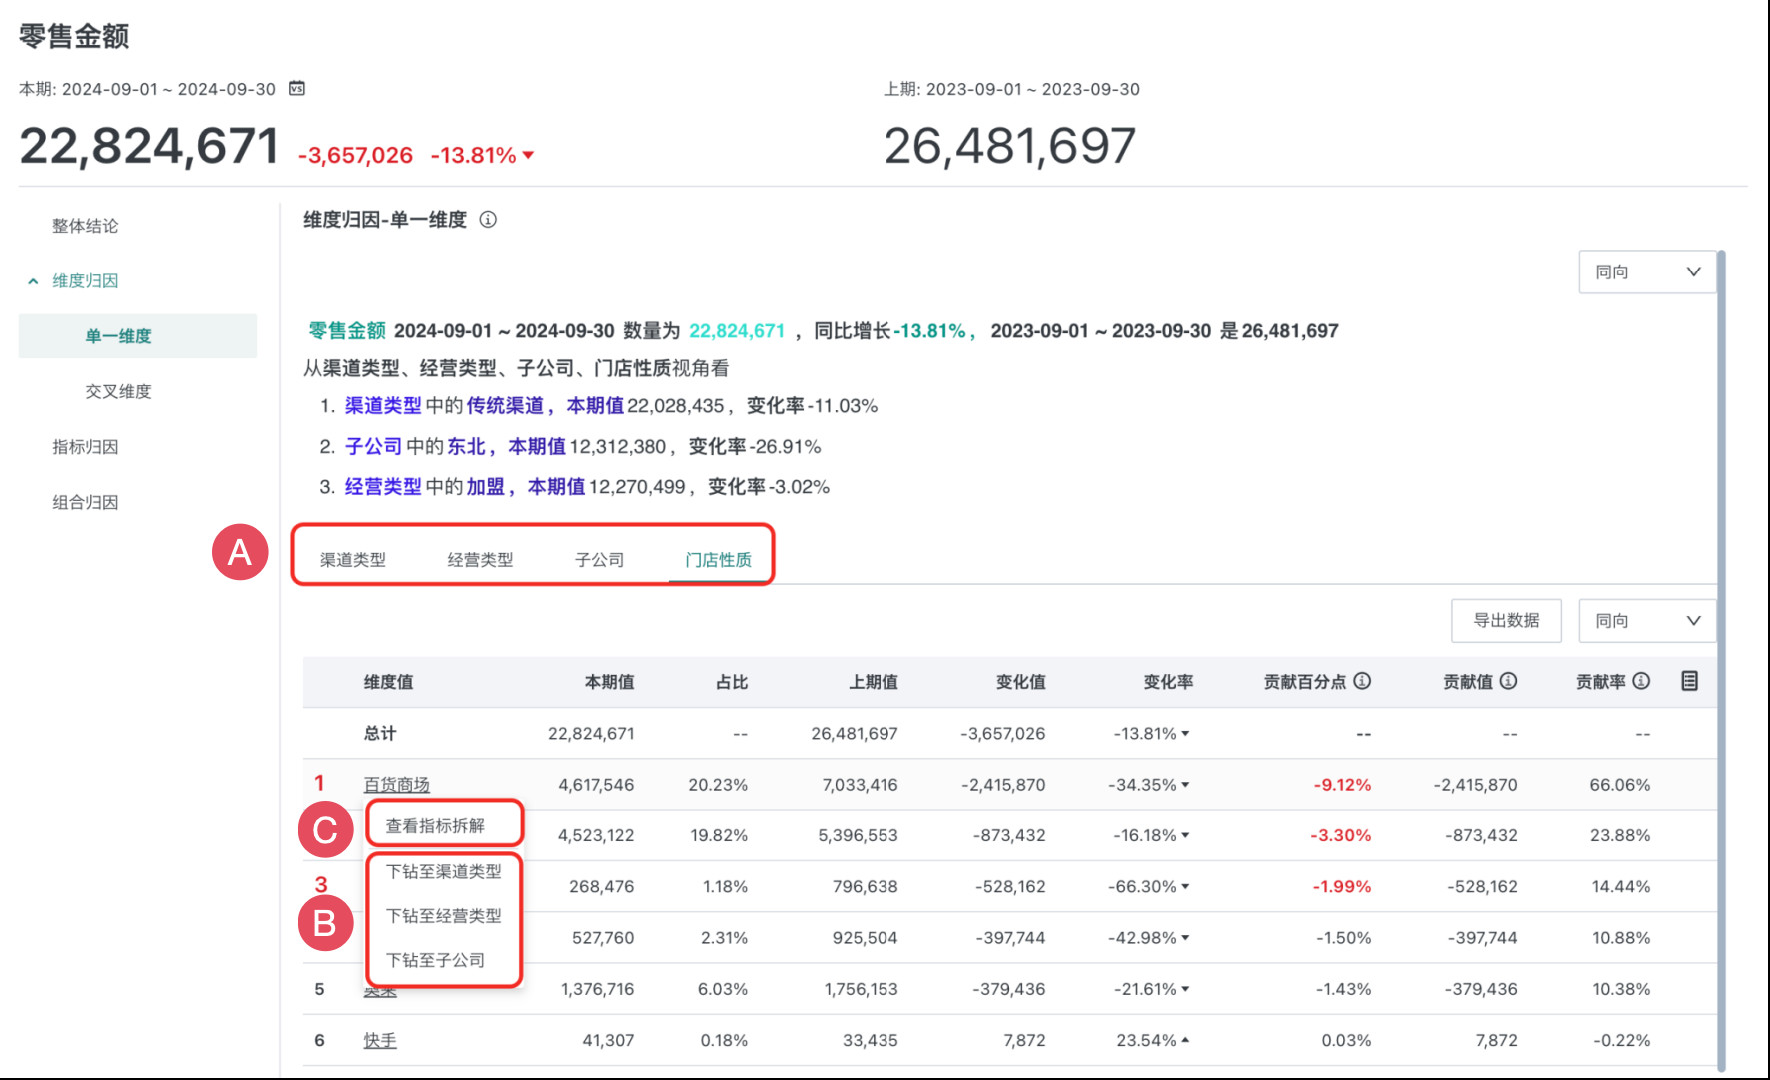
- A: Dimension switching: Supports switching dimensions to view dimension value attribution under different dimensions.
- B: Dimension drilling: Based on the current dimension, freely select another dimension for data drilling, such as: Northeast -> Heilongjiang -> Harbin.
- C: Indicator breakdown: Perform indicator attribution based on any dimension value (please ensure that indicator logic has been configured in the intelligent attribution configuration interface).
- Relative to overall market: Breakdown factors (indicators) contribution to the overall change of the attribution indicator
- Relative to superior: Breakdown factors (indicators) contribution to the change under current dimension value conditions (based on drilling from the previous level dimension)
You can choose to display same-direction, reverse-direction, or all attribution dimensions. For the meaning of same-direction and reverse-direction, see Appendix: Concept Explanation.
2.3.3. Indicator Attribution Results
Indicator attribution calculates contribution from the perspective of business operation logic, helping management discover the impact of operational strategies behind indicator changes. Management often corresponds to specific matters or links.
You can choose to display same-direction, reverse-direction, or all attribution dimensions. For the meaning of same-direction and reverse-direction, see Appendix: Concept Explanation.
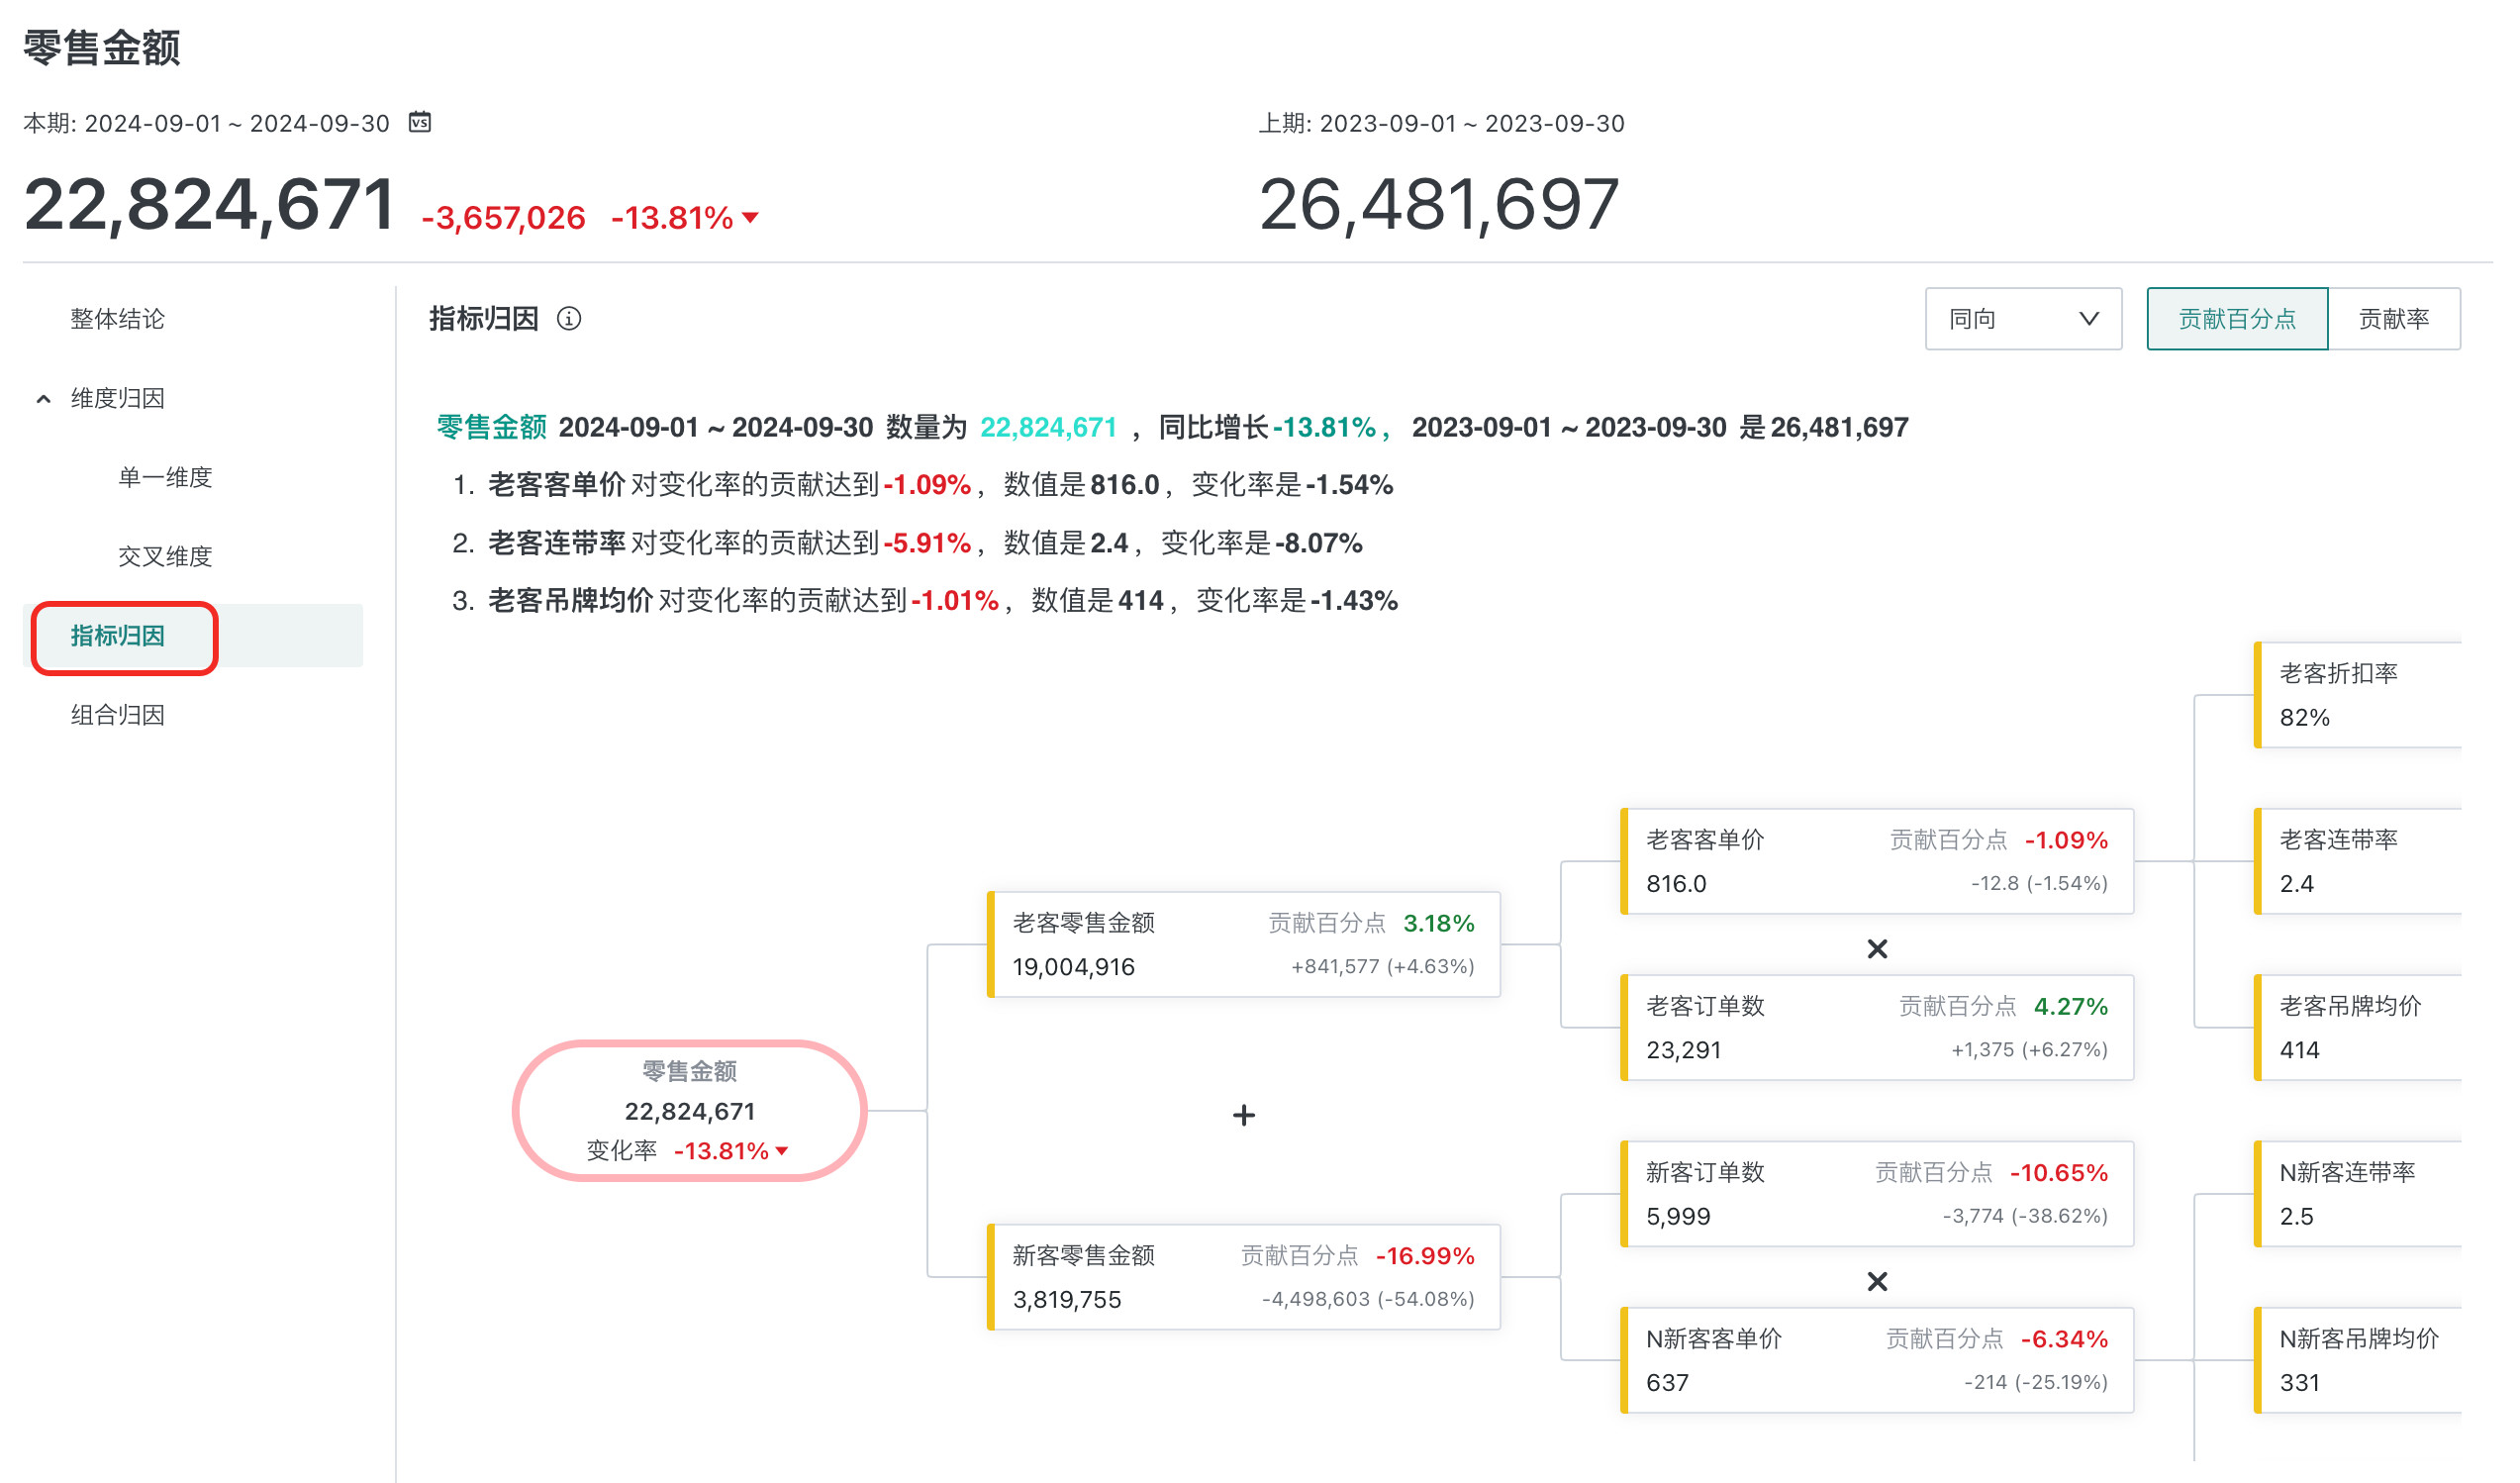
2.3.3.1. Attribution Conclusion
The indicator attribution result displays the impact of each indicator on the target attribution indicator according to the configured indicator logic. The text part of the page includes opening words and indicator attribution conclusions.
The conclusion template for indicator attribution can be customized by clicking "Report Content". The conclusion supports configured content (for details, see 2.4. Configure Report Content):
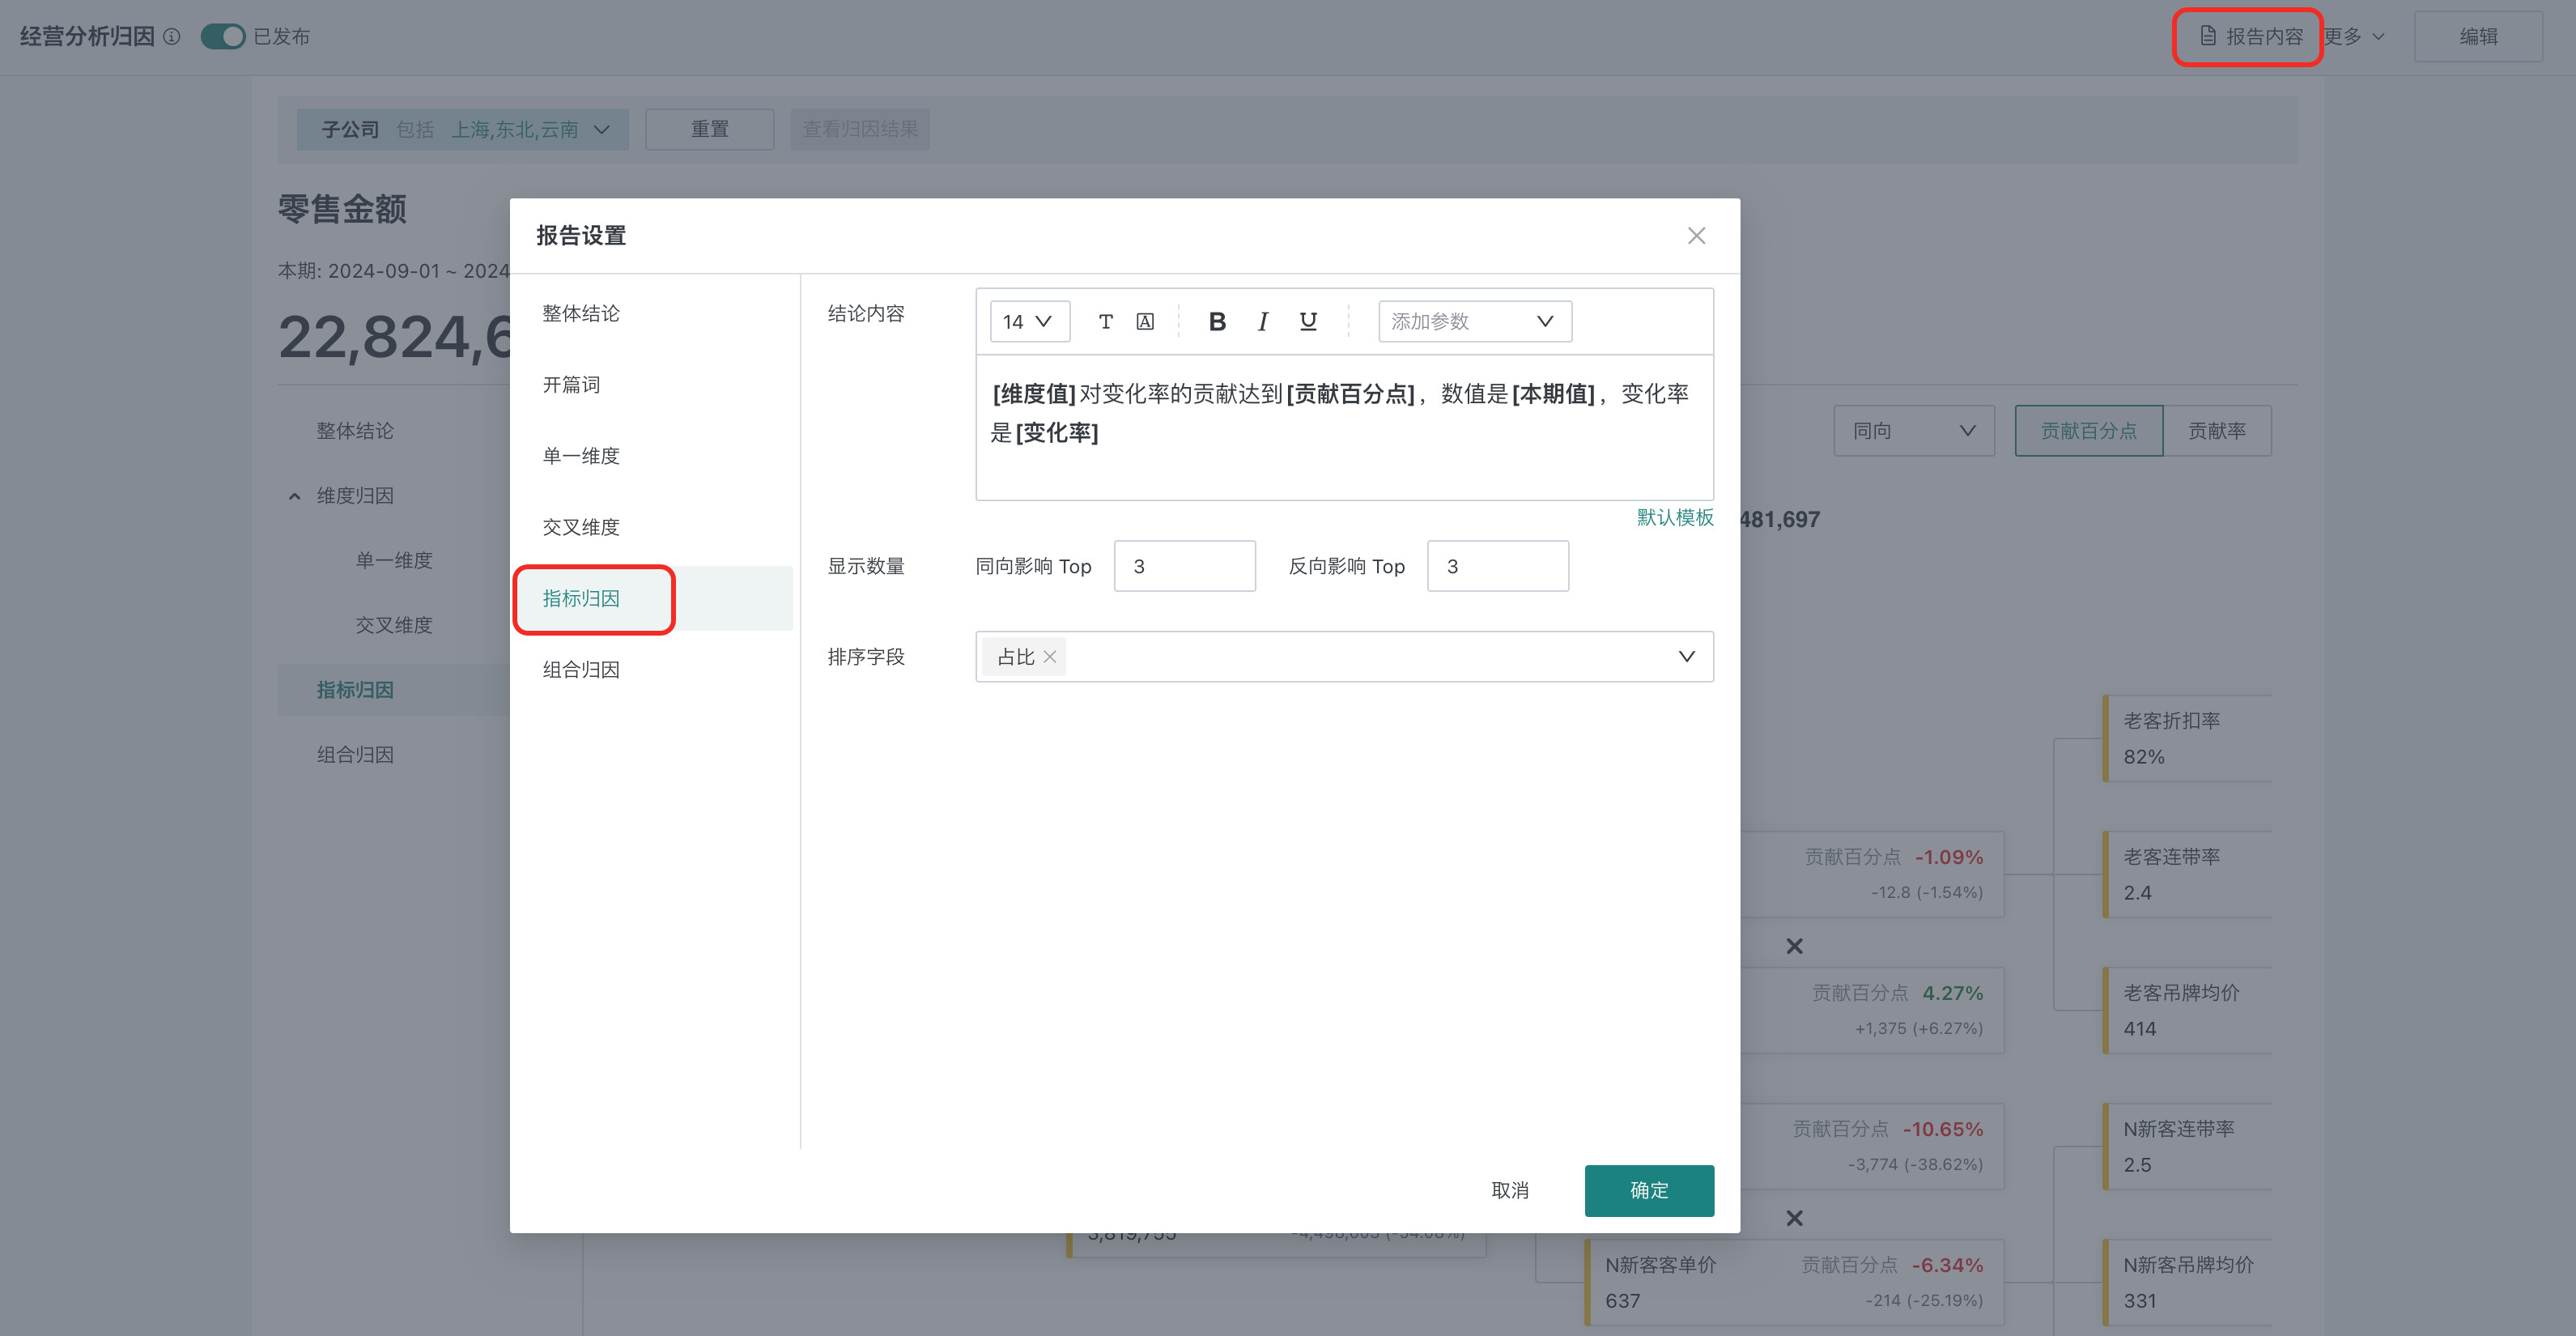
- Text style: Size, font, color and other common configurations.
- Text parameters: Including dimension name, dimension value, maximum, current period value, previous period value, change value, change rate, proportion, contribution value, contribution percentage points, contribution rate. Users can reference detail parameters in the text, and related parameters will be filled with actual data.
- Display quantity: The number of attribution items displayed in the conclusion, configured separately for same-direction and reverse-direction.
- Sort field: Supports descending order based on detail indicators.
2.3.4. Combination Attribution Results
Combination attribution combines dimension and indicator attribution, calculating contribution through deterministic analysis chains and operational logic, helping management perform penetrating analysis and operations. Business can quickly locate specific business units and operational logic, thereby quickly completing business adjustments.
You can choose to display same-direction, reverse-direction, or all attribution dimensions. For the meaning of same-direction and reverse-direction, see Appendix: Concept Explanation.
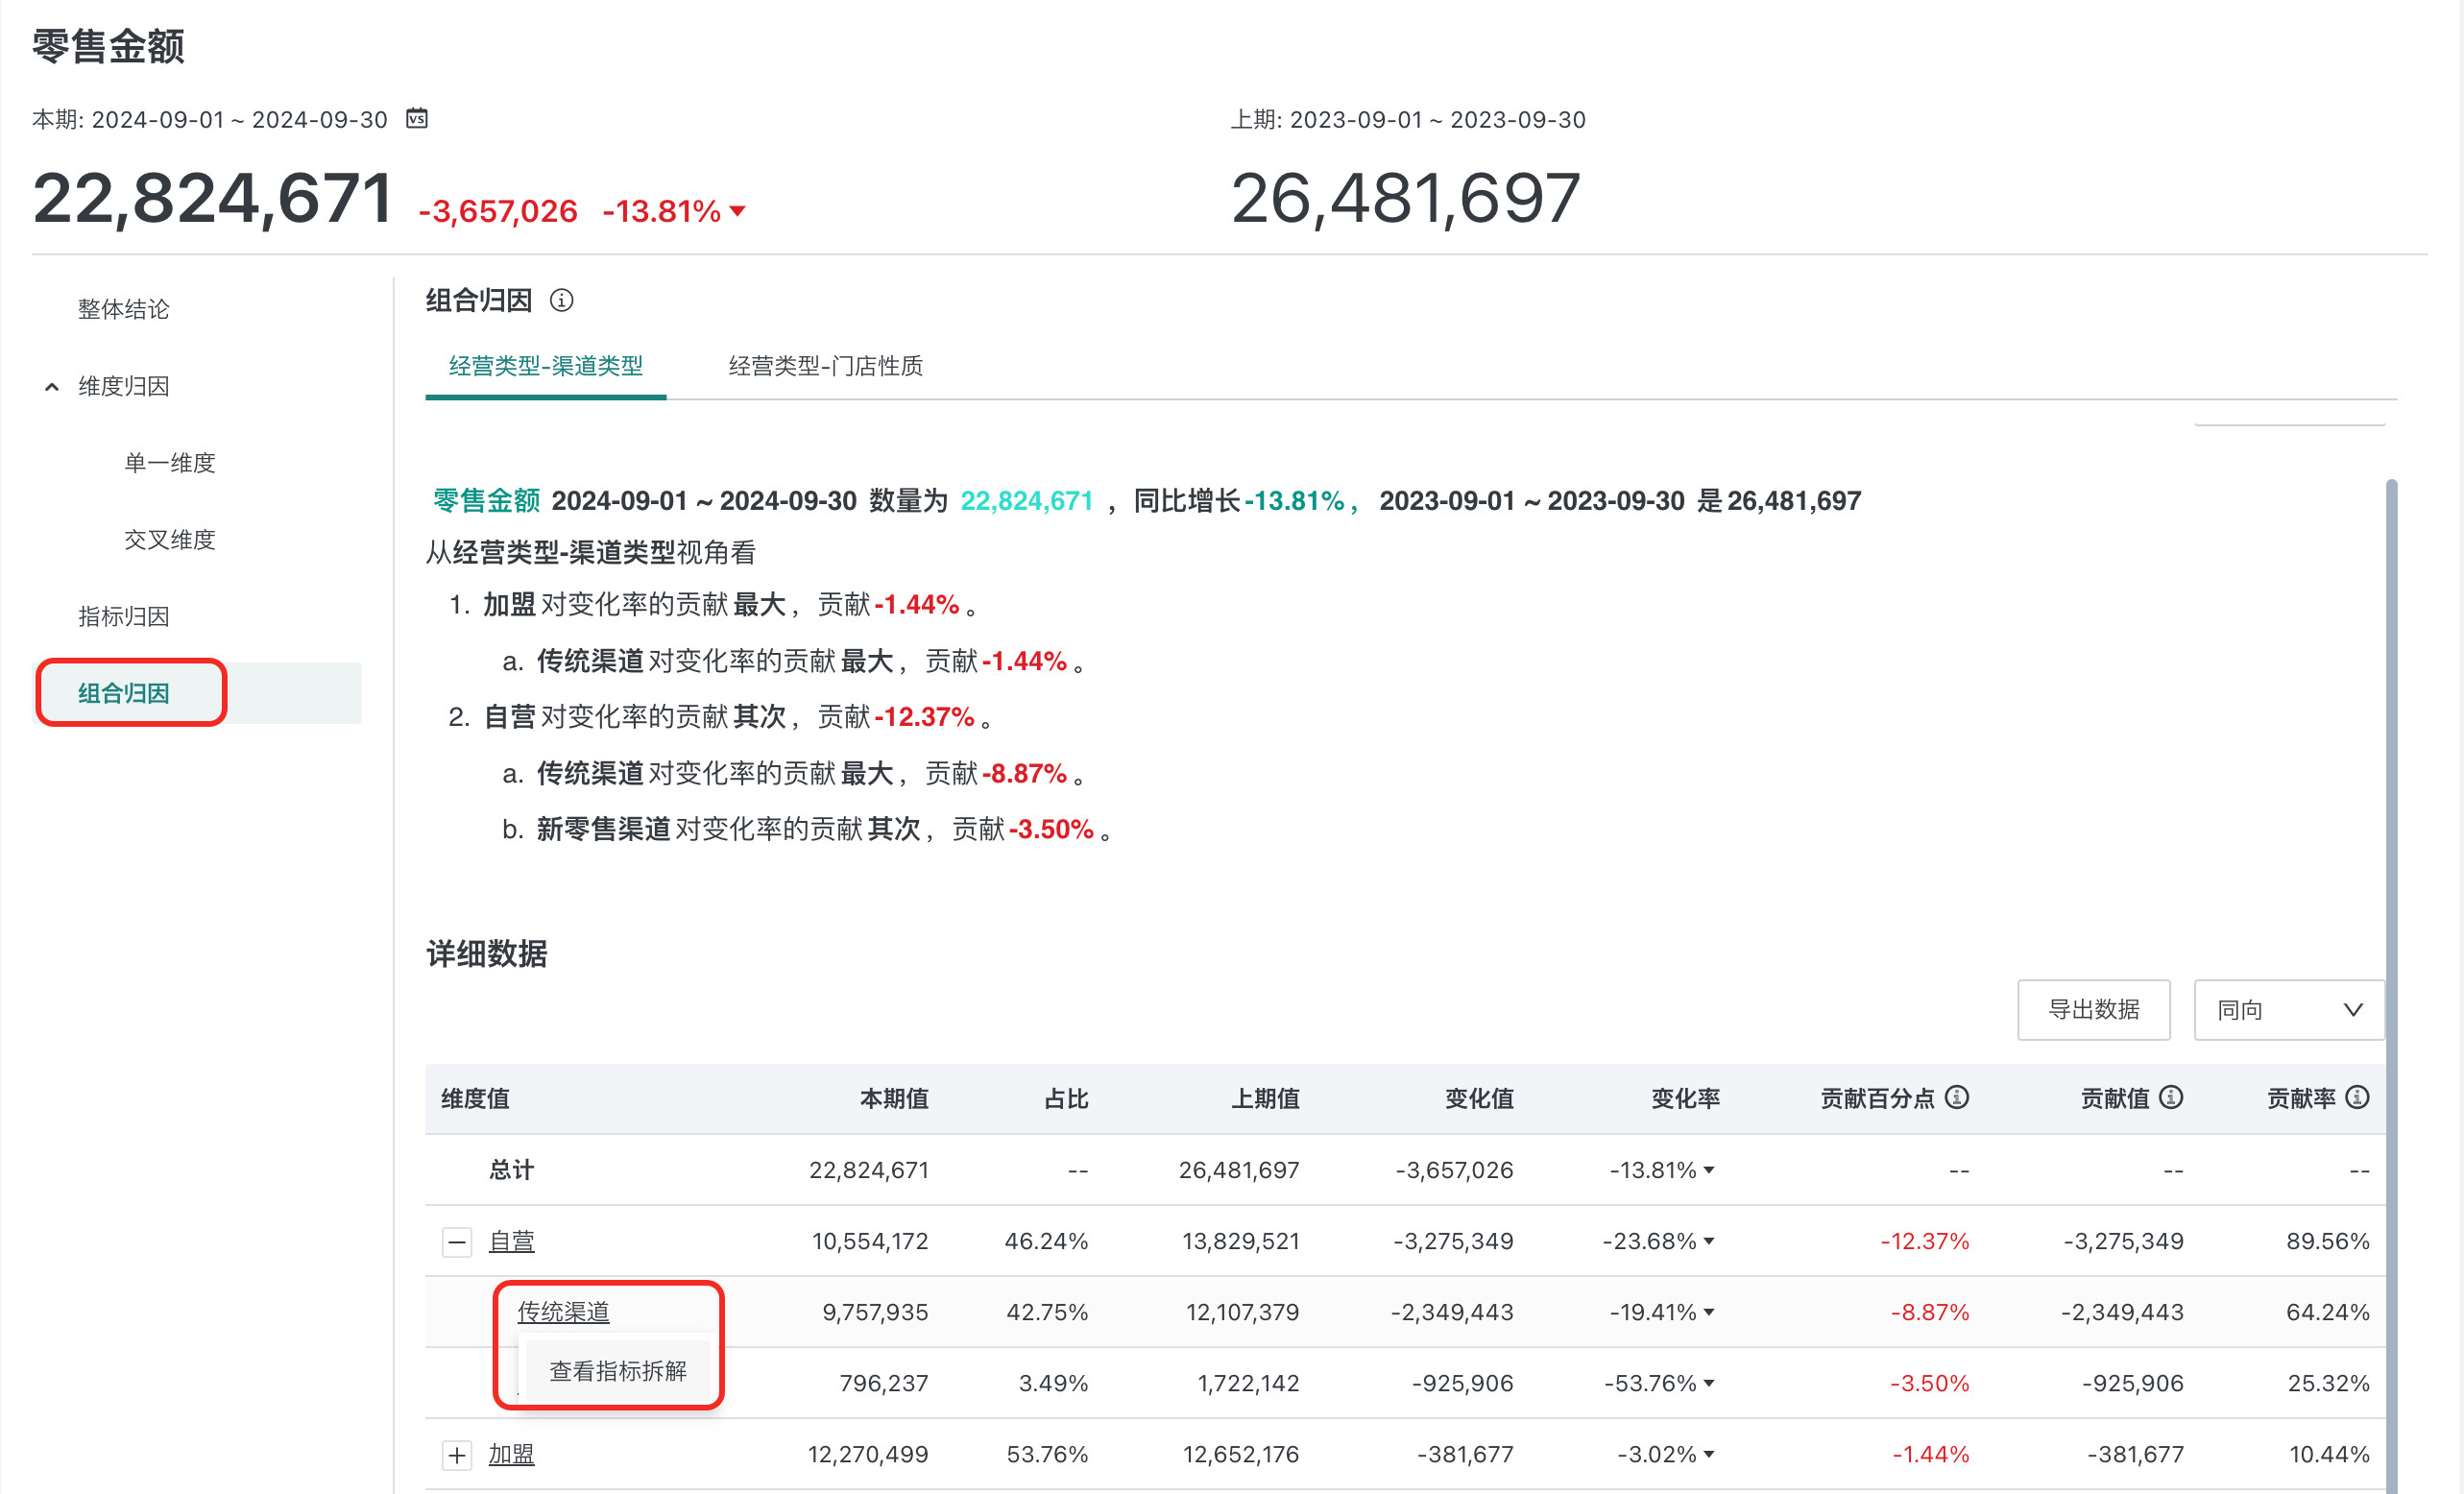
2.3.4.1. Attribution Conclusion
The combination attribution result first performs dimension drilling attribution, then performs indicator attribution on the last-level dimension or dimension combination.
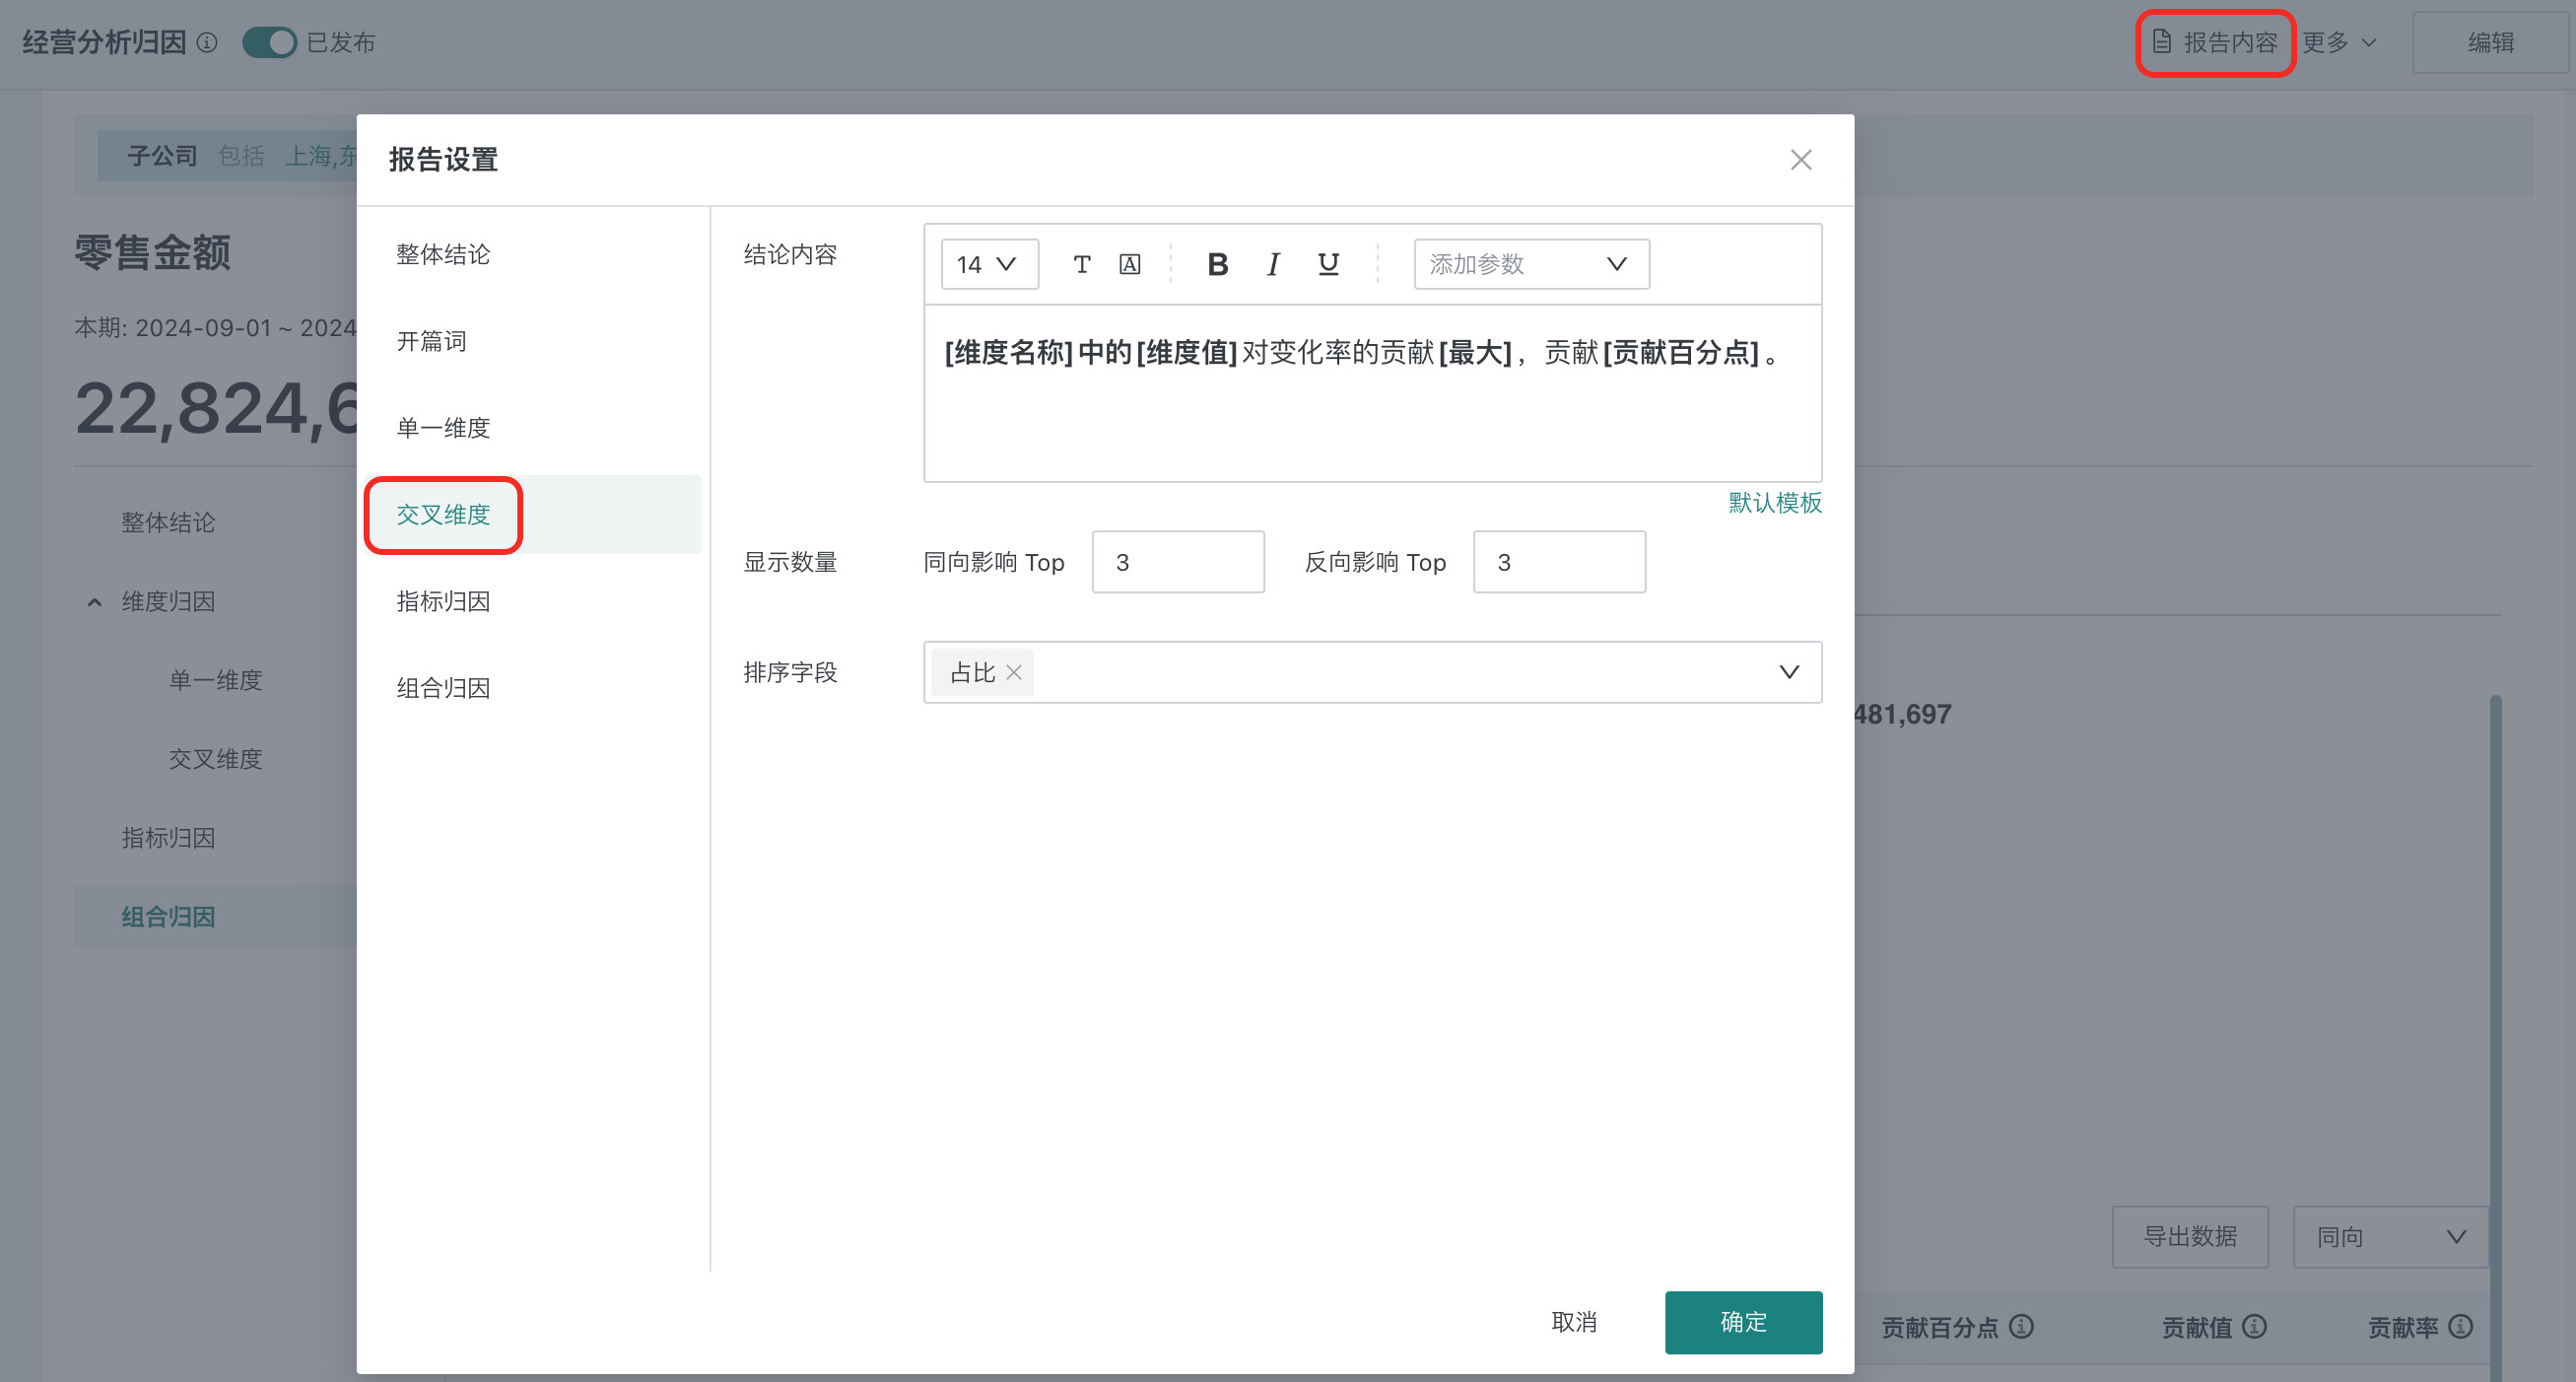
The conclusion template for combination attribution can be customized by clicking "Report Content". The conclusion supports configured content (for details, see 2.4. Configure Report Content):
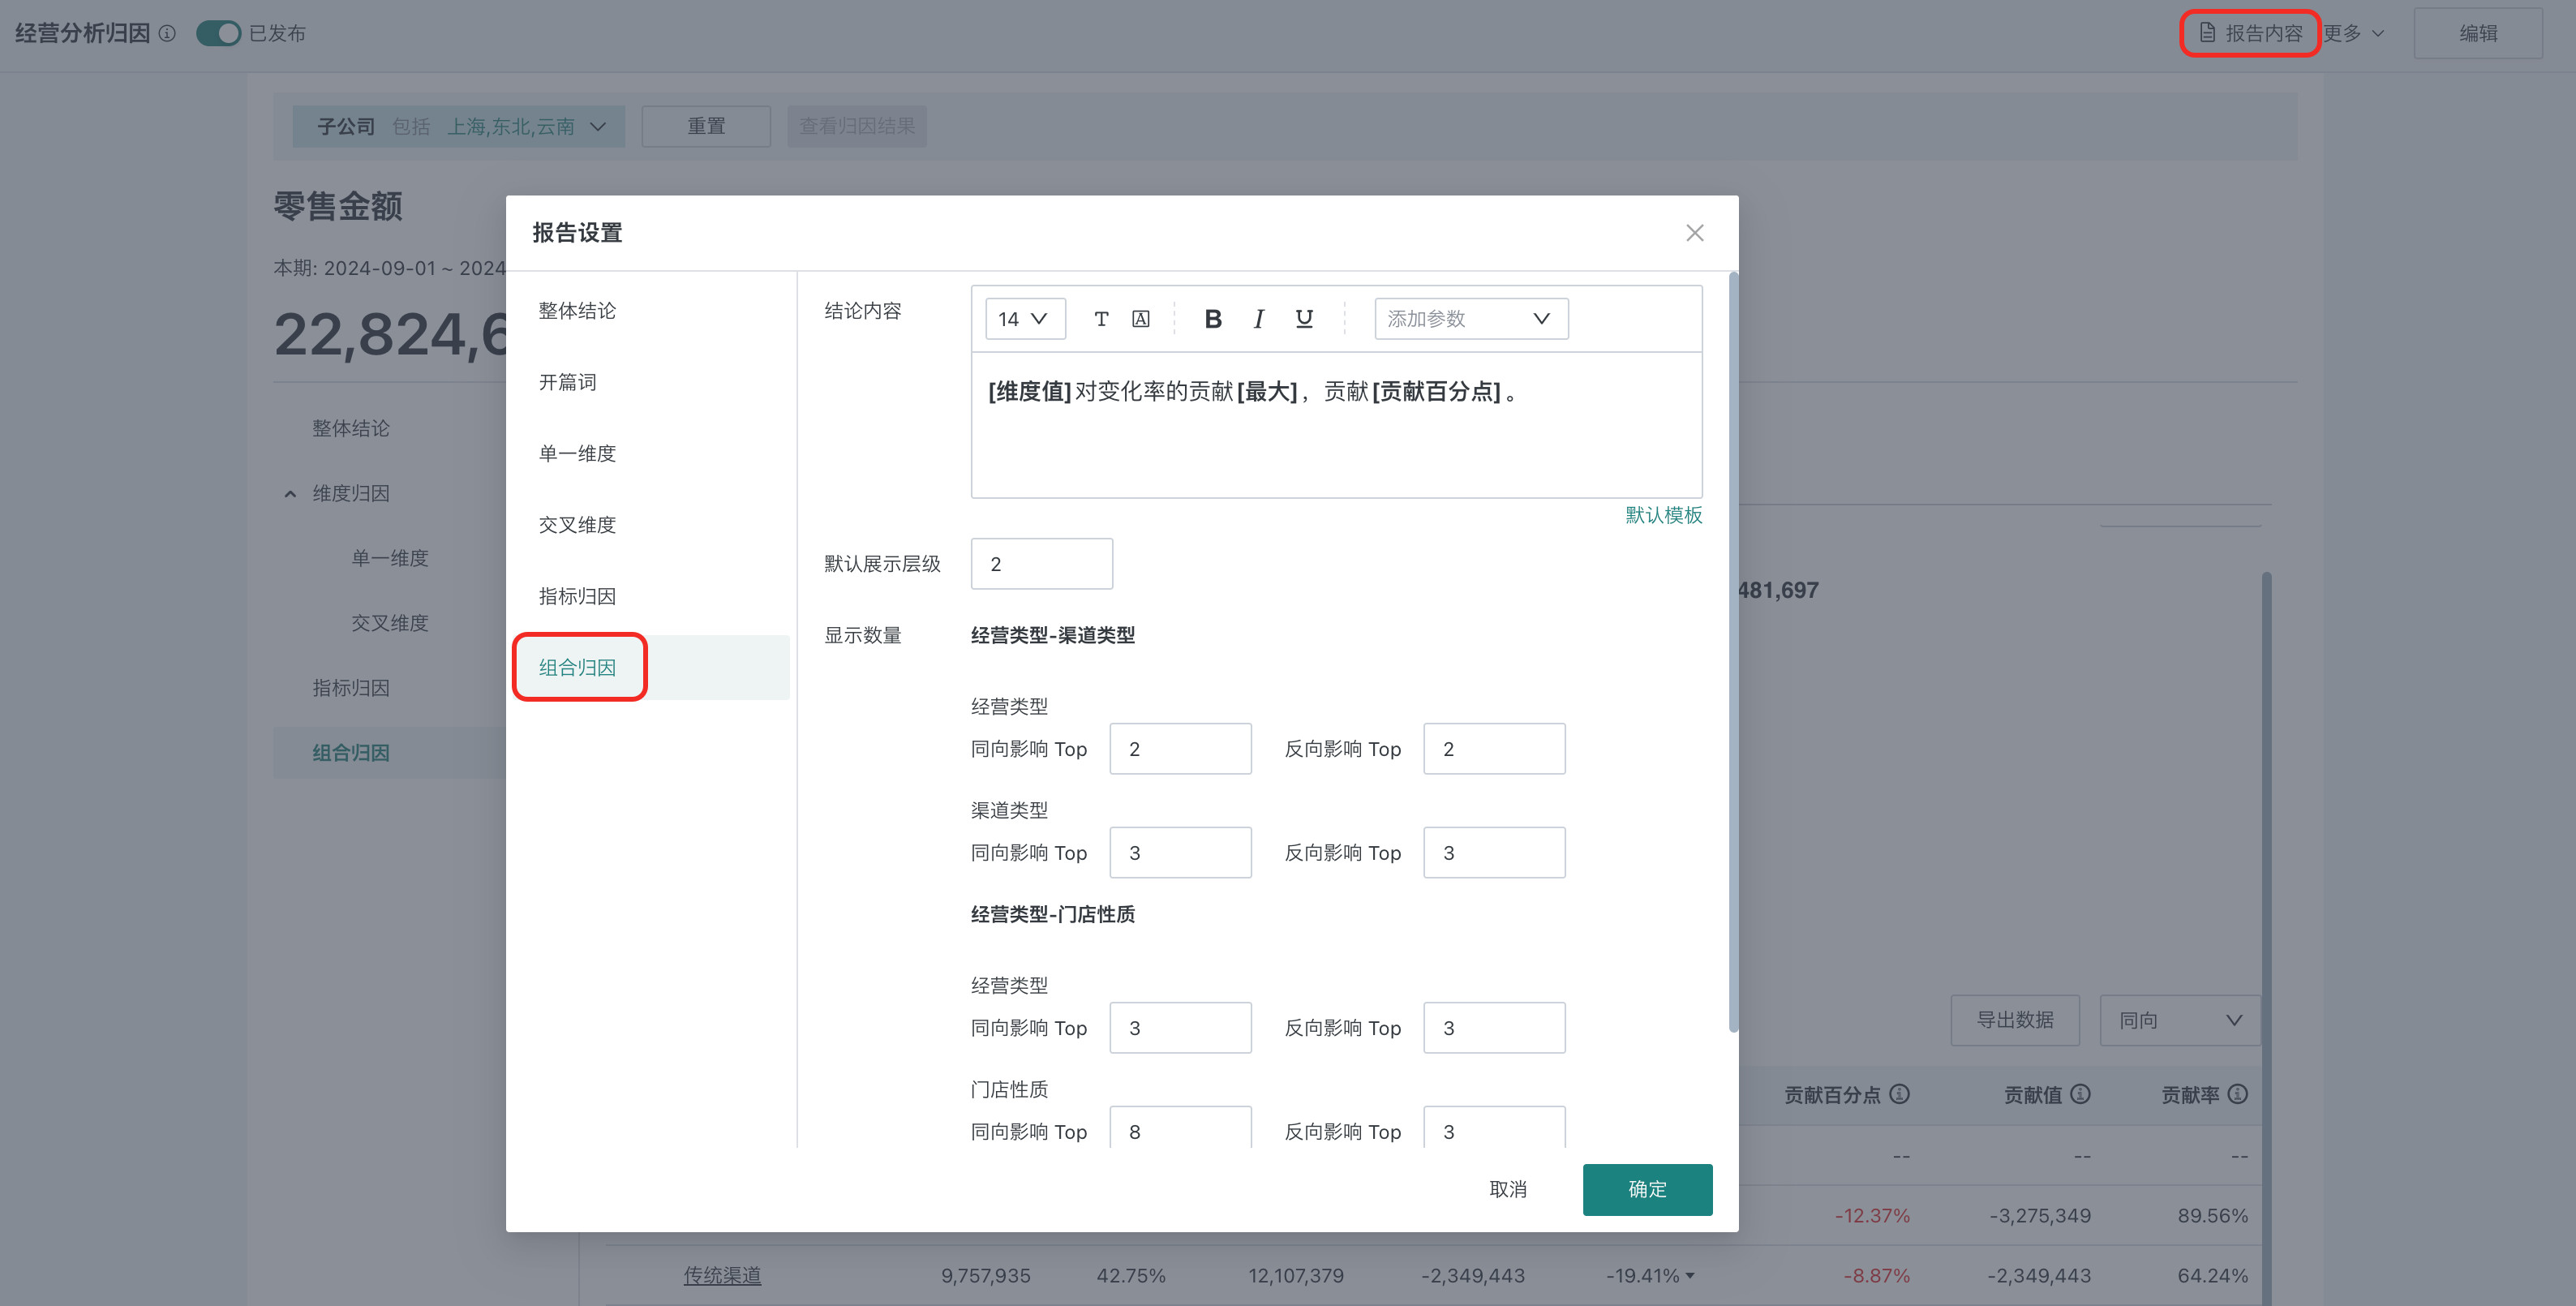
- Text style: Size, font, color and other common configurations.
- Text parameters: Including dimension name, dimension value, maximum, current period value, previous period value, change value, change rate, proportion, contribution value, contribution percentage points, contribution rate. Users can reference detail parameters in the text, and related parameters will be filled with actual data.
- Display level: Display the level in the conclusion according to the order of dimension configuration, such as: in the region -> province -> category -> price band dimension combination, if display level 1 is set, only region attribution will be displayed in the conclusion.
- Display quantity: The number of attribution items displayed in the conclusion, configured separately for same-direction and reverse-direction. Configure separately for each dimension, and it will be sorted based on all dimension value combinations in different dimensions.
- Sort field: Supports descending order based on detail indicators.
2.3.4.2. View Attribution Details
On the combination attribution result page, you can perform the following operations to view combination attribution detail data.
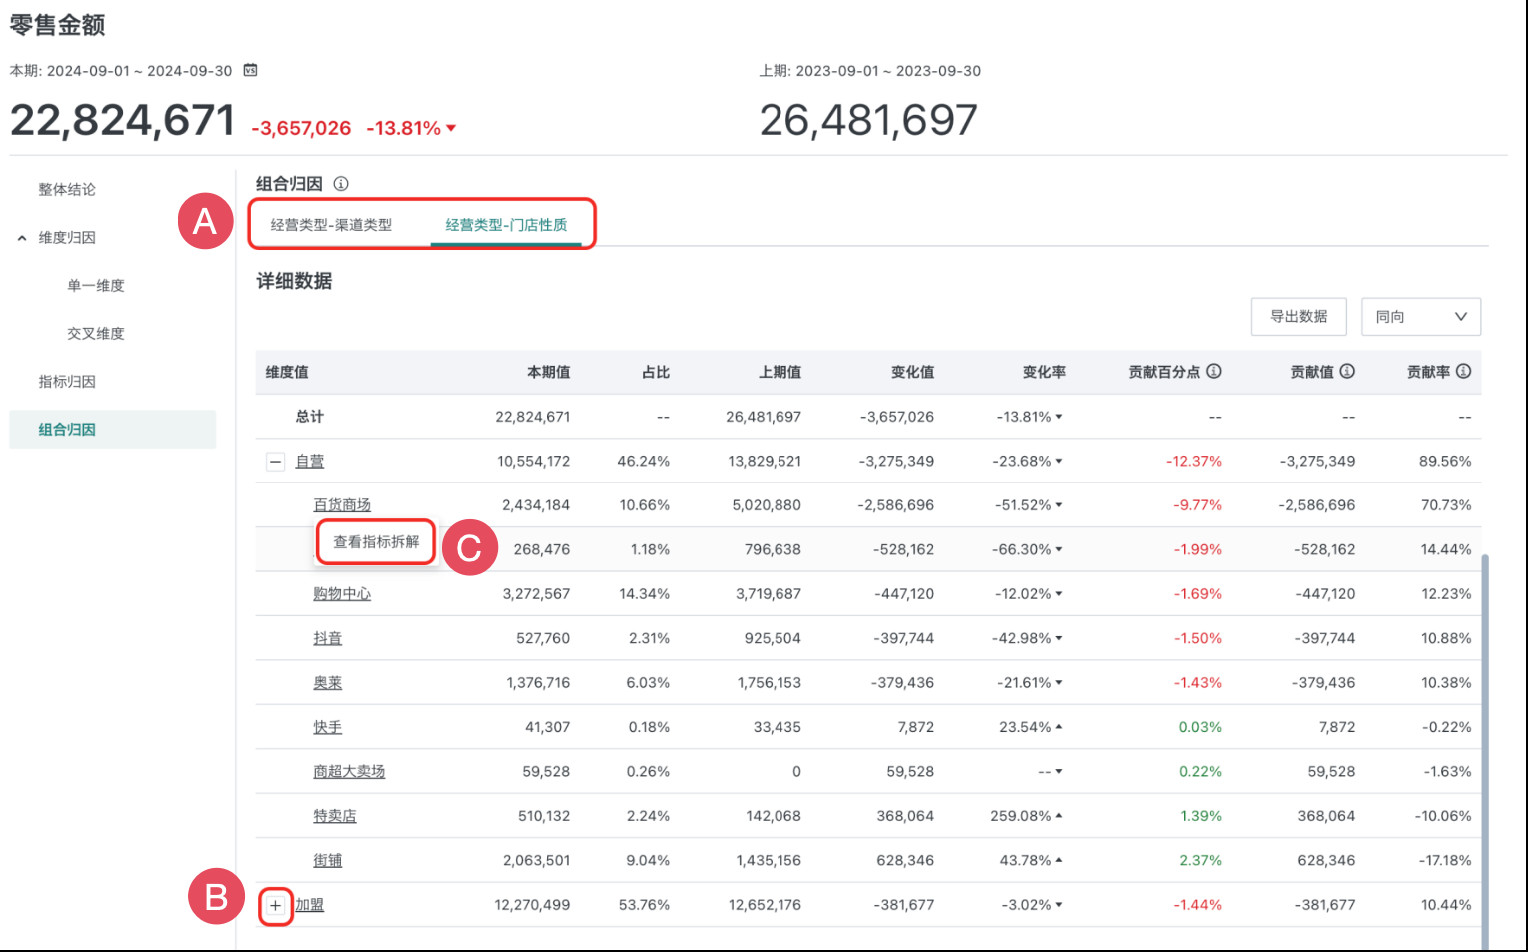
- A: Combination path switching: Supports switching different combination paths.
- B: Dimension drilling: Based on the specified combination path, expand attribution data layer by layer, such as: Northeast --> Heilongjiang --> Harbin.
- C: Indicator breakdown: Perform indicator attribution based on any dimension value (please ensure that indicator logic has been configured in the intelligent attribution configuration interface).
- Relative to overall market: Breakdown factors (indicators) contribution to the overall change of the attribution indicator.
- Relative to superior: Breakdown factors (indicators) contribution to the change under current dimension value conditions (based on drilling from the previous level dimension).
2.4. Configure Report Content
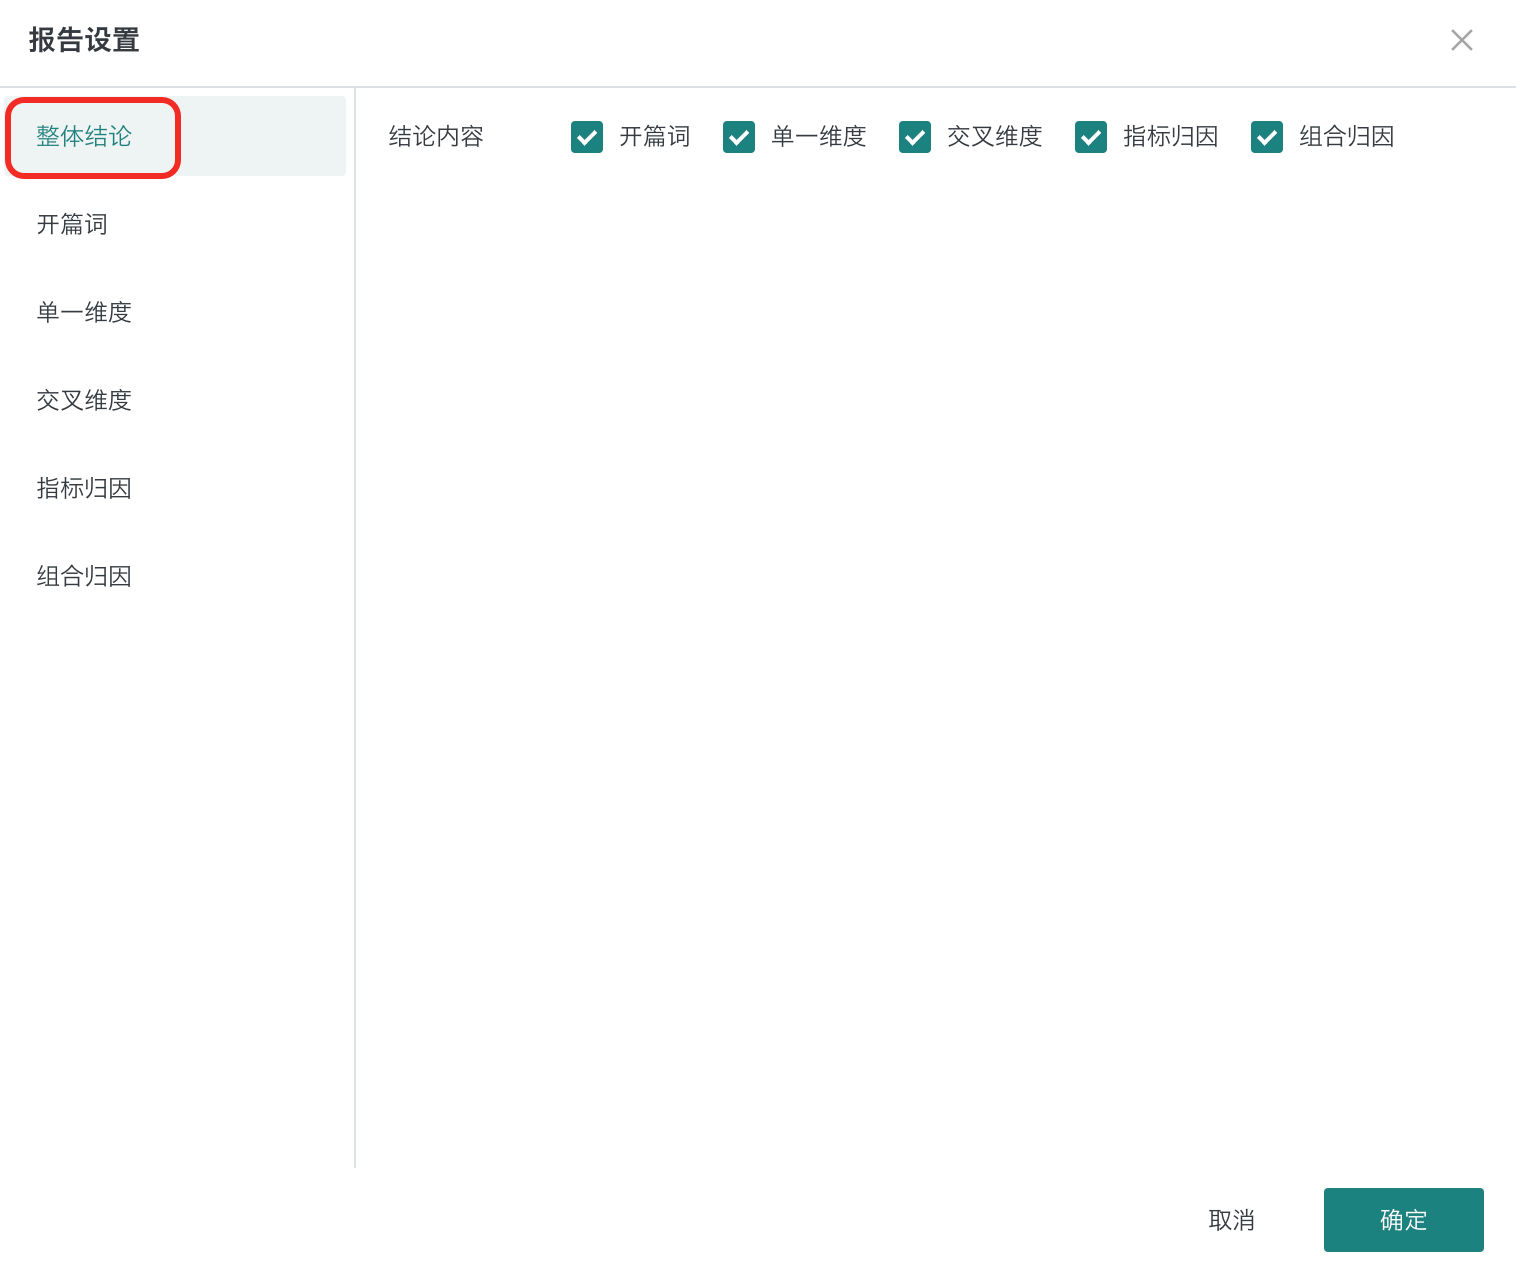
The content and templates displayed on the attribution result page can be customized. Click "Report Content" in the upper right corner of the page to enter the configuration interface.
-
Configure Overall Conclusion Check the conclusion content to be displayed in the overall conclusion, including opening words, single dimension, cross dimension, indicator attribution and combination attribution.
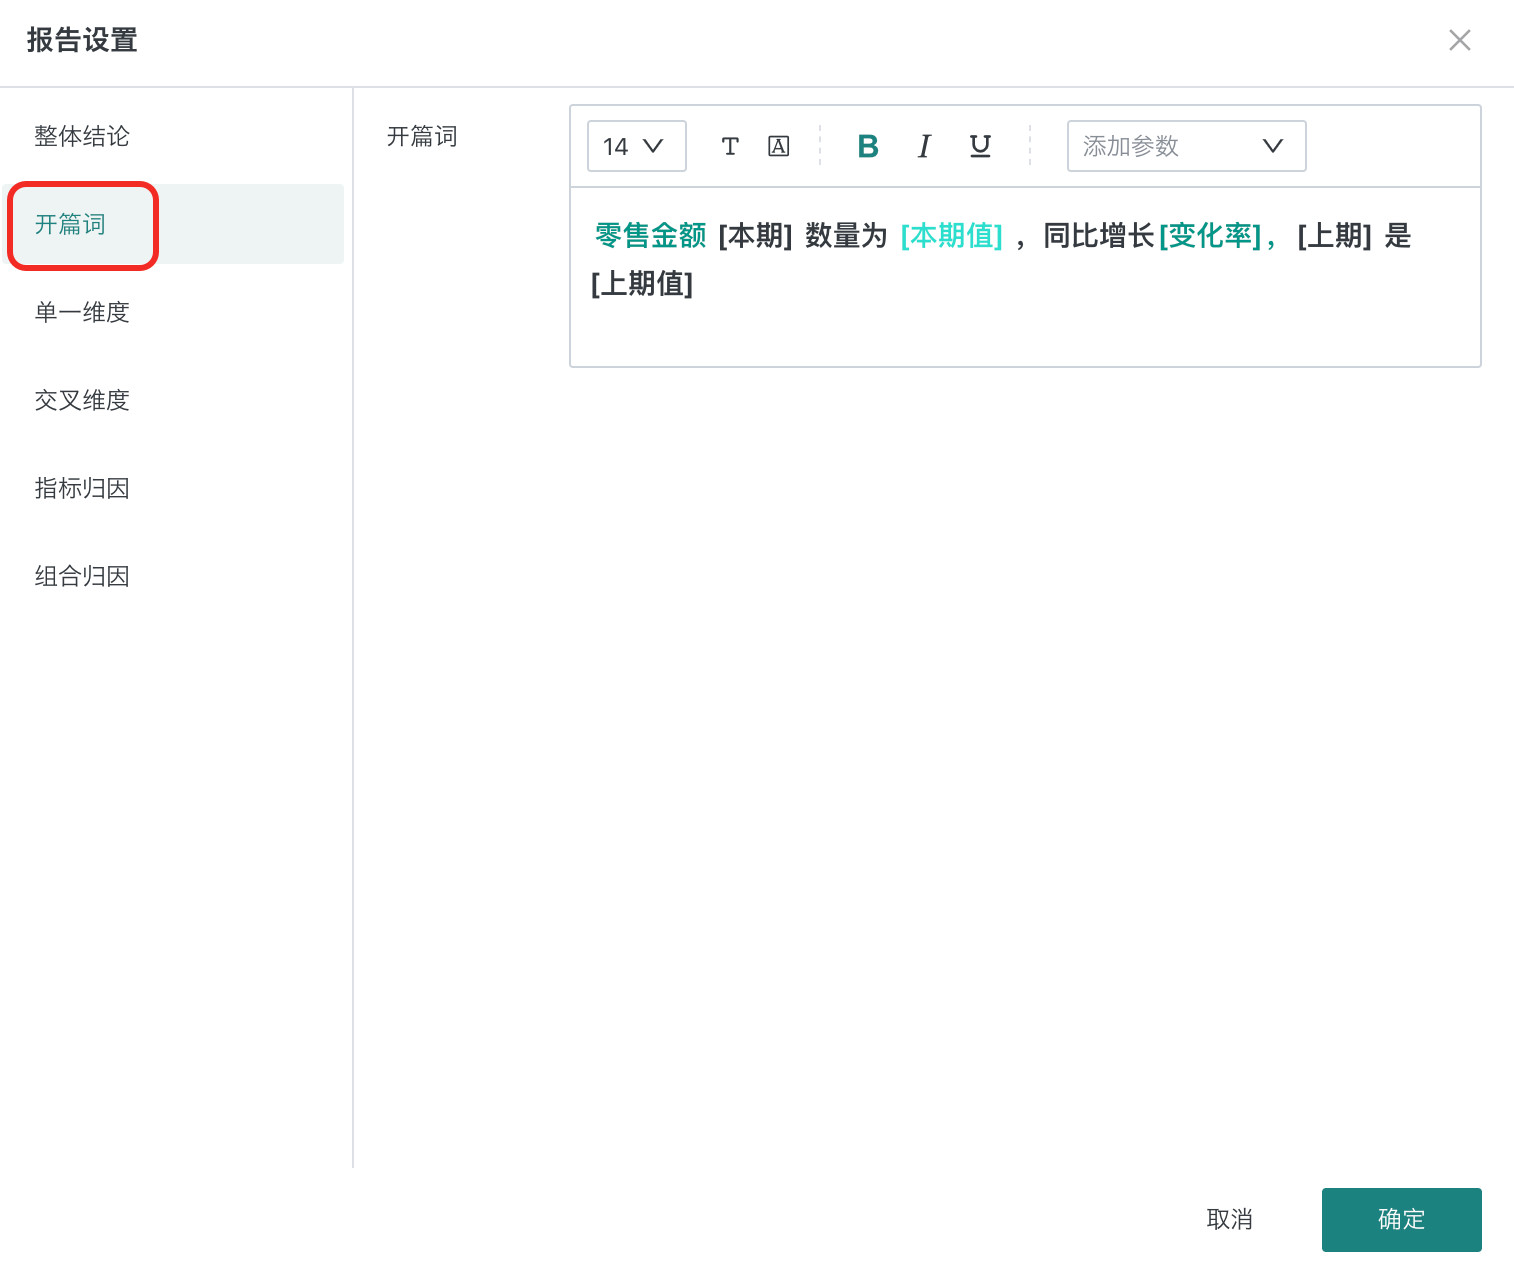
-
Configure Opening Words Content Configure the opening words template for each analysis result page. Select fields in the "Add Parameters" dropdown, and the results will be dynamically displayed according to parameter values.
-
Configure Single Dimension Content Configure the content template displayed on the single dimension result page.
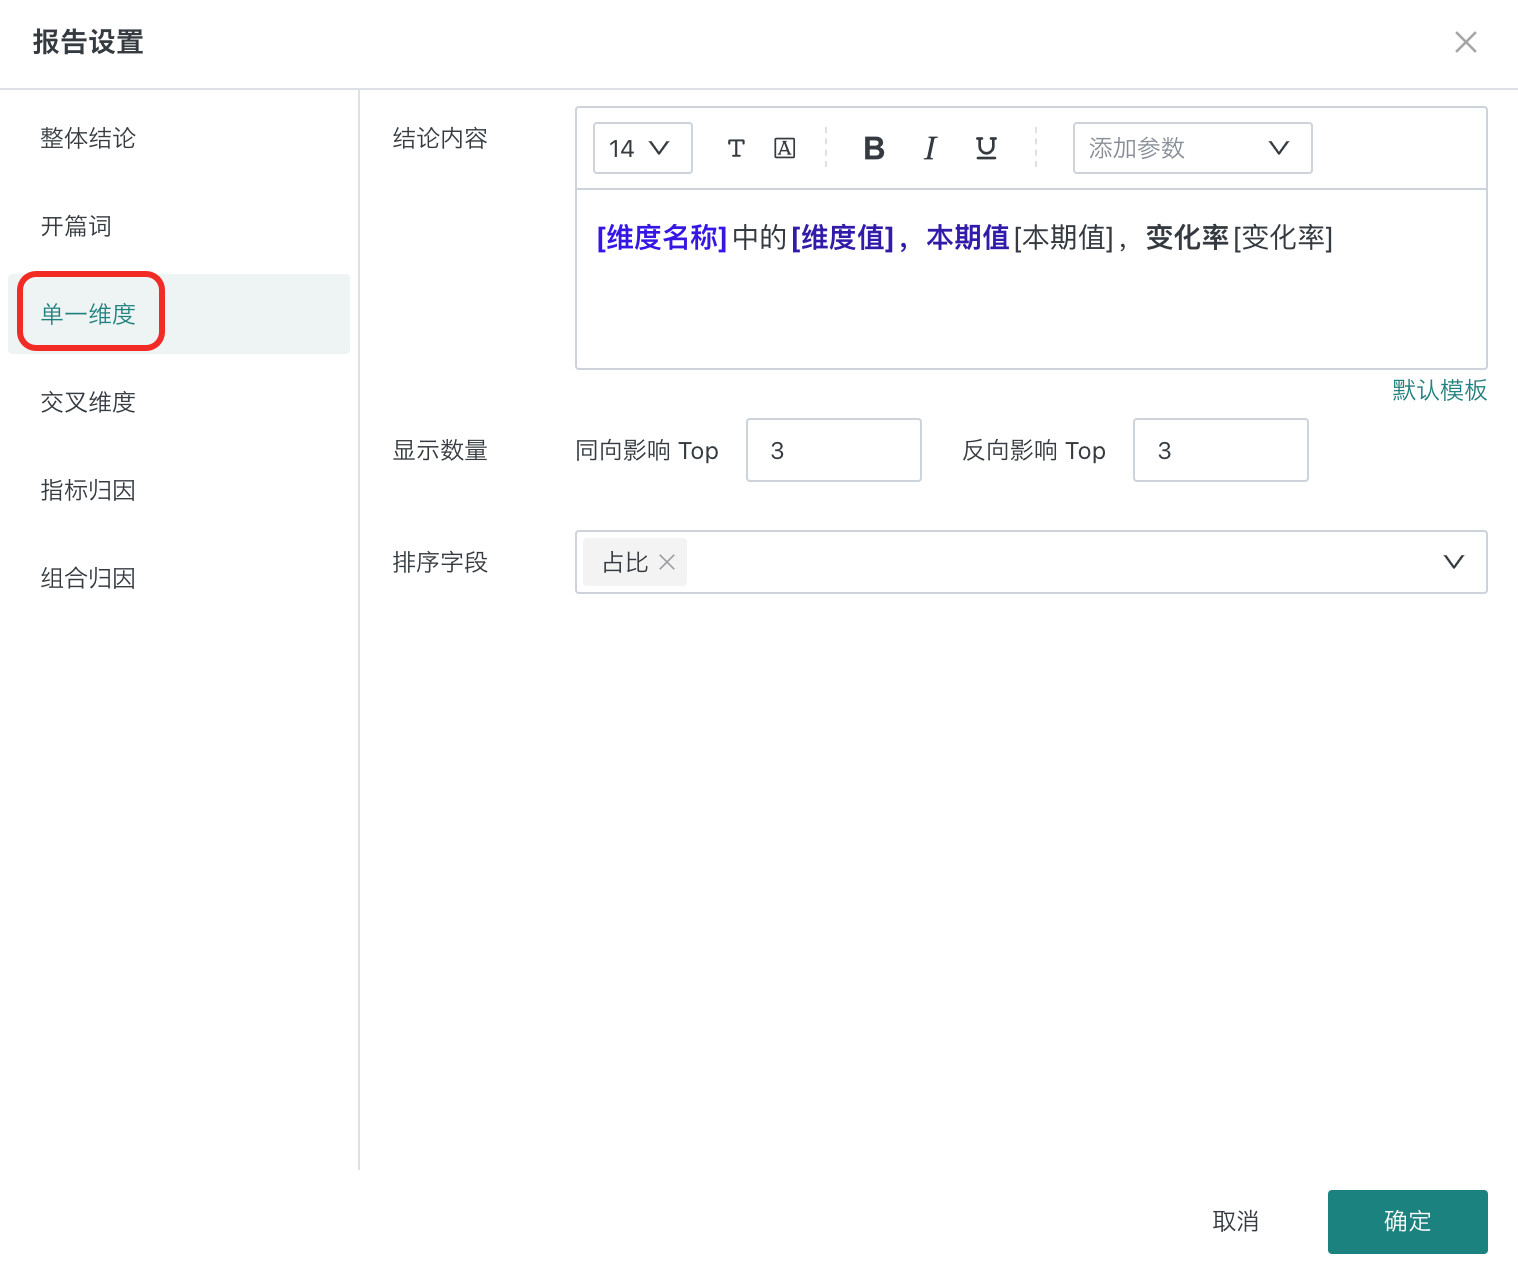
| Configuration Item | Description |
|---|---|
| Conclusion Content | Configure conclusion content template and style. |
| Display Quantity | Configure the number of same-direction/reverse-direction impact dimensions displayed on the result page. |
| Sort Field | Sort in descending order based on detail indicators. |
-
Configure Cross Dimension Content Configure the content template displayed on the cross dimension result page.
| Configuration Item | Description |
|---|---|
| Conclusion Content | Configure conclusion content template and style. |
| Display Quantity | Configure the number of same-direction/reverse-direction impact dimensions displayed on the result page. It will be sorted based on all dimension value combinations in different dimensions. |
| Sort Field | Supports descending order based on detail indicators. |
-
Configure Indicator Attribution Content Configure the content template displayed on the indicator attribution result page.
| Configuration Item | Description |
|---|---|
| Conclusion Content | Configure conclusion content template and style. |
| Display Quantity | Configure the number of same-direction/reverse-direction impact dimensions displayed on the result page. |
| Sort Field | Supports descending order based on detail indicators. |
-
Configure Combination Attribution Content Configure the content template displayed on the indicator attribution result page.
| Configuration Item | Description |
|---|---|
| Conclusion Content | Configure conclusion content template and style. |
| Default Display Level | Select the analysis dimension level displayed in the combination attribution result, for example, if configured as 2, the result page will expand according to 2-level dimensions.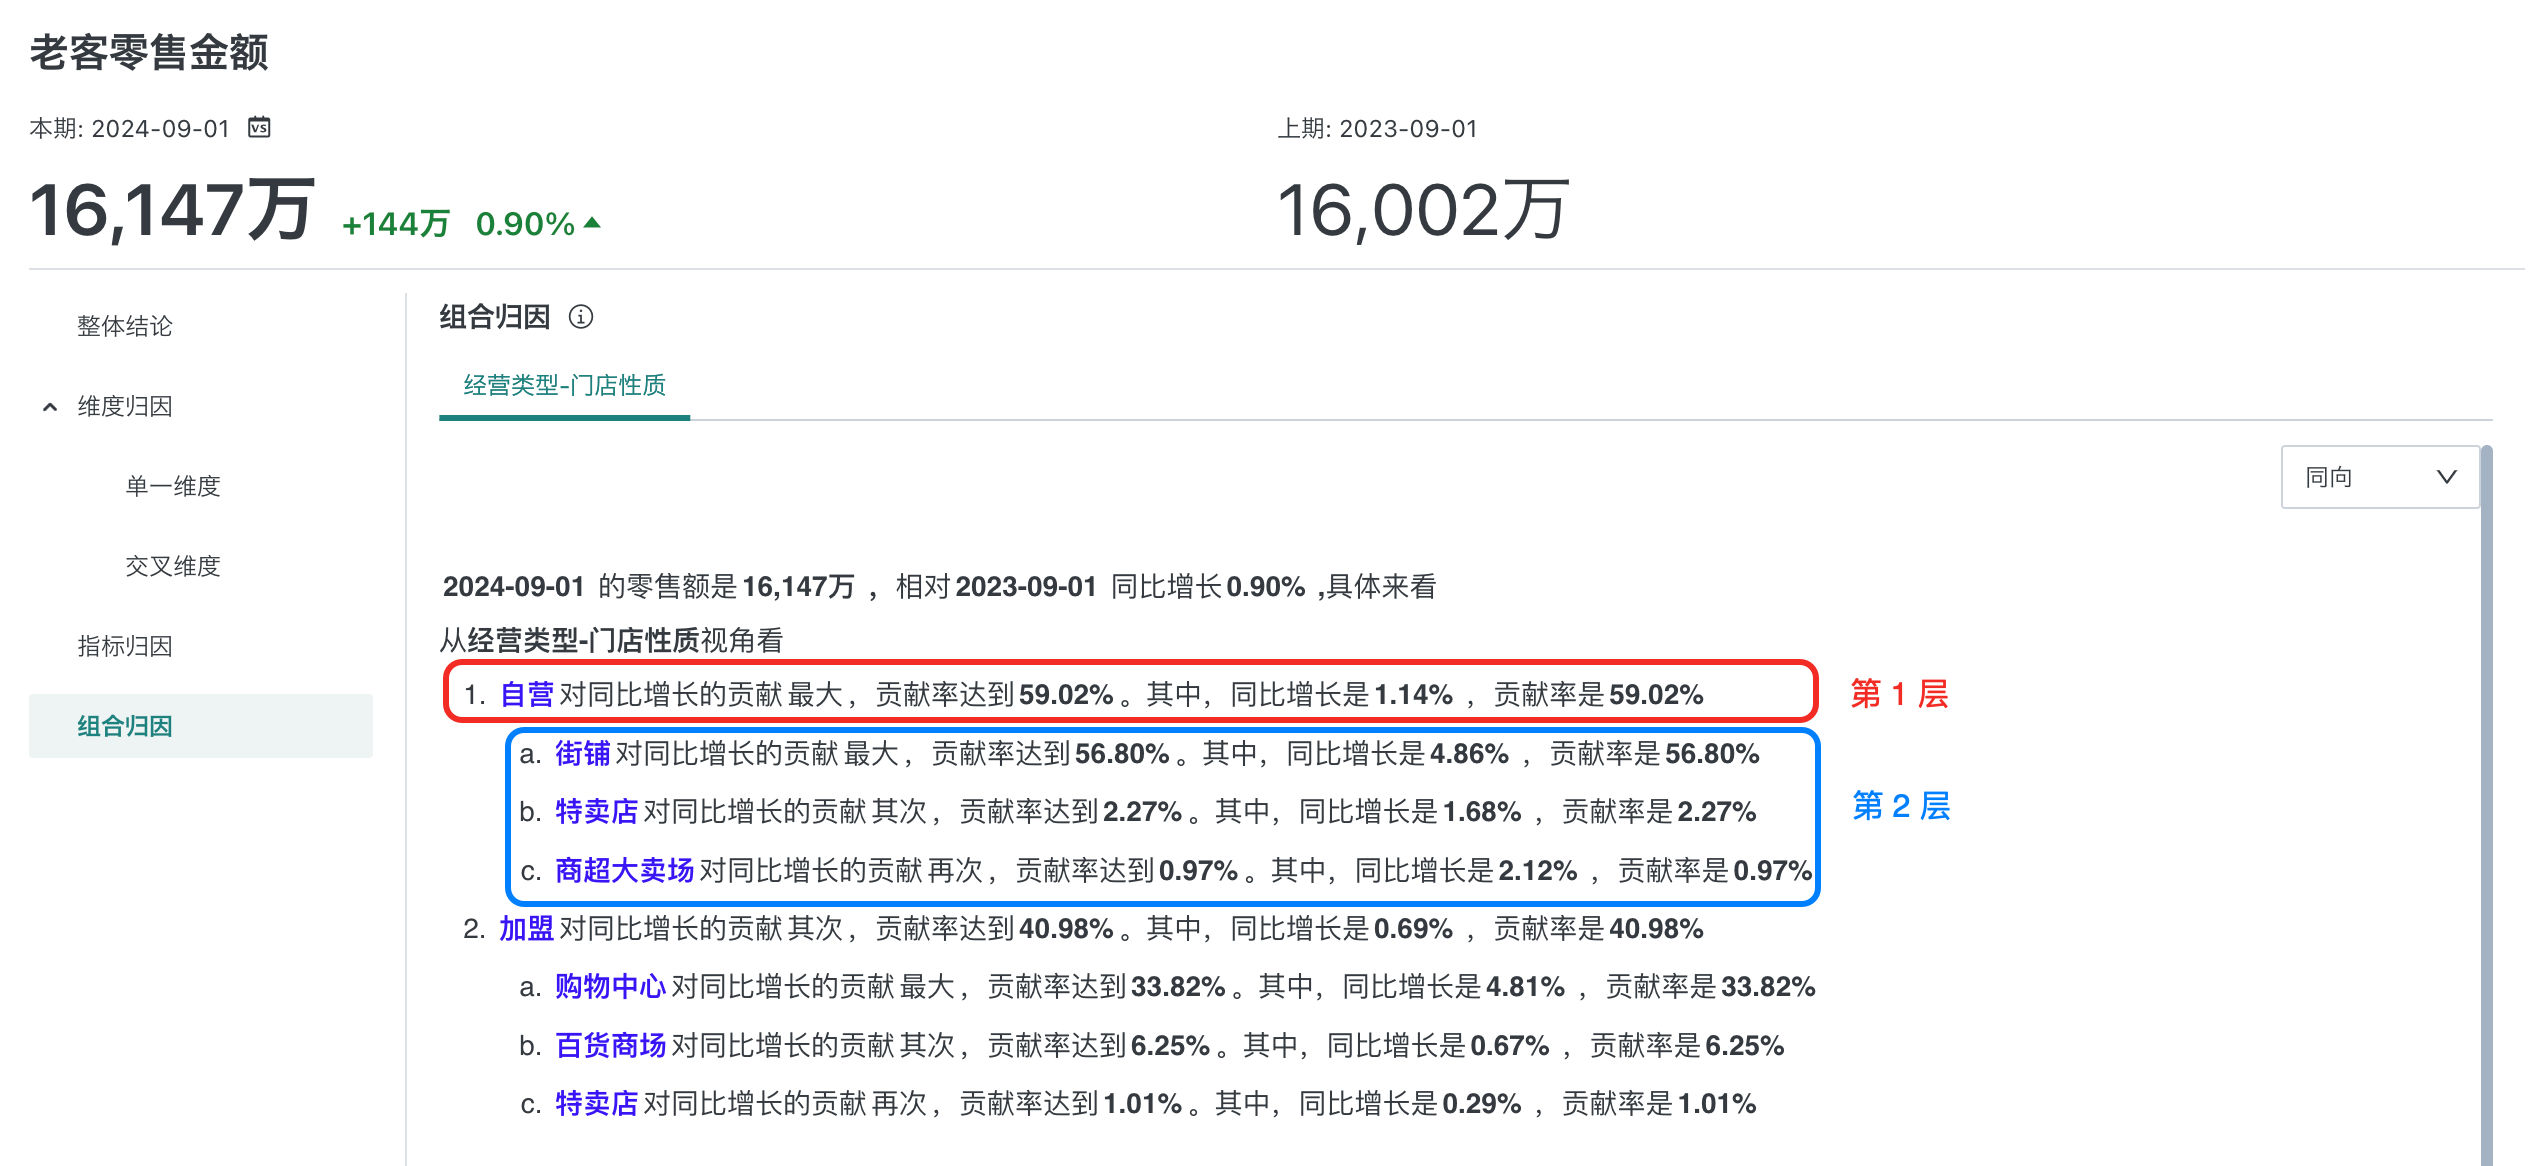 |
| Display Quantity | Configure the number of same-direction/reverse-direction impact dimensions displayed on the result page. Configure separately for each dimension, and it will be sorted based on all dimension value combinations in different dimensions. |
| Sort Field | Supports descending order based on detail indicators. |
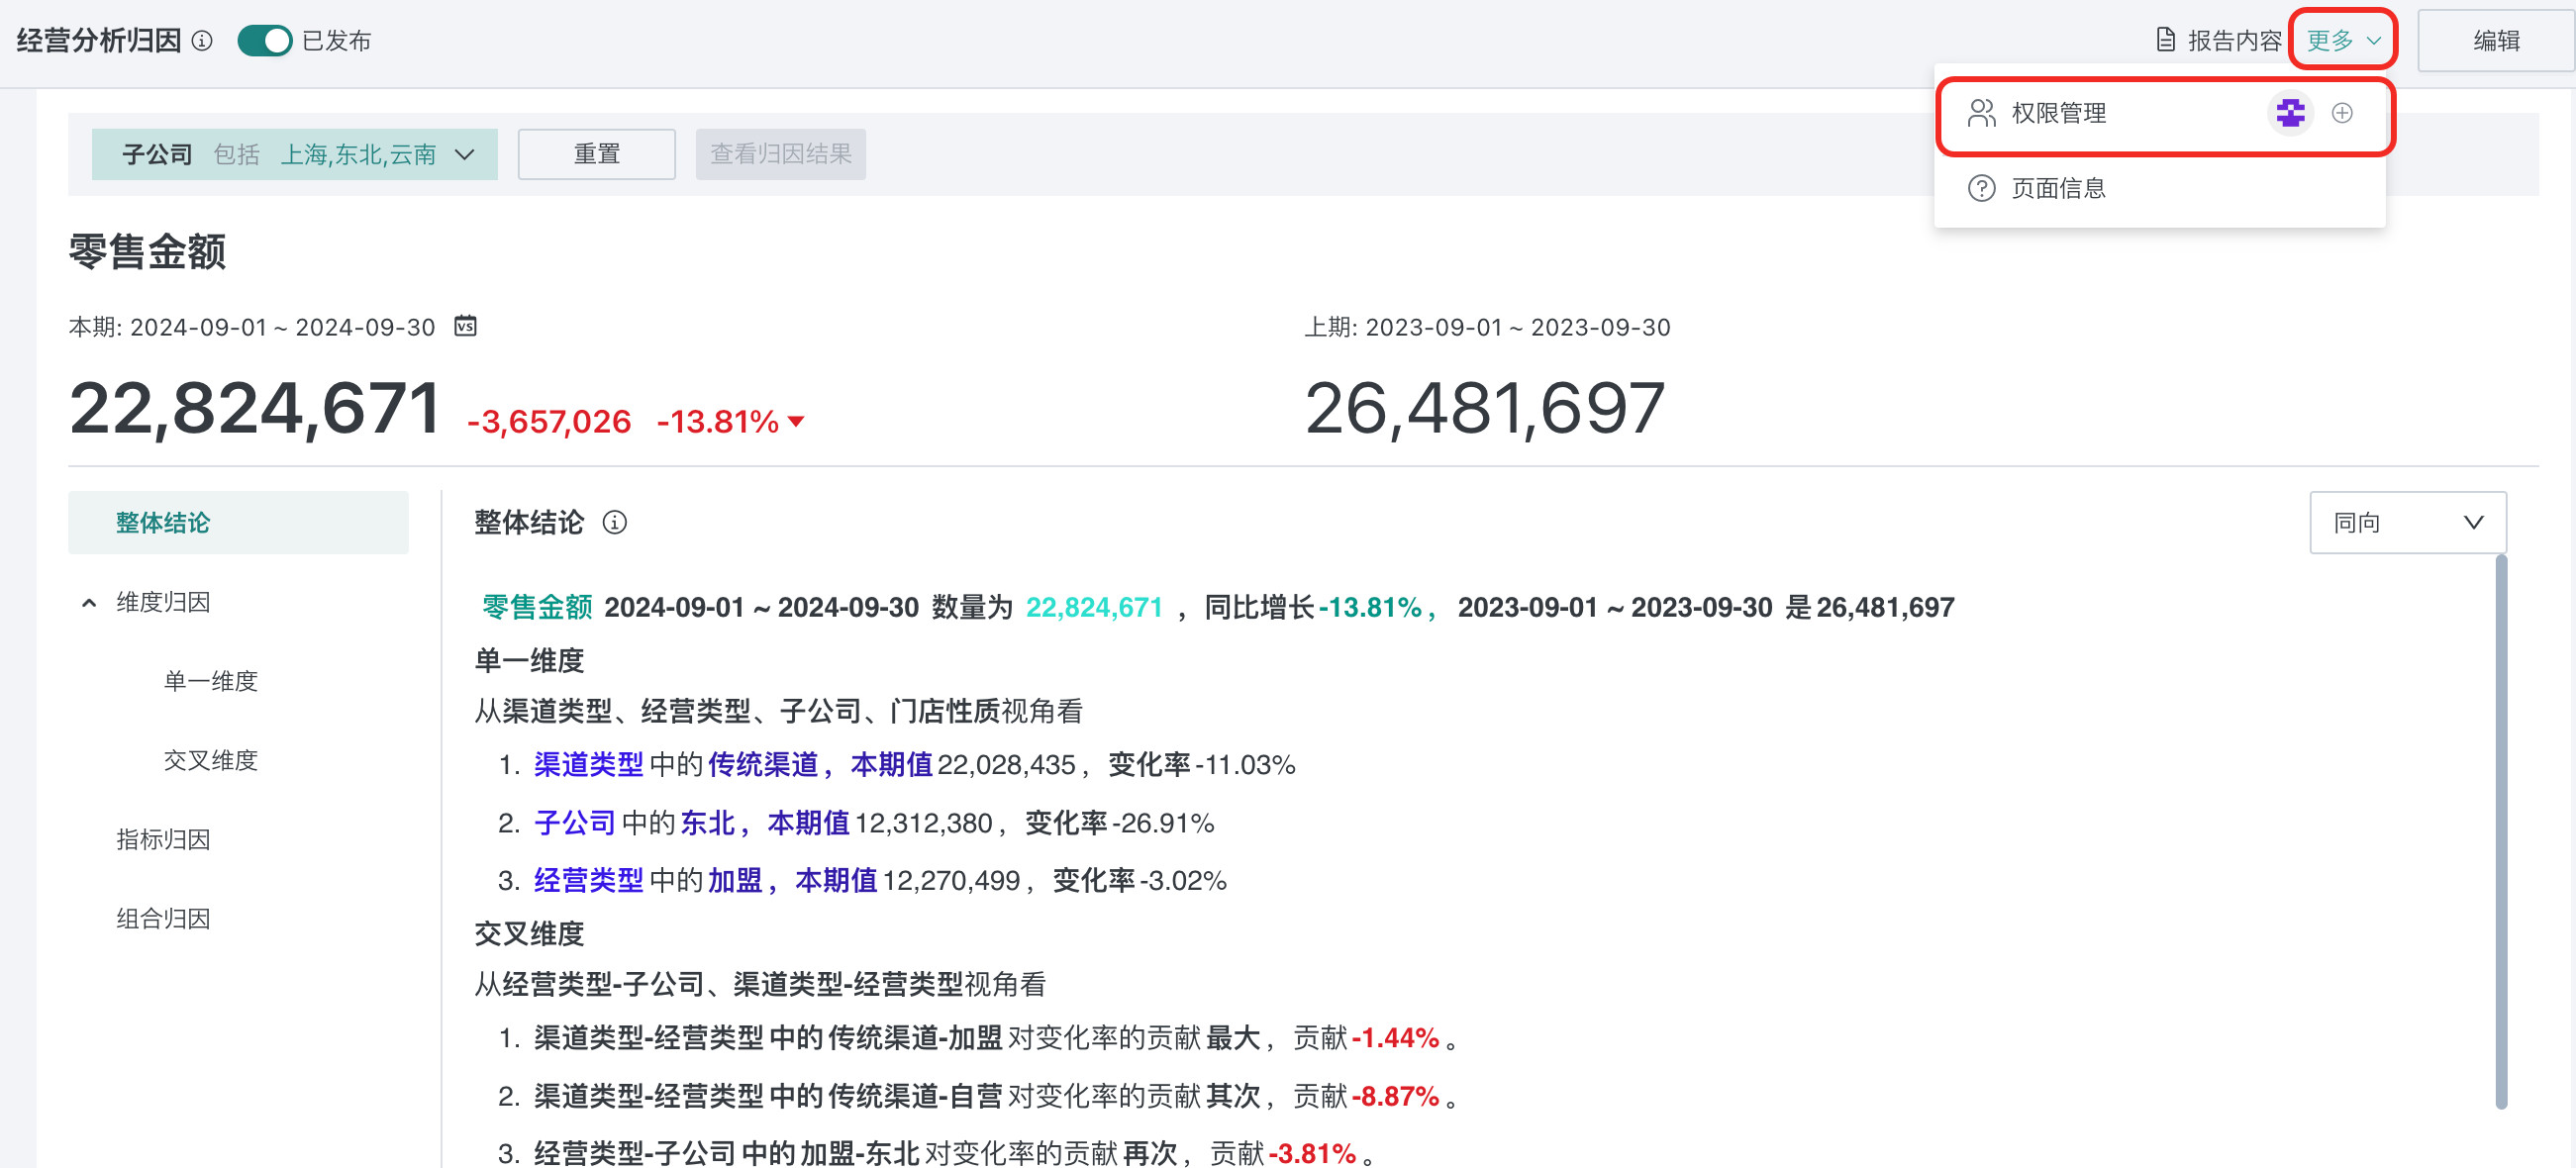
2.5. Configure Permissions
Click "More > Permission Management" to configure permissions for the intelligent attribution page. For permission-related descriptions, see Permission Management (Intelligent attribution pages currently do not support copy permission function).
3. Limitations and Notes
- Dimension attribution contribution details: Only displays TOP dimension value data, currently displays TOP10 for same-direction and reverse-direction respectively.
- Combination attribution contribution details: Displays up to 1000 TOP dimension value data, currently displays TOP10 for same-direction and reverse-direction respectively.
Appendix: Concept Explanation
- Attribution indicator: The target indicator for attribution, for example, based on the purpose of "why is this year's retail total 5% lower than last year", "retail total" is the attribution indicator.
- Attribution dataset: Core business dataset, dataset generated according to actual business occurrence.
- Indicator attribution: Based on target data for indicator breakdown, requires detailed target data of indicators to exist in the target dataset.
- Dimension attribution: Based on target data for dimension breakdown, only supports dimensions that exist simultaneously in attribution data and target dataset.
- Same-direction: The attribution dimension and attribution target indicator are consistent in positive and negative directions. Example: When the indicator drops, if the attribution contribution is negative, it is same-direction.
- Reverse-direction: The attribution dimension and attribution target indicator are opposite in positive and negative directions. Example: When the indicator drops, if the attribution contribution is positive, it is reverse-direction.
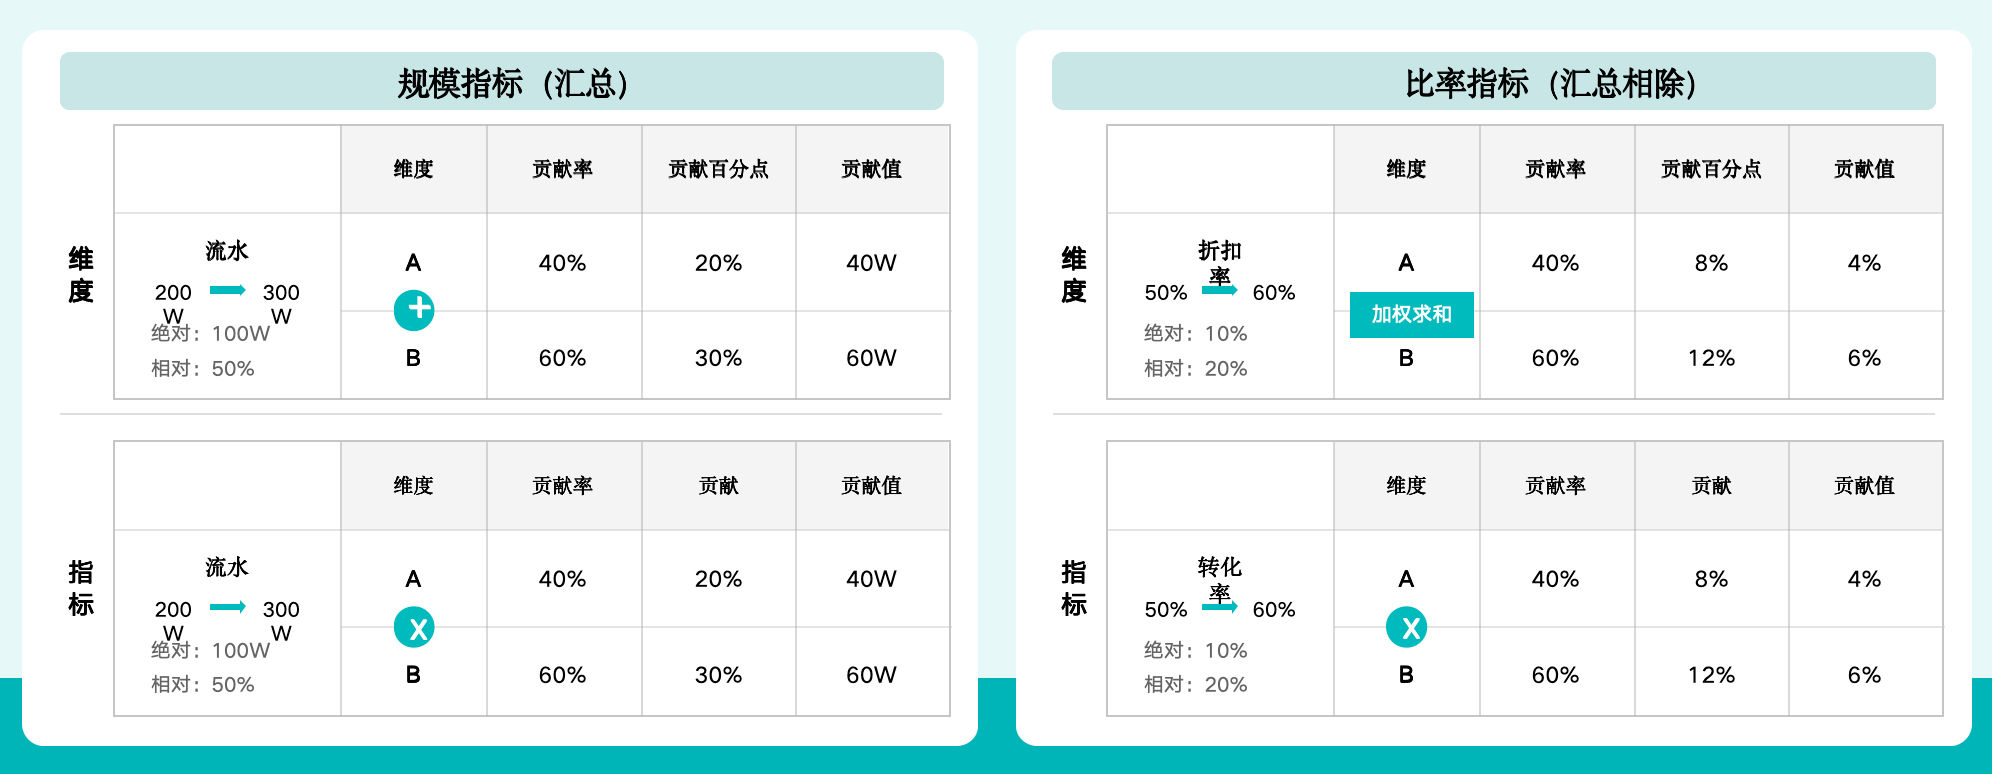
- Contribution value: Difference change impact, in absolute change values, how much absolute impact the influencing factor brings (see the diagram below for details).
- Contribution percentage points: Year-over-year change impact, in year-over-year change percentage points, how many percentage points of impact the influencing factor brings (see the diagram below for details).
- Contribution rate: Change impact proportion, the proportion of the influencing factor's contribution to the change, adding up to 100% (see the diagram below for details).
Calculation process
- First calculate the contribution value (calculation methods differ for different indicator types)
- Contribution value = Total change value * Contribution rate ———Focus on the effect brought by change values
- Contribution percentage points = Total change rate * Contribution rate———Focus on the effect brought by change rates