Chart Engine 2.0
Overview
Chart Engine 2.0 uses a new chart rendering solution. When enabled, supported charts are rendered with Chart Engine 2.0. When it is disabled, charts continue to use Drawing Engine 1.0.
Because the underlying rendering mechanism has changed, the default styles, layouts, interactions, and export results of the same data and chart configuration may differ between the two engines. Before enabling Chart Engine 2.0, verify your key dashboards and commonly used charts.
- The drawing engine controls chart rendering and display. It is different from the analytics engine used for data queries and calculations.
- Chart Engine 2.0 can be enabled in V7.2 and later. The differences described in this document apply to V8.3. Other versions may behave differently.
Enable Chart Engine 2.0
Administrators can enable Chart Engine 2.0 under Management Center > System Settings > General Settings > System Rules > Page.
Open: Pasted image 20260825101847.png
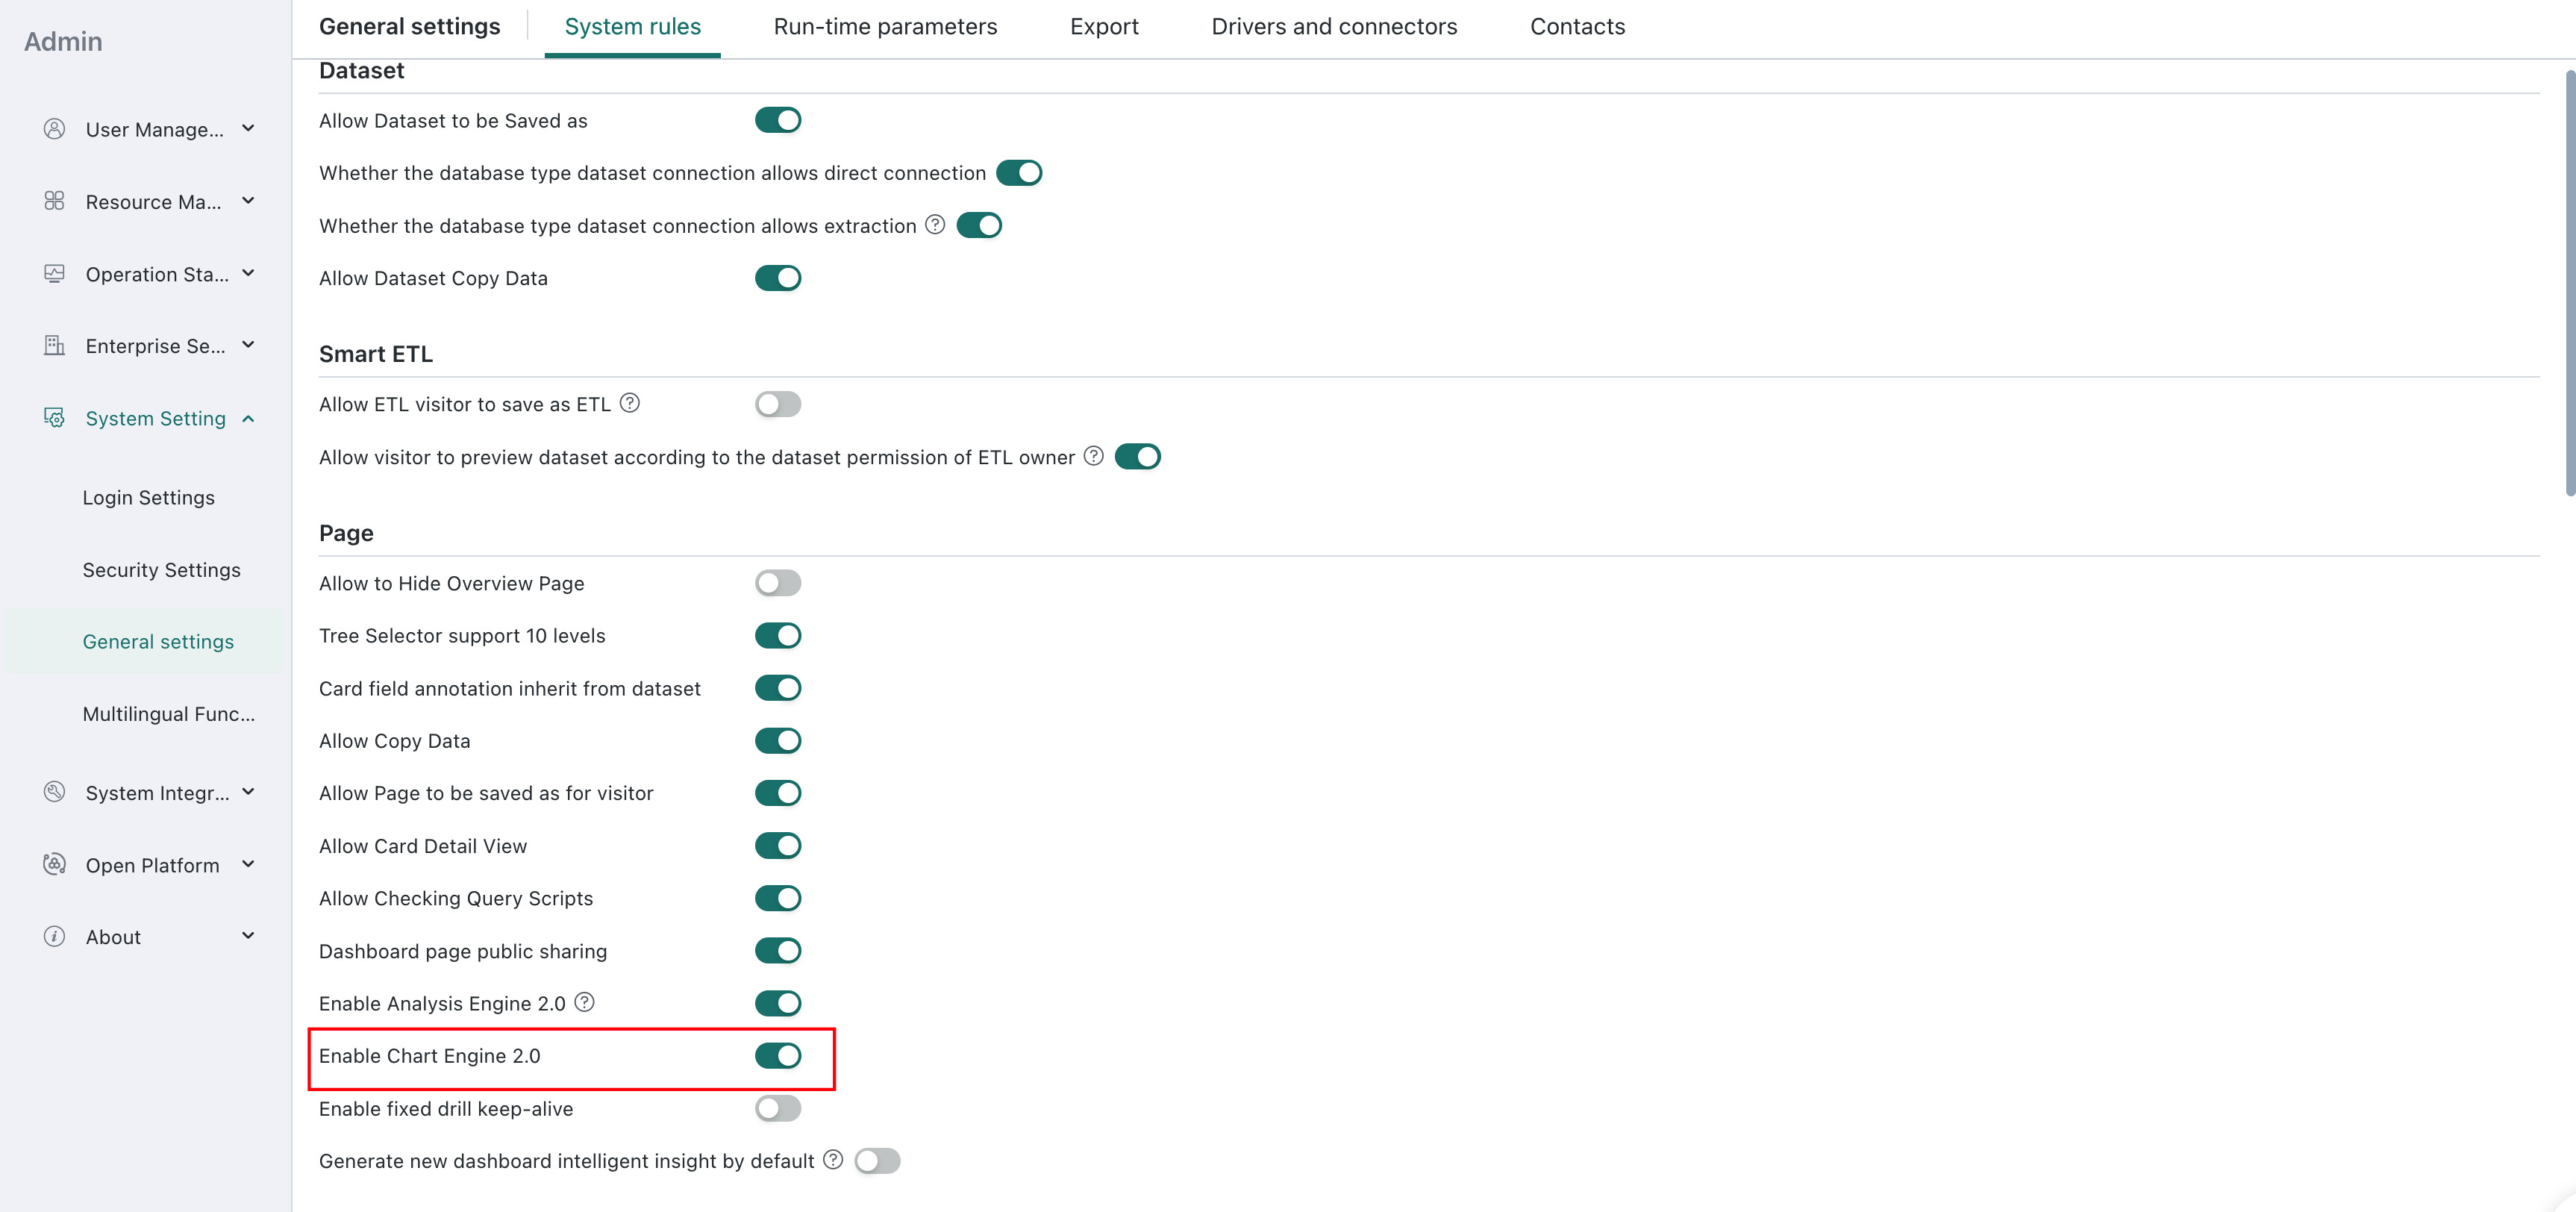
After the engine is enabled, the display and interaction behavior of existing charts may change. Verify key dashboards in a test environment first. Enable it in production only after confirming that chart display, interactions, and exports meet your expectations.
Main Differences from Drawing Engine 1.0
| Scenario | Behavior in Chart Engine 2.0 | Recommendation |
|---|---|---|
| Data step | Displays data according to the configured value instead of automatically adjusting it to the card size as Drawing Engine 1.0 does. | If the card is small or the horizontal axis contains many values, check label readability and adjust the data step or card size. |
| Horizontal-axis labels | Does not automatically tilt labels when the horizontal axis contains too much content for the available space. | Adjust the card width, label settings, or displayed data density. |
| Line colors and gradients | When numeric coloring is used in a combo chart or stacked line chart, data points can follow the color rules while the line itself may not use the same gradient. When the color field is also a horizontal- or vertical-axis field, some lines can use the gradient. | If color is used to highlight value differences, verify the actual coloring of both data points and lines. |
| Multi-dimension axes | The layout of the innermost dimension labels differs from Drawing Engine 1.0 when multiple dimension levels are displayed. | Increase the chart area or reduce the number of dimensions displayed at the same time. |
| Tooltips | The tooltip style is slightly different from Drawing Engine 1.0. | Verify that all required fields and values are shown in tooltips. |
| Treemap | Labels that exceed their area are truncated. In Drawing Engine 1.0, labels may overflow the chart area. | Shorten labels or adjust the chart size. |
| Circular progress chart | The gradient implementation differs, so its direction and visual transition may change without affecting the progress value. | Check the color direction and transition when using gradients. |
| Progress chart | Uses a more fixed default height. Drawing Engine 1.0 can calculate chart height automatically based on content. | If there are many items or the card is small, check row heights and label display. |
| Box plot | Uses the classic style and does not provide some double-fill or double-fill-with-median-line combinations available in Drawing Engine 1.0. | If existing box plots use these styles, verify their appearance after switching. |
Scenarios to Verify Before Switching
The following behavior depends on the product version, chart type, and configuration. Verify it against your actual use cases before enabling Chart Engine 2.0.
Chart Interactions
- In some stacked charts, viewing the data for a single point with a keyboard shortcut may require holding
Ctrlbefore moving the pointer into the data area. - Hovering over a bar may display related labels from the current group at the same time.
- When stacked-chart legend items are hidden or shown, the total may not change dynamically with the currently visible series.
- After drilling down in a sunburst chart, the center text may shift in some scenarios.
Labels, Axes, and Layout
- The layout of reference-line titles, axis ticks, and hover prompts may differ from Drawing Engine 1.0.
- The default proportion occupied by a pie chart may differ from Drawing Engine 1.0.
- Automatic pie-chart legend alignment may differ in some layouts.
- With some color schemes, treemap label colors and text contrast may differ from Drawing Engine 1.0.
Colors and Legends
- When a numeric field is used for color and custom thresholds are configured, the color legend information may differ from Drawing Engine 1.0.
- When a pie chart is exported as an image after interaction, the selected legend state and linked state may be retained differently.
Switching Recommendations
Before enabling Chart Engine 2.0:
- Select key dashboards that contain commonly used chart types and complex configurations.
- Compare chart labels, axes, legends, colors, tooltips, and layouts.
- Verify common interactions such as selecting legend items, hovering, and drilling down.
- Check image, PDF, and other export results for charts and dashboards.
- Adjust chart sizes, label density, colors, and styles based on the verification results.