Display Dataset Dates in Complex Reports
Scenario 1: Combine Title Text and Latest Date Data in the Same Cell

Implementation Steps
1. Prepare Data
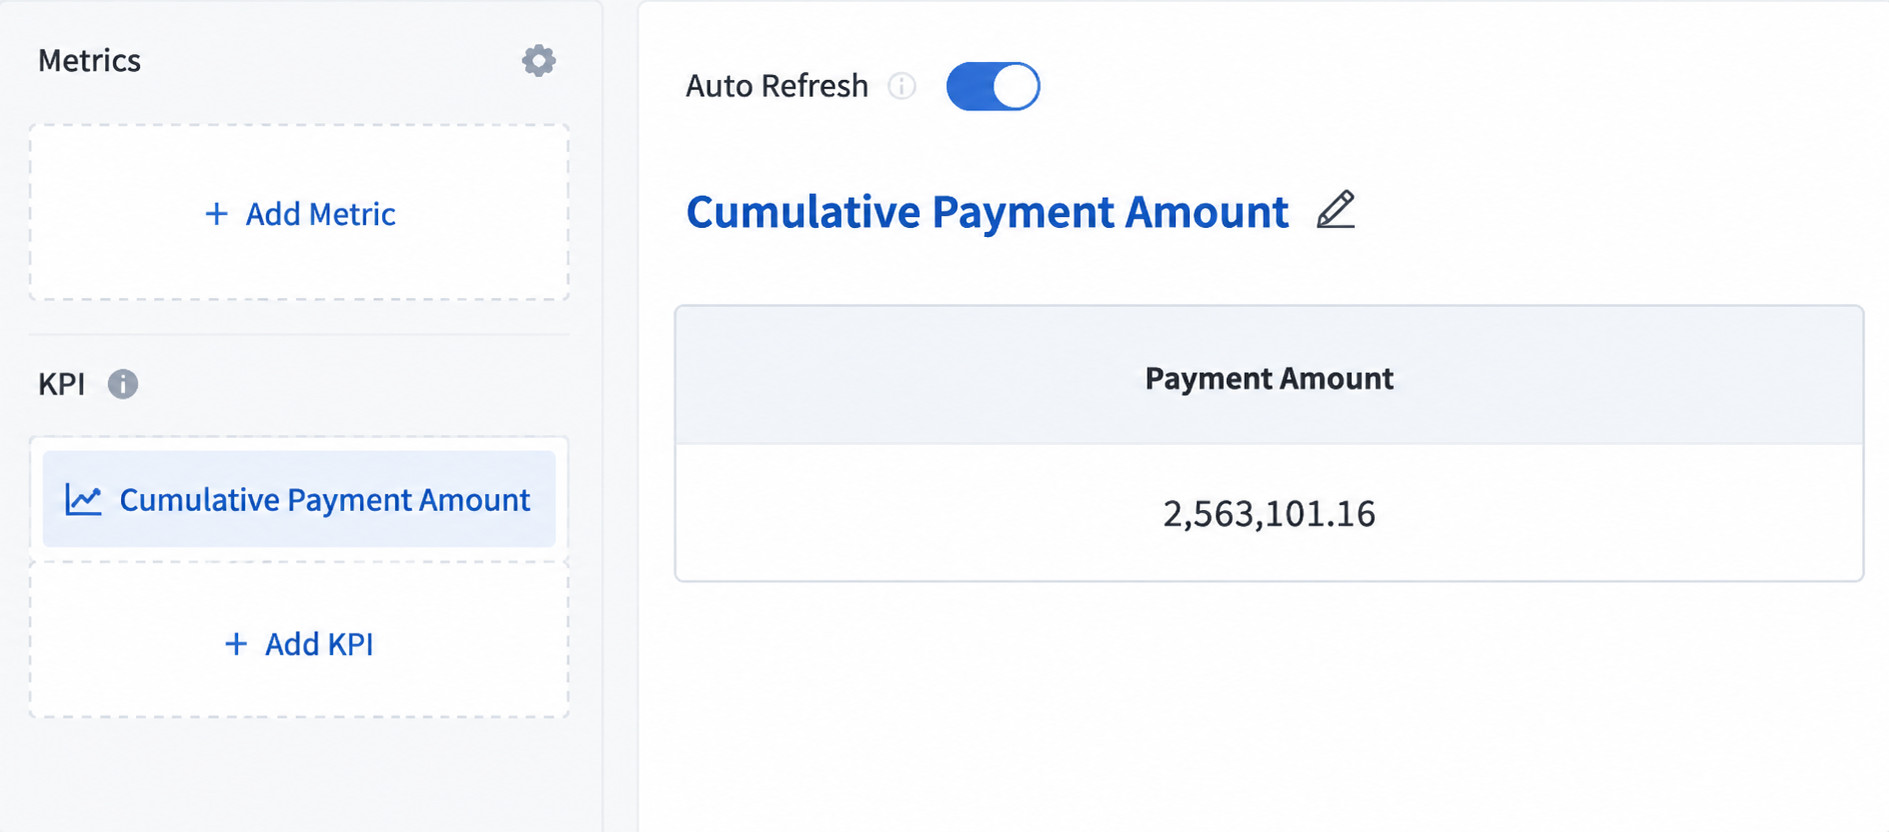
In the view, drag the date field to be displayed into the measure area, set the aggregation method to "Maximum", and obtain the latest data date in the dataset. Note that there should be only one row of data at this point.
2. Edit the Template
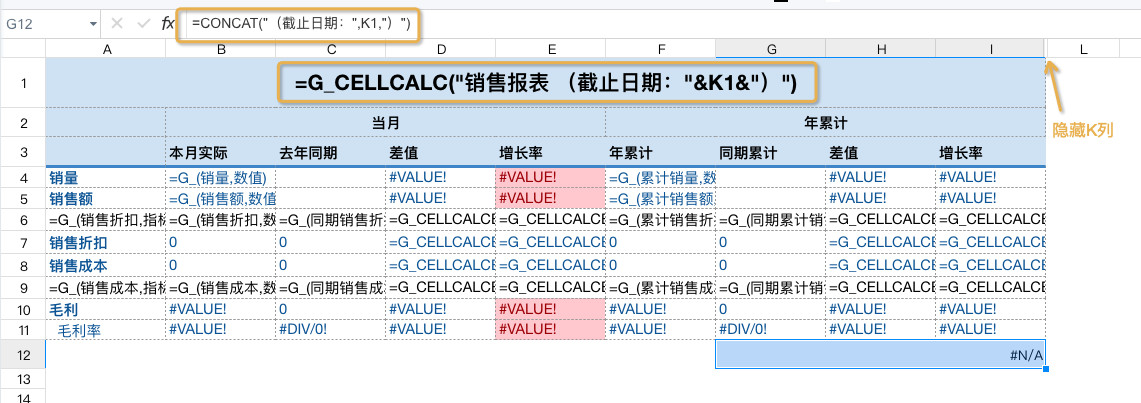
After the main structure of the template is confirmed and completed, drag the date field to be referenced into an empty cell in a blank column (K1). Then, in the merged cell where it needs to be displayed, use Excel's concatenation function (CONCAT or &) or the complex report function G_CELLCALC to reference the cell K1 where the date is located. Then hide the row or column where the date cell is located (column K in the figure).
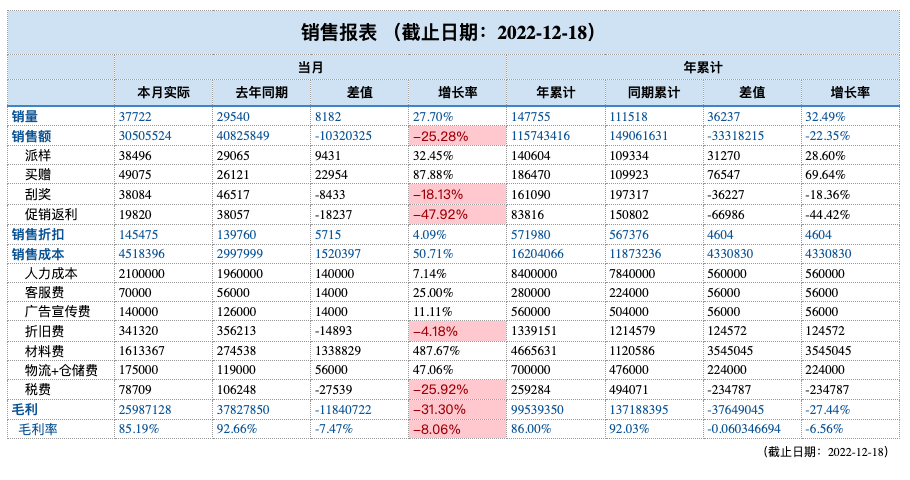
Final Effect:
Scenario 2: Title Text + Display the Filtered Date Range
Implementation Steps
1. Prepare Data
In a new view, filter the date range and drag the date field twice into the measure area. Set the aggregation methods to "Minimum" and "Maximum" respectively to obtain the start date and end date of the filtered date range. Note that there should be only one row of data at this point.

2. Edit the Template
Go to the template editing page. If the target area has enough cells, you can directly drag the two dates into the target cells and configure the format. You can also concatenate the two dates as in scenario 1.
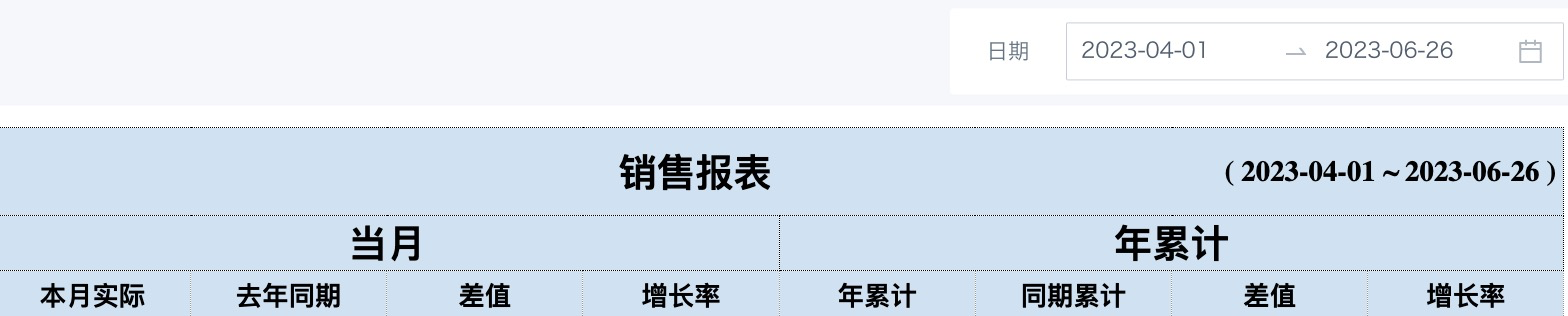
Effect of directly dragging date fields:

Concatenation effect (reference formula: ="( "&L1&" ~ "&M1&" )" )

3. Filter Association
Return to the page, configure the date range filter, and link it to multiple views in the complex report. The final effect is shown below.
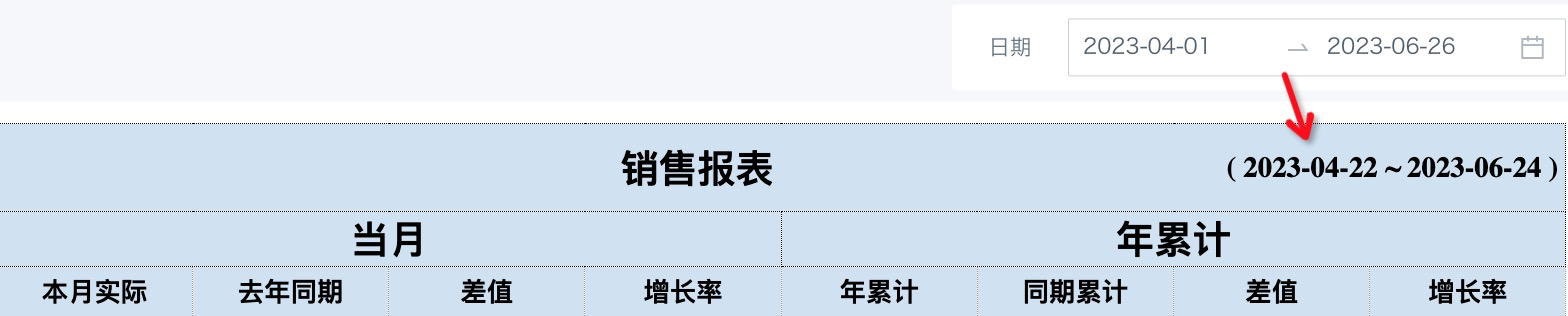
Note:
The minimum and maximum dates displayed in the card come from the dataset and do not represent the dates displayed by the filter. If the dataset does not have data every day (dates are not continuous), the date range displayed this way may be inconsistent with the start and end dates of the page filter. To display them consistently, use date-type global parameters.
Global Parameter Implementation Method
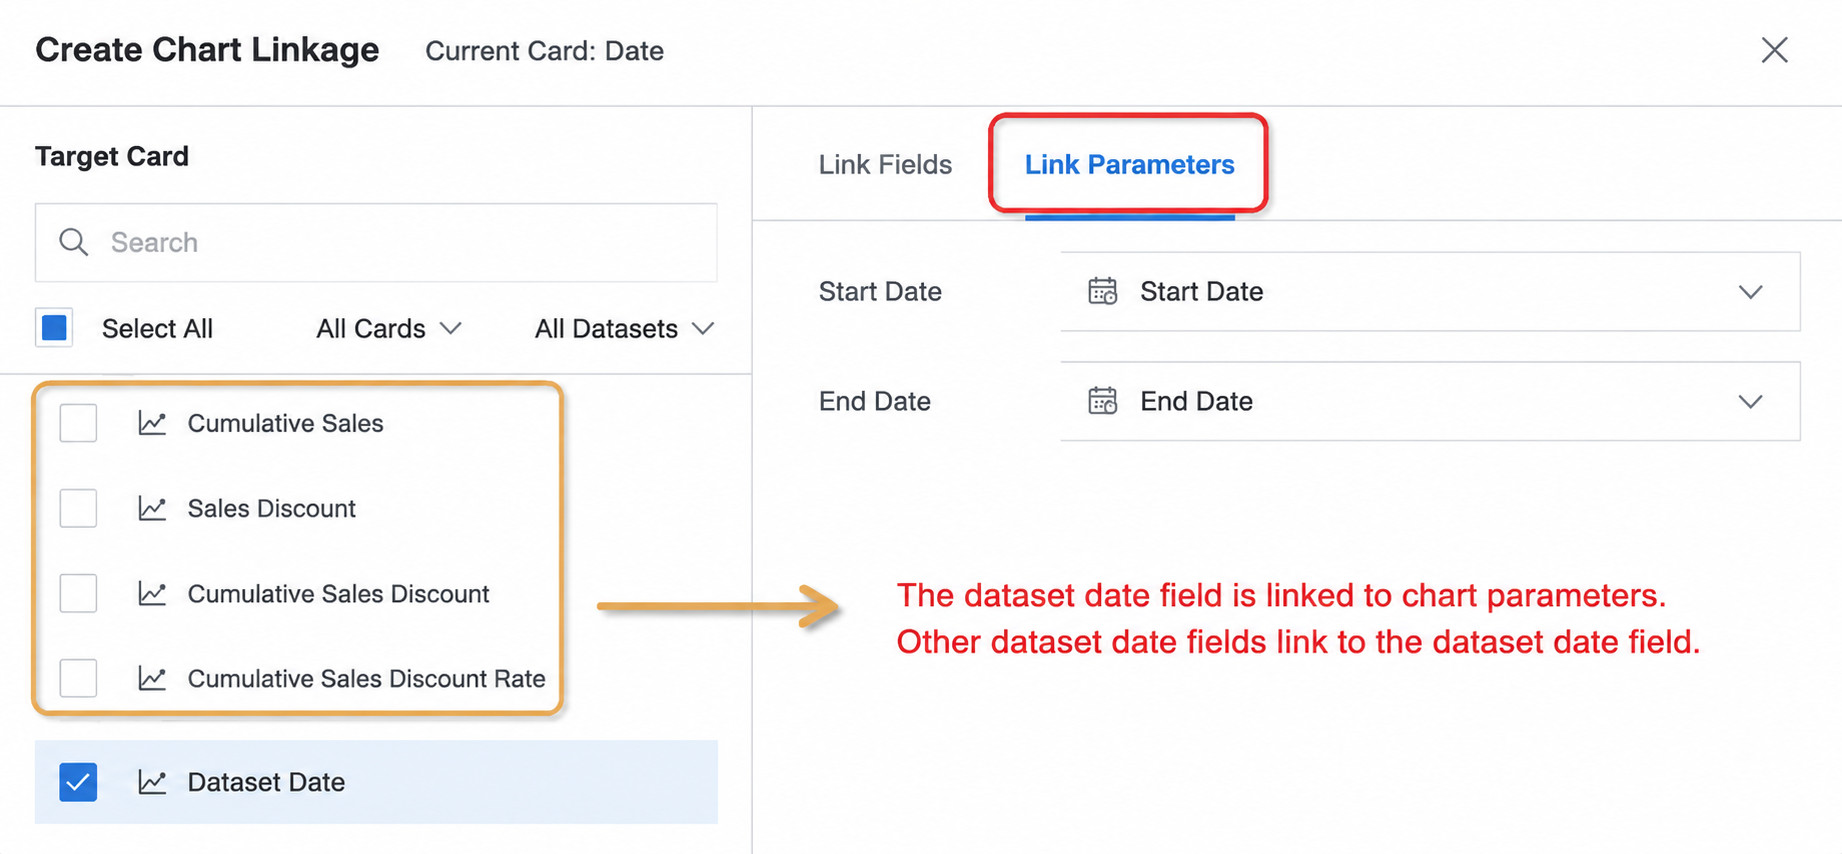
A. During view preparation, create calculated fields "Start Date" and "End Date", reference two date-type global parameters, and drag them into the dimension area or measure area. Create a Boolean field "Date Filter" and place it in the filter area.

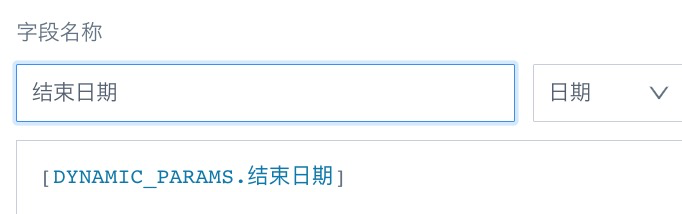
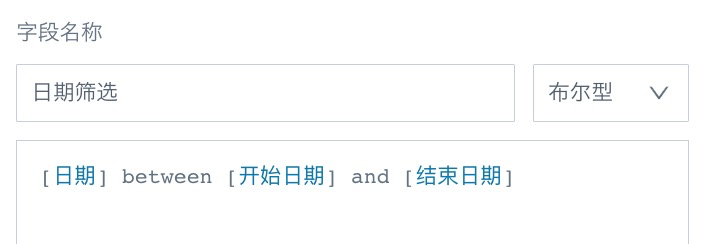
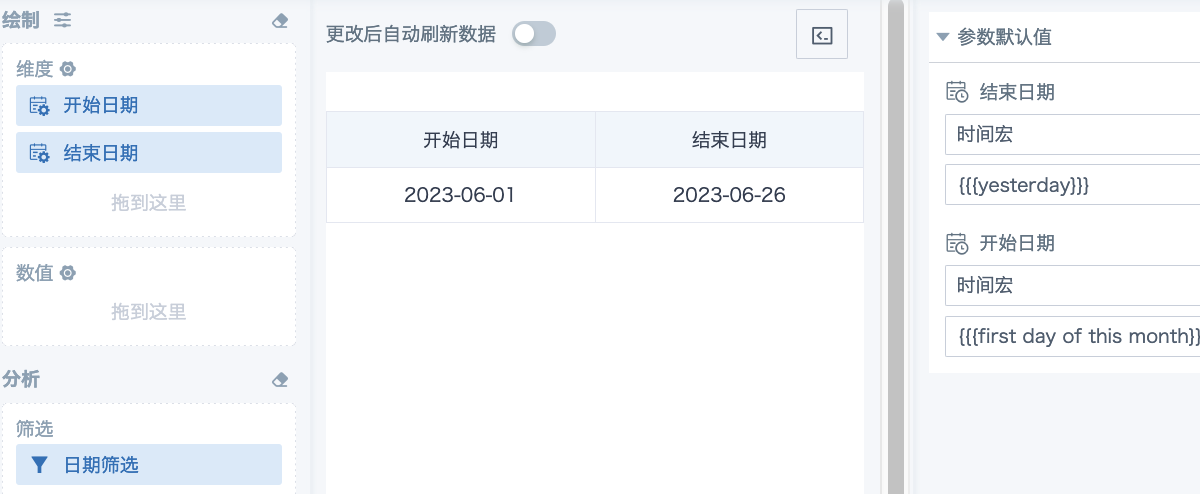
B. After template editing is complete, return to the page and configure date filter linkage. With multiple views, views that use global parameters need linked parameters; for views that do not use parameters, link the date field in the associated dataset.
At this point, the page effect is as follows: