Accumulated
Overview
Use Cases
By accumulating a series of values day by day, month by month, or according to another basis, you can observe the overall result or trend. This can be used to represent growth or accumulation and to show how an indicator changes over time.
For example, in a business scenario, you can use cumulative monthly sales to track progress toward an annual sales target in real time.
Feature Overview
In the navigation bar, select Data Analysis > Metric Card and enter the card editing page. Drag the target measure field into the Charting area on the left, click the field, and choose Advanced Calculation > Accumulated from the drop-down menu.
- Supports Accumulated based on date-type fields. In this case, the dimension area must contain a date field. Depending on the date granularity, weekly, monthly, quarterly, current-year, and all-years Accumulateds are supported.
- Supports Accumulated based on text-type fields. In this case, both global row-by-row accumulation and grouped accumulation by a specified dimension are supported.
Steps
Accumulated by Date Field
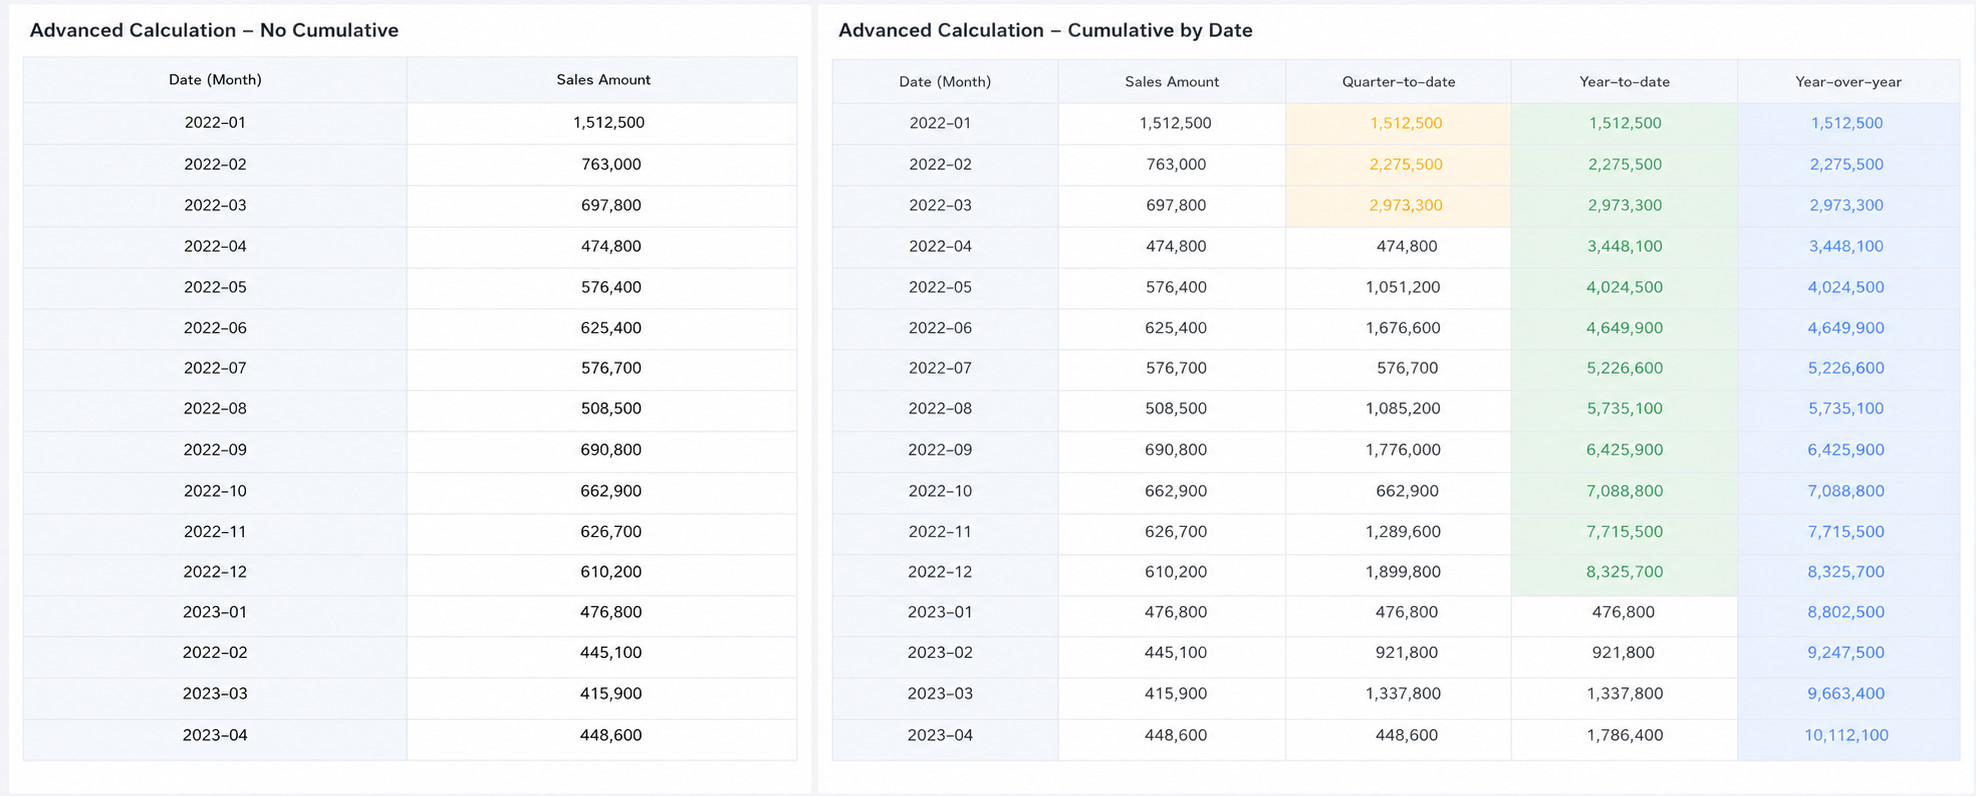
Using a month-granularity date field as an example, you can configure Quarterly Cumulative, Current-Year Cumulative, and All-Years Cumulative.
- Quarterly Cumulative: Starts on the first day of each quarter and accumulates to the current date, then resets for the next quarter.
- Current-Year Cumulative: Starts on the first day of the year and accumulates to the current date, then resets the following year.
- All-Years Cumulative: Starts on the first day of the first year in the historical dataset and keeps accumulating chronologically across all years.
The example below creates a cumulative sales table to calculate quarterly cumulative sales, current-year cumulative sales, and all-years cumulative sales, as shown on the right side of the figure. Example dataset: Product Practice Dataset.xlsx.
-
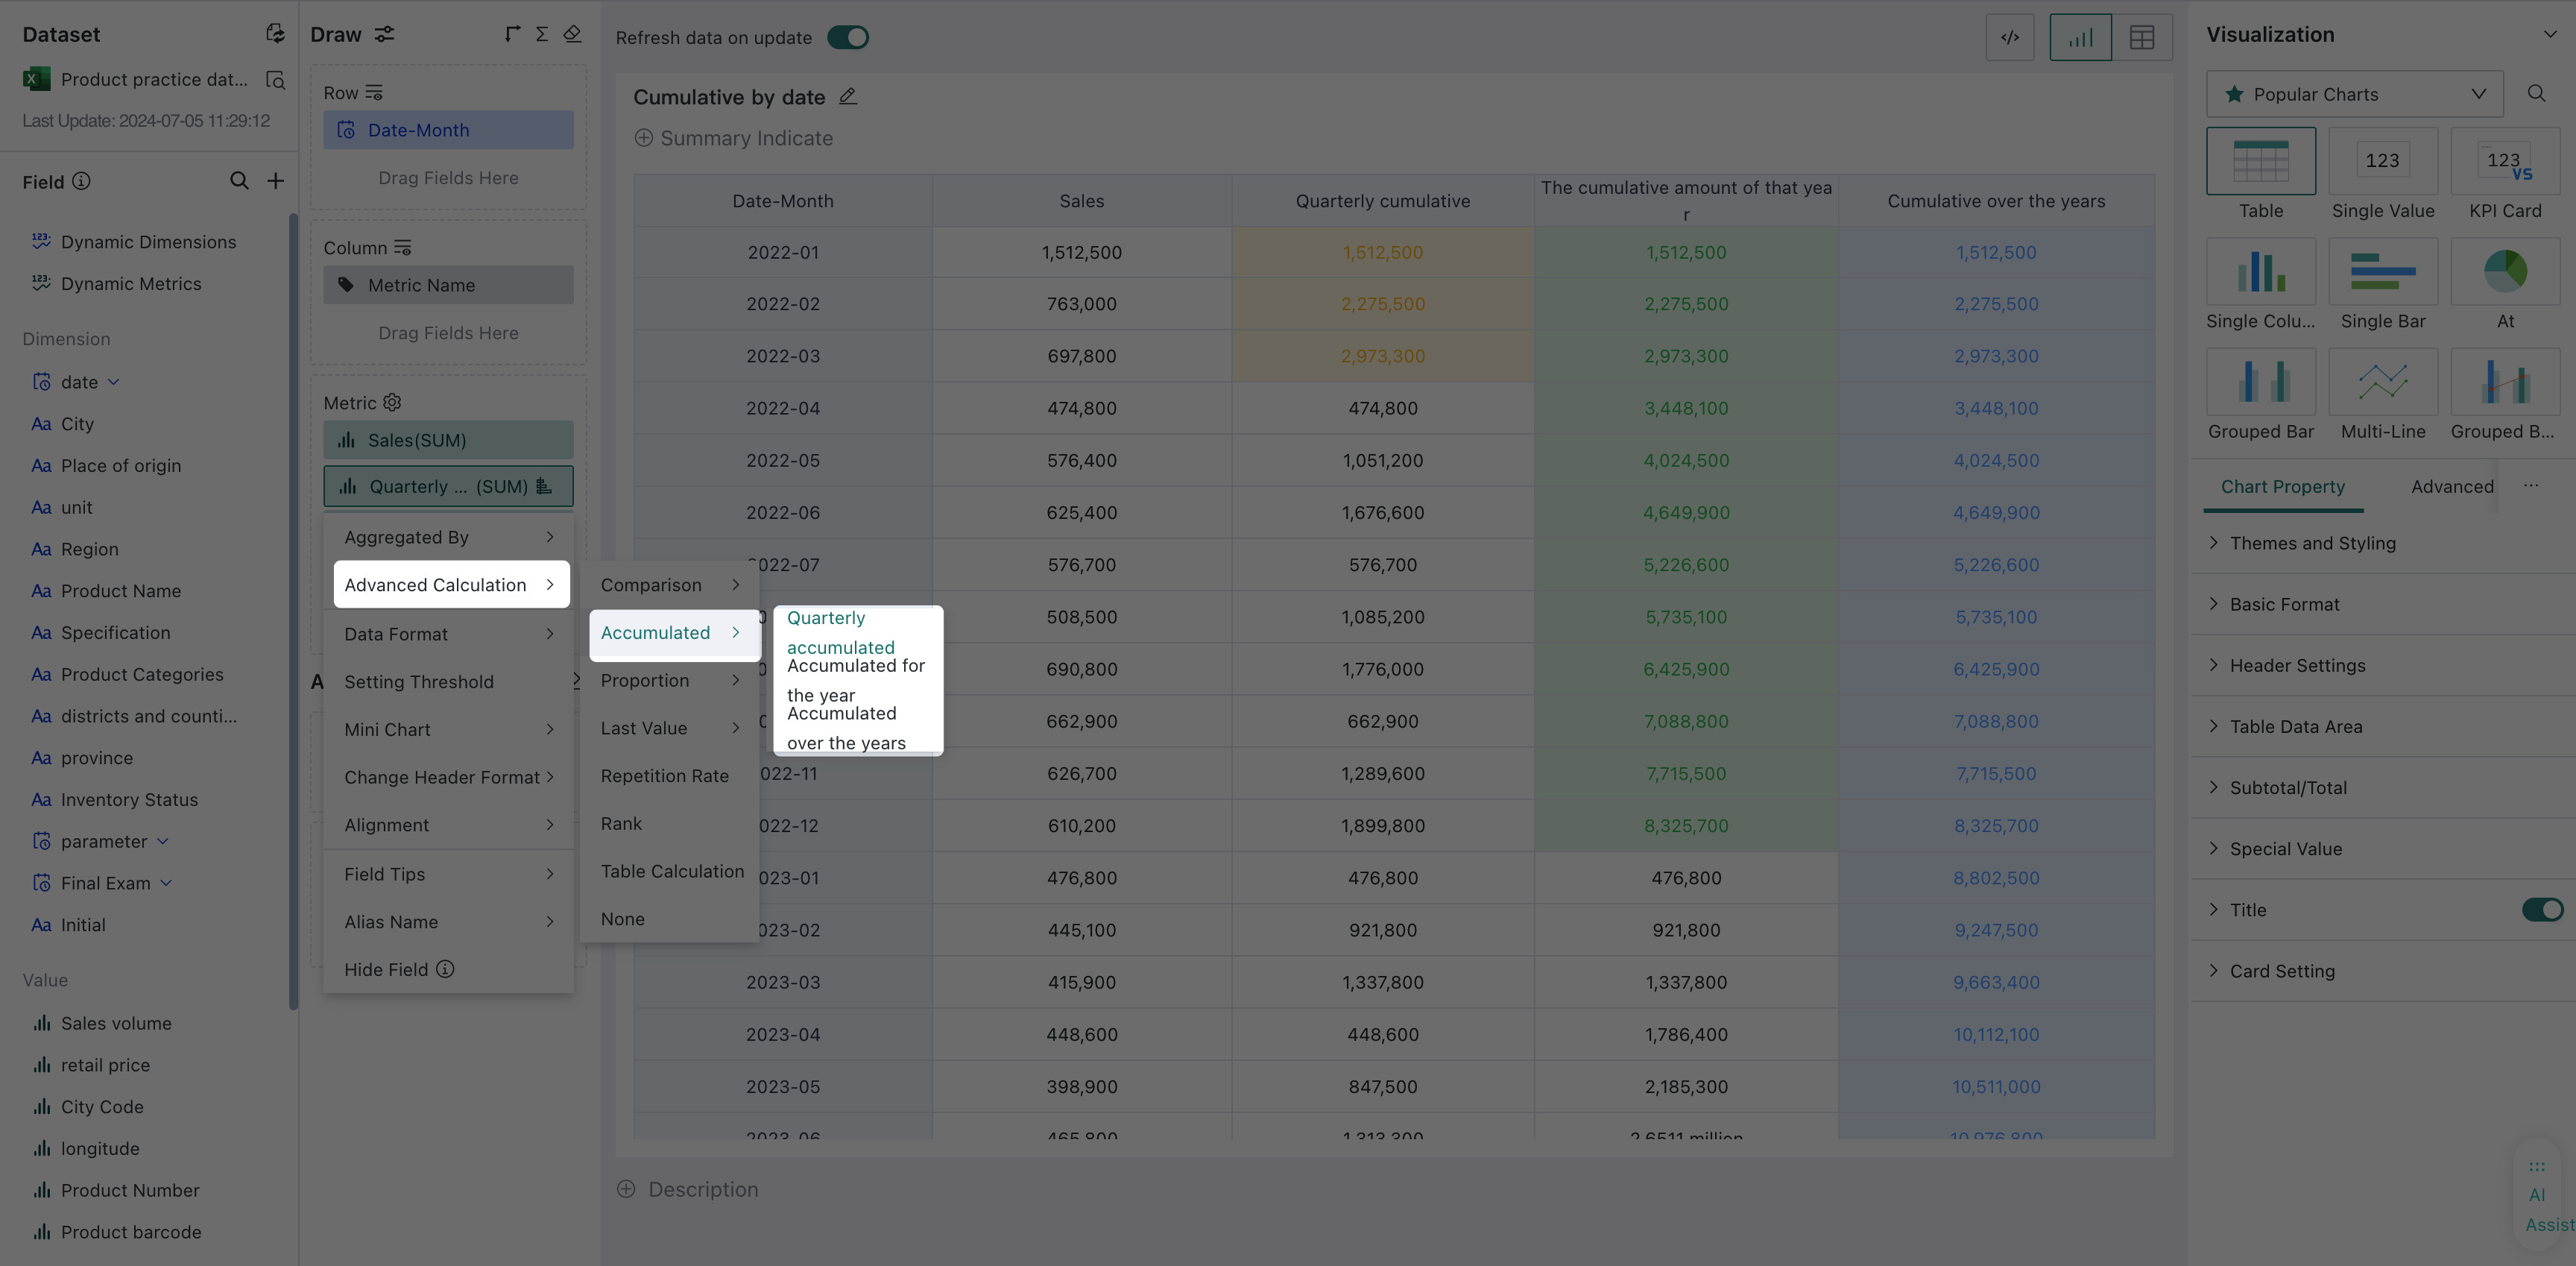
In the Charting area, drag Date (Month) into Dimensions and drag Sales Amount into Measures. For easier comparison in this example, drag Sales Amount into Measures three times and rename them Quarterly Cumulative, Current-Year Cumulative, and All-Years Cumulative.
-
Configure Accumulated: click the Quarterly Cumulative field, choose Advanced Calculation > Accumulated from the drop-down menu, and set the cumulative scope to Quarterly Cumulative. Configure Current-Year Cumulative and All-Years Cumulative in the same way.
-
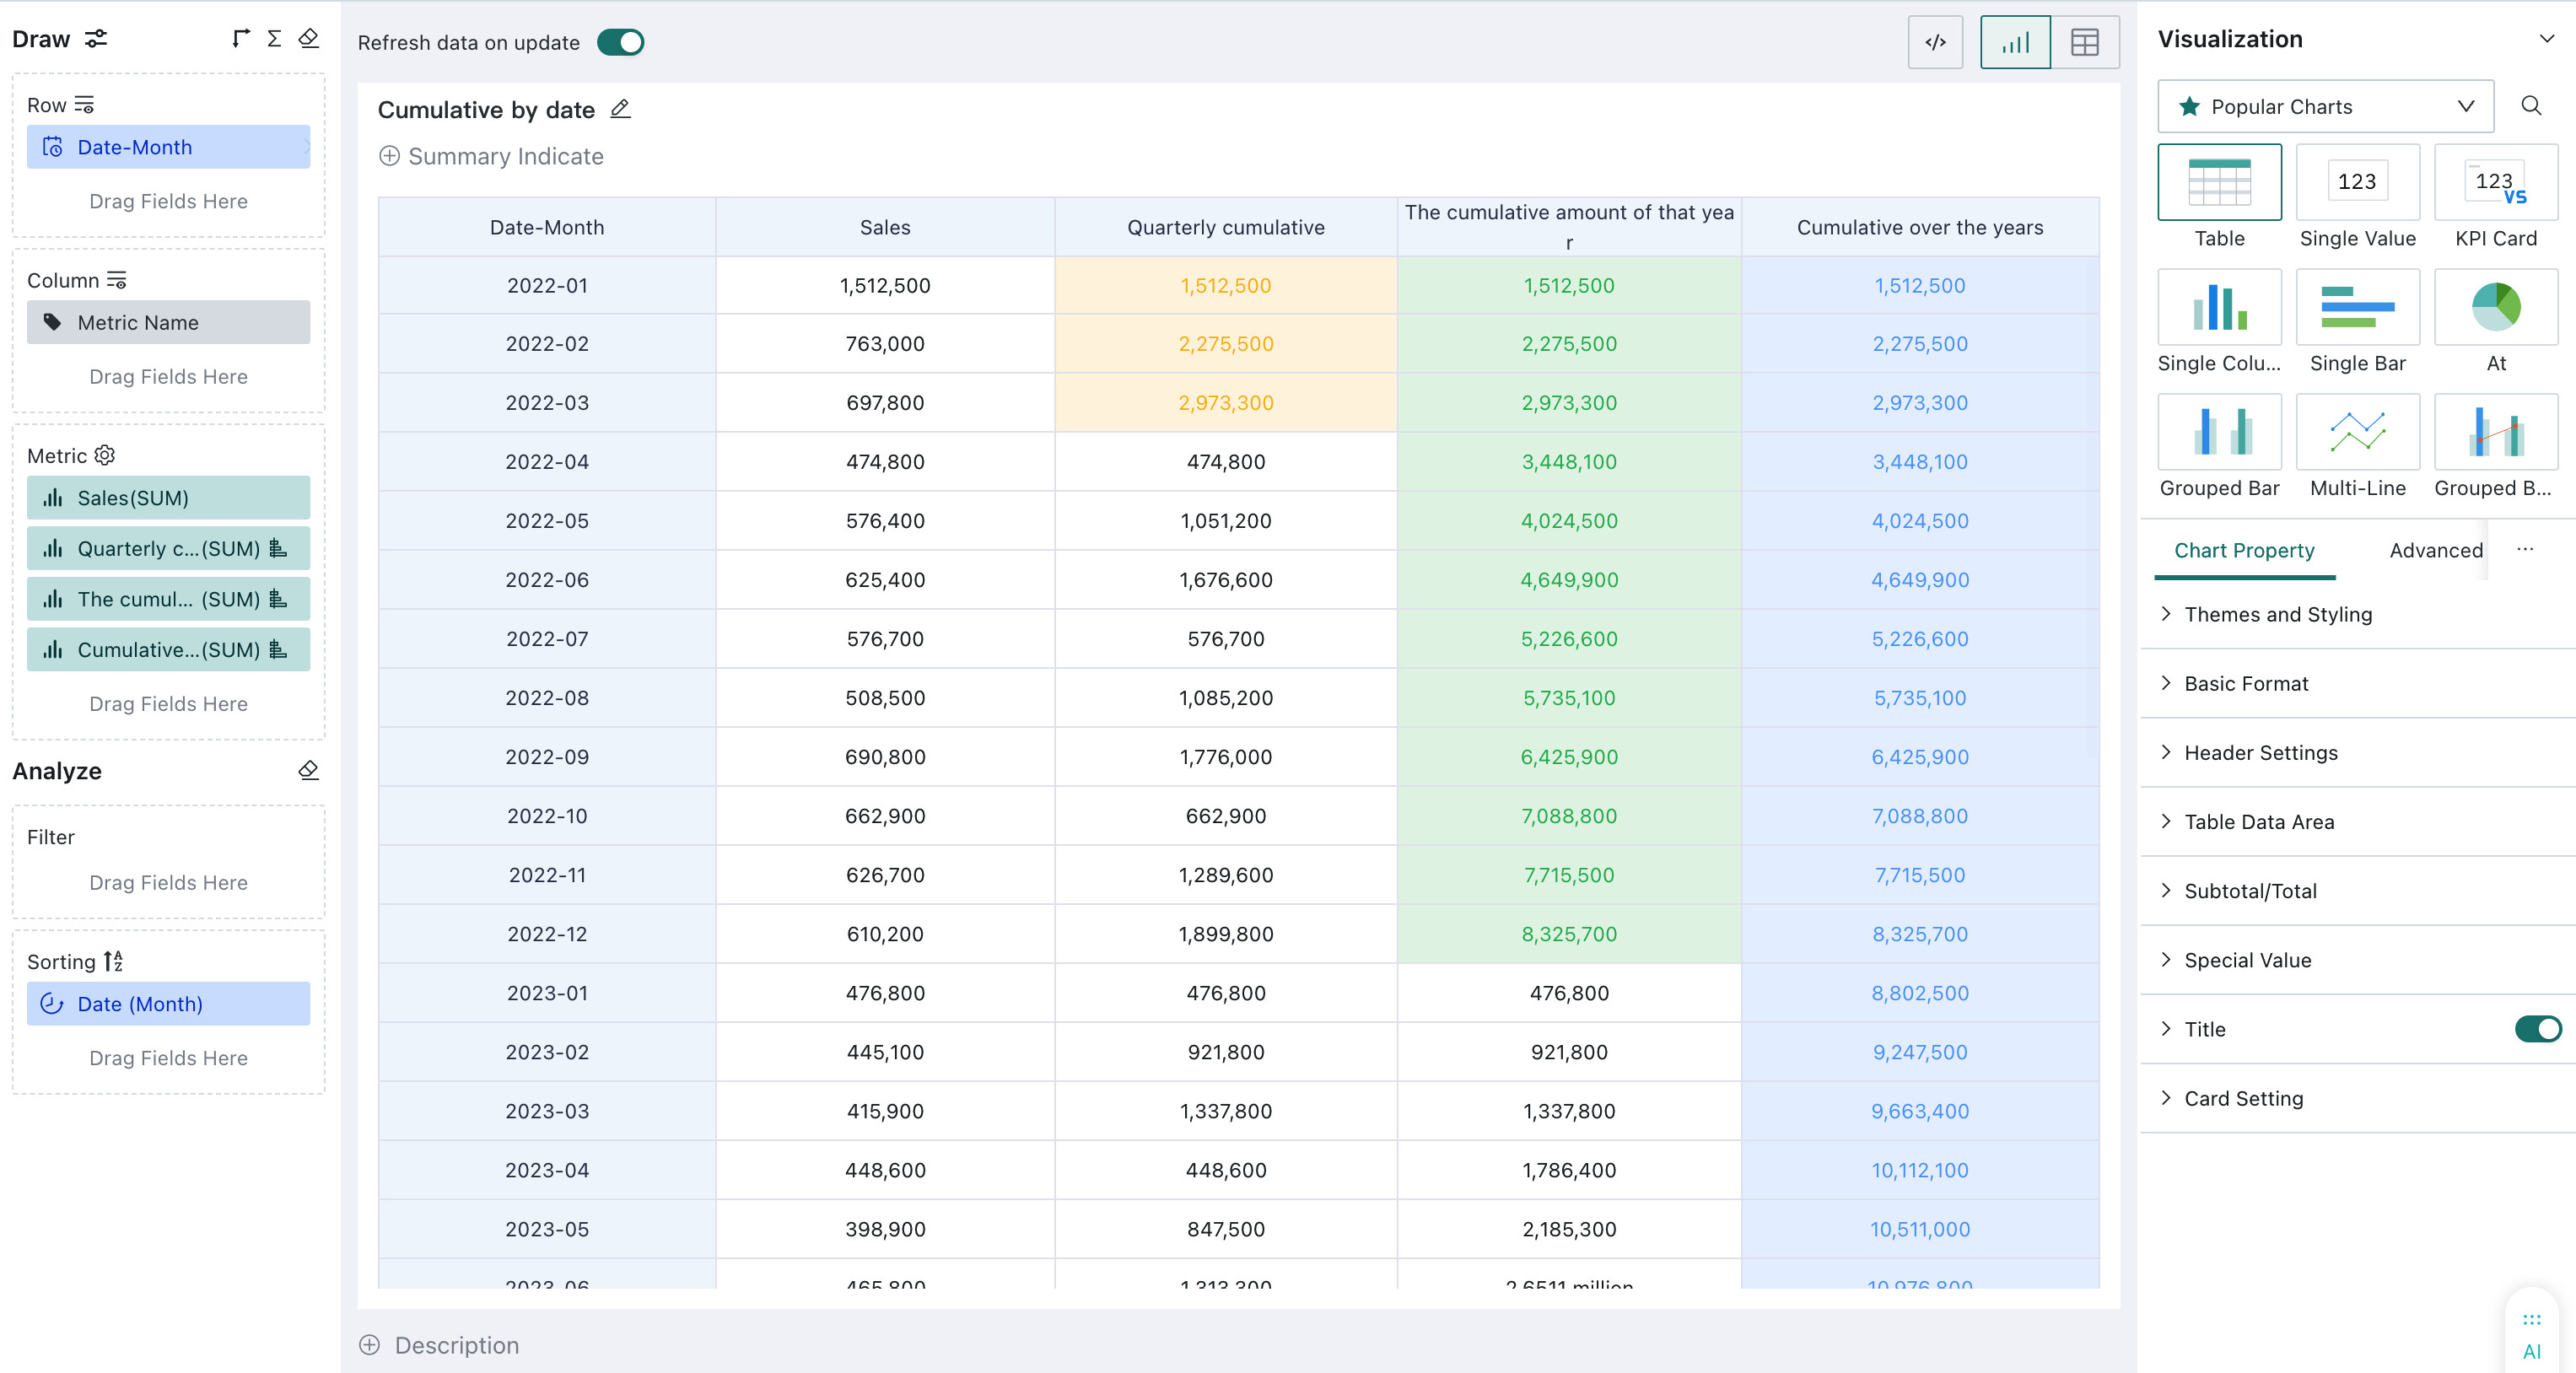
View the result of the date-based Accumulated.
Accumulated by Text Field
Global Cumulative
Global cumulative means accumulating values row by row across the entire dataset.
The example below creates a Cumulative Customer Count Table to calculate the cumulative number of customers for different membership levels and spending ranges. Example dataset: Accumulated - Spending Level.xlsx.
-
In the Charting area, drag Membership Level and Spending Range into Dimensions, and drag Customer Count into Measures. For easier display, drag Customer Count into Measures again and rename it Cumulative Customer Count (Global).
-
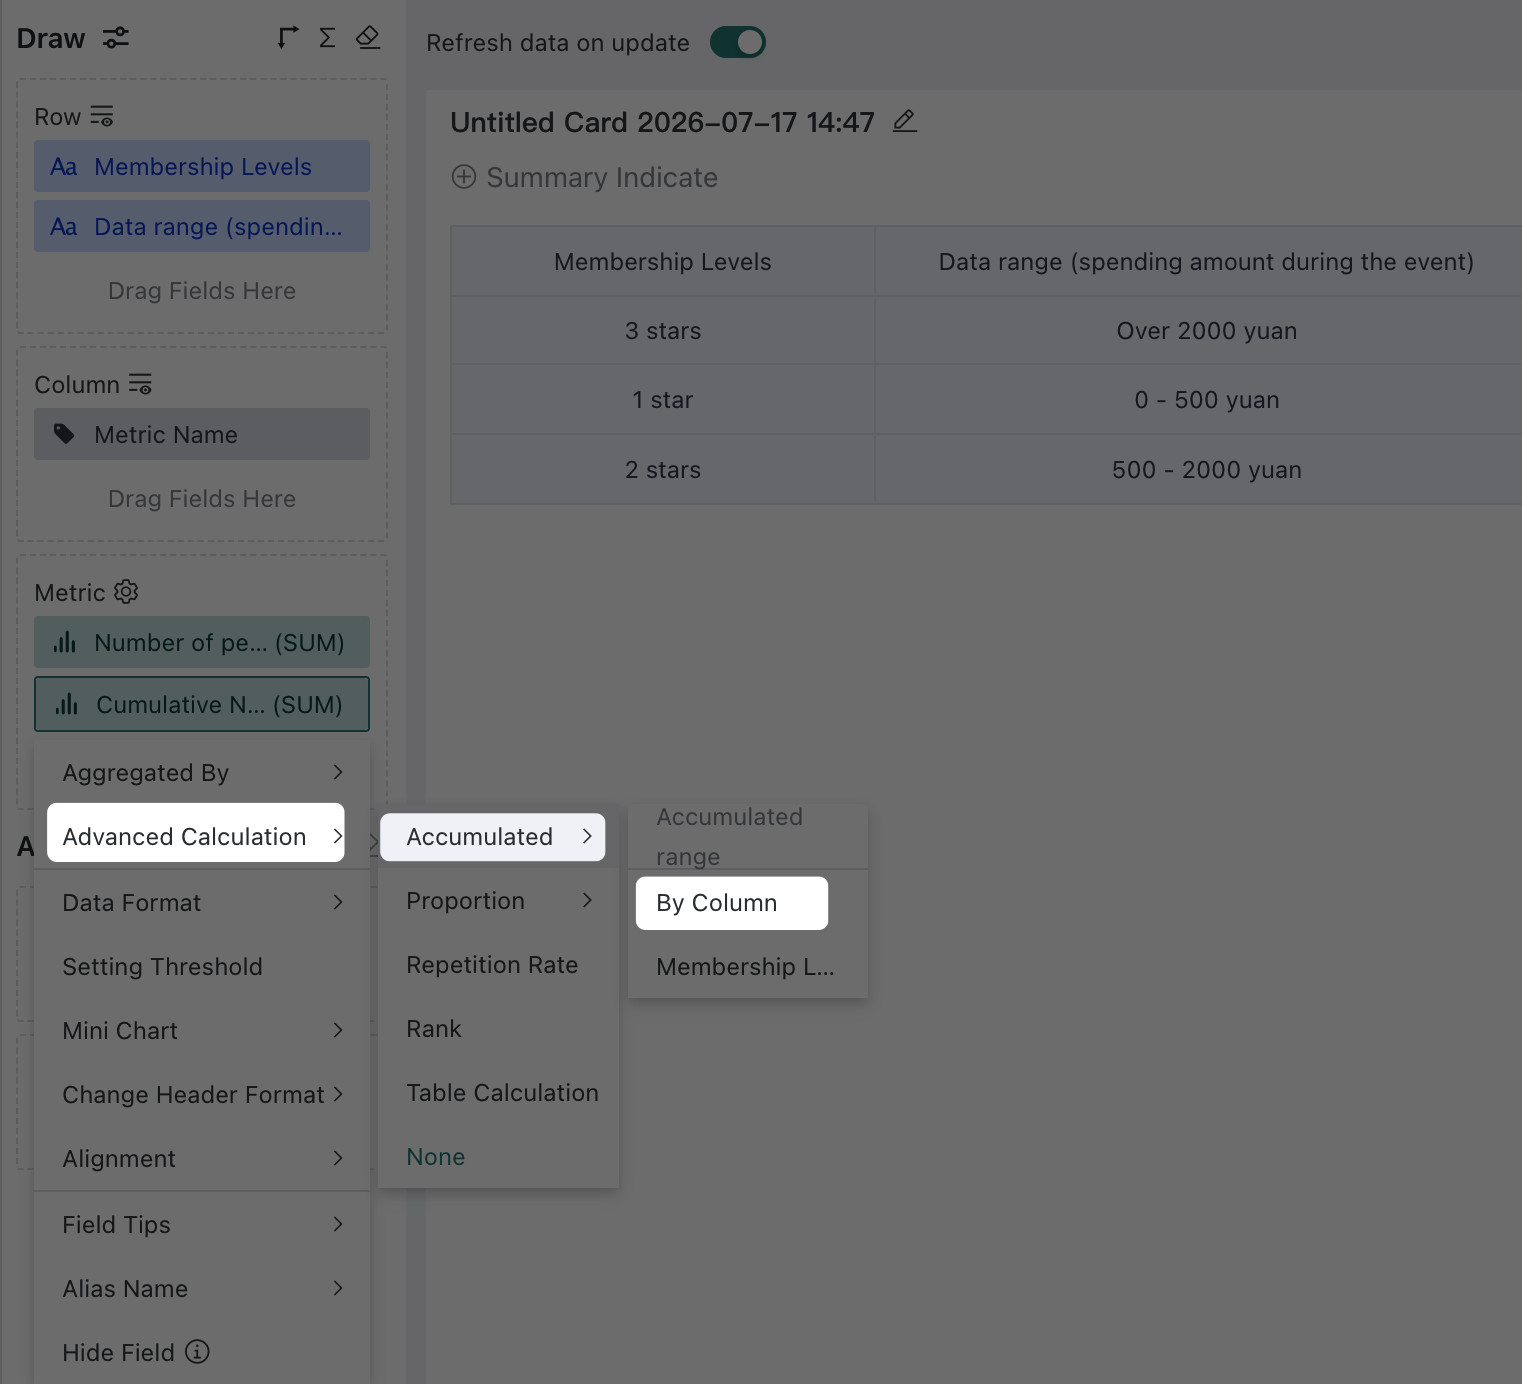
Click Cumulative Customer Count (Global), choose Advanced Calculation > Accumulated from the drop-down menu, and set the cumulative scope to By Column for this example.
-
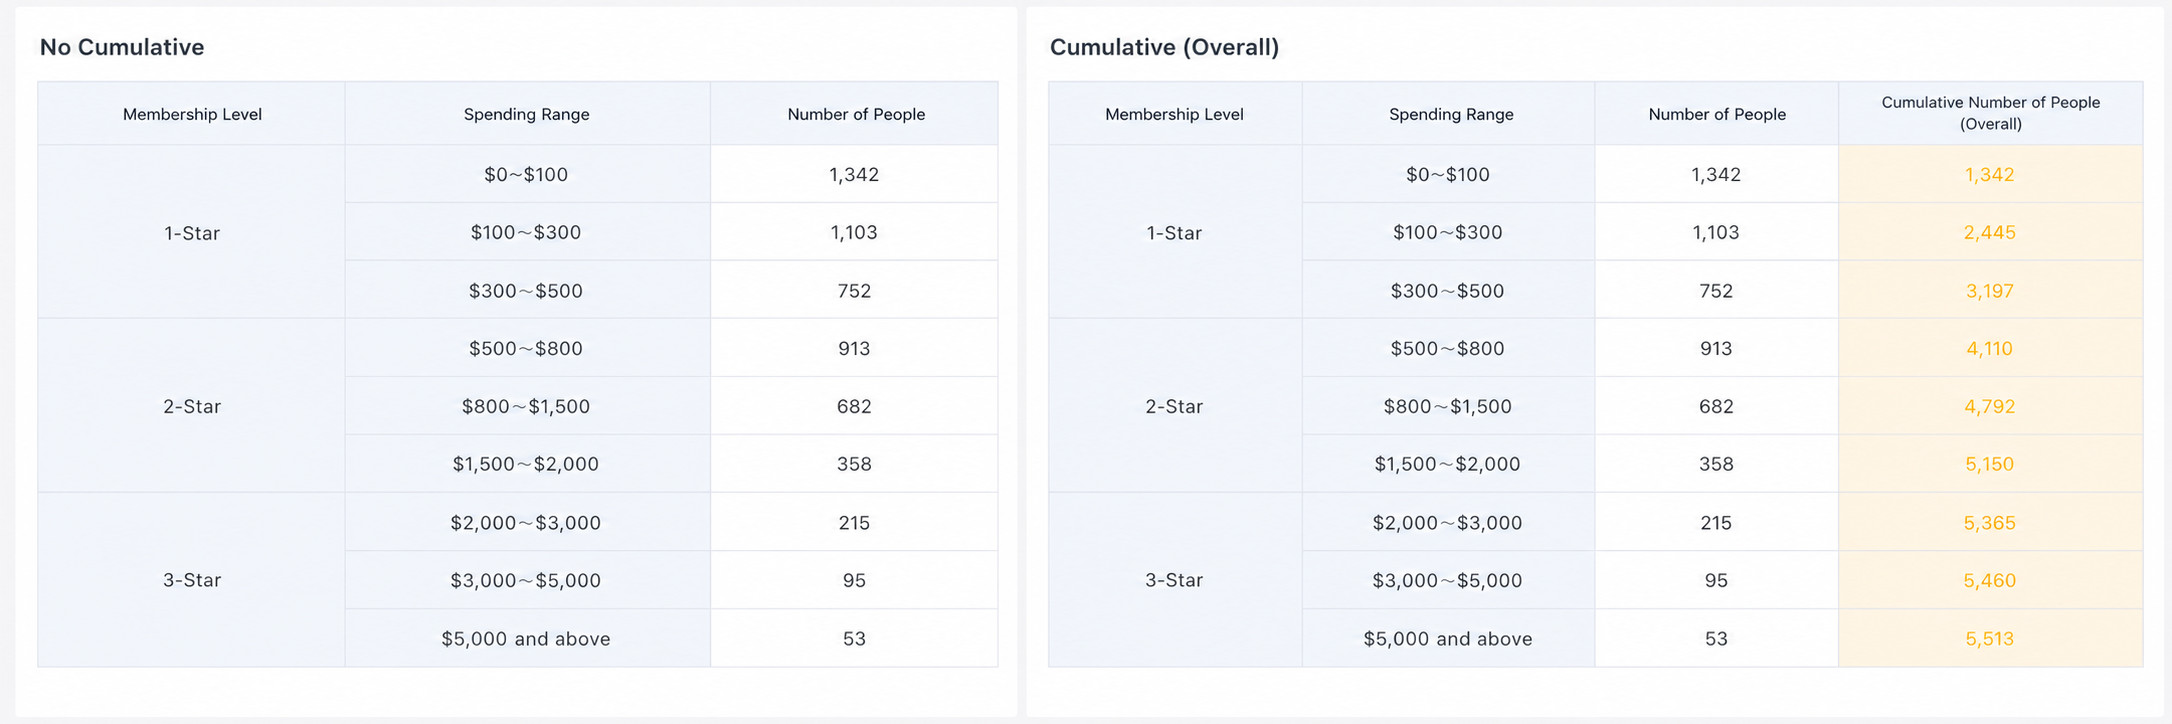
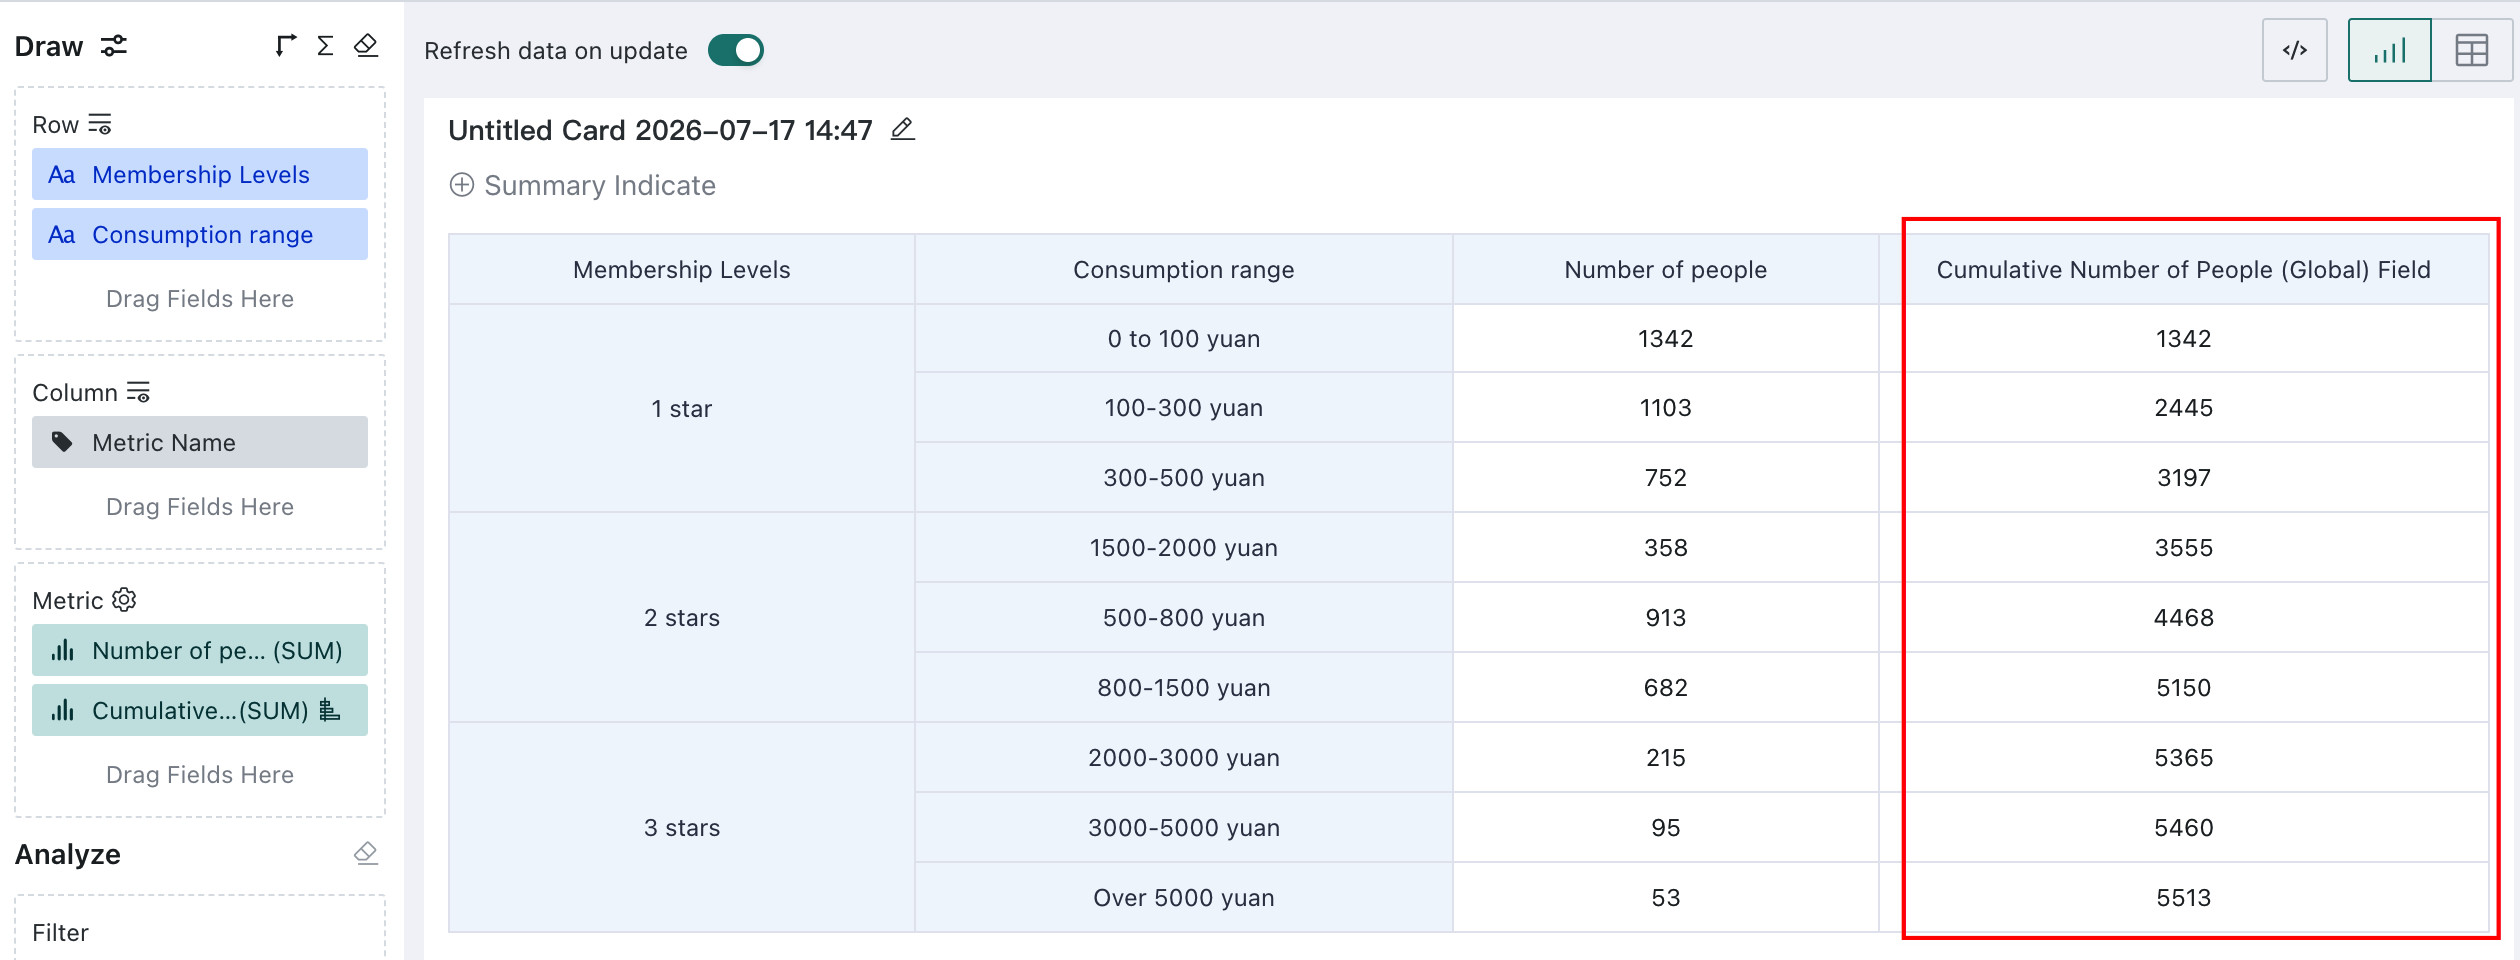
View the result of the global Accumulated By Column.
As shown, the Cumulative Customer Count (Global) column is accumulated row by row.
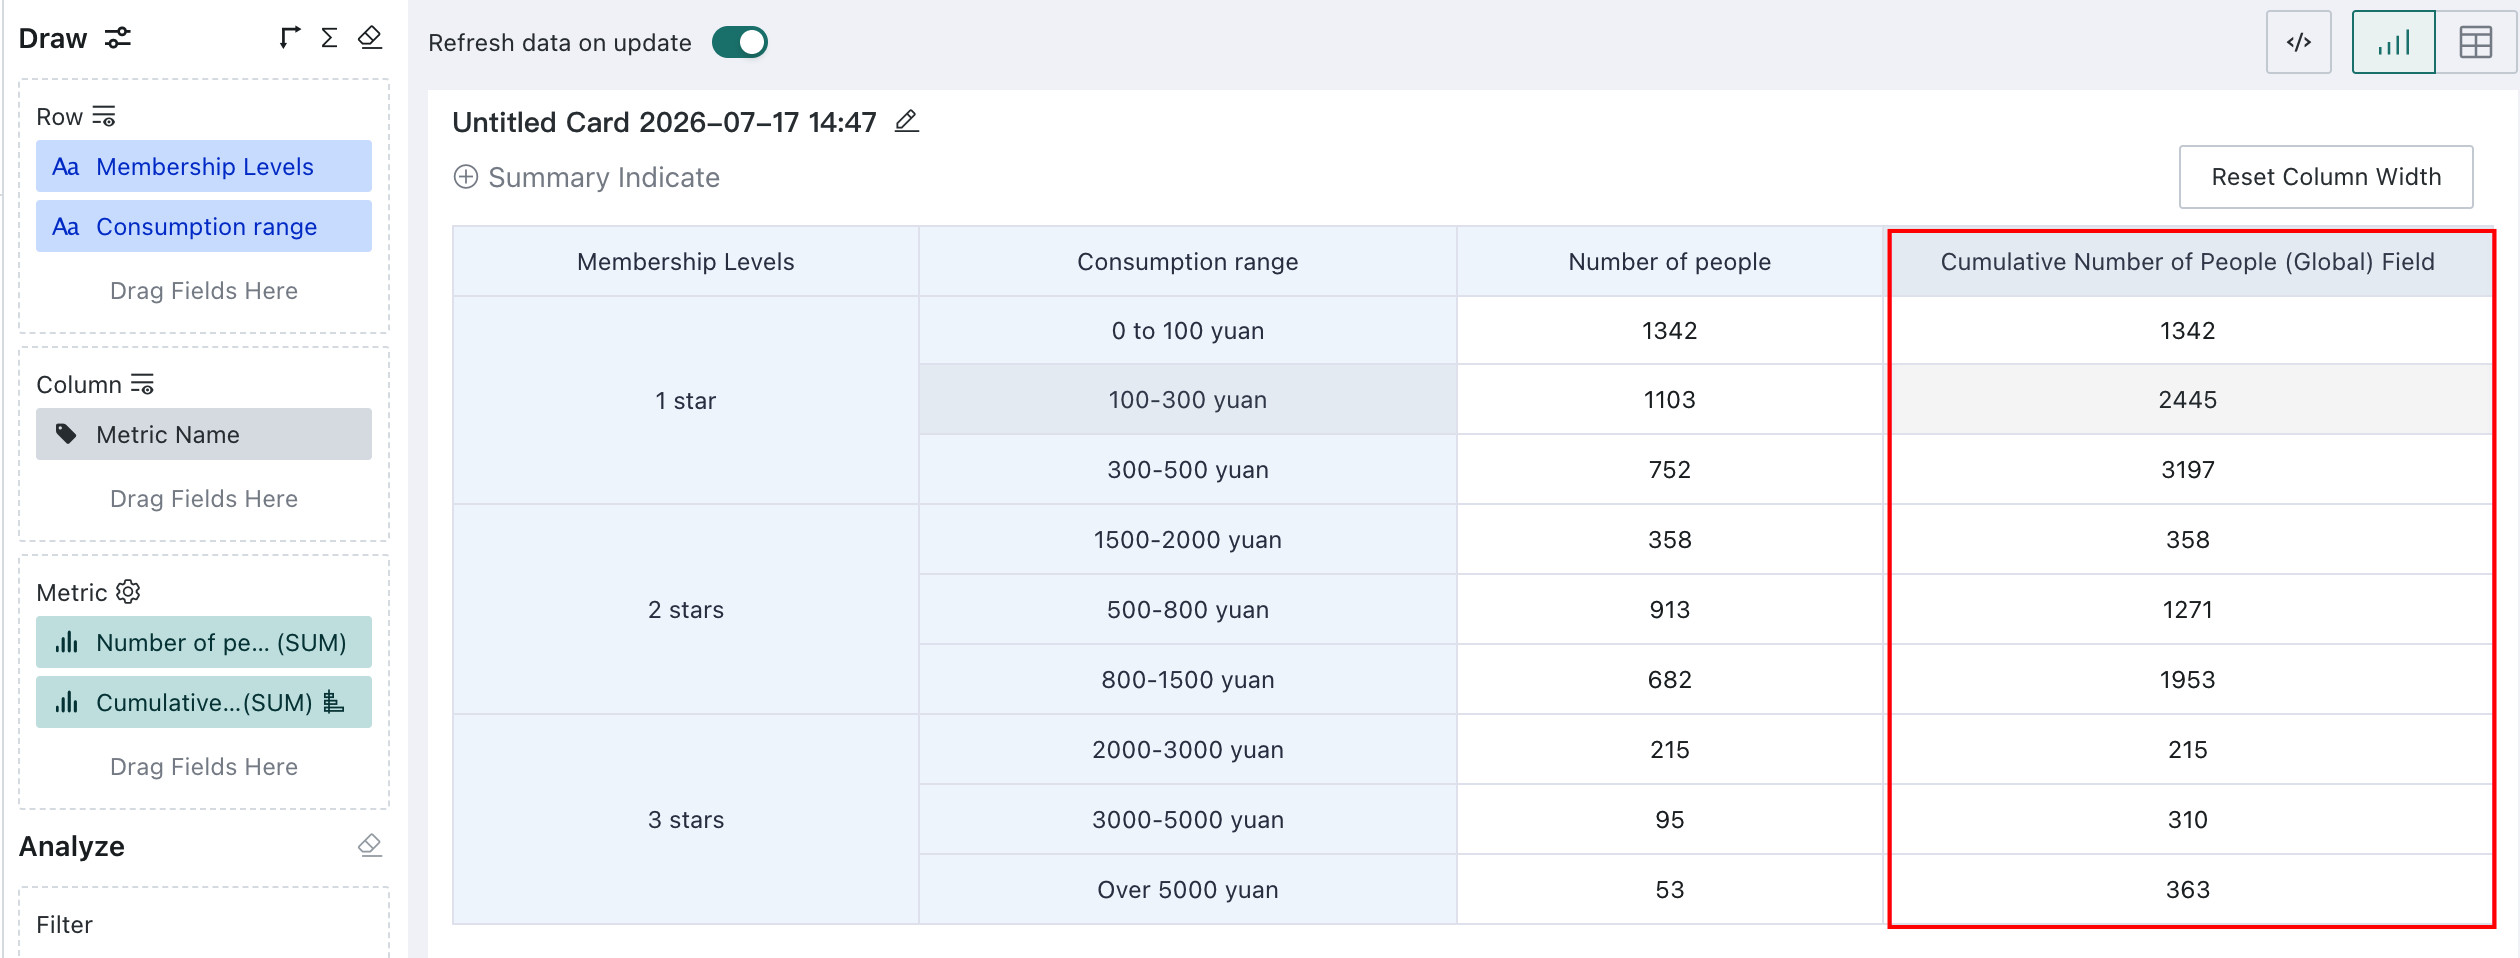
Intra-Group Cumulative (By a Specific Field)
Intra-group cumulative means grouping data by a specific dimension field and performing Accumulated within each group.
The example below creates a Cumulative Customer Count Table by Membership Level to calculate the cumulative number of customers for each spending range within each membership level. Example dataset: Accumulated - Spending Level.xlsx.
-
In the Charting area, drag Membership Level and Spending Range into Dimensions, and drag Customer Count into Measures. For easier display, drag Customer Count into Measures again and rename it Cumulative Customer Count (Within the Same Level).
-
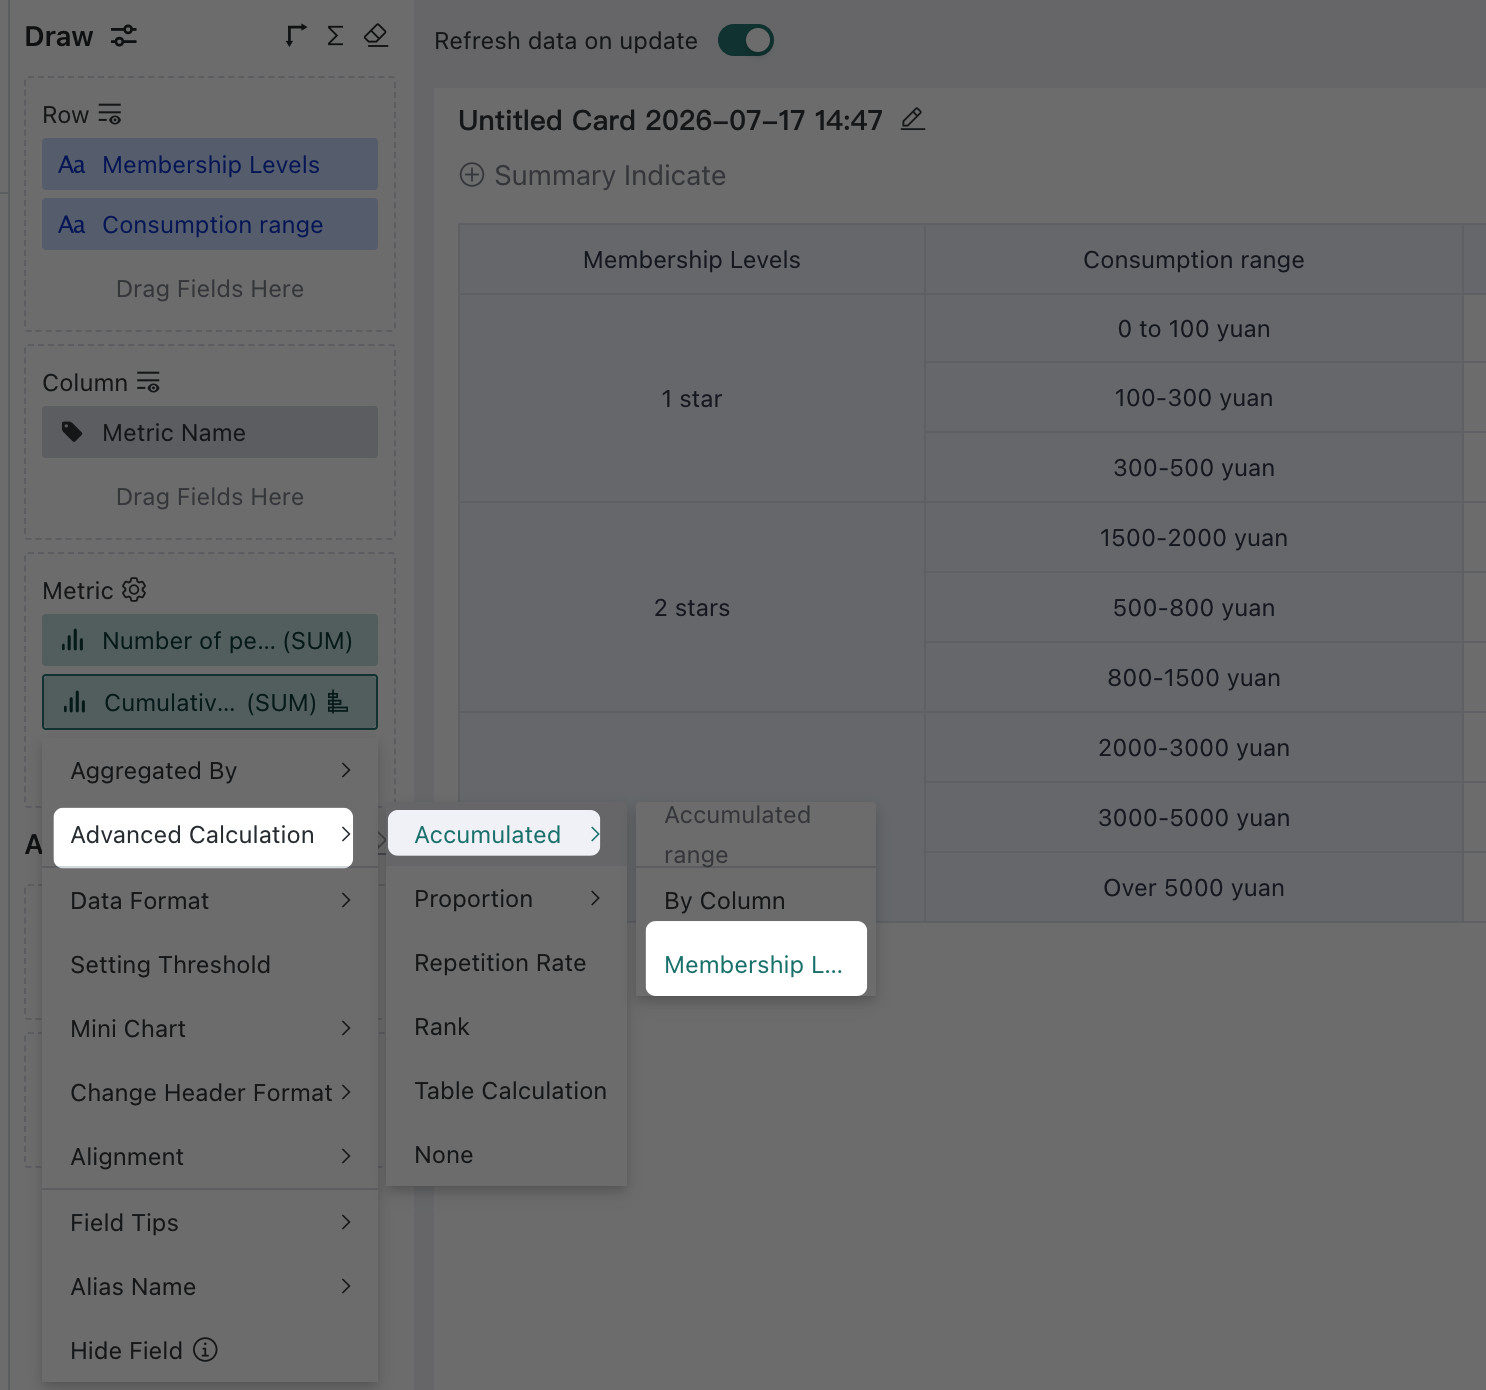
Click Cumulative Customer Count (Within the Same Level), choose Advanced Calculation > Accumulated from the drop-down menu, and set the cumulative scope to Membership Level for this example.
-
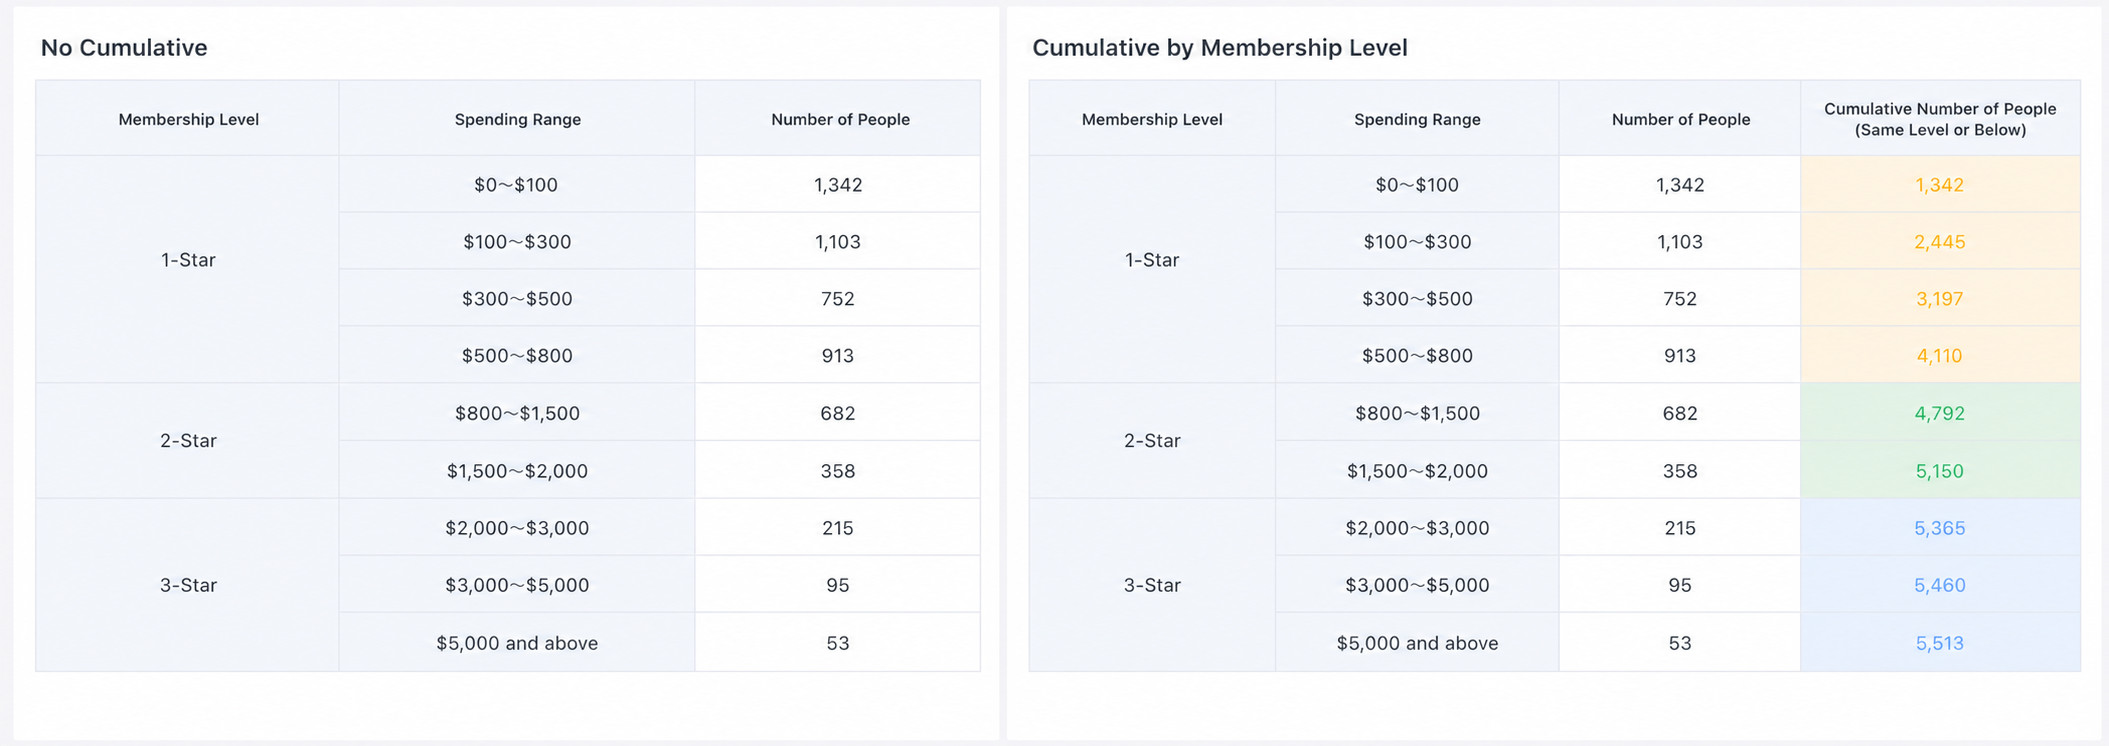
View the result of Accumulated by Membership Level.
As shown, the Cumulative Customer Count (Within the Same Level) column is accumulated row by row within each membership level.
Limitations
- For date-type fields, the finest supported granularity is day. Hour-minute-second Accumulated is not supported. If a date field includes hour-minute-second values, it is treated as day-level.
- Detail tables do not support Accumulated.
- Only charts with dimensions support Accumulated. Charts without dimensions, such as metric cards, do not support it.