Overview
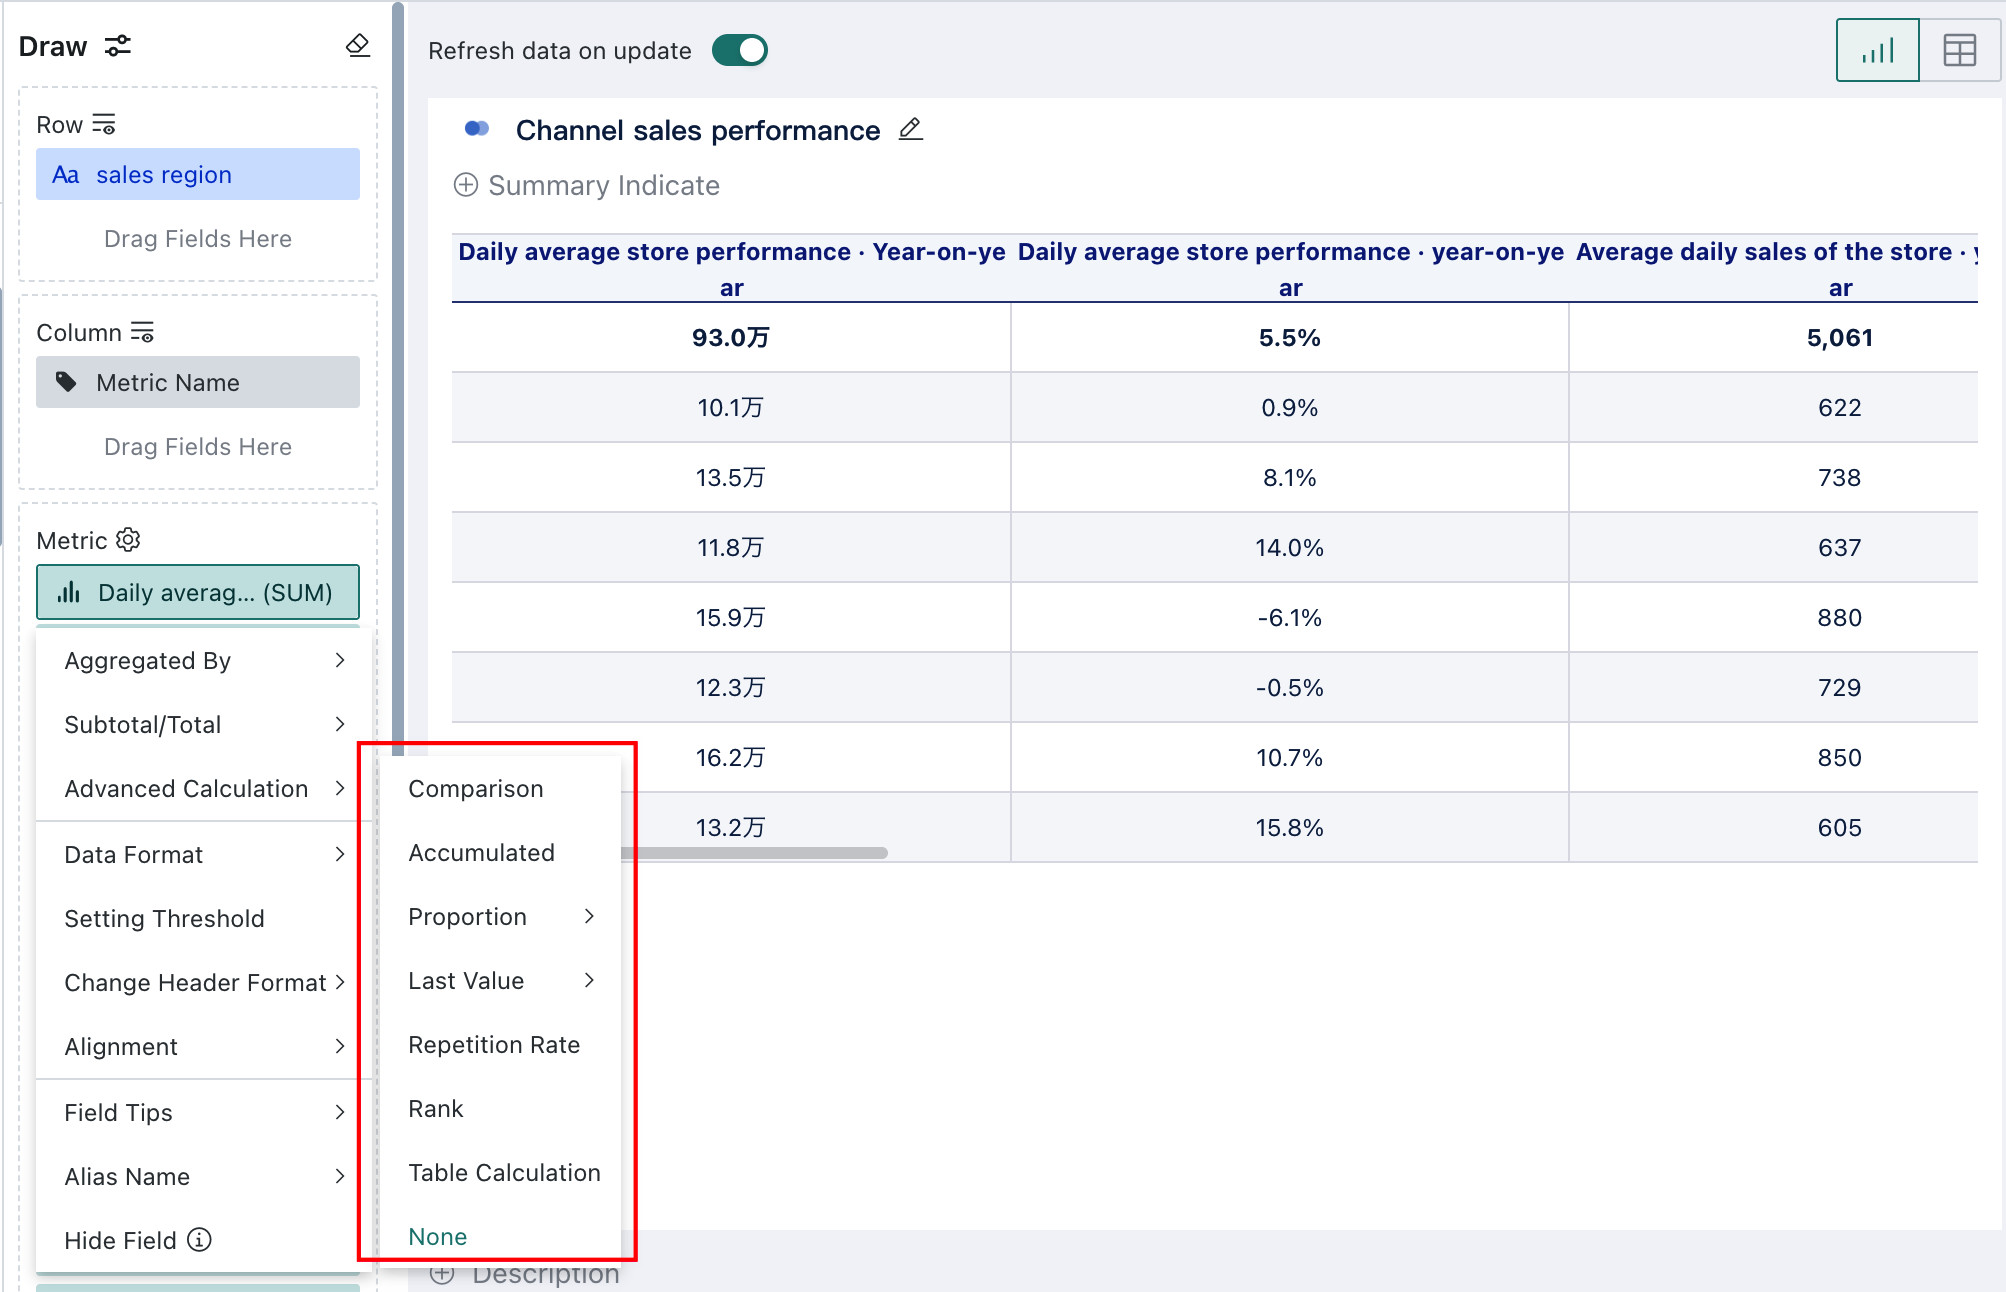
Advanced Calculation refers to complex analytical scenarios implemented through intuitive visual configuration, such as year-over-year and period-over-period analysis, percentage calculations, ranking, repeat rate detection, ending value calculation, and table calculations. It allows users to complete many analysis scenarios efficiently without manually writing complex functions.
Among these capabilities, Table Calculation offers even more flexibility through partition addressing and calculation methods. It not only covers YoY/PoP analysis, percentages, and rankings, but also supports cumulative values, moving calculations, and nested calculations between different calculation types.
Getting Started
| Advanced Calculation Type | Description |
|---|---|
| Comparison | YoY/PoP analysis is a common method in data analysis and helps users identify anomalies or unusual trends more easily. |
| Accumulated | Accumulated calculation sums values progressively over time or across rows, supporting both grouped and global cumulative values. It is commonly used for YTD, QTD, and running-total analysis to track growth and overall progress. |
| Proportion | Percentage calculations are used to quickly compute the share of a value within the overall total. |
| Last Value | Ending Value usually refers to the specific metric value at the end of a given point in time, such as month-end or year-end, representing the accumulated result of previous changes or activities. |
| Repetition Rate | Repeat Rate can be used in scenarios such as repurchase rate and repeat purchase analysis. |
| Rank | Ranking calculates the order of a group of metrics according to specific rules so that users can compare value size more easily. |
| Table Calculation | When charts created from raw data are not sufficient for deeper analysis, table calculations can be used to further process and analyze aggregated data. |