Managing Self-service Data Retrieval
Overview
After creating a Self-service Data Retrieval page, page owners can manage it from the preview interface. This includes publishing control, access permissions, and field configuration, helping maintain both data security and a clean user experience.
User Guide
Publishing Self-service Data Retrieval
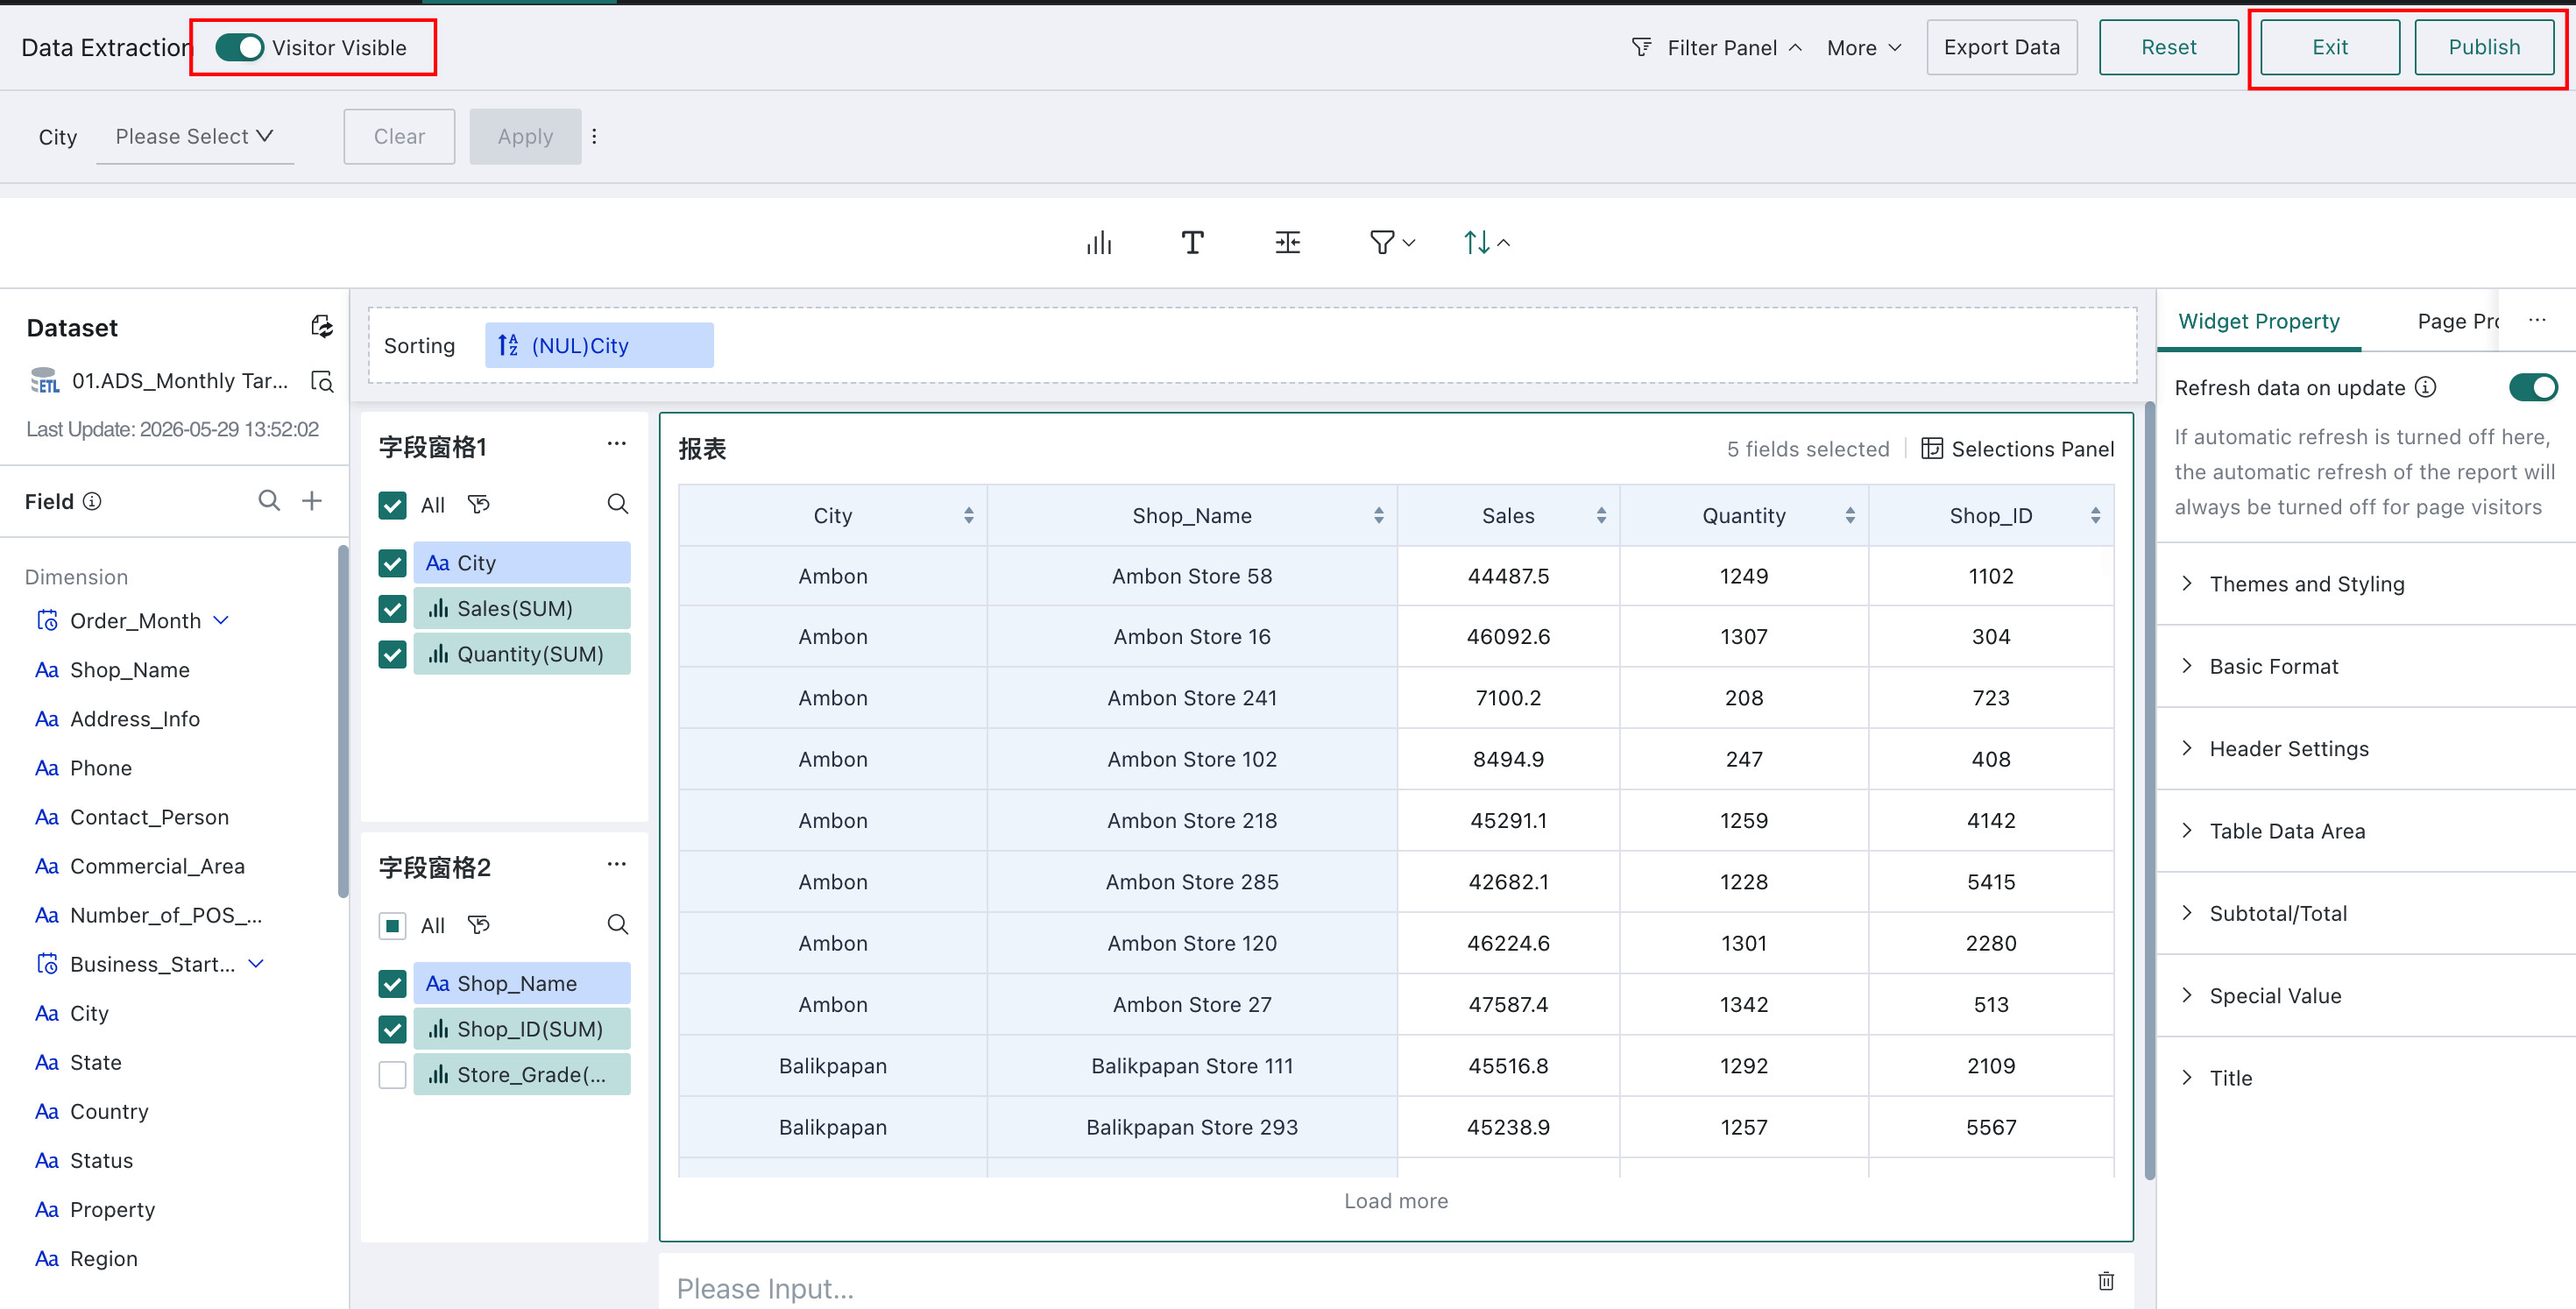
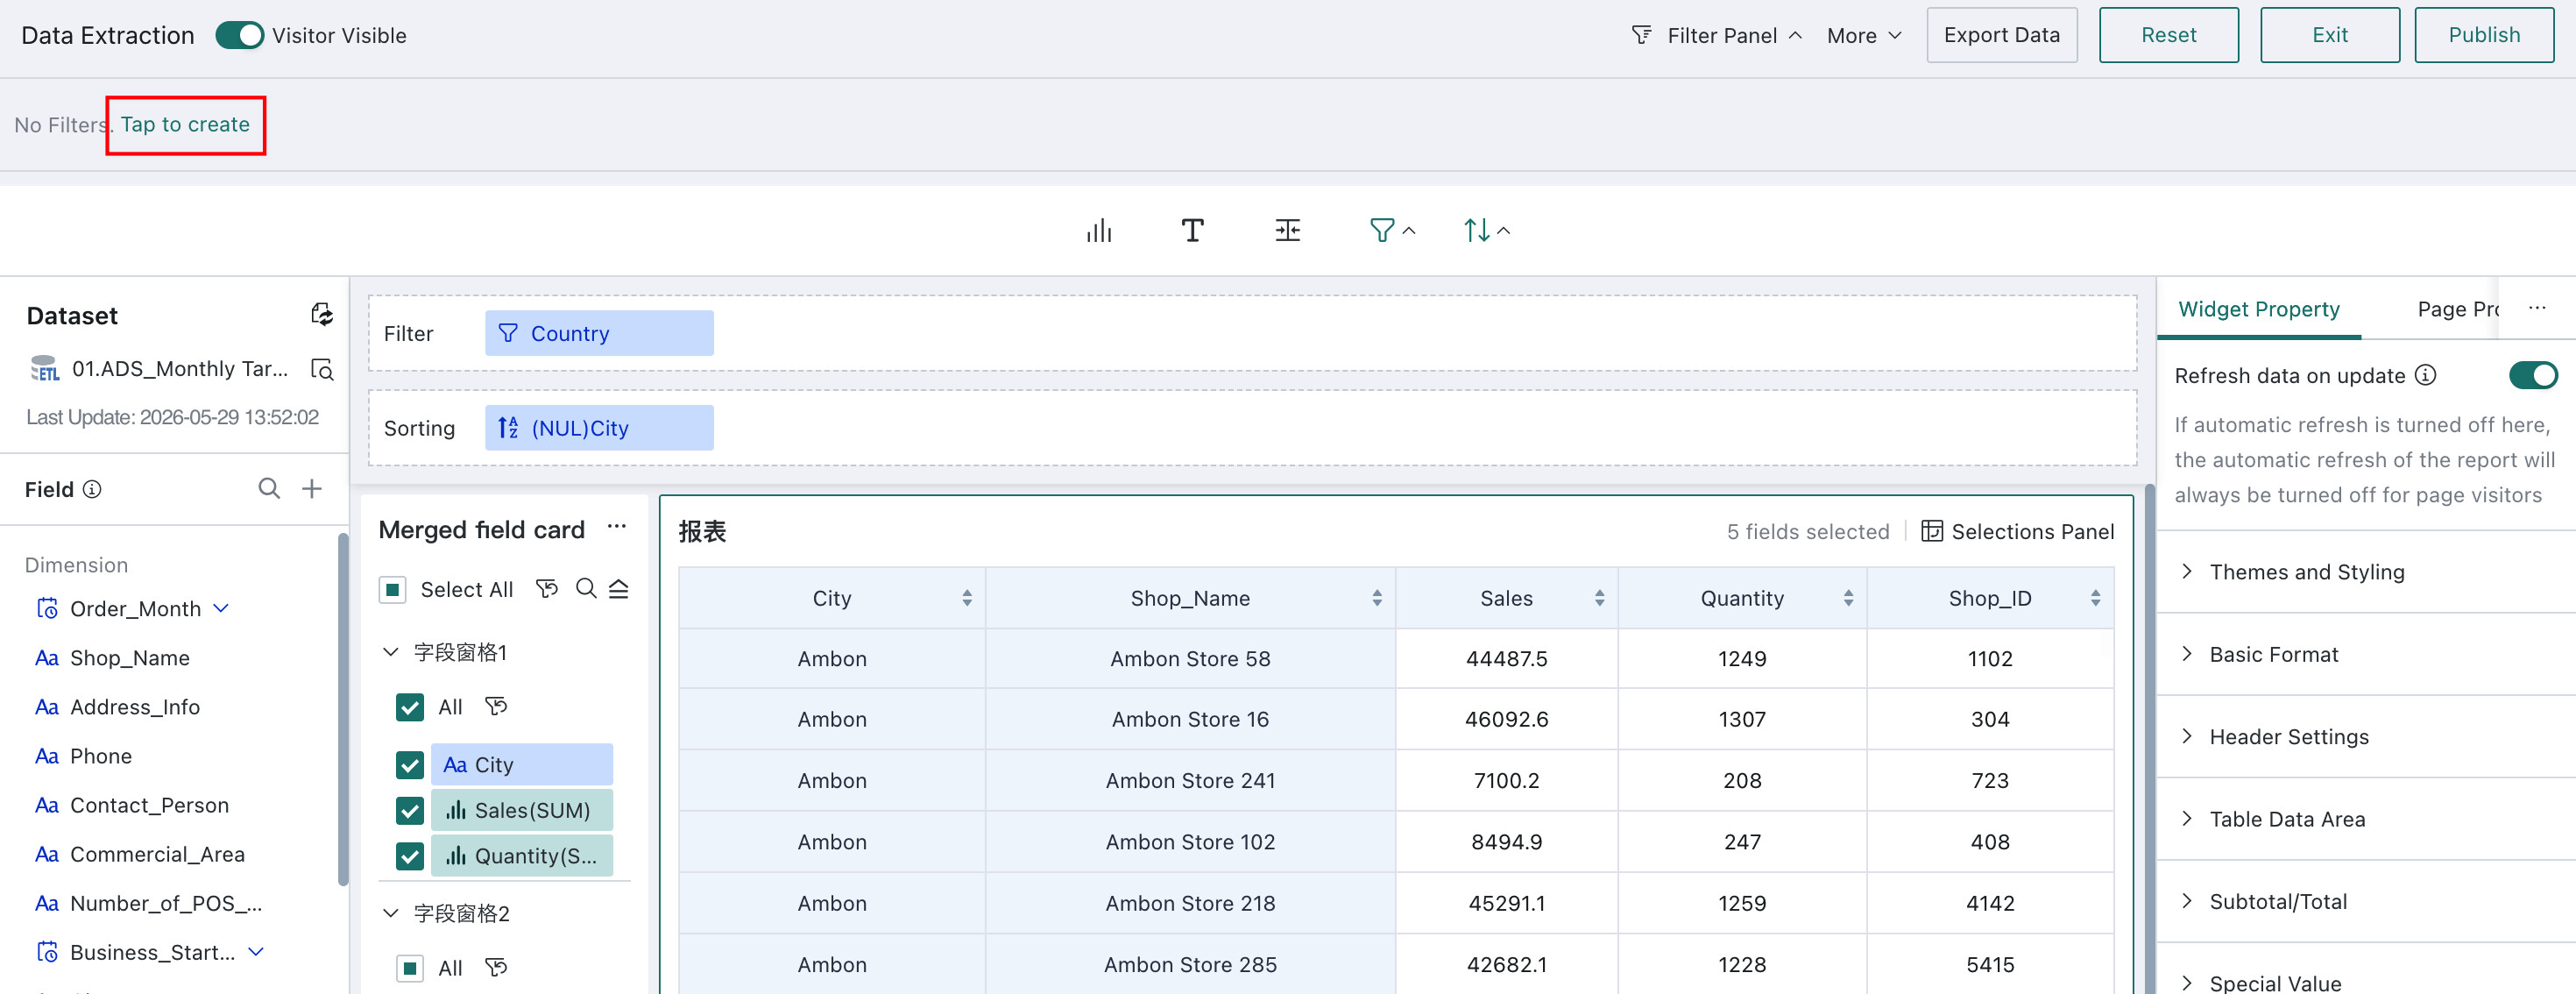
- After the page is ready, click Publish in the upper-right corner to publish it online.
- Edits are saved in real time. If you are not ready to publish yet, click Exit in the upper-right corner to return to the online page.
- If the page should be available to business users after publishing, turn on Visitor Visible.
- On: Authorized visitors can view and use the published page.
- Off: Visitors cannot access the page.
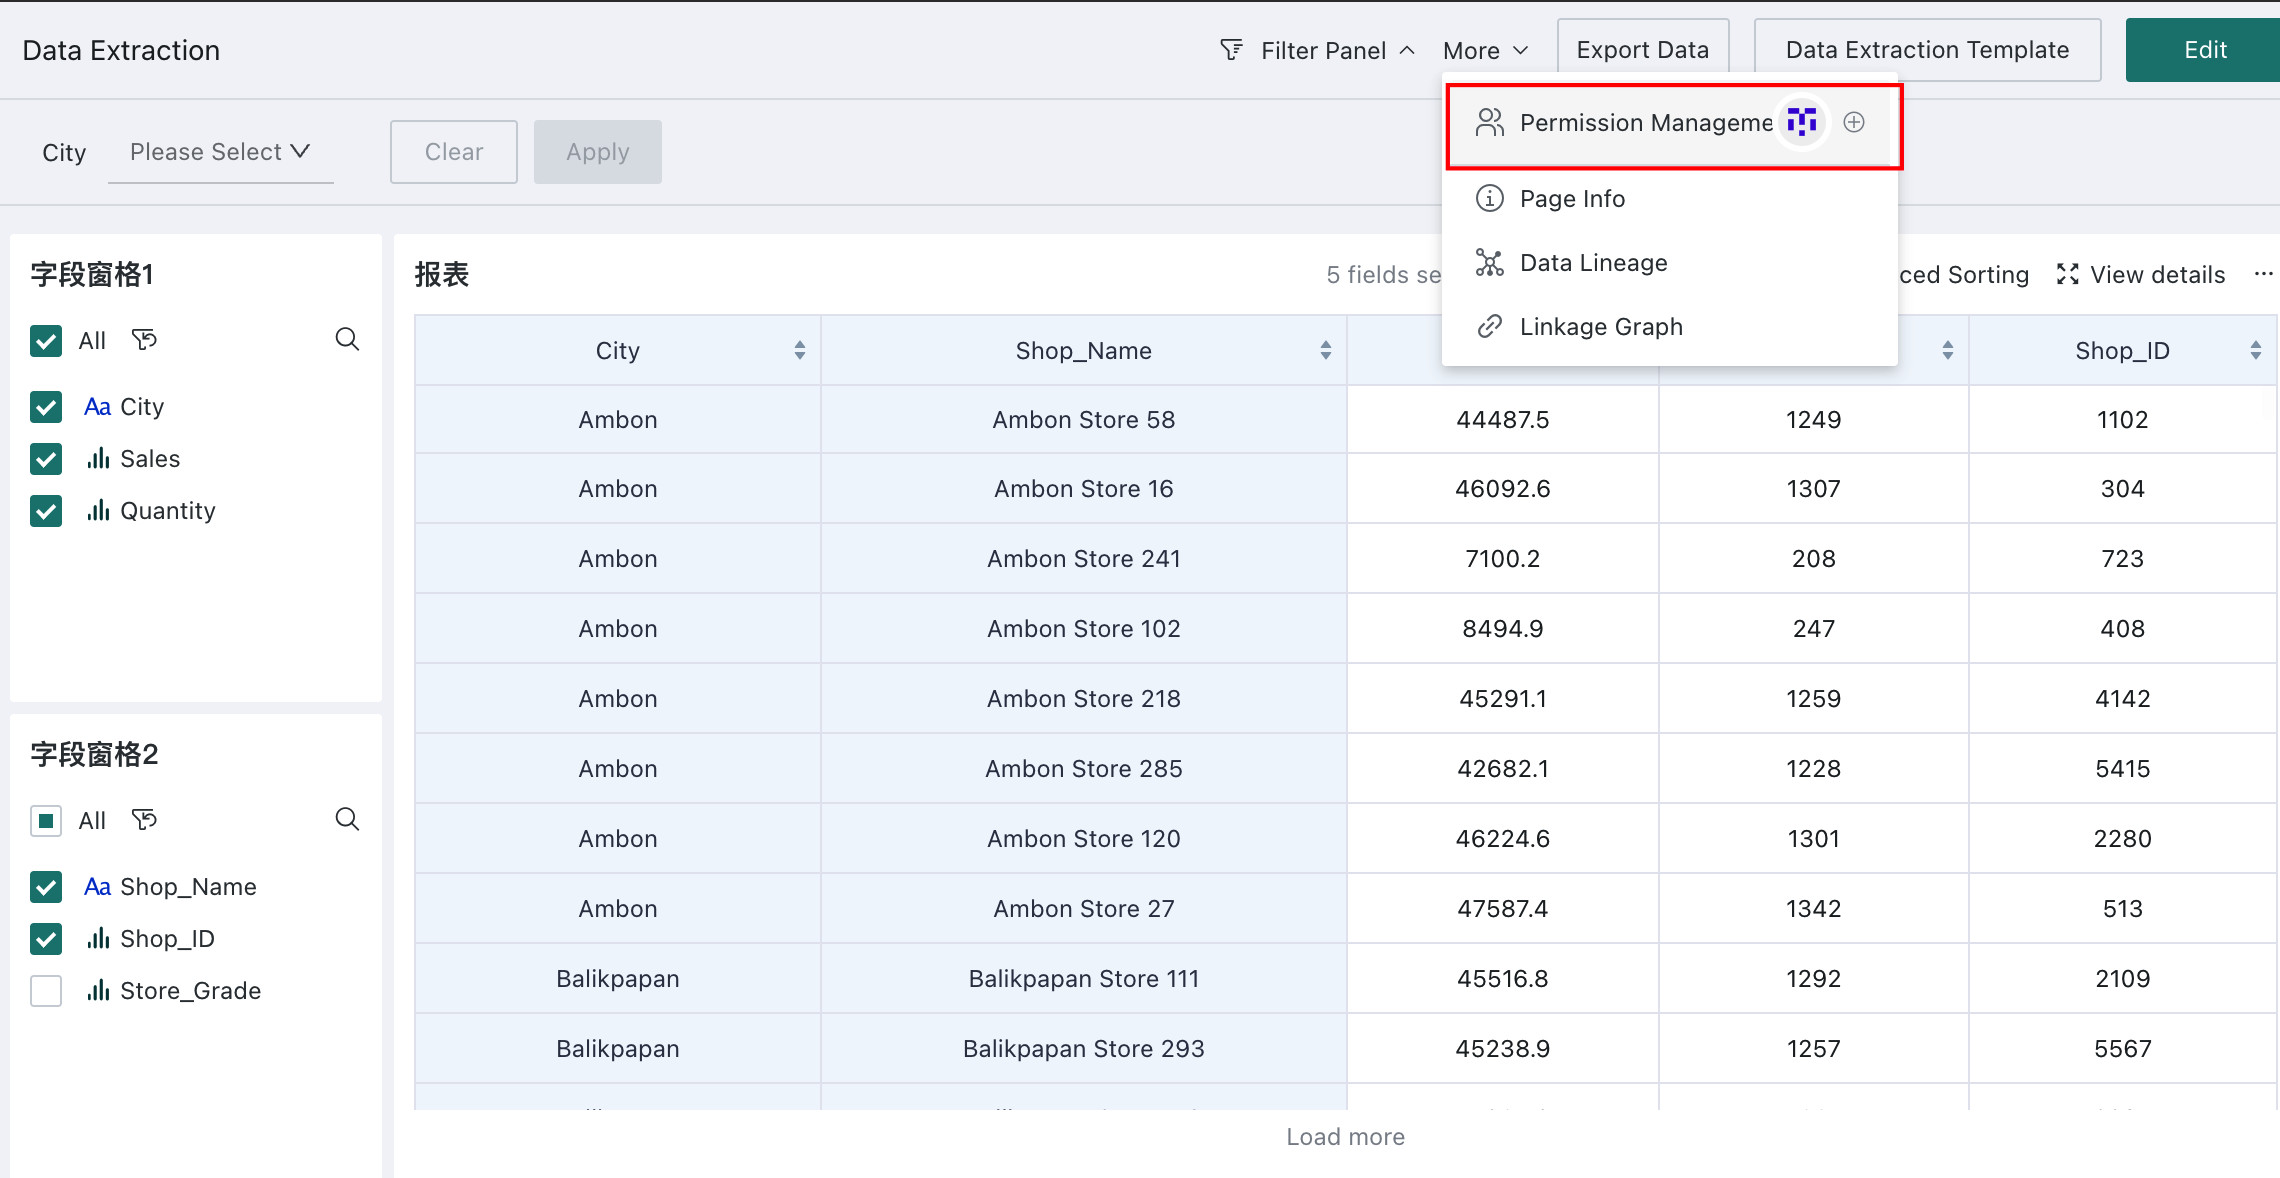
Permission Management
Before sharing the page, make sure the required permissions have been granted so end users can access and use it.
- Owner: can edit the Self-service Data Retrieval page
- Visitor: cannot edit the page, but can perform ad-hoc queries, filter data, adjust personal display settings, and export data
Field Configuration
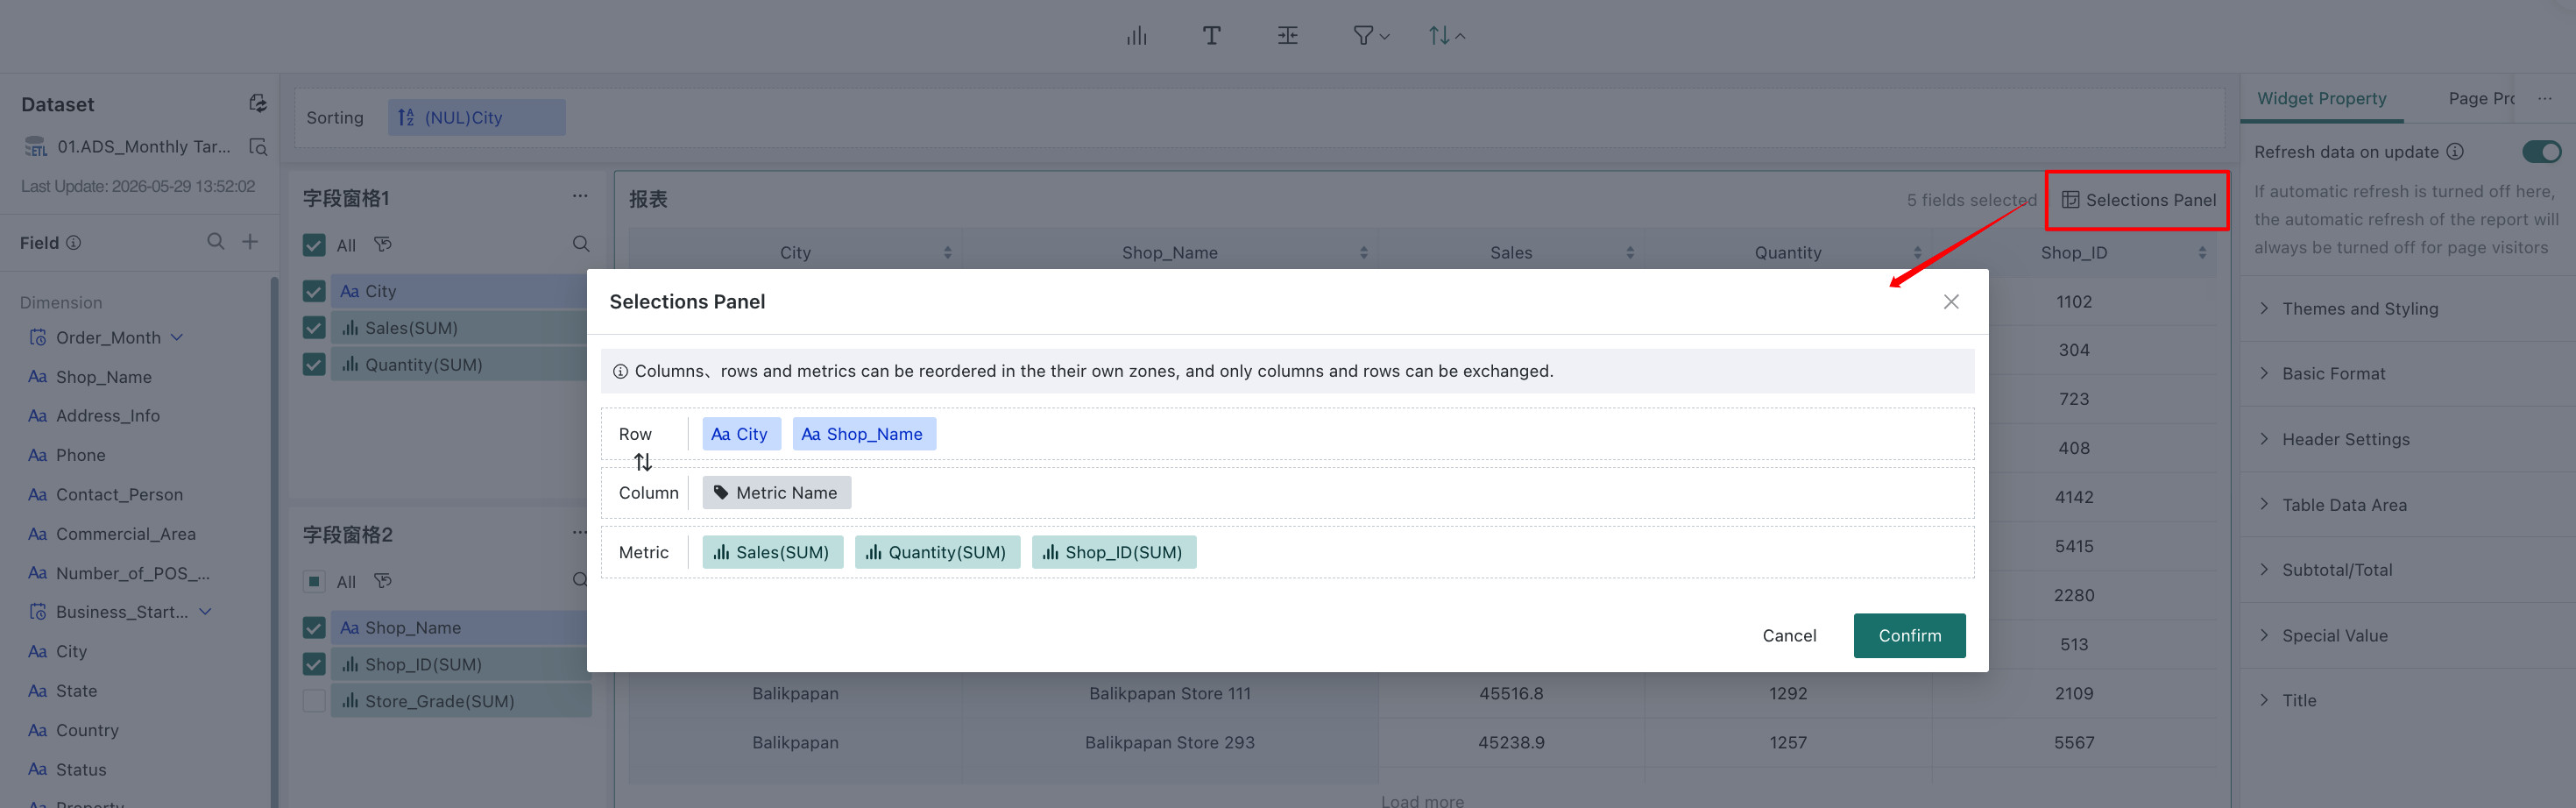
Field configuration is a core capability of Self-service Data Retrieval. It lets users adjust which fields are displayed, where they appear, and how they are ordered. Both the editor and preview page support field configuration, but they serve different purposes:
- Editing Page: defines the default preset template. Once configured, it becomes the standard initial view for all authorized users.
- Preview Page: supports personalized viewing for the current user only. These changes do not affect other users. If a user wants to share their customized result with others, they can save it as a Data Retrieval Template and publish it. For details, see Data Retrieval Template.
At the configuration level, the editor and preview page are mostly consistent, except for Exclusion Settings, which can exclude rows whose metric values are 0 or empty. This option is off by default. For reference, see Field Configuration.
- Excluded items do not participate in grand total, subtotal, or advanced sorting calculations, and data export does not include this data.
- Row dimensions, column dimensions, and metrics can be sorted within groups; only row dimensions and column dimensions can be dragged to each other.
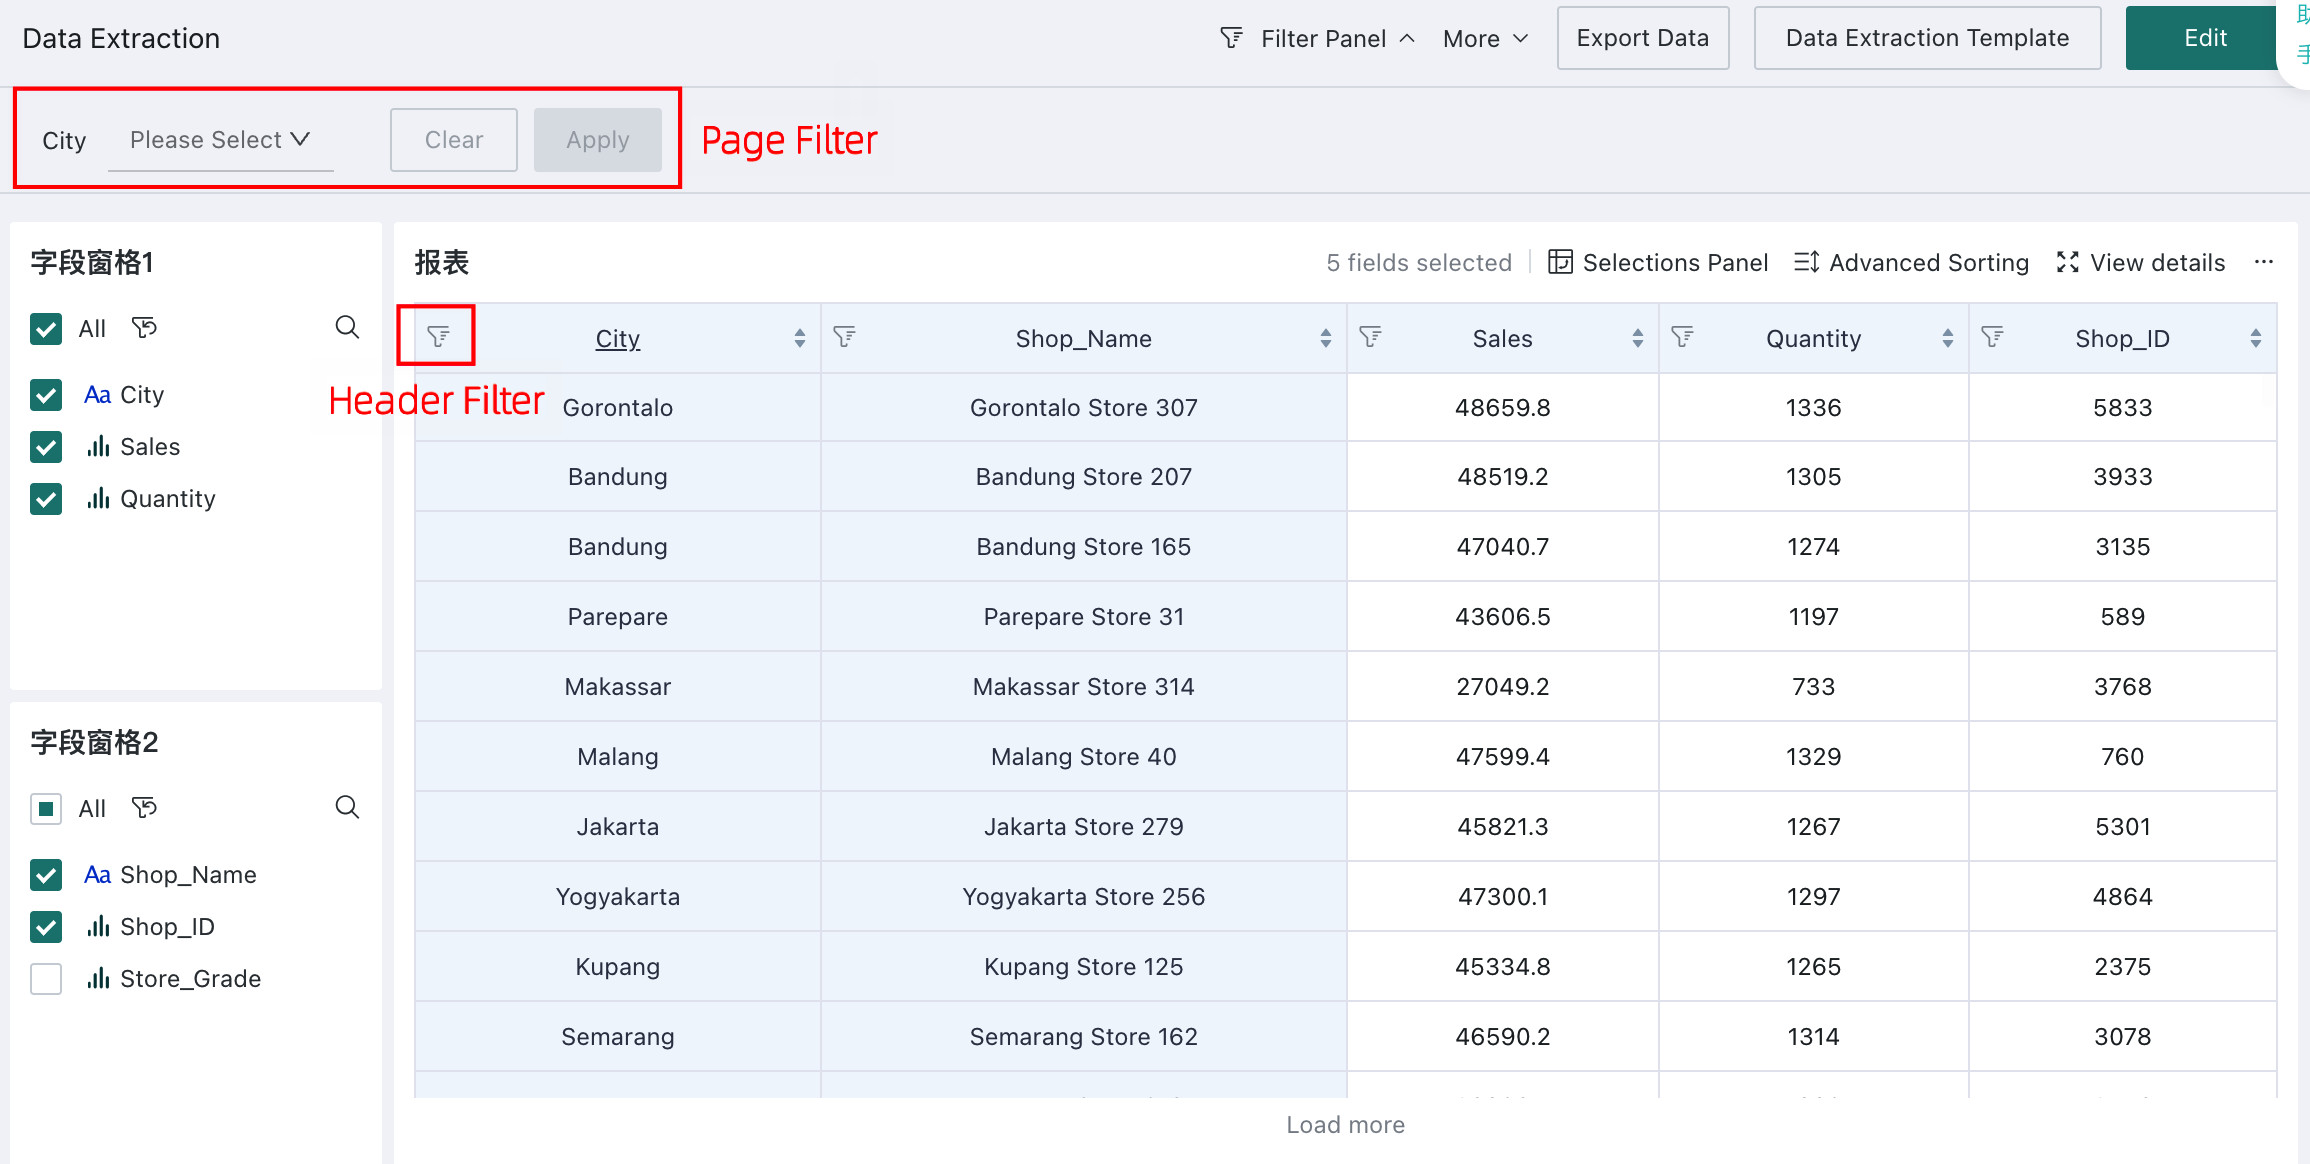
Data Filtering
In Self-service Data Retrieval, there are three places to configure filter conditions: pre-filters in the editing page, page filters, and header filters on the online page. The usage of these three filters is introduced below.
- Default Filter (Pre-filter): Default filtering of table detail data when editing Self-service Data Retrieval.
-
Page Filter: The page's filter. If it conflicts with the filter field values in the editing page, the page filter takes precedence.
-
Header Filter: Table header filtering.
Filter Priority:
1. Page filters in the list >= Header filters on the online page >= Pre-filters in the editing page.
2. The Self-service Data Retrieval interface displays pre-filter result data by default. (Pre-filters need to be set in advance in the editing page.)
3. Page filters are triggered by users, and filter results and conditions will override the default pre-filter.
4. Header filters are triggered by users and make further filtering based on the data results of "Page Filters" and "Pre-filters in the editing page" (the options for header filters come from the intersection of "Pre-filters in the editing page" and "Page Filters").
Pre-filter
When users enter the Self-service Data Retrieval page, the default table content reflects the configured pre-filters. For details, see Default Filter (Pre-filter).
Filter
-
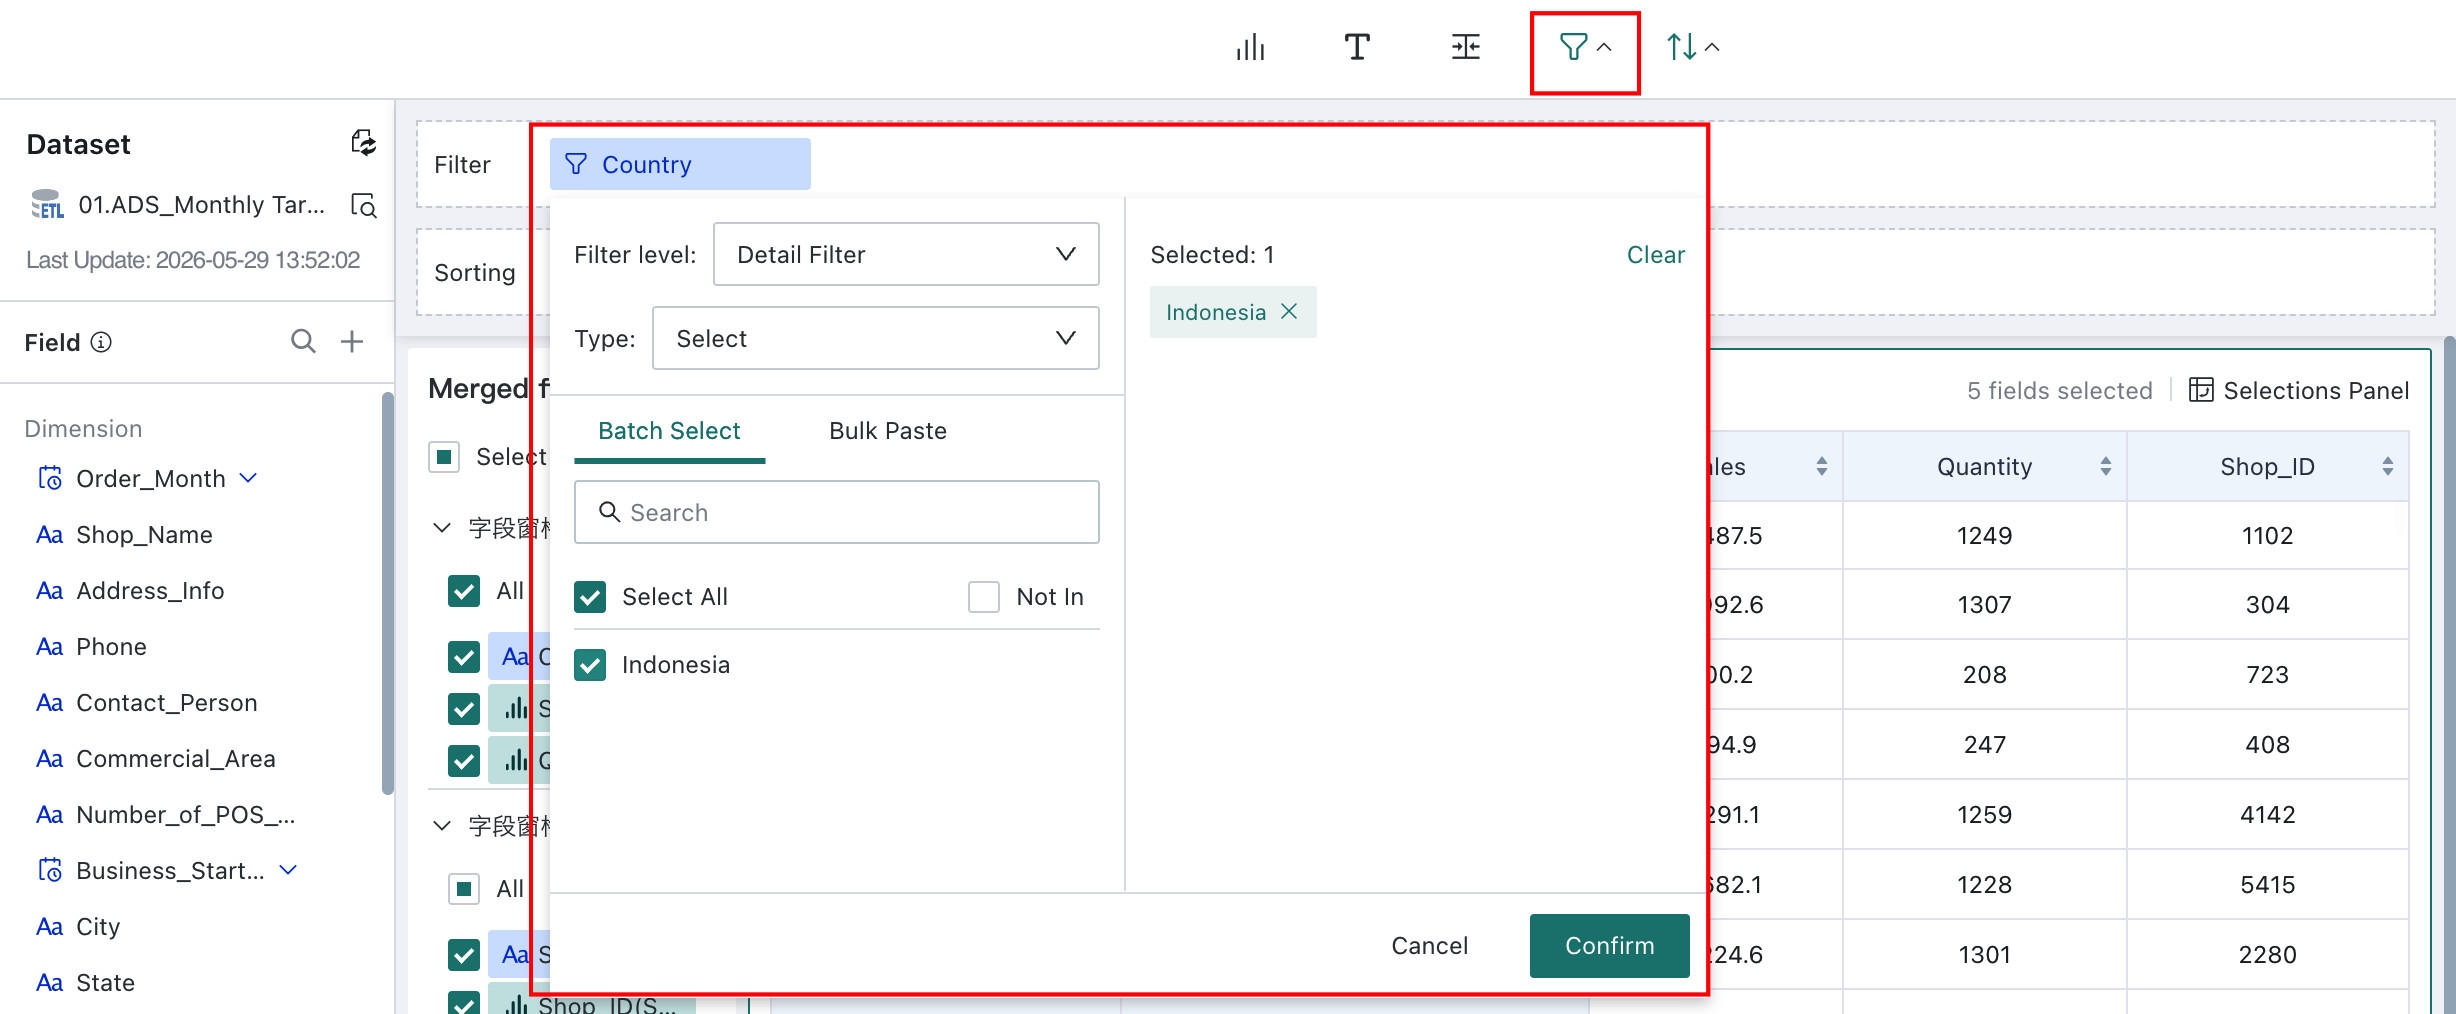
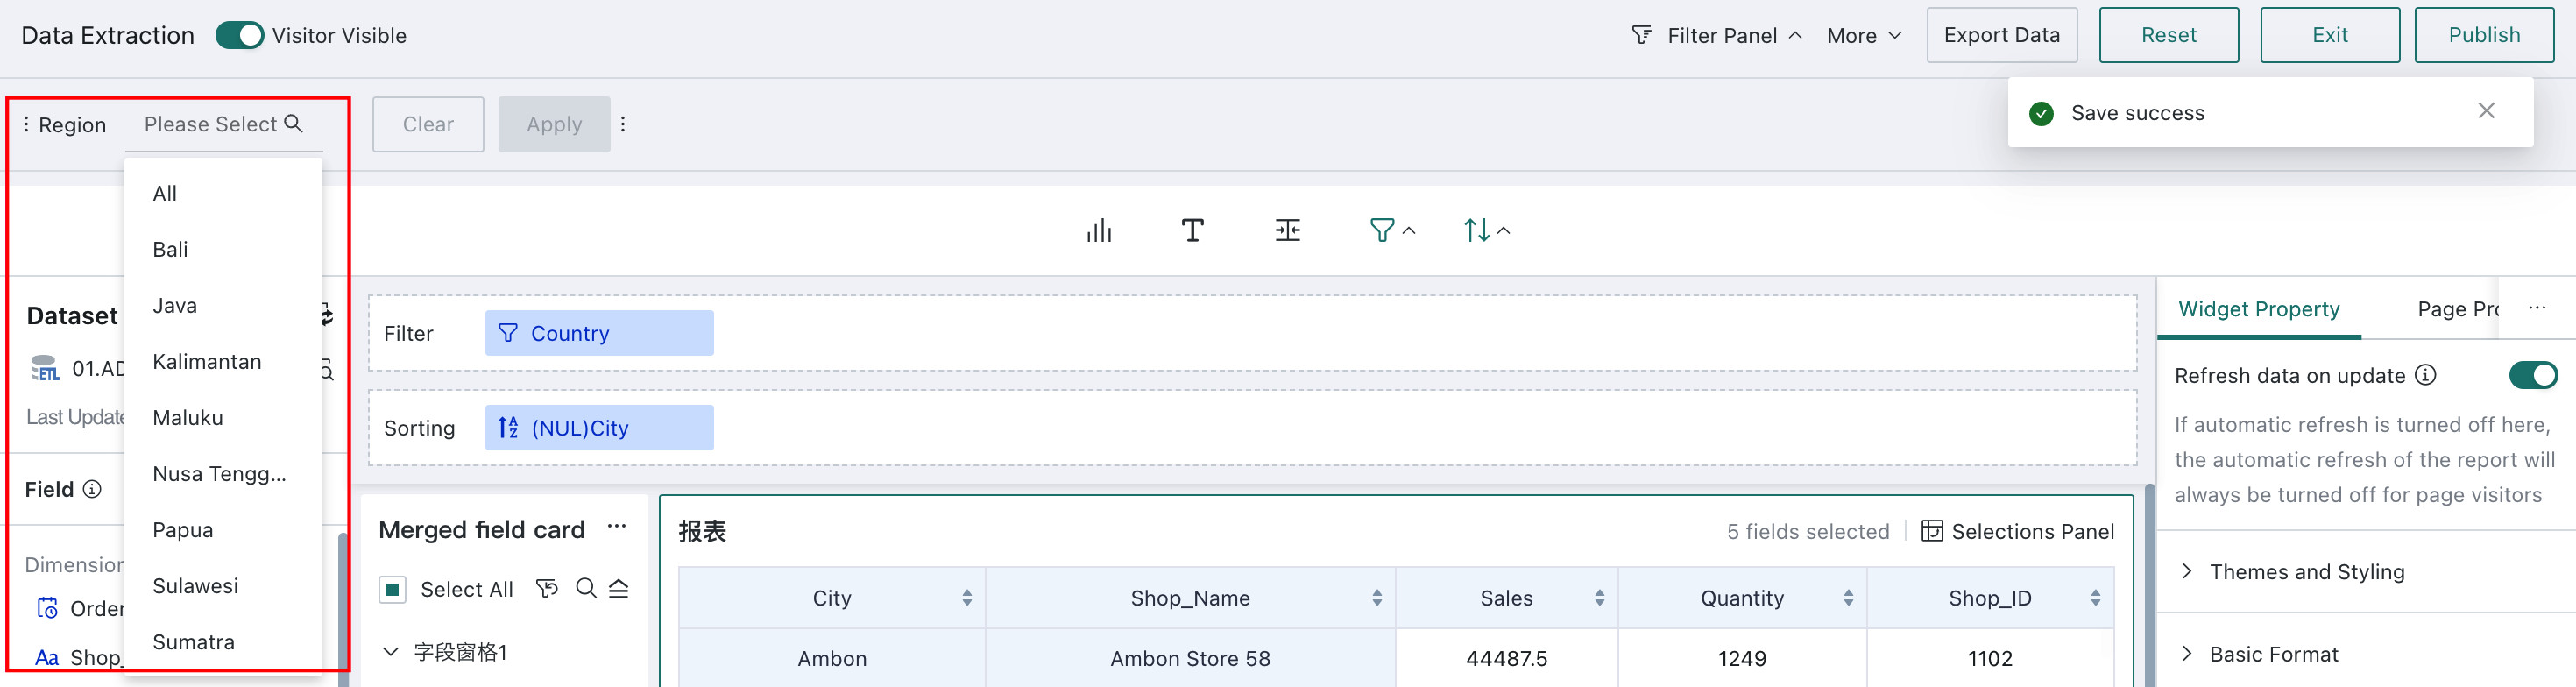
In the filter bar, click Create and choose the filter type to add. The example below uses Select Filter. For other filter types, see Page Filter.
-
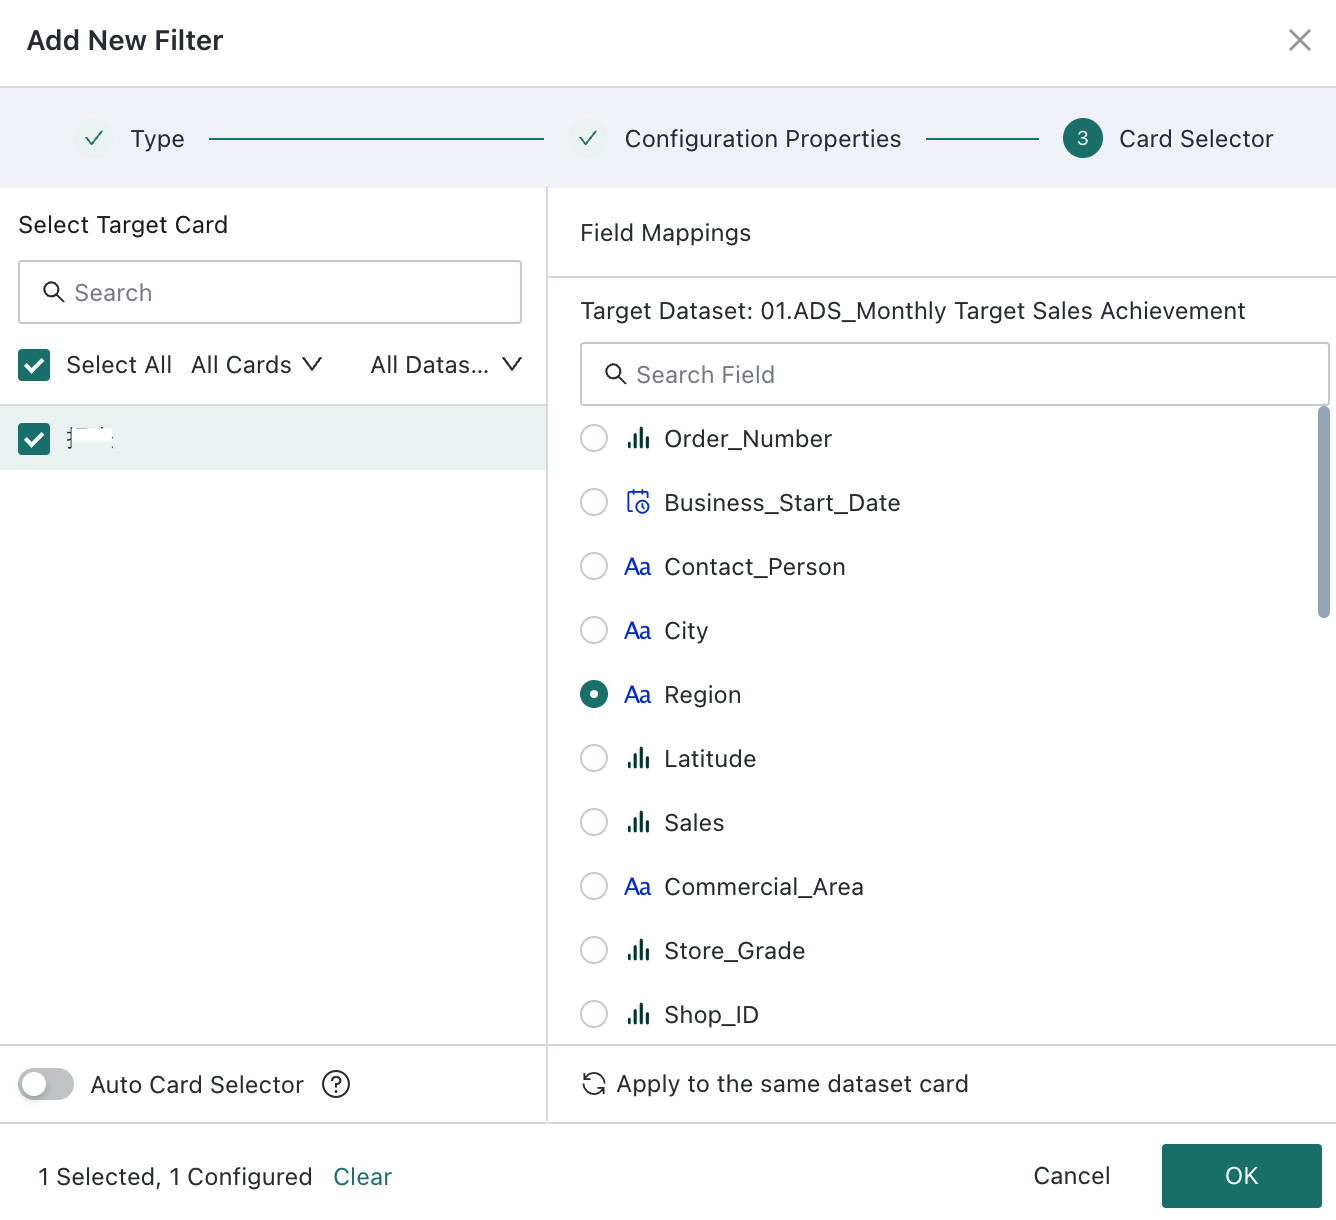
Select "Region" as the filter value, set the selection type to single/multiple select, and set the target card to "Report."
NoteIn the property panel, you can switch the filter to another dataset while preserving its linkage to the report.
-
After setting, the filter will appear above the page. You can select to filter the required data.
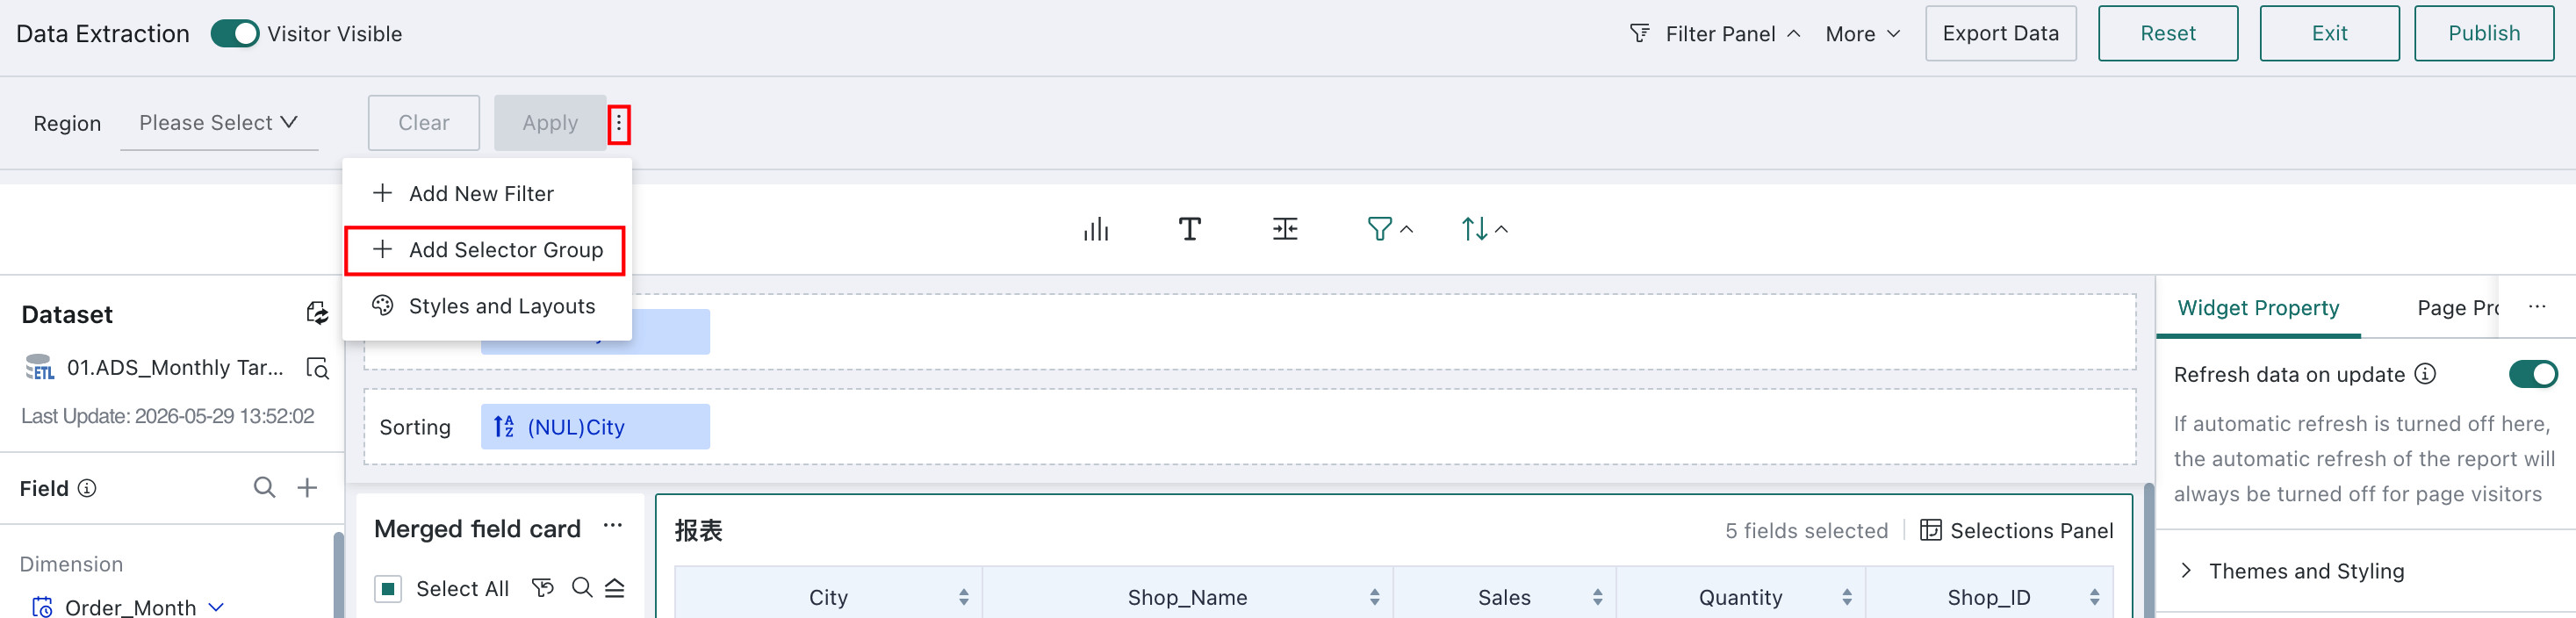
In addition to configuring a single filter, Self-service Data Retrieval also supports filter group functionality, allowing multiple filters to be placed in one filter group.
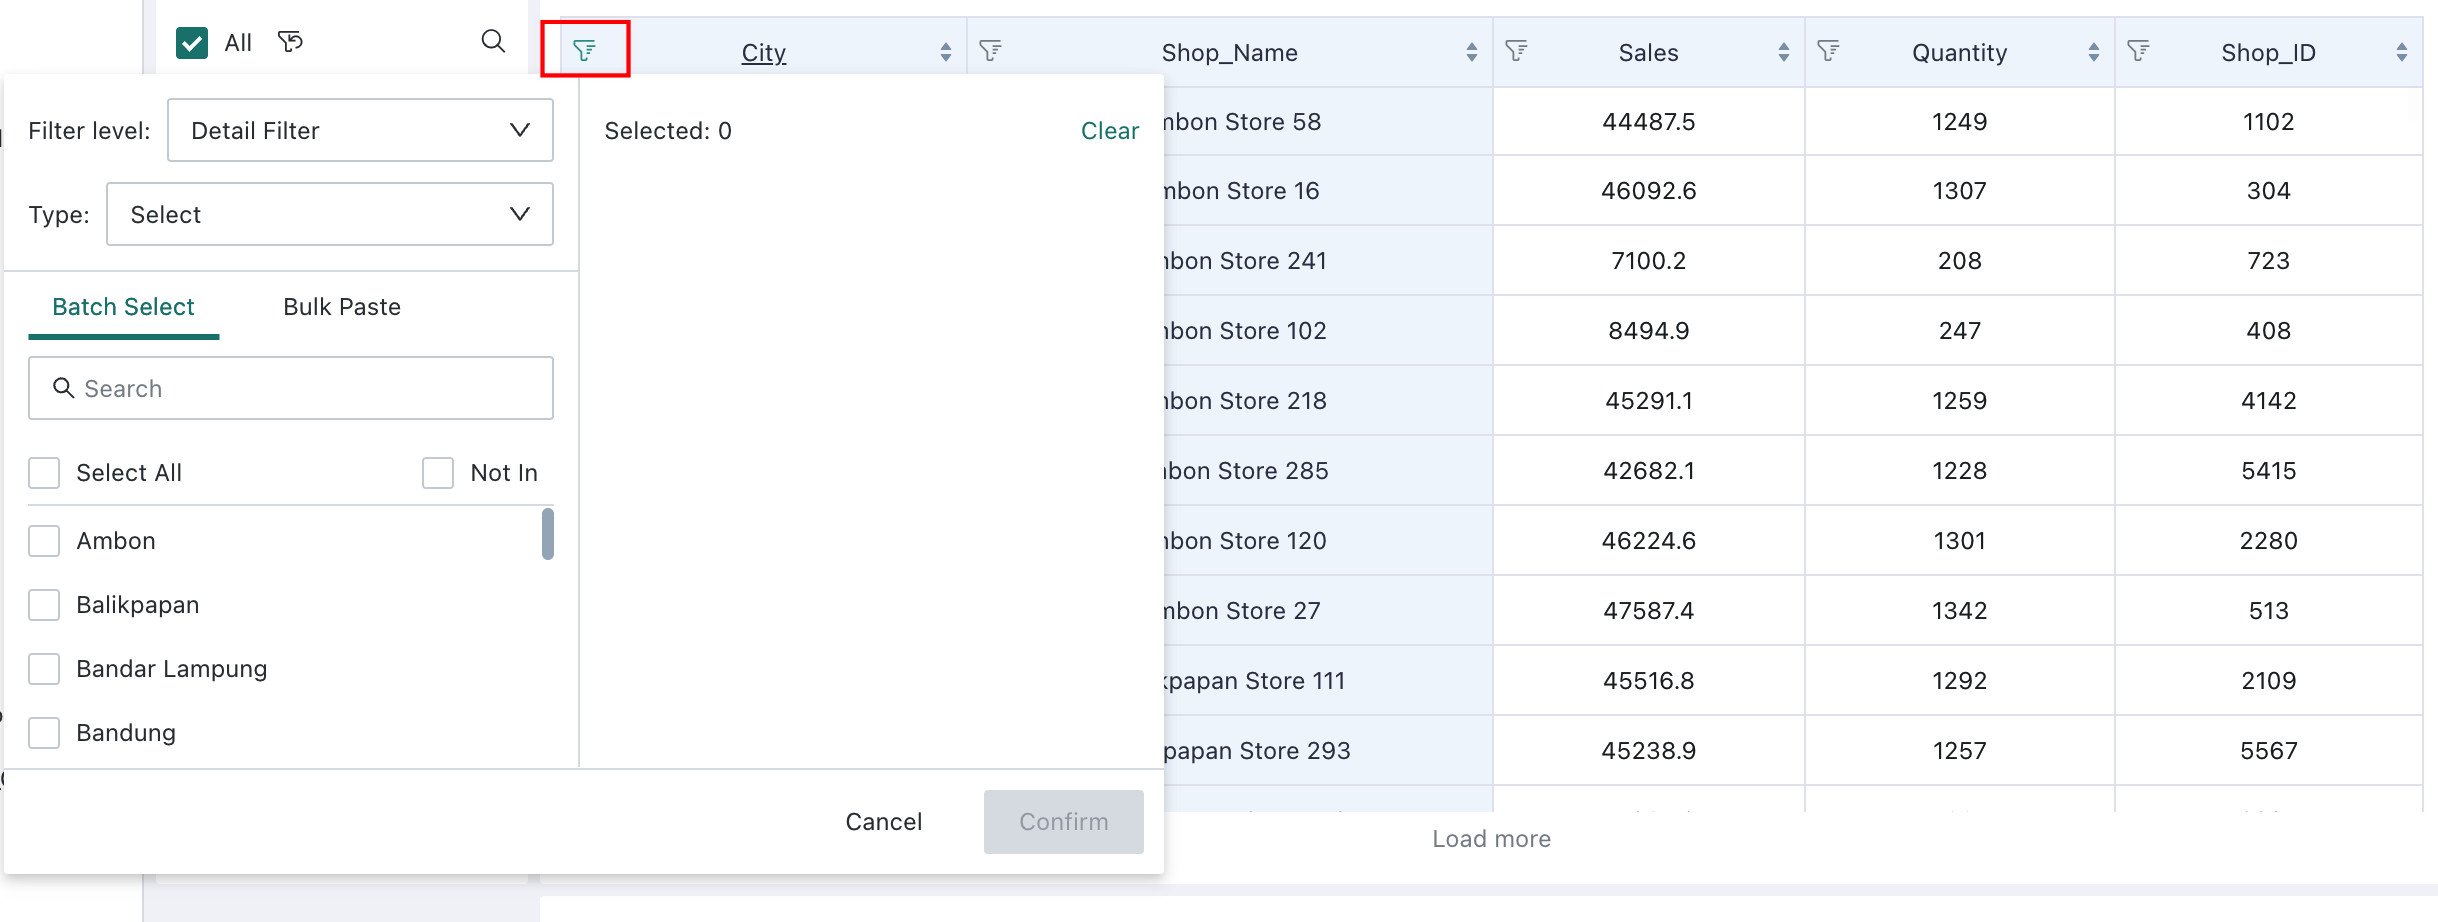
Header Filter
Guandata BI lets users apply filters directly from each field in the table header.
Click a header field, set the filter conditions, and click OK to apply the filter. The filter logic is the same as the one used in chart editing. For reference, see Charting.
Only numerical type fields support switching to aggregation filtering/result filtering when performing header filtering.