Table Calculation
Overview
Use Cases
During data analysis, charts built directly from raw data may not always satisfy deeper or more complex analytical needs. Table calculation allows you to further process and analyze aggregated data to support richer analytical scenarios. For example, you may want to rank summarized data or analyze the average sales amount in each region over the last 7 days.
Feature Overview
Table calculation does not require complex formulas or custom calculated fields. With intuitive visual configuration, it quickly supports a variety of common advanced calculations and nested calculations.
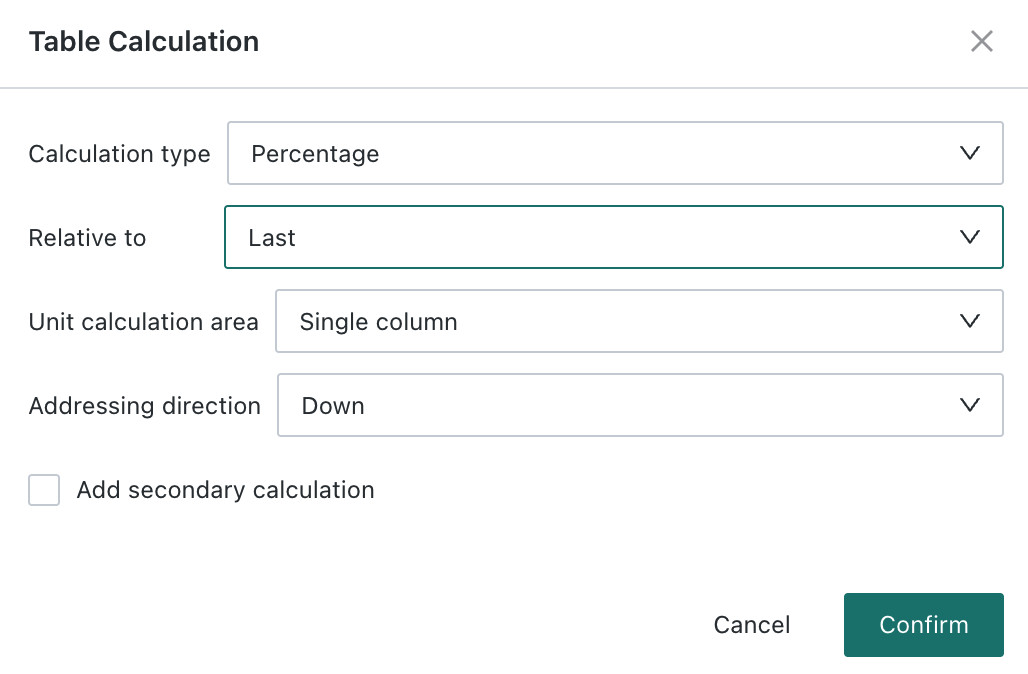
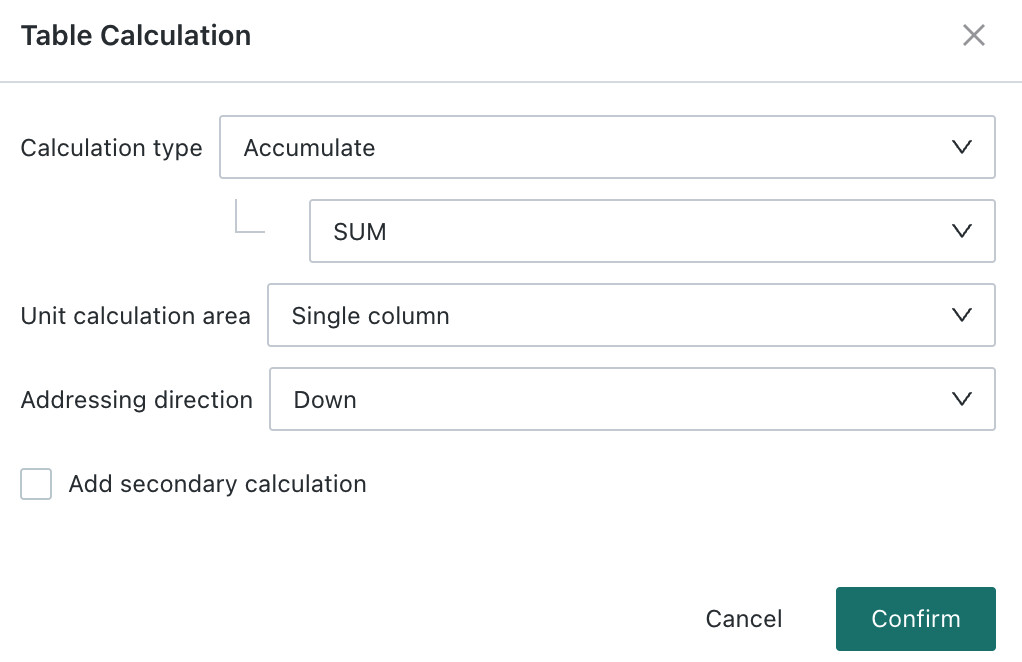
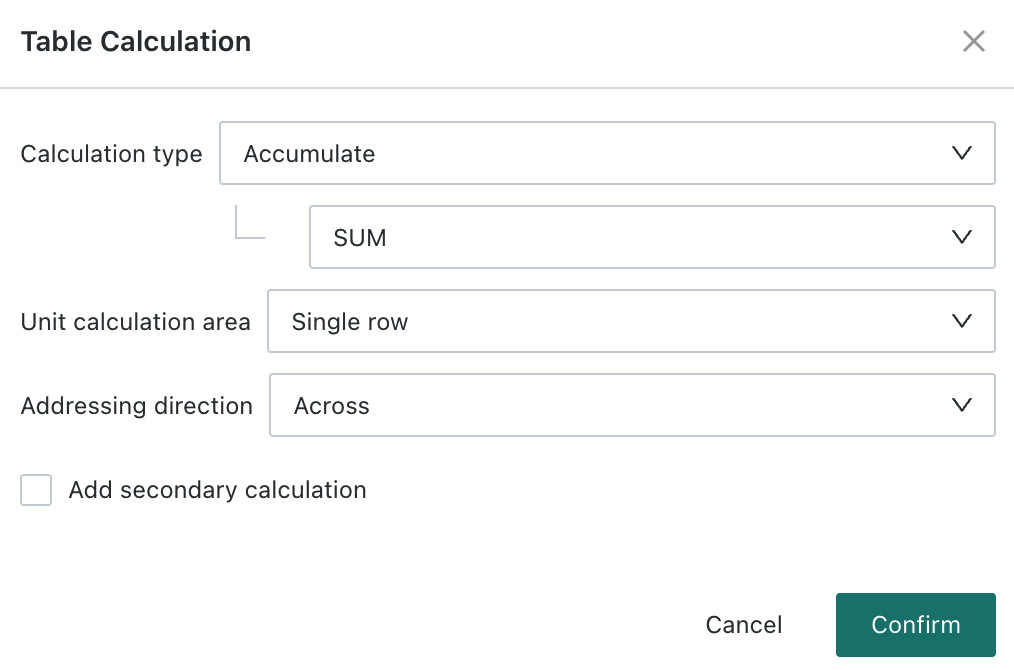
In the measures area, click the field to which you want to apply table calculation, then choose Advanced Calculation - Table Calculation from the drop-down menu to open the settings dialog.
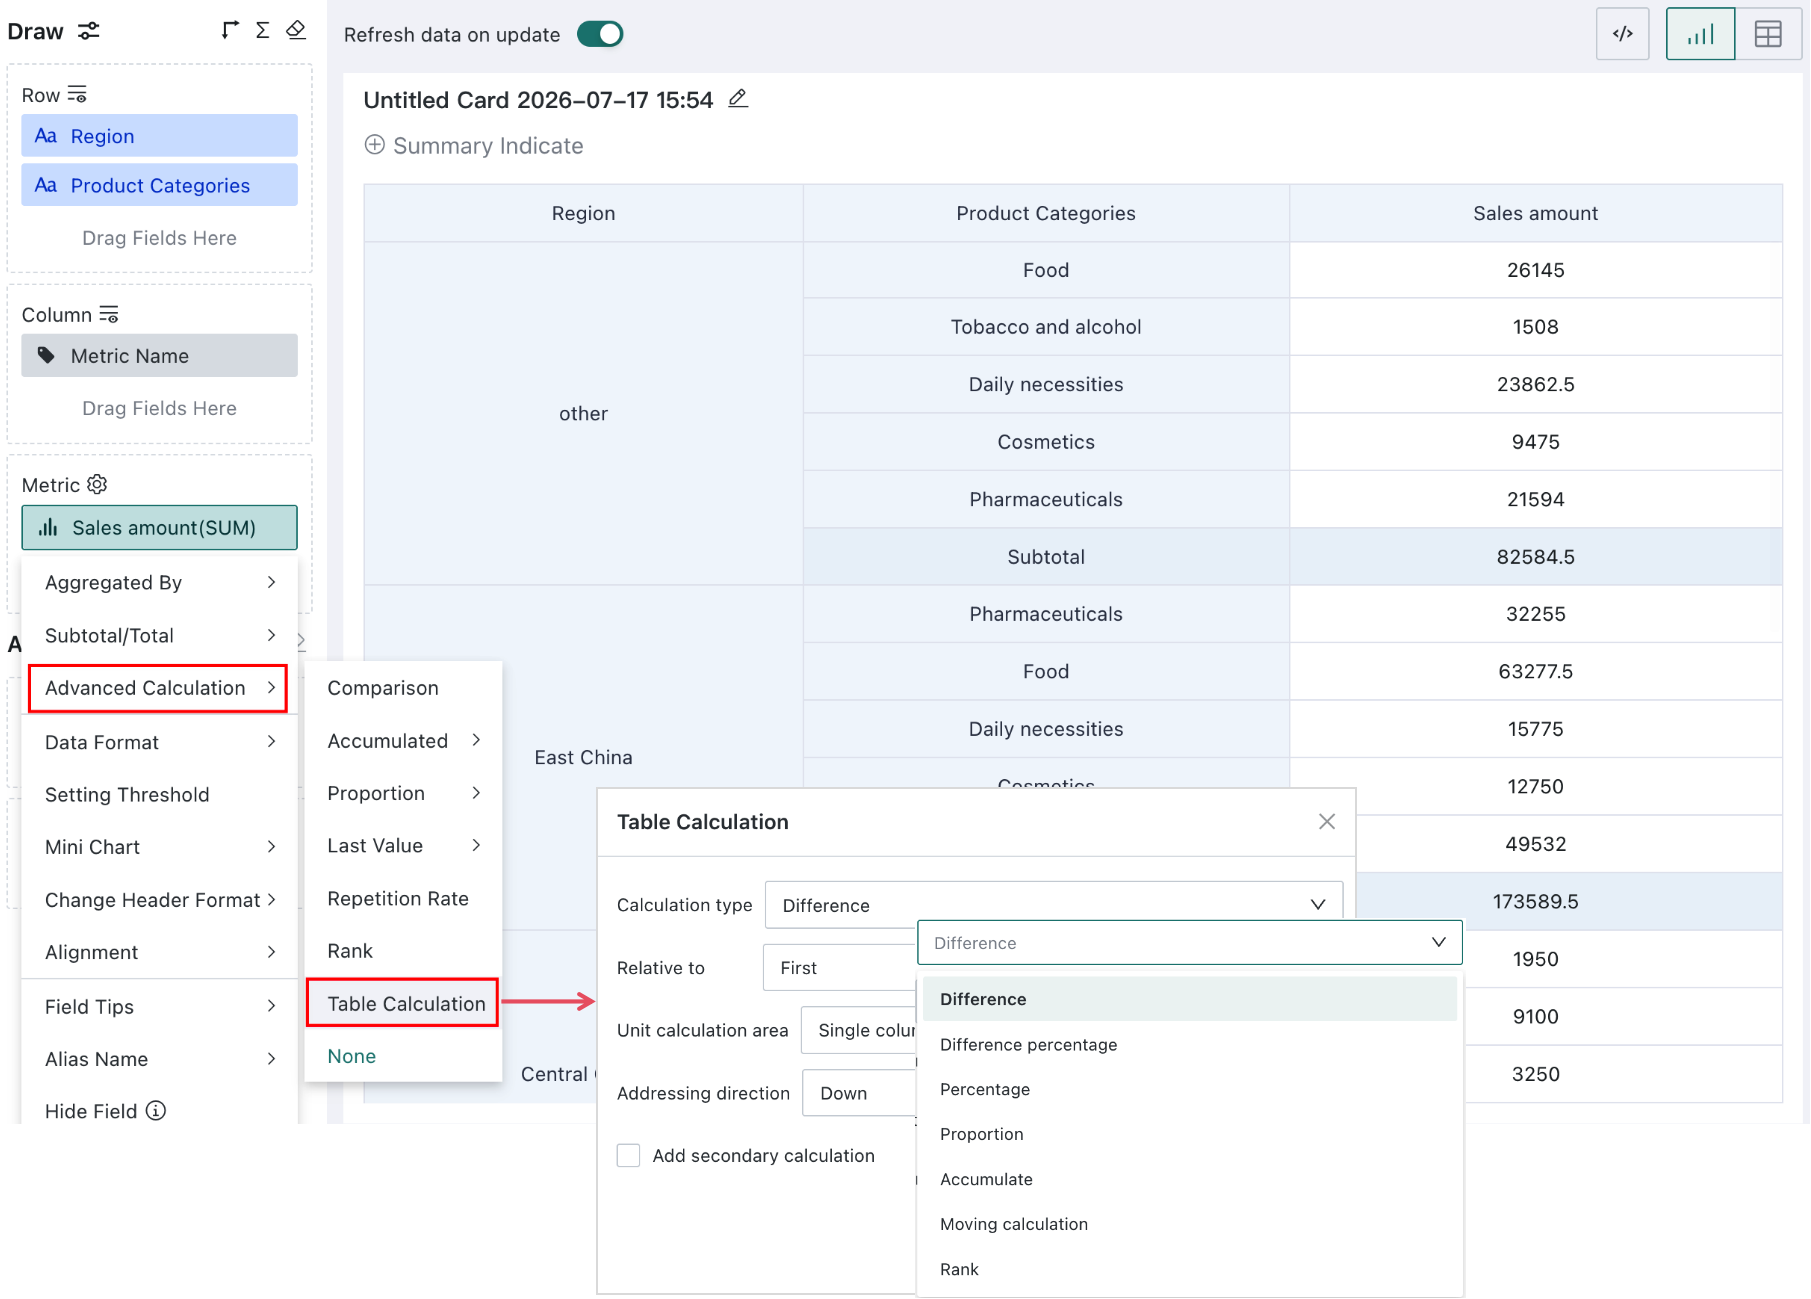
Table calculation mainly involves two steps: choosing the calculation type and choosing the calculation basis.
- Calculation Type: choose the method that best fits the current analytical need. Seven options are provided: Difference, Difference Percentage, Percentage, Percentage of Total, Cumulative, Moving Calculation, and Ranking.
- Calculation Basis: define whether the comparison is performed across the whole table or within a specific group, that is, determine the scope of the calculation.
Calculation Types
Table calculation provides seven calculation types: Difference, Difference Percentage, Percentage, Percentage of Total, Cumulative, Moving Calculation, and Ranking. Details are as follows:
Difference
Used to calculate the difference between the current value in the table and another value. Formula: Difference = Current Value - Comparison Value
You can calculate the difference relative to the first or last value in the selected area, or the previous or next value in the calculation unit. Both horizontal and vertical comparison are supported.
| First | Calculates the difference between the current value and the first value in the partition. |
| Previous | Calculates the difference between the current value and the previous value in the partition. |
| Next | Calculates the difference between the current value and the next value in the partition. |
| Last | Calculates the difference between the current value and the last value in the partition. |
%20Pasted%20image%2020260719214910.png) |
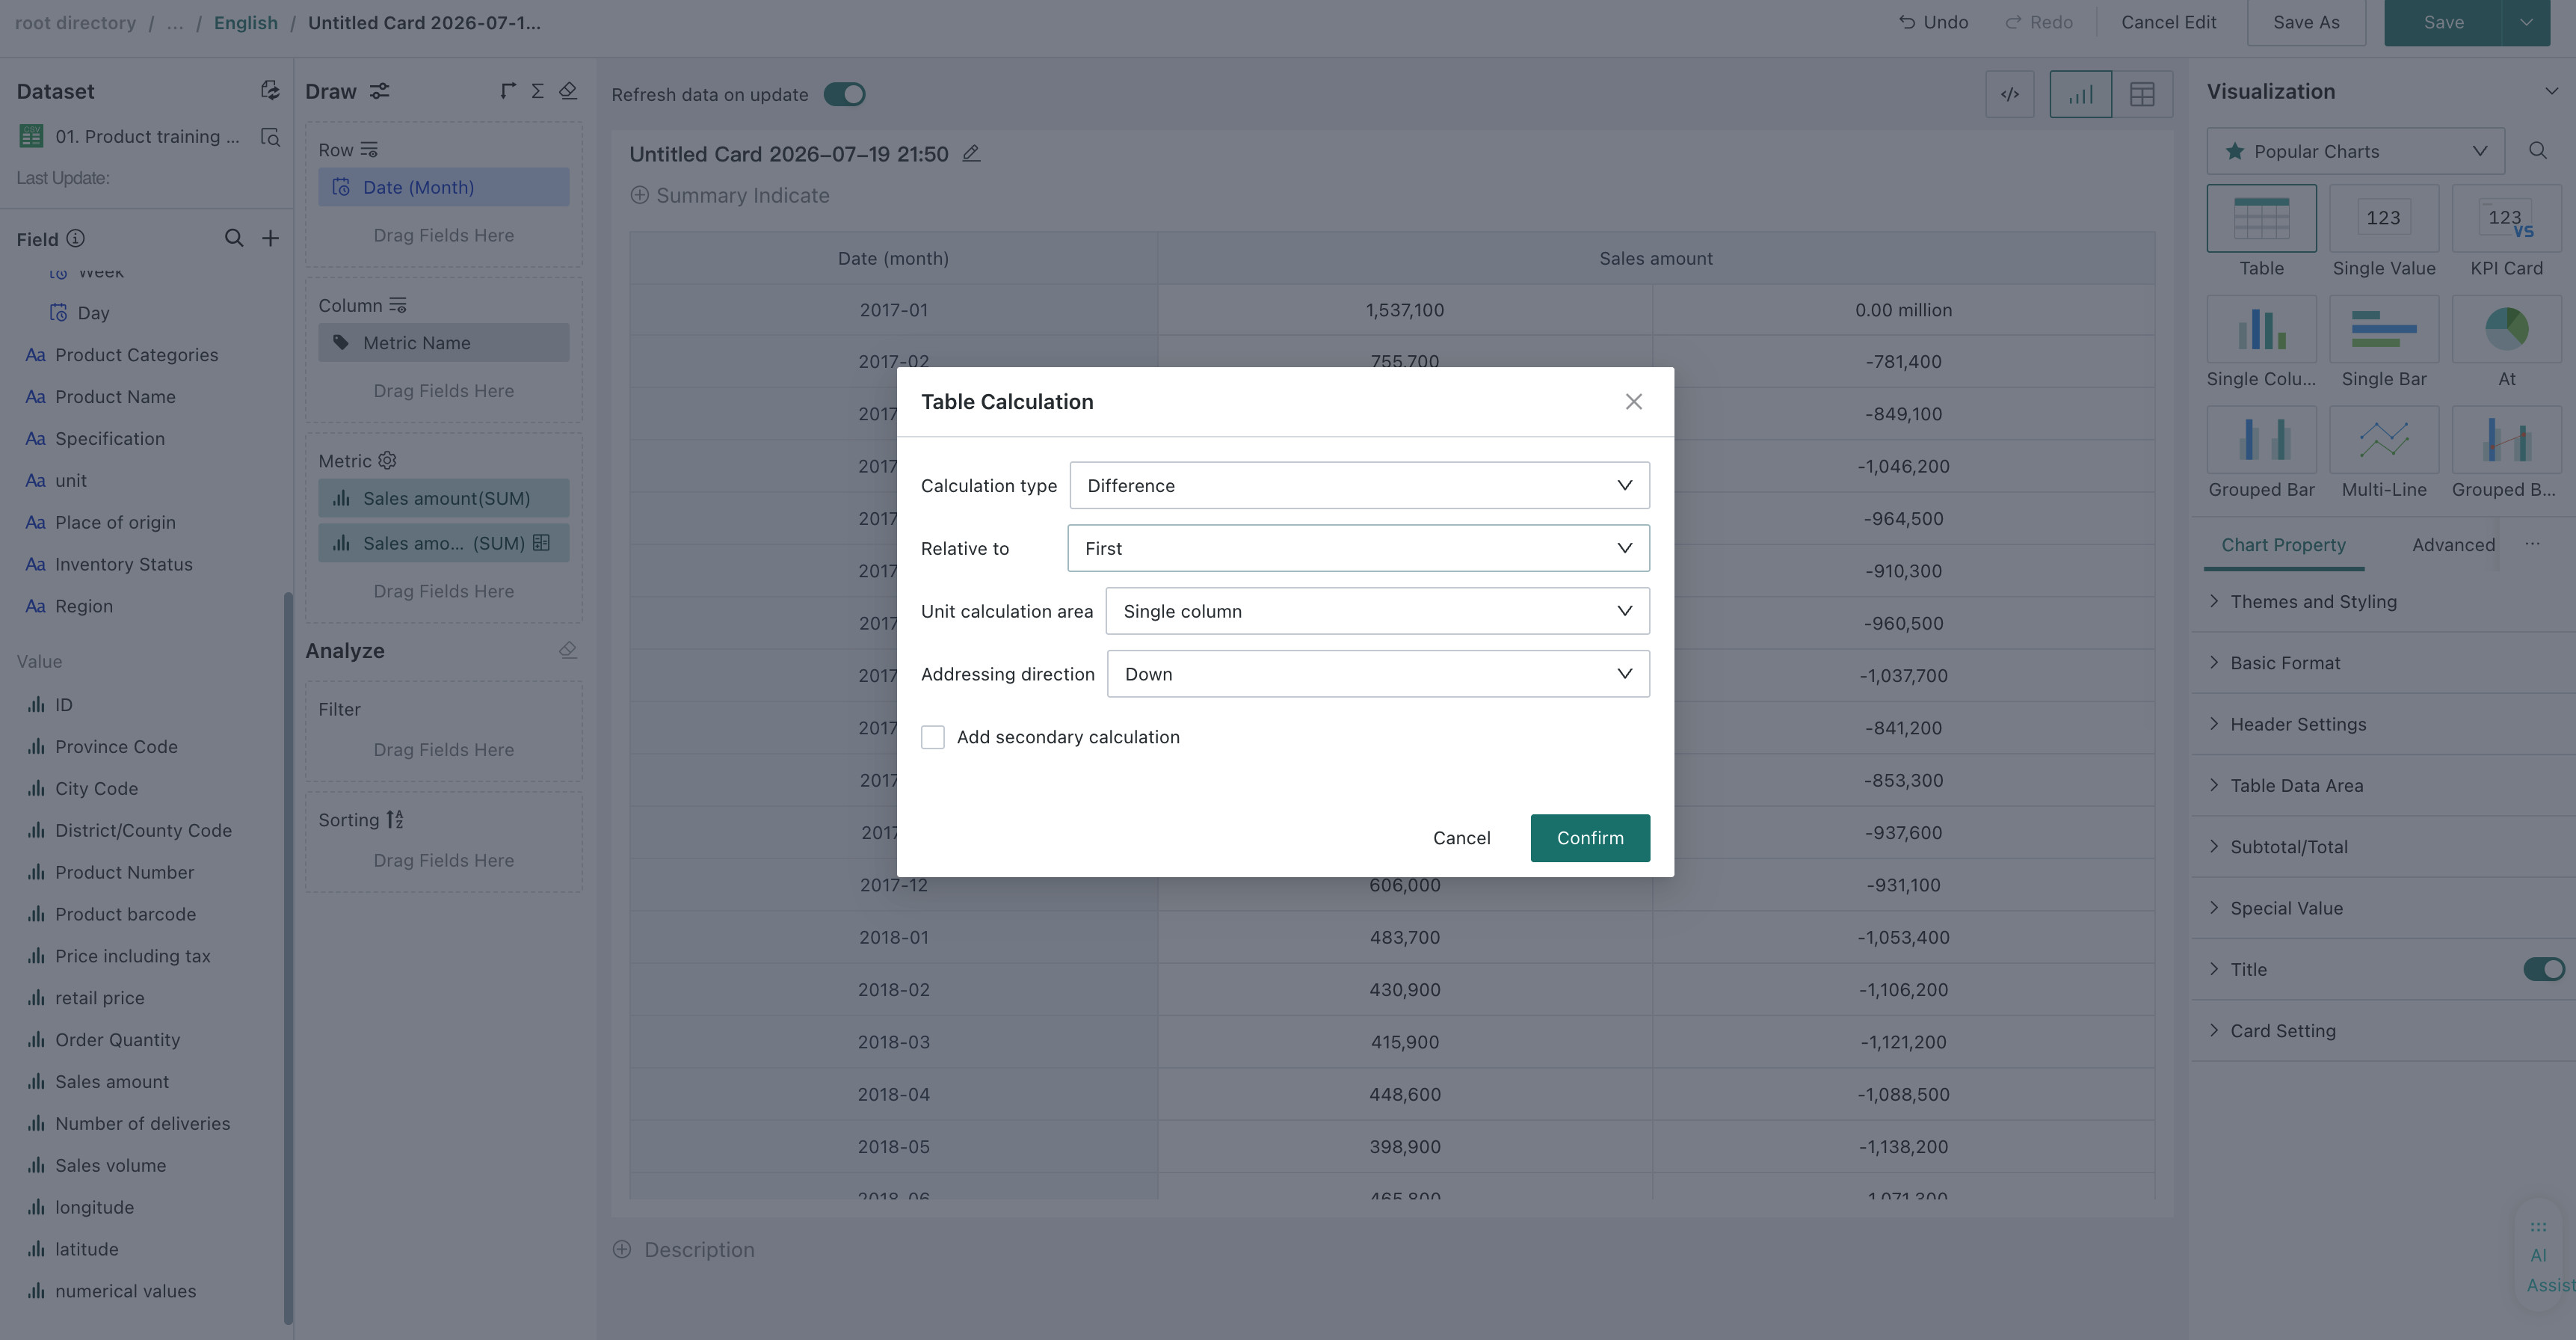
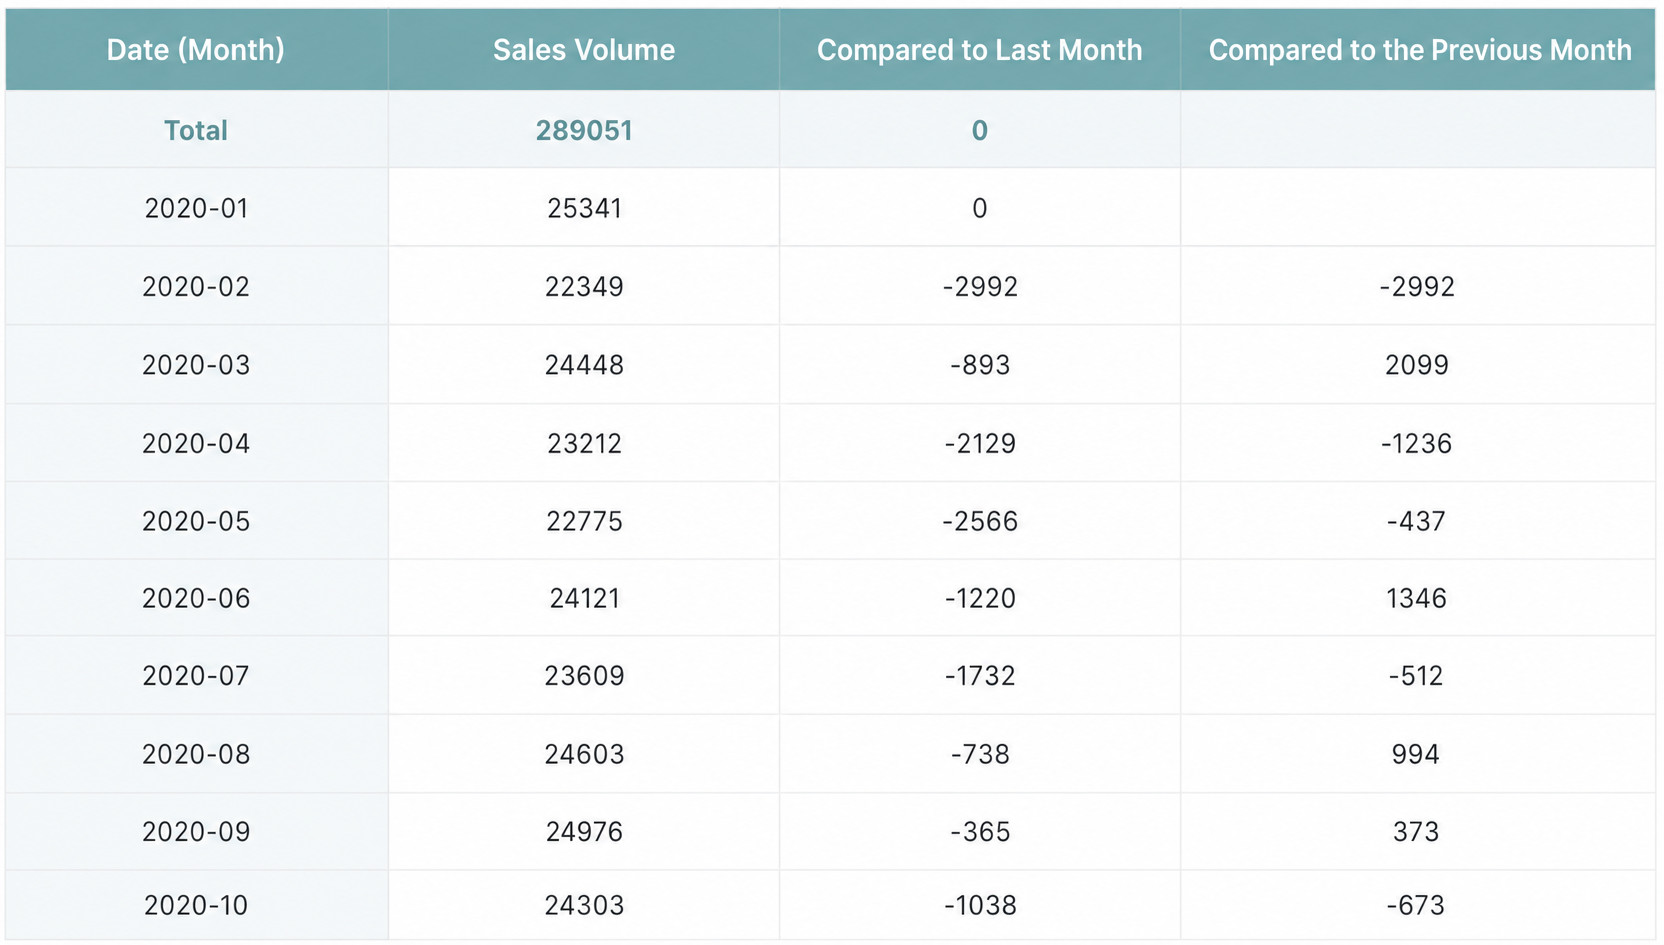
For example, to calculate the difference between monthly Sales Quantity in 2020 and the value at the beginning of the year, as well as the month-over-month change, follow these steps:
- Create a standard table, drag Date - Month into Dimensions, and drag Sales Quantity into Measures.
- In the measures area, set Sales Quantity to Advanced Calculation - Table Calculation. Choose Difference as the calculation type, and choose First or Previous as the reference value. Set the calculation unit area to Single Column and the addressing direction to Downward.
-
Difference from the beginning of the year: since the original table contains only 2020 data, choosing First compares each month with January.
-
Difference from the previous month: choosing Previous compares each month with the month before it.
The calculation unit area determines the scope of calculation in the current view. In this scenario, because there is only one dimension and no comparison dimension, Single Column and Whole Table produce the same result. The unit area and addressing direction are explained in more detail later in this article.
-
Click Confirm to finish adding the difference table calculation.
When comparing with the previous month, January 2020 has no earlier value, so the difference result is null.
Difference Percentage
Used to calculate the percentage difference between the current value and another value. Formula: Difference Percentage = (Current Value - Comparison Value) / Comparison Value
You can calculate the value relative to the first or last value in the selected area, or the previous or next value in the calculation unit. Both horizontal and vertical comparison are supported.
| First | Calculates the difference between the current value and the first value in the partition. |
| Previous | Calculates the difference between the current value and the previous value in the partition. |
| Next | Calculates the difference between the current value and the next value in the partition. |
| Last | Calculates the difference between the current value and the last value in the partition. |
%20Pasted%20image%2020260719215652.png)
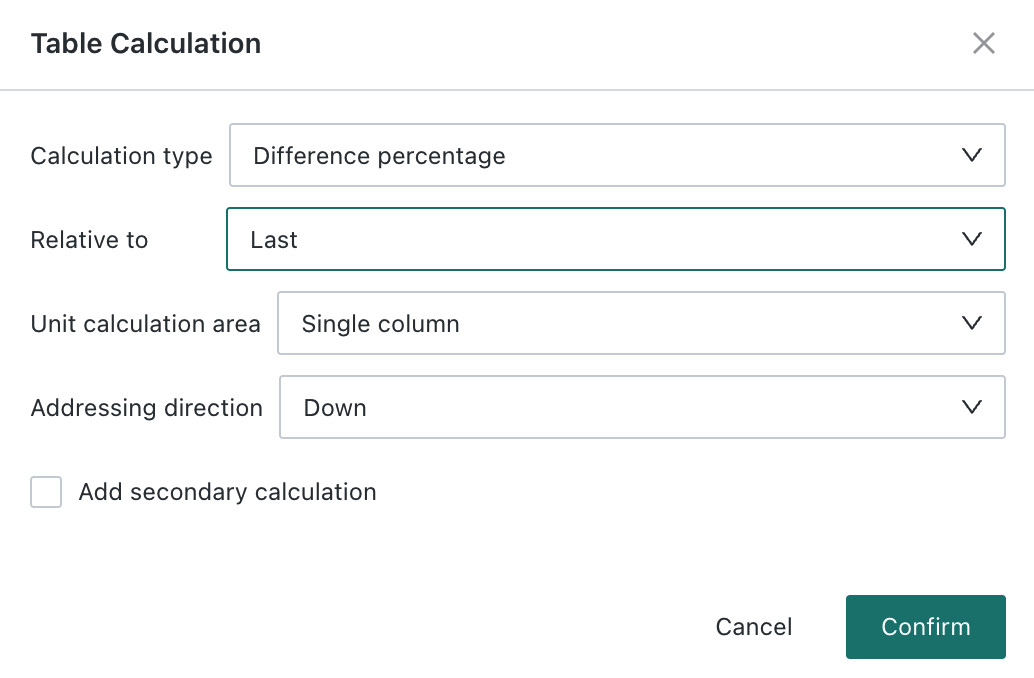
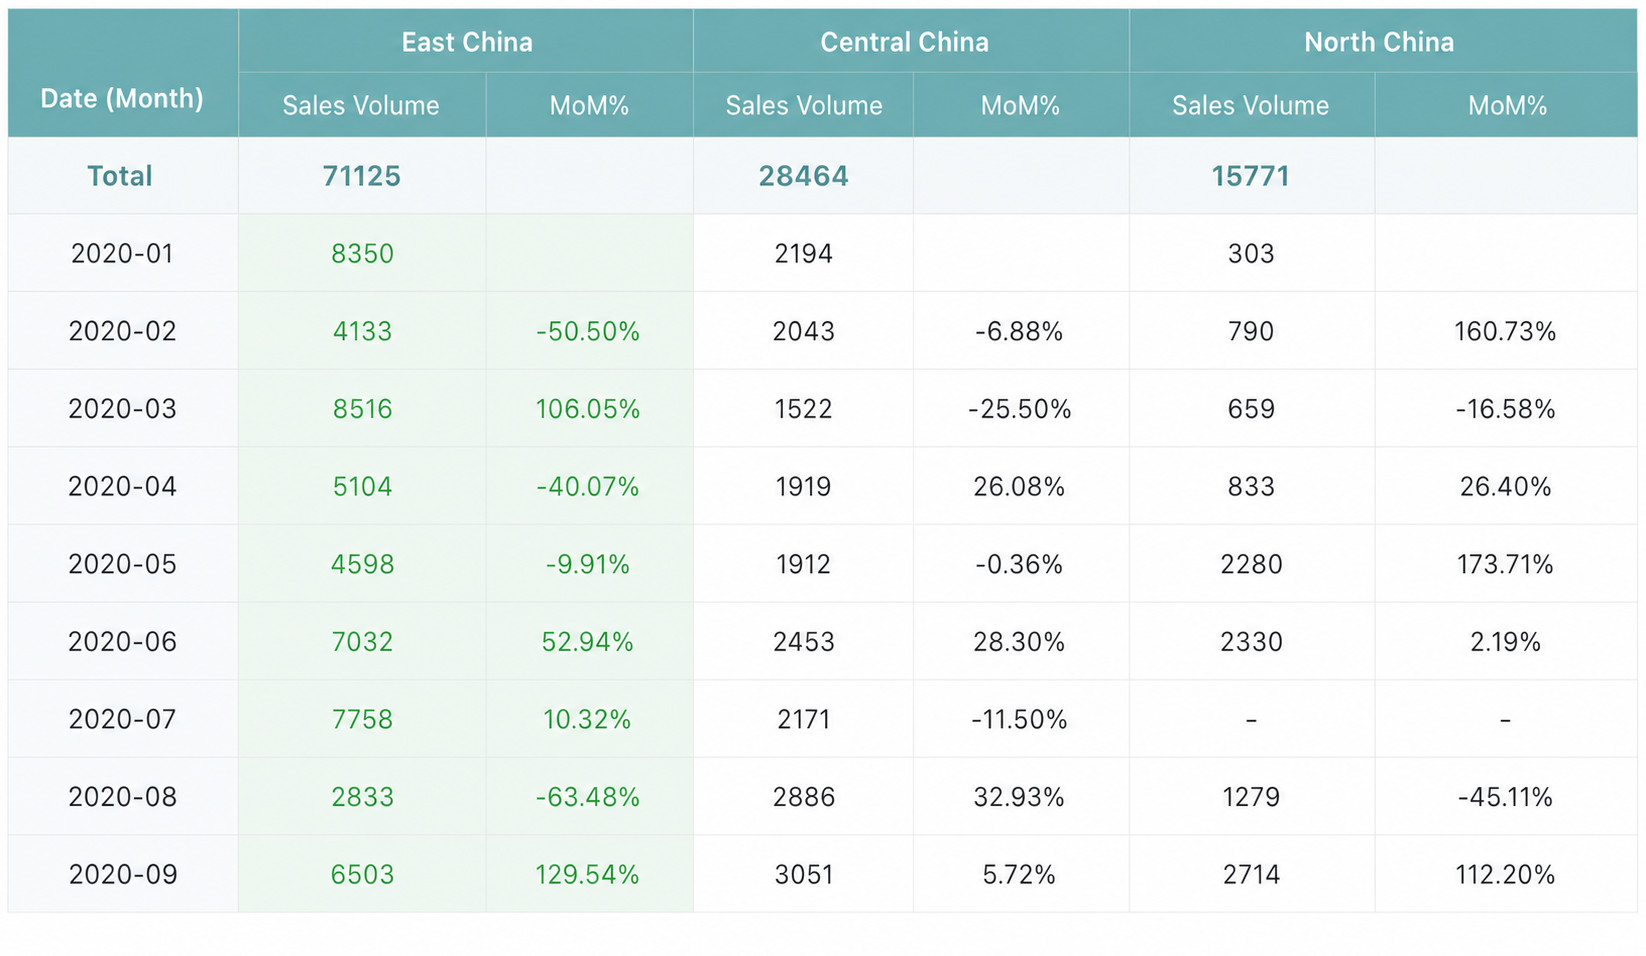
For example, to calculate the month-over-month change in Sales Quantity for each region in 2020, follow these steps:
-
Create a standard table. Drag Date - Month into Dimensions, Region into Comparison, and Sales Quantity into Measures.
-
In the measures area, set Sales Quantity to Advanced Calculation - Table Calculation. Choose Difference Percentage as the calculation type, set the reference to Previous, set the calculation unit area to Single Column, and set the addressing direction to Downward.
The calculation unit area determines the calculation scope, and the addressing direction determines the calculation direction. In this scenario, the dimension field is date and the comparison field is region, so each region must first be treated as a partition and then calculated downward by single column. The unit area and addressing direction are explained later in this article.
-
Click Confirm to finish adding the difference percentage table calculation.
Take East China as an example: the result shows the month-over-month growth rate of sales quantity within East China.
Percentage
Used to calculate the ratio between the current value in the table and another value. Formula: Percentage = Current Value / Comparison Value
You can calculate the ratio relative to the first or last value in the selected area, or the previous or next value in the calculation unit. Both horizontal and vertical comparison are supported.
| First | Calculates the ratio between the current value and the first value in the partition. |
| Previous | Calculates the ratio between the current value and the previous value in the partition. |
| Next | Calculates the ratio between the current value and the next value in the partition. |
| Last | Calculates the ratio between the current value and the last value in the partition. |
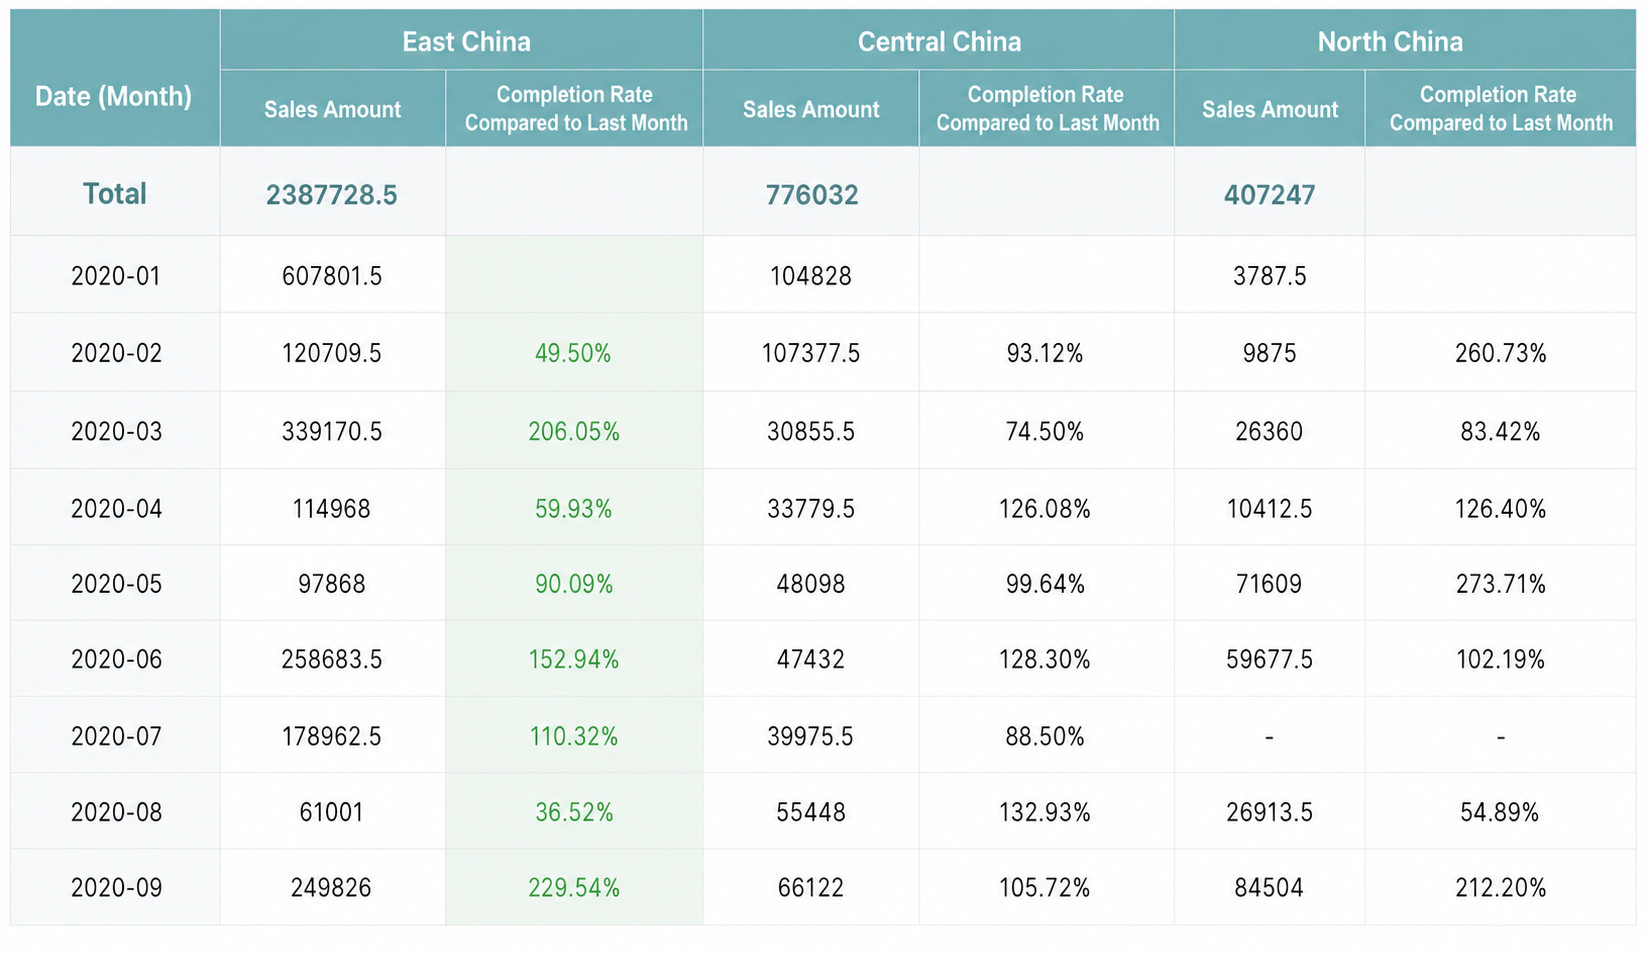
For example, if the table displays the total monthly sales amount of a store in 2020, you can use Percentage to calculate how much of the previous month's sales amount the current month has achieved.
-
Create a standard table. Drag Date - Month into Dimensions, Region into Comparison, and Sales Amount into Measures.
-
In the measures area, set Sales Amount to Advanced Calculation - Table Calculation. Choose Percentage as the calculation type, set the reference to Previous, set the calculation unit area to Single Column, and set the addressing direction to Downward.
In this scenario, the dimension field is date and the comparison field is region, so each region must first be treated as a partition and then calculated downward by single column. The unit area and addressing direction are explained in more detail later in this article.
-
Click Confirm to finish adding the percentage table calculation.
Take East China as an example: in February 2020, the sales amount reached 49.5% of the amount achieved in January 2020; in March 2020, it reached 206.05% of the amount achieved in February 2020.
Percentage of Total
Used to calculate the share of the current value in the table against the metric total within the selected area. Formula: Percentage of Total = Current Value / Metric Total in Selected Area
You can calculate Percentage of Total by single column, single row, whole table, or area. Under this calculation type, the addressing direction has no practical effect.
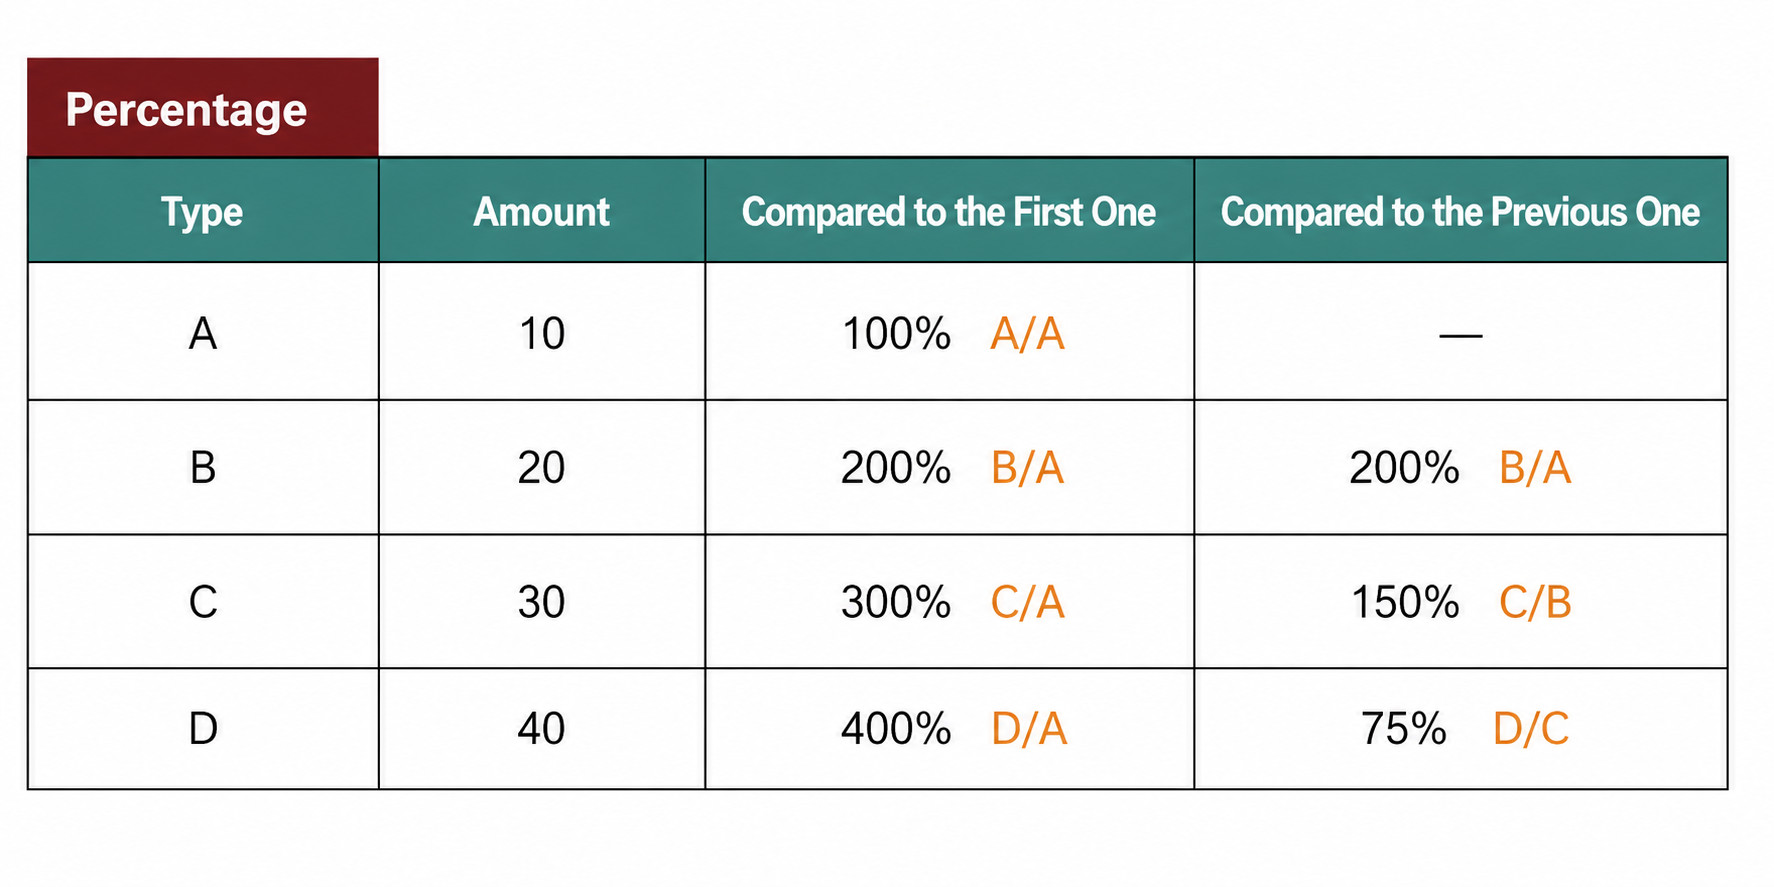
Difference Between Percentage of Total and Percentage
- Percentage of Total usually describes the proportional relationship between a part and the whole.
- Percentage is a unitless mathematical concept that indicates what fraction one number is of another.
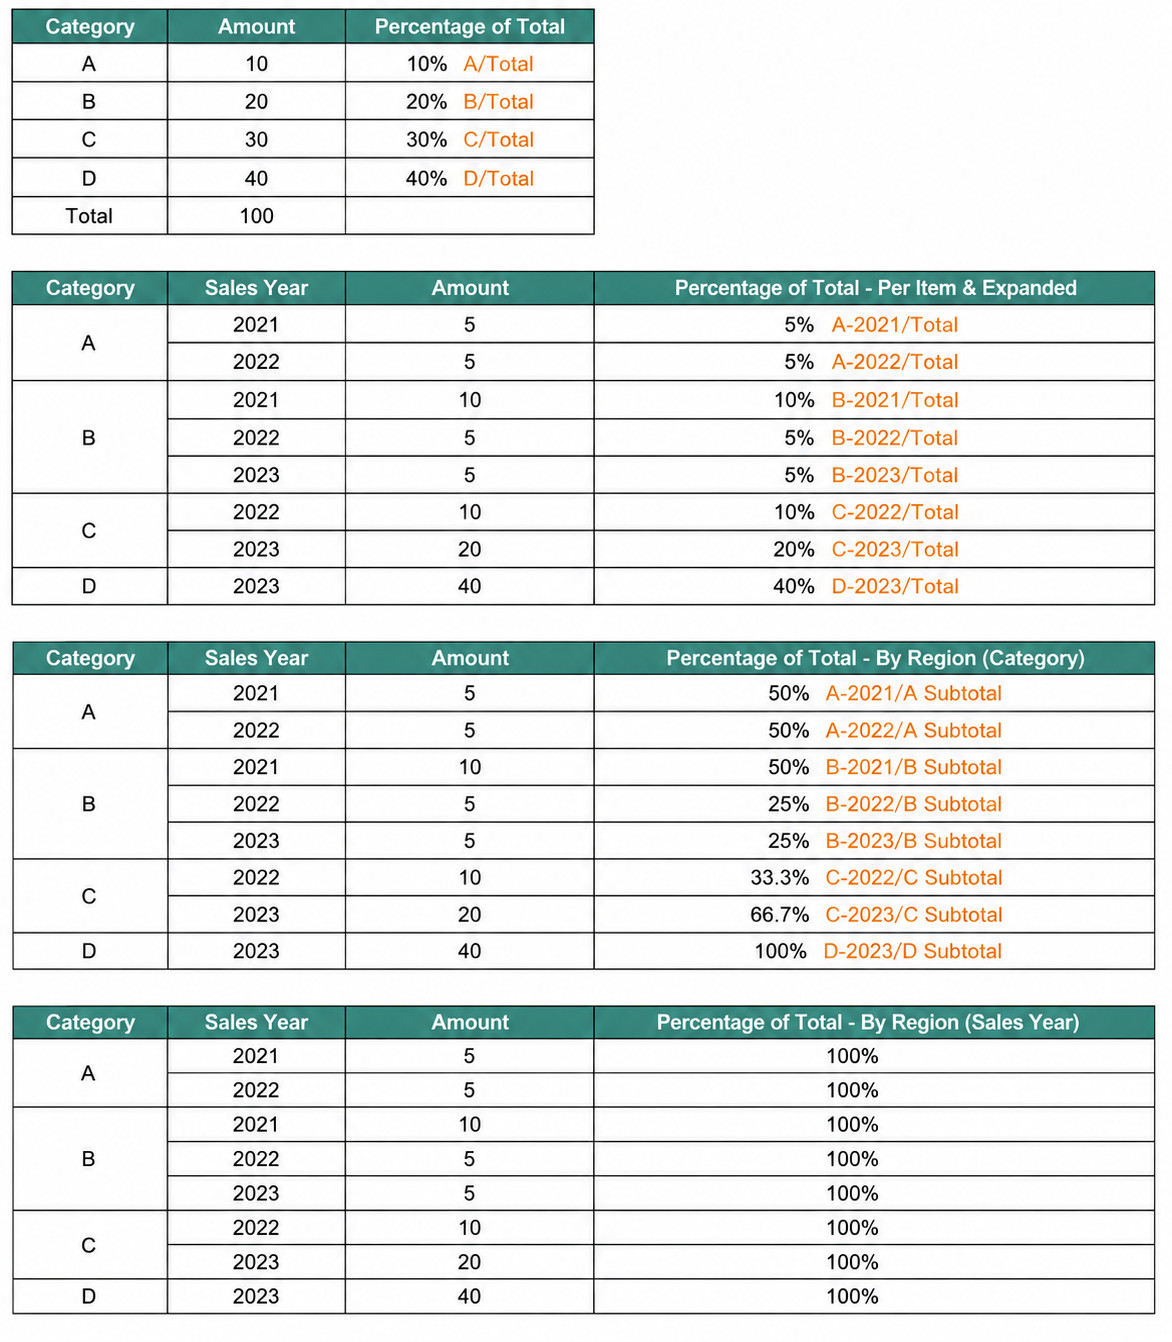
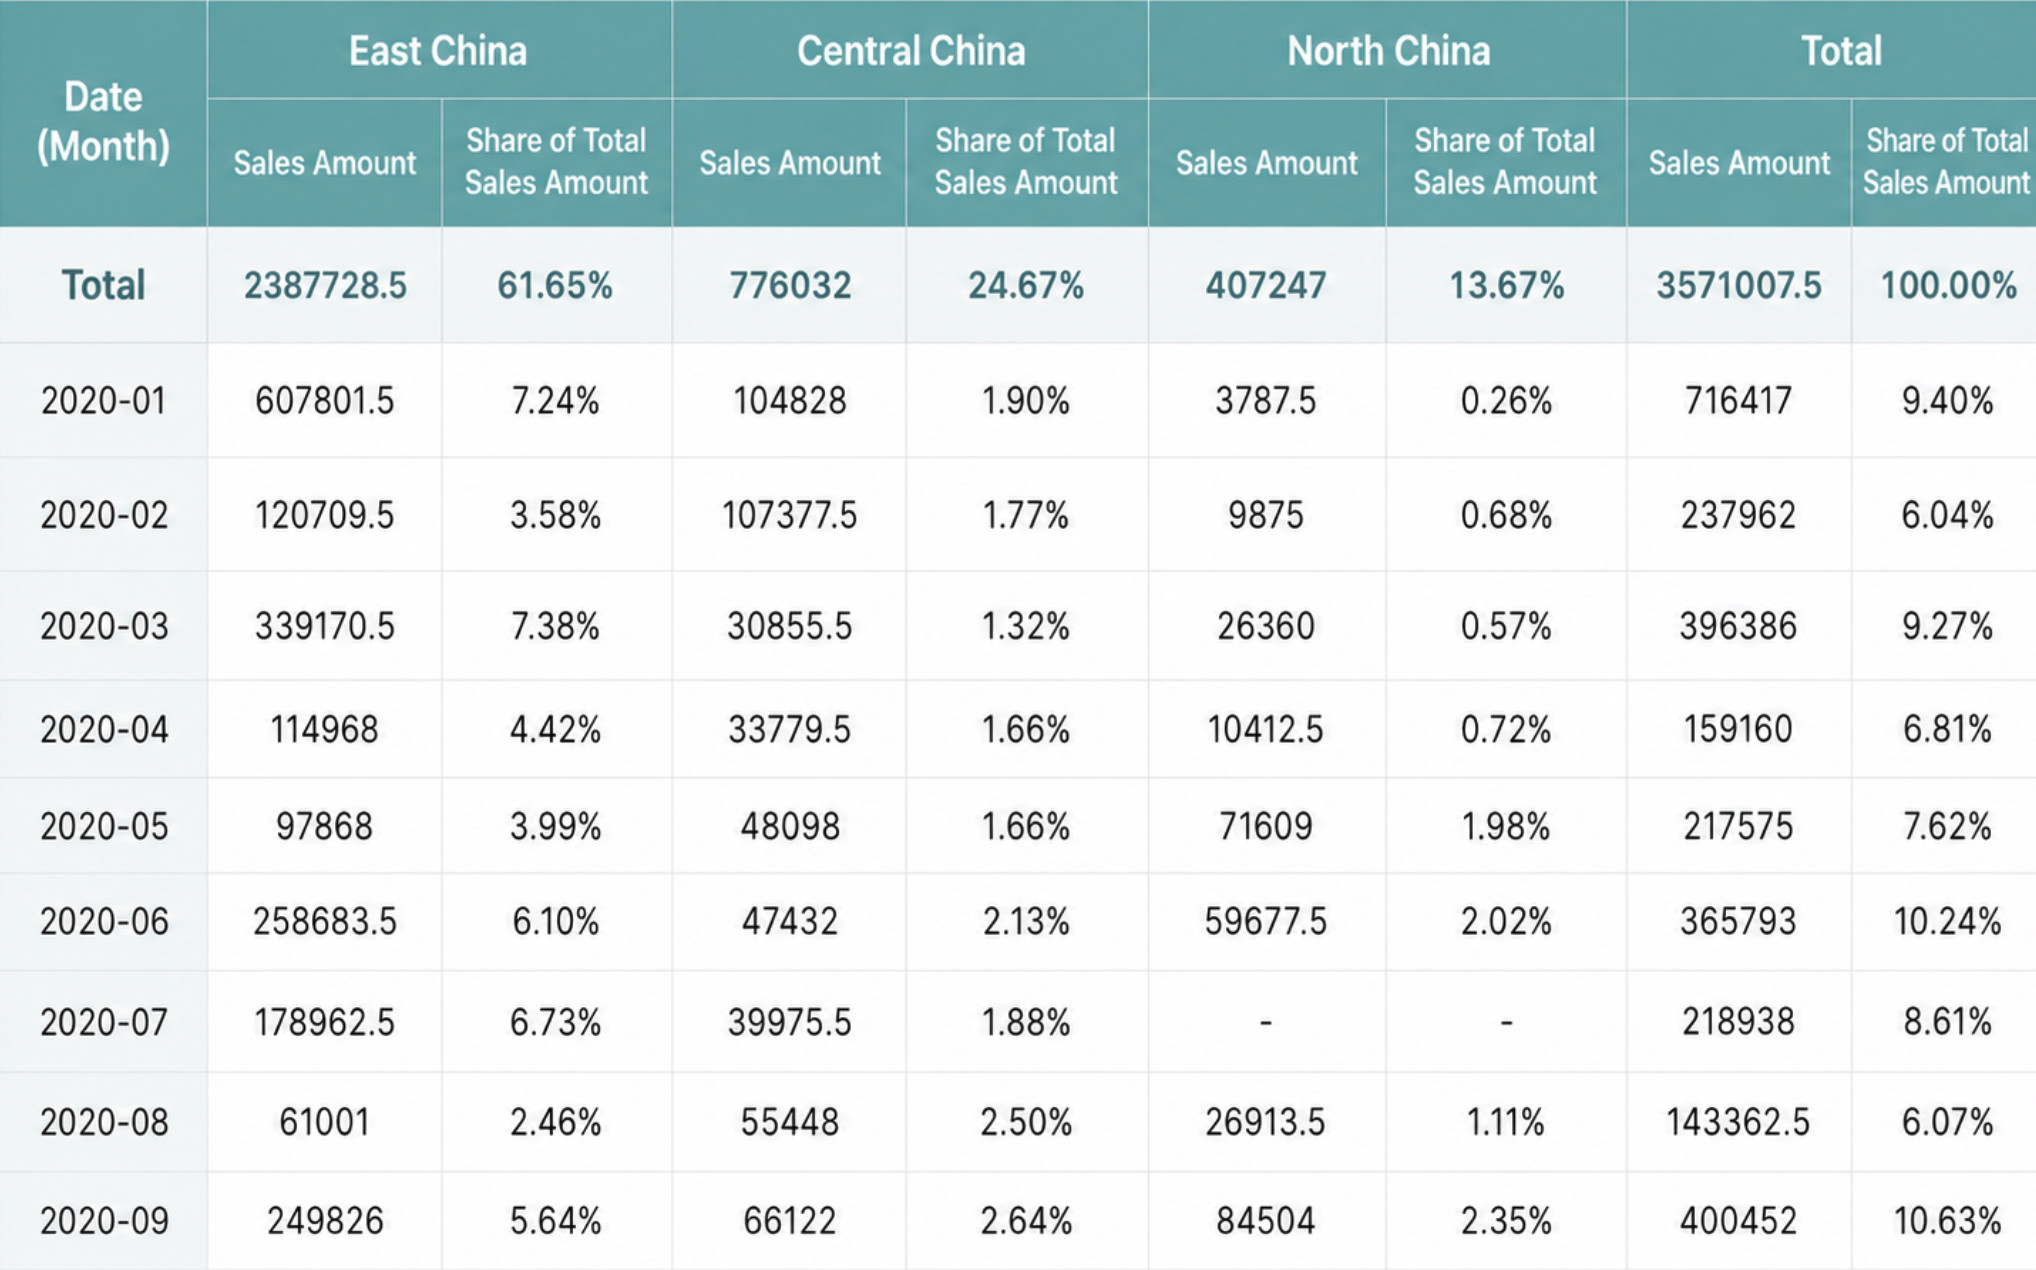
For example, if the table displays the total monthly sales amount of a store in 2020, you can calculate the share of each region's monthly sales amount within that region's total sales amount, or within the total sales amount of all regions.
Scenario 1: Calculate the proportion of each region's monthly sales amount within that region's total sales amount.
-
Create a standard table. Drag Date - Month into Dimensions, Region into Comparison, and Sales Amount into Measures.
-
In the measures area, set Sales Amount to Advanced Calculation - Table Calculation and choose Percentage of Total as the calculation type.
-
To calculate the proportion of sales amount within each region, set the calculation unit area to Area, the row depth to
0, and the column depth to1. This means the data is partitioned by region, and the share is calculated across all months of 2020 within each region. The shares within each region sum to 100%.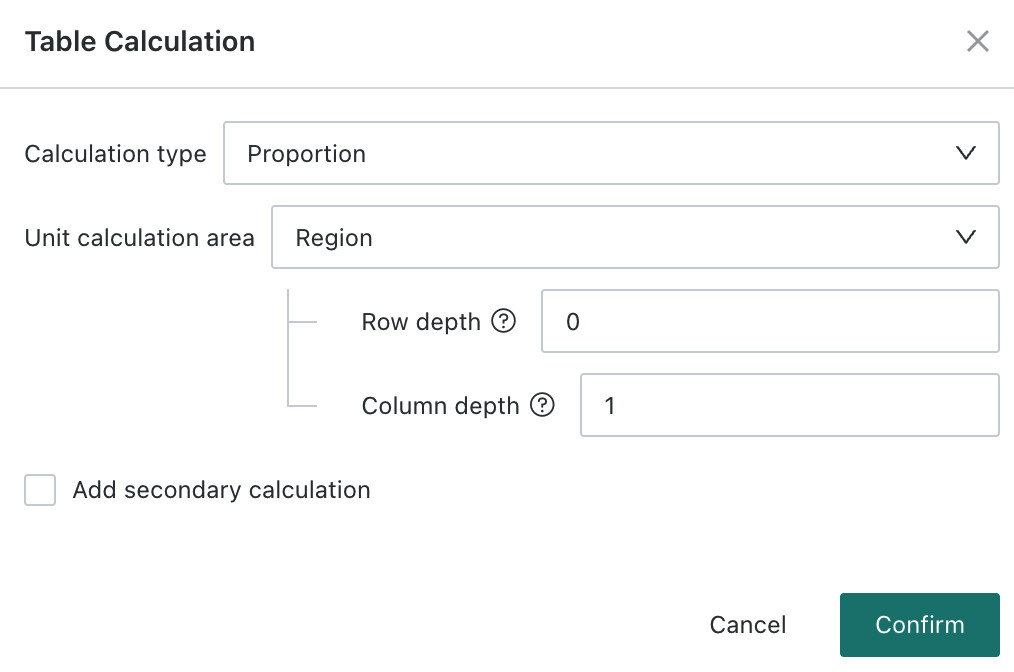
-
Click Confirm to finish adding the percentage-of-total table calculation. Taking East China as an example, the February 2020 sales amount accounts for 5.06% of the total sales amount of East China.
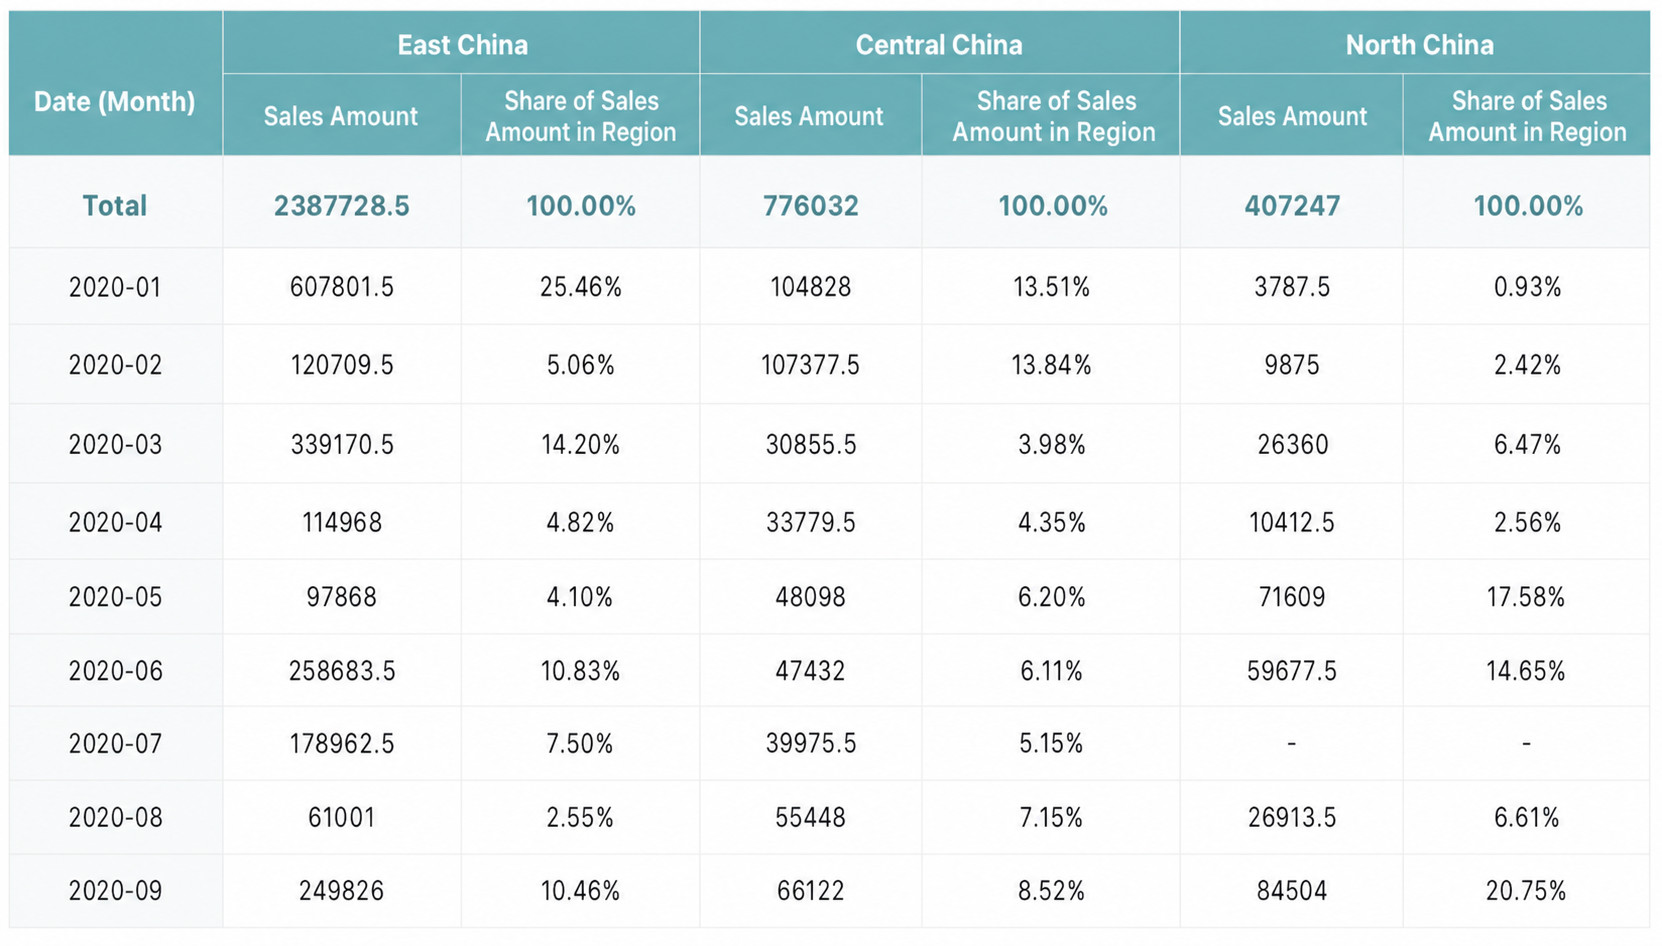
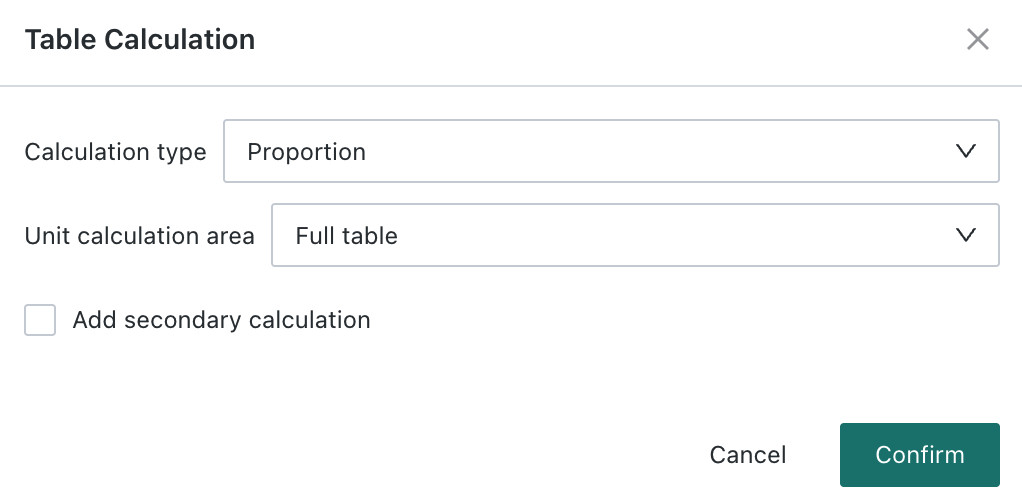
Scenario 2: Calculate the proportion of each region's monthly sales amount within the total sales amount of all regions.
Because the goal is to calculate the share of each region's monthly sales amount within the total sales amount of all regions, set the calculation unit area to Whole Table. This means the value of each region and each month is calculated as a percentage of the grand total sales amount across all regions.
Click Confirm to finish adding the percentage-of-total table calculation. Taking East China in February 2020 as an example, the sales amount accounts for 3.58% of the total sales amount across all regions.
Cumulative
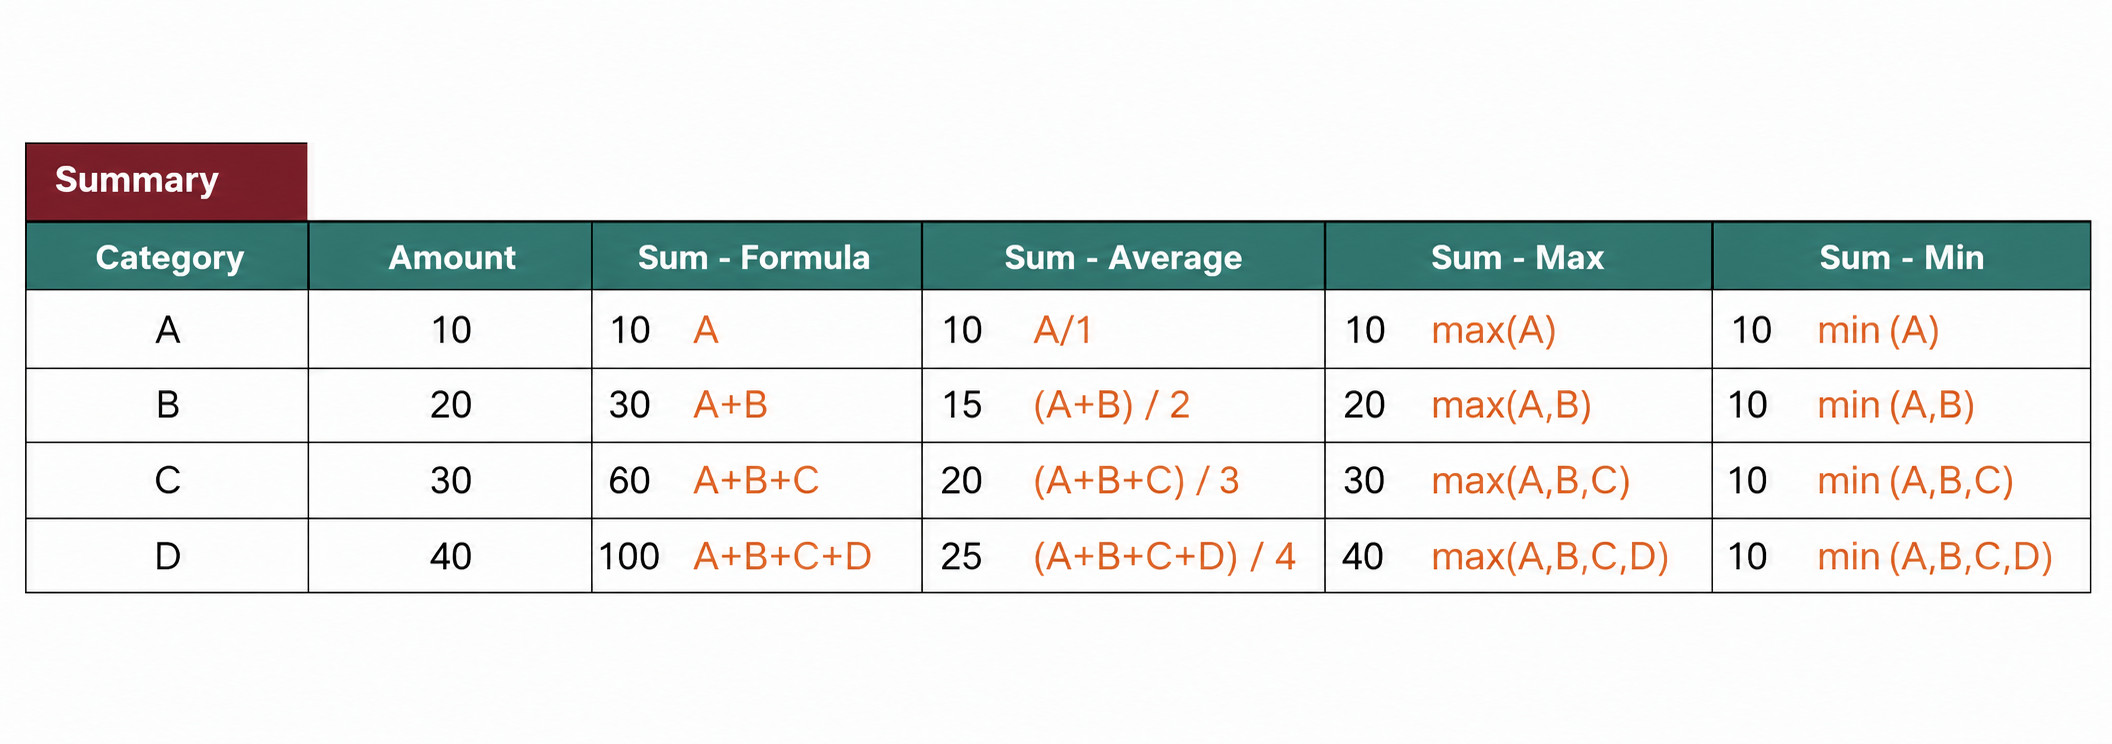
Used to calculate cumulative values of ordered metrics within the selected area. Four calculation subtypes are supported: Sum, Average, Maximum, and Minimum.
- Sum: each value is added to the previous value.
- Average: the current value is averaged with all previous values.
- Minimum: all values are replaced by the minimum value in the original partition.
- Maximum: all values are replaced by the maximum value in the original partition.
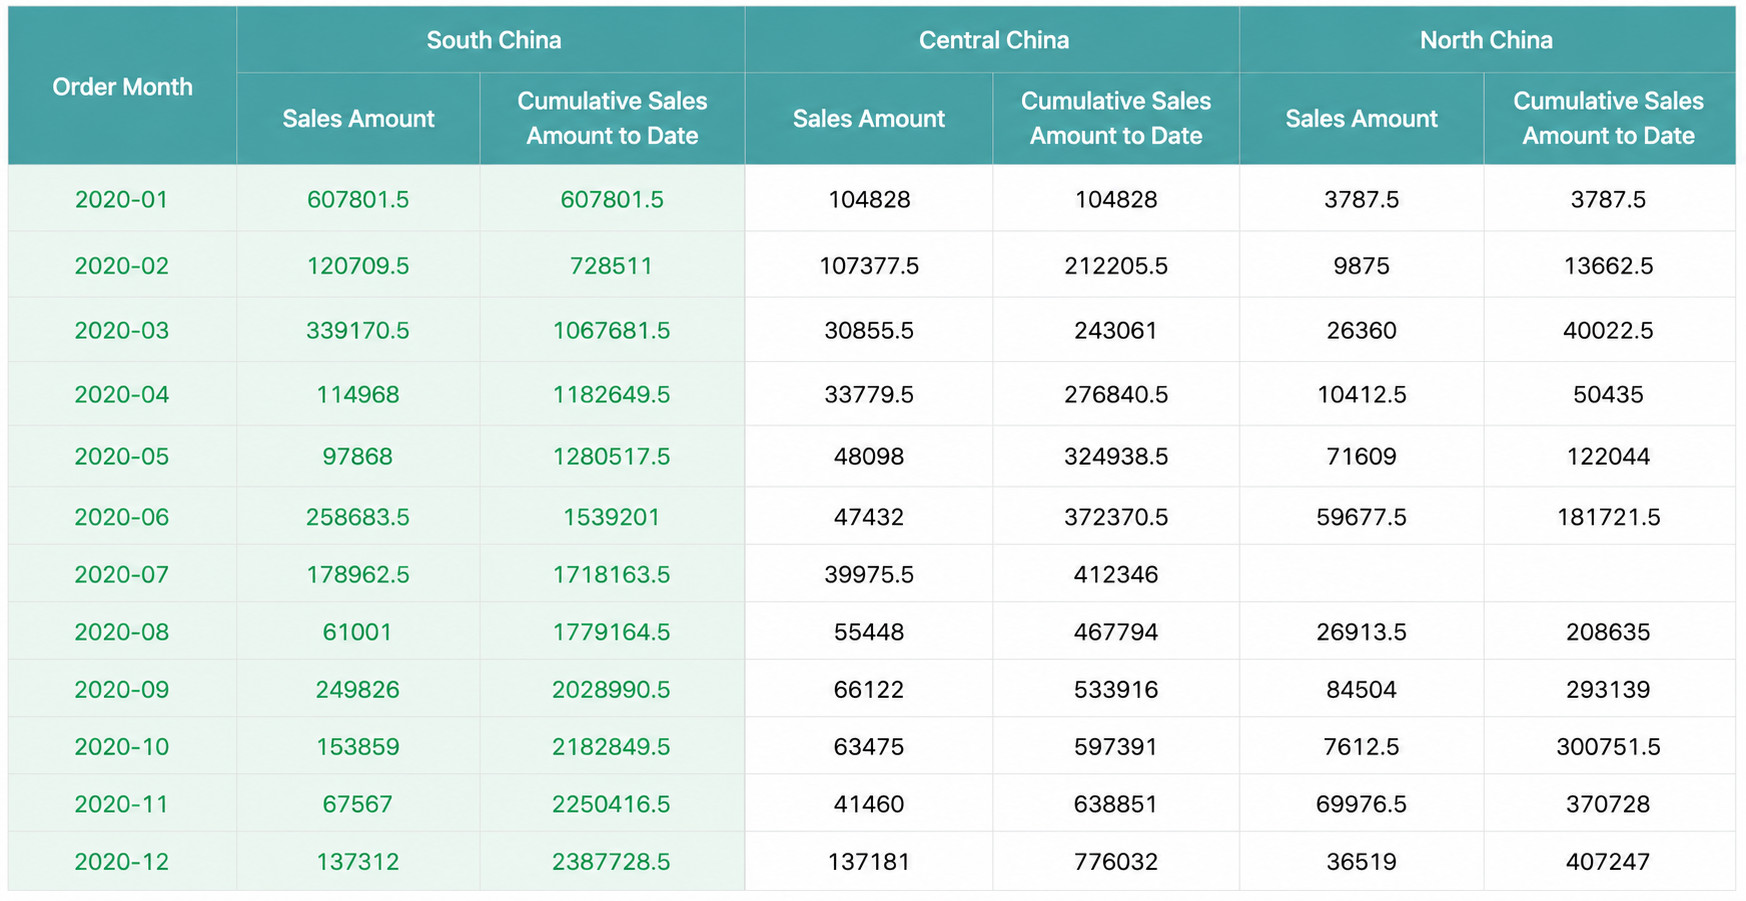
For example, the following table shows the monthly sales amount of each region in 2020 for a store.
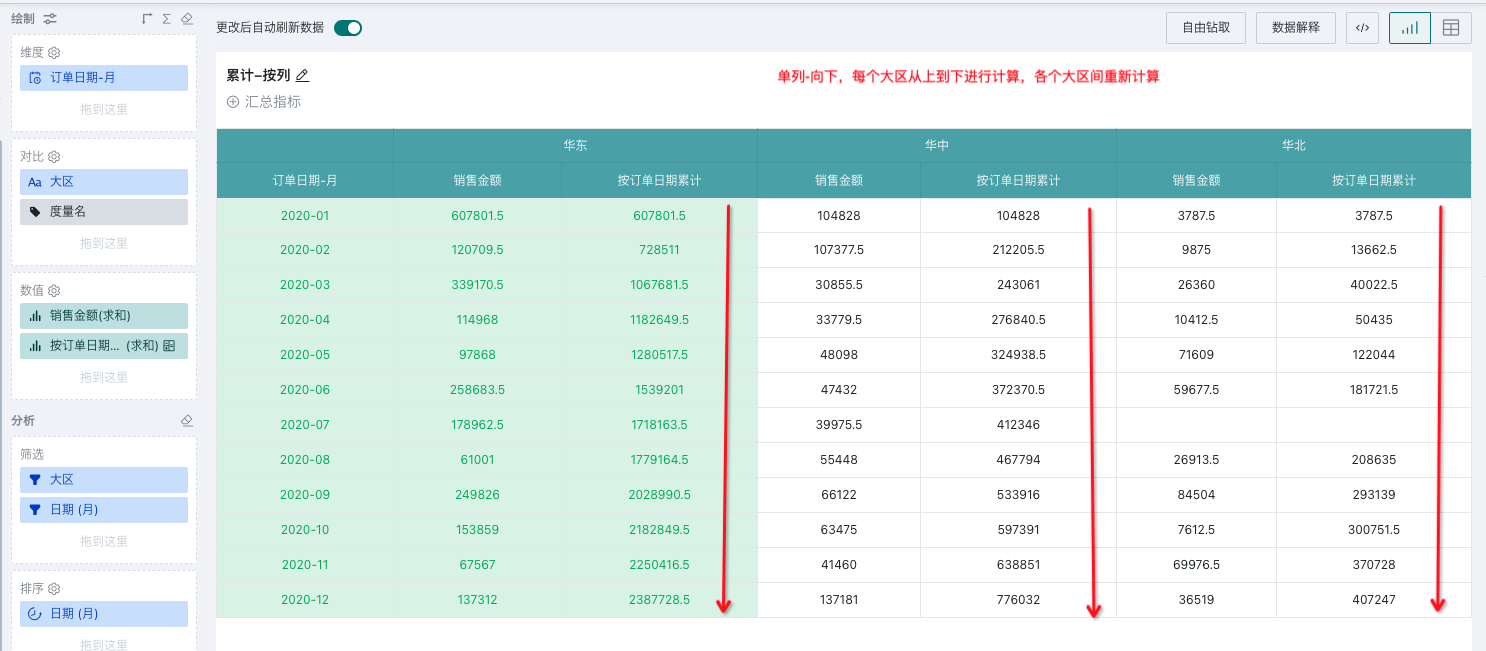
Scenario 1: Calculate cumulative monthly sales amount for each region
-
Create a standard table. Drag Date - Month into Dimensions, Region into Comparison, and Sales Amount into Measures.
-
In the measures area, set Sales Amount to Advanced Calculation - Table Calculation and choose Cumulative - Sum.
-
To calculate the cumulative monthly sales amount for each region, set the calculation unit area to Single Column and the addressing direction to Downward. This means each region is treated as a partition and the monthly sales amounts are cumulatively summed downward within each region. As shown below, the green area is the calculation unit area, and values are added one by one vertically.
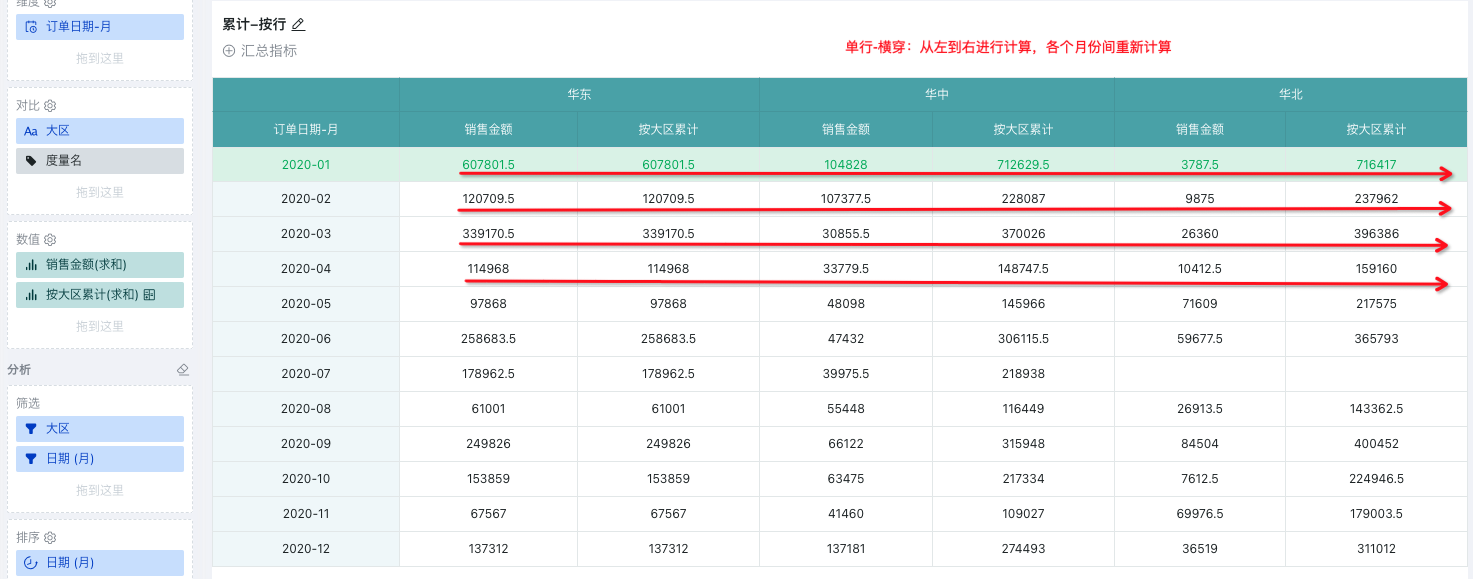
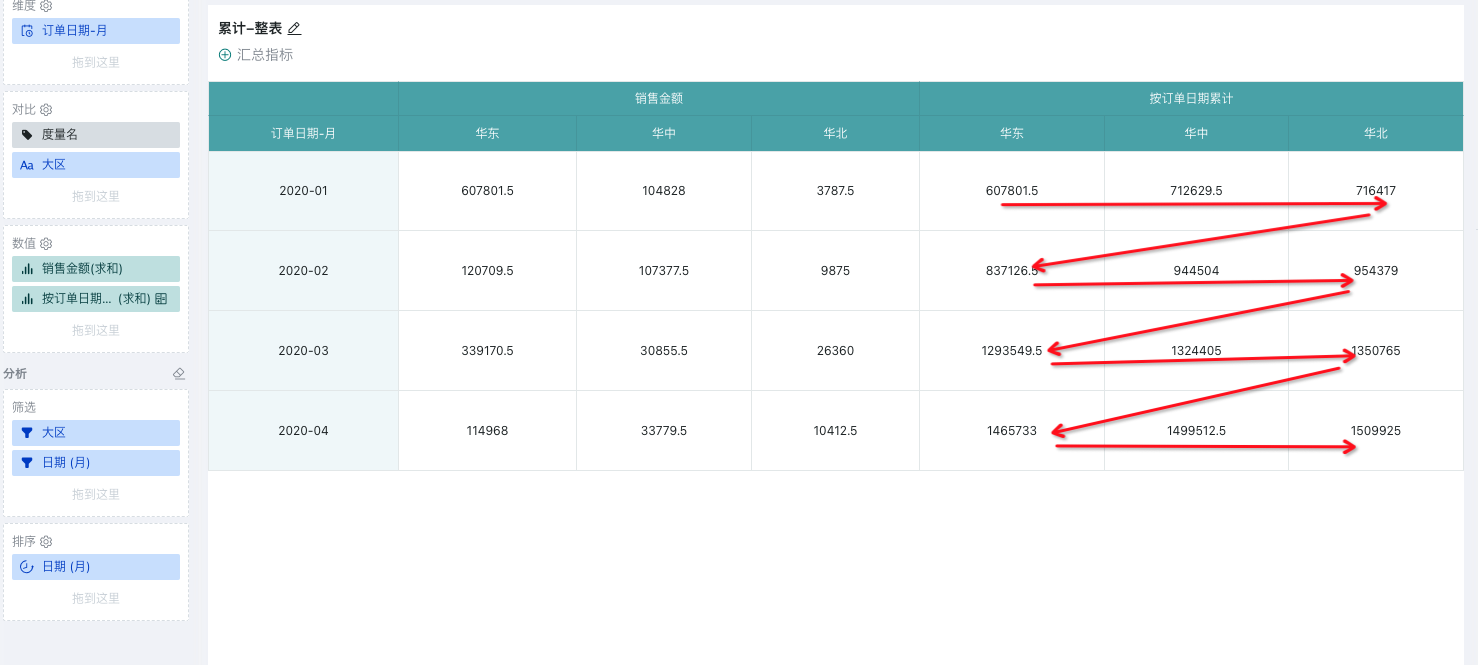
Scenario 2: Calculate cumulative sales amount for each month
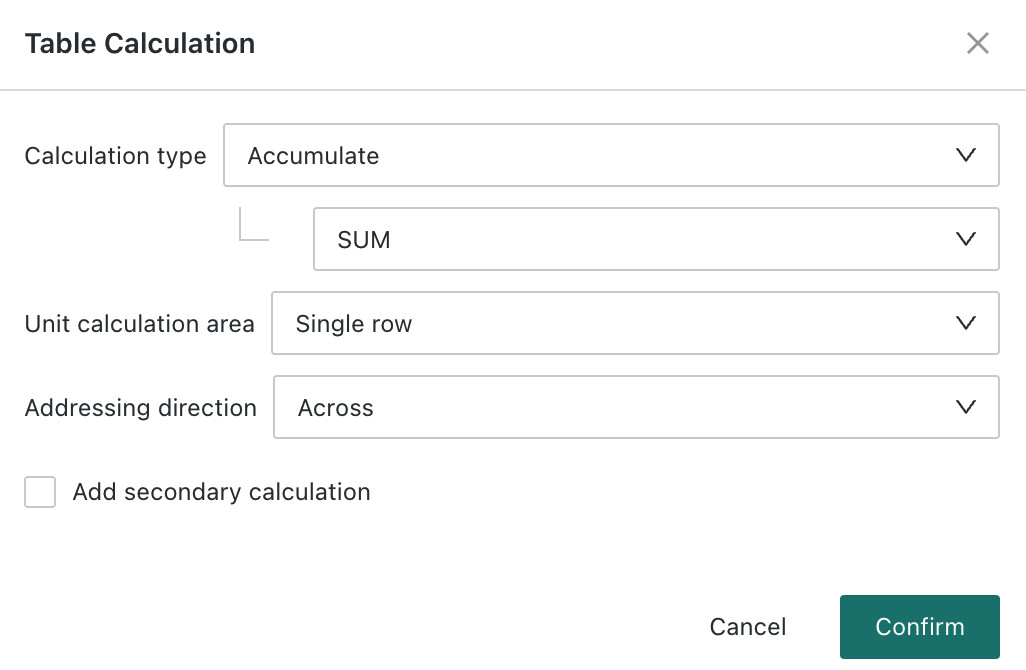
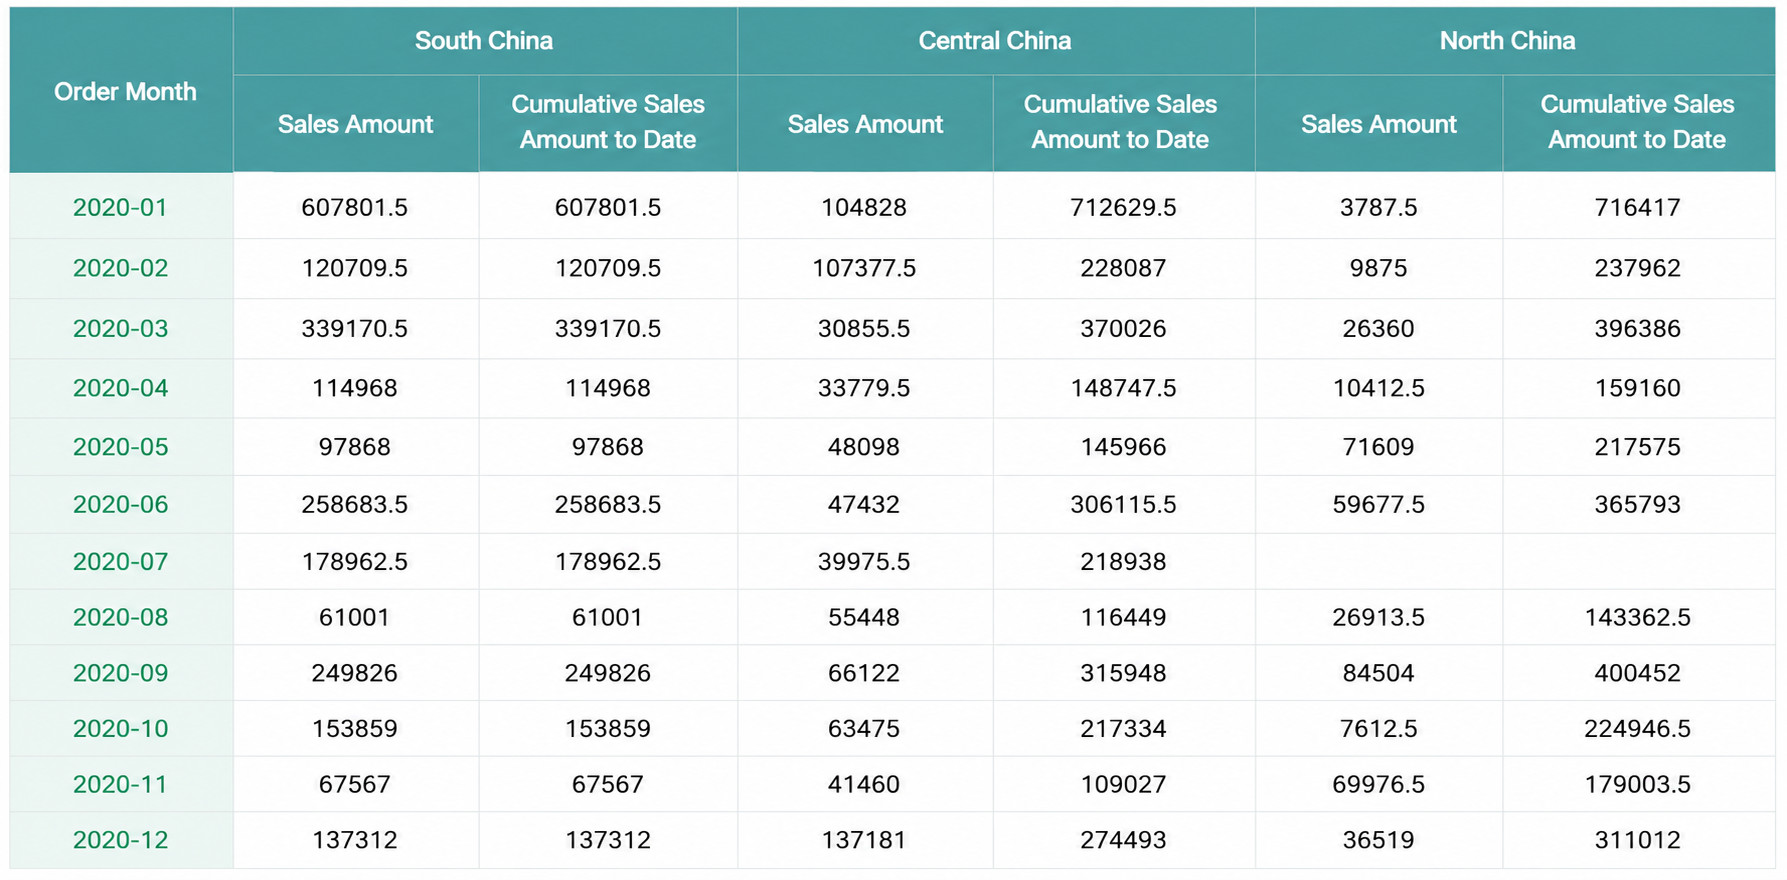
To calculate cumulative sales amount for each month, set the calculation unit area to Single Row and the addressing direction to Across. This means each month is treated as a partition, and the sales amounts of all regions in the same month are cumulatively summed horizontally. As shown below, the green area is the calculation unit area, and values are added one by one across the row.
Moving Calculation
Moving Calculation, also called rolling calculation, is commonly used to observe long-term trends. For example, in securities data, daily market fluctuations make it difficult to understand the overall trend from daily increases and decreases alone. Moving calculation can be used to aggregate a series of values with a selected aggregation method.
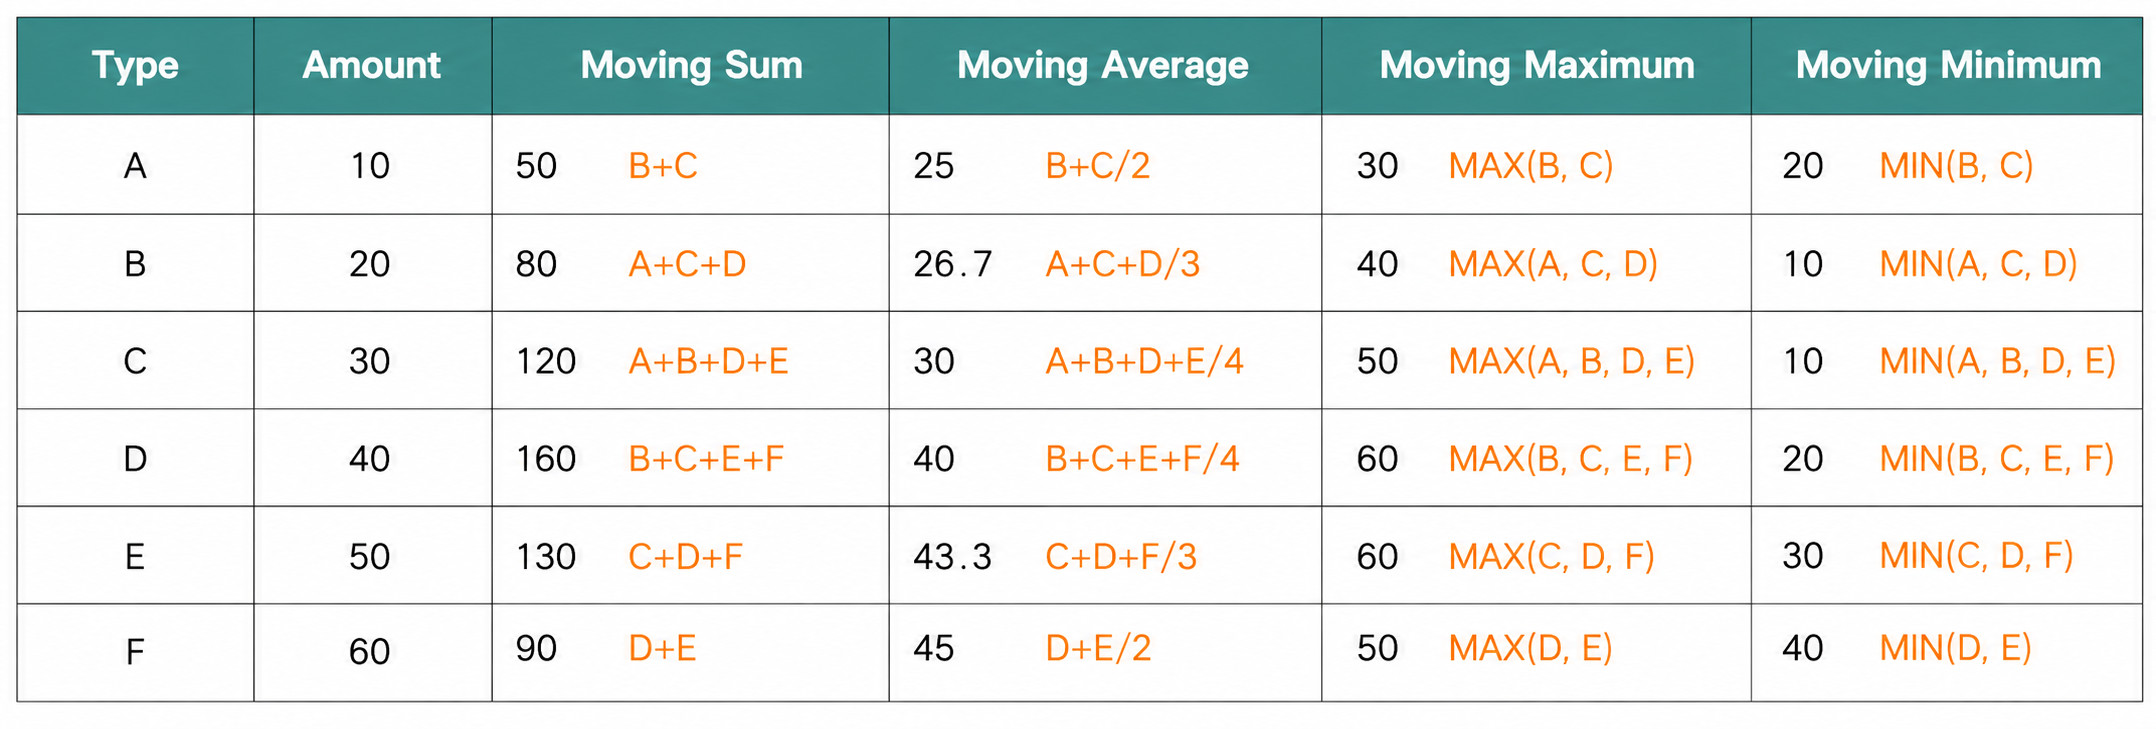
It is used to calculate the aggregated result of one item in a group together with several values before and after it. Four calculation subtypes are supported: Sum, Average, Maximum, and Minimum.
Window: this is the calculation window of the moving calculation. You can adjust the range of calculation by setting the window size. The current value is included by default. When the preceding or following range is set to 0, you can configure whether the calculation window should still include the current value.
For example, the following chart shows the monthly sales amount of each region in 2020. You can use Moving Calculation to calculate the average sales amount of the most recent three months for each region.
- Create a standard table. Drag Date - Month into Dimensions, Region into Comparison, and Sales Amount into Measures.
- In the measures area, set Sales Amount to Advanced Calculation - Table Calculation and choose Moving Calculation - Average.
- To calculate the average sales amount of the most recent three months for each region:
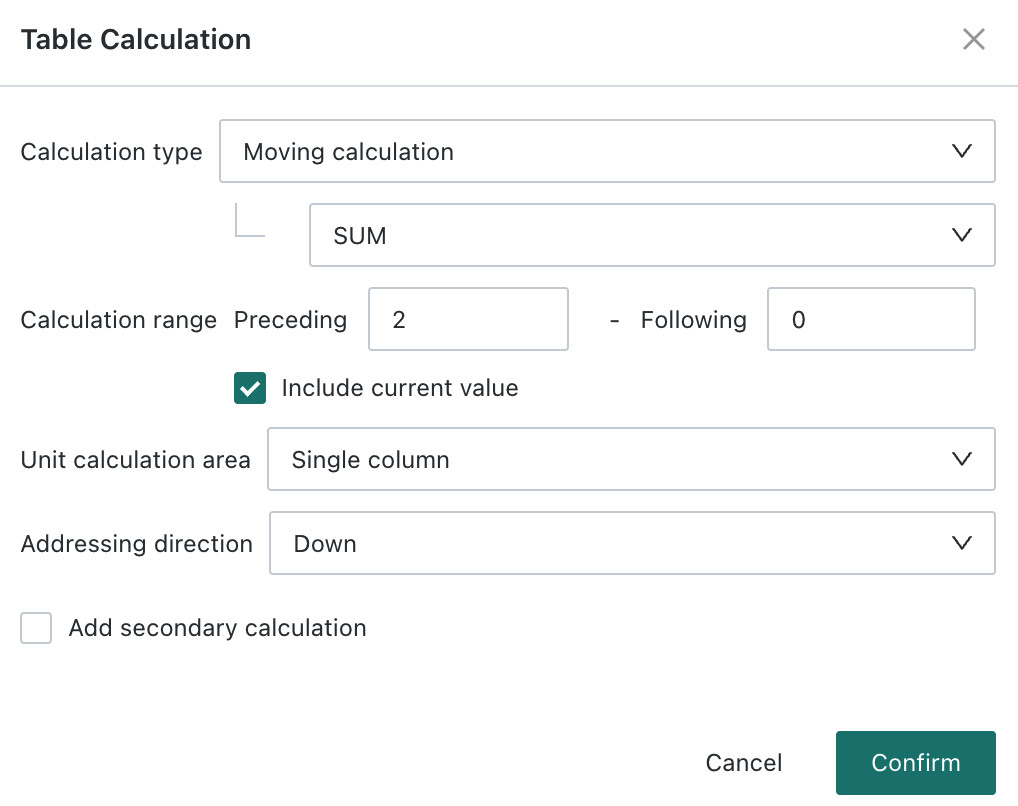
- Set the window to
2 previous and 0 next, which means the current month and the previous two months are included. - Set the calculation unit area to Single Column and the addressing direction to Downward, which means each region is treated as a partition and the recent-three-month average is calculated within each region.
-
As shown below, for January 2020 there are no previous two values, so the result is the average of January only; for February 2020, because one previous value is missing, the result is the average of January and February; and so on. When a month's sales amount is
null, that value is skipped. For the August example below, the result is the average of June and August, with July skipped.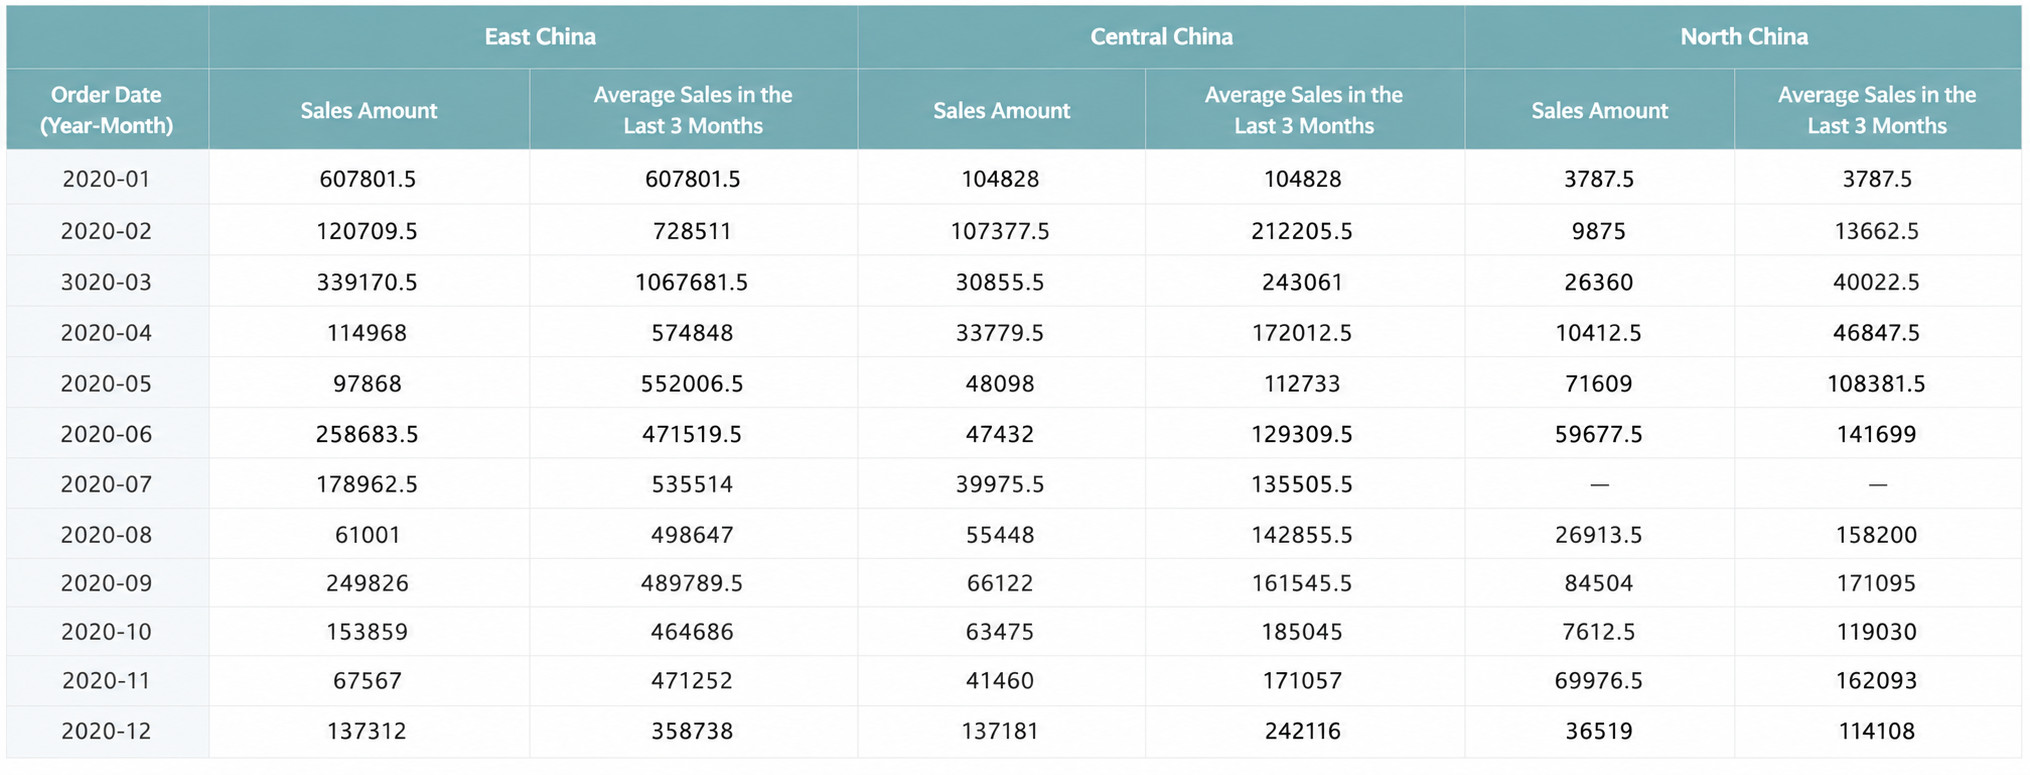
Ranking
Used to rank metrics within the selected area.
Both ascending and descending order are supported. Ascending order ranks values from lowest to highest, while descending order ranks them from highest to lowest.
Ranking Method: when multiple metric values are equal, choose the ranking method based on the actual scenario.
- Competition Ranking -
RANK(1, 2, 2, 4): assigns the same rank to equal values. - Dense Ranking -
DENSE_RANK(1, 2, 2, 3): equal values share the same rank, and the next rank is the next consecutive number. - Unique Ranking -
ROW_NUMBER(1, 2, 3, 4): assigns different ranks to duplicate values according to the ranking direction.
Ranking does not support secondary calculation.
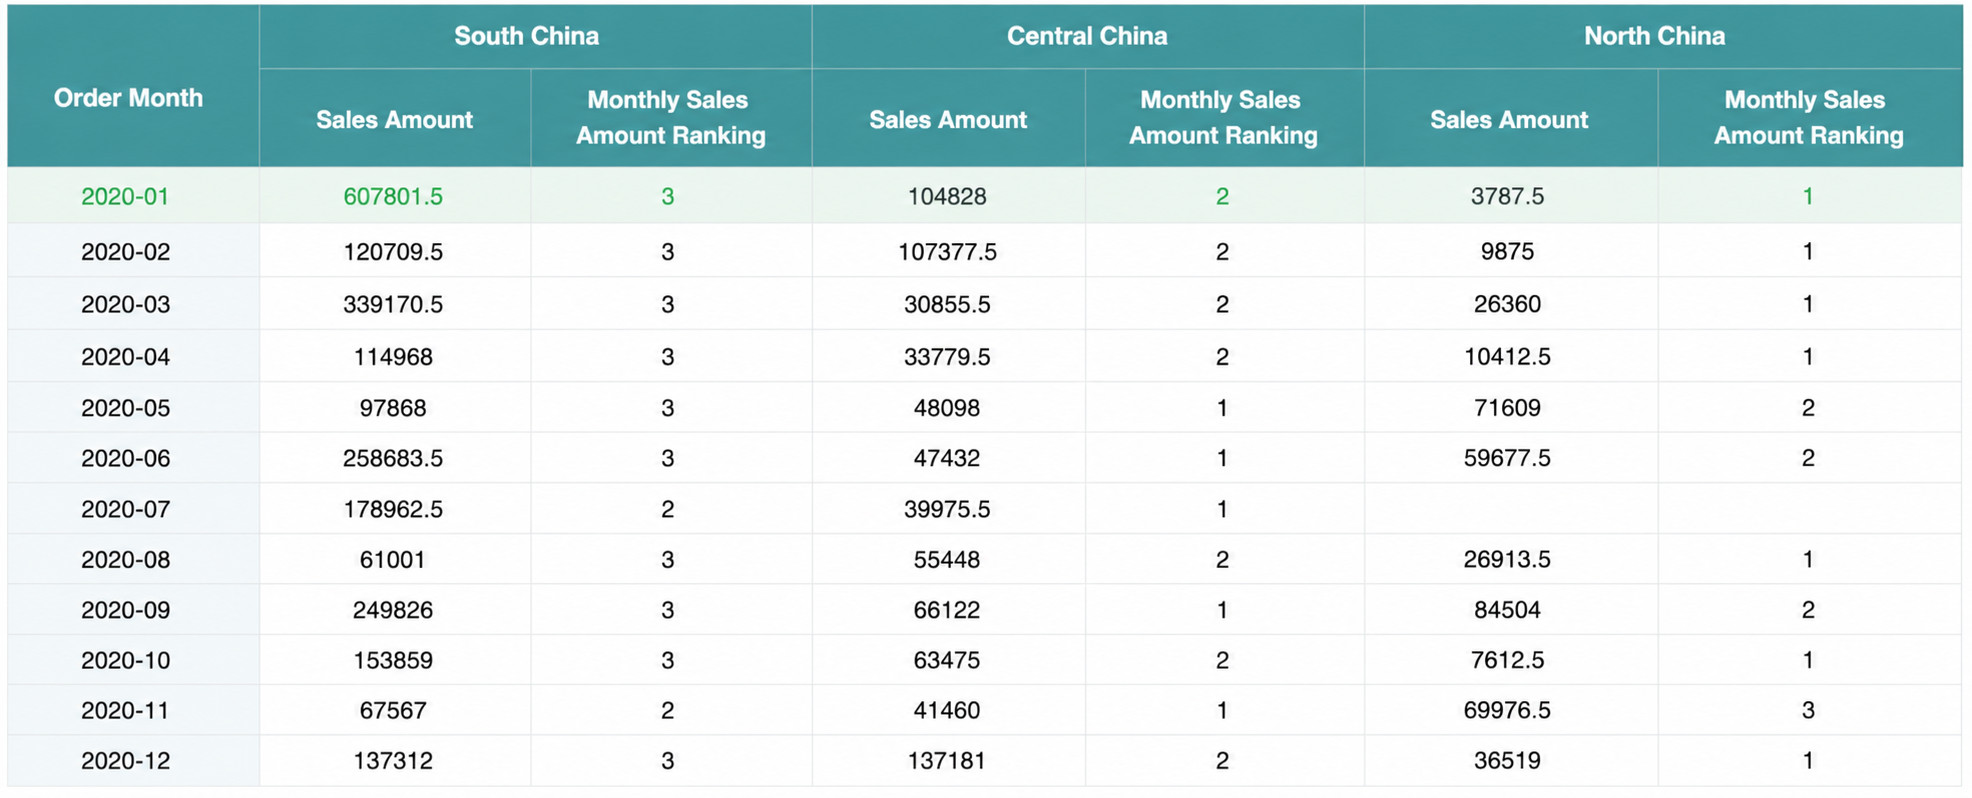
For example, the following chart shows the monthly sales amount of each region in 2020.
Scenario 1: Calculate monthly sales amount ranking within each region
-
Create a standard table. Drag Date - Month into Dimensions, Region into Comparison, and Sales Amount into Measures.
-
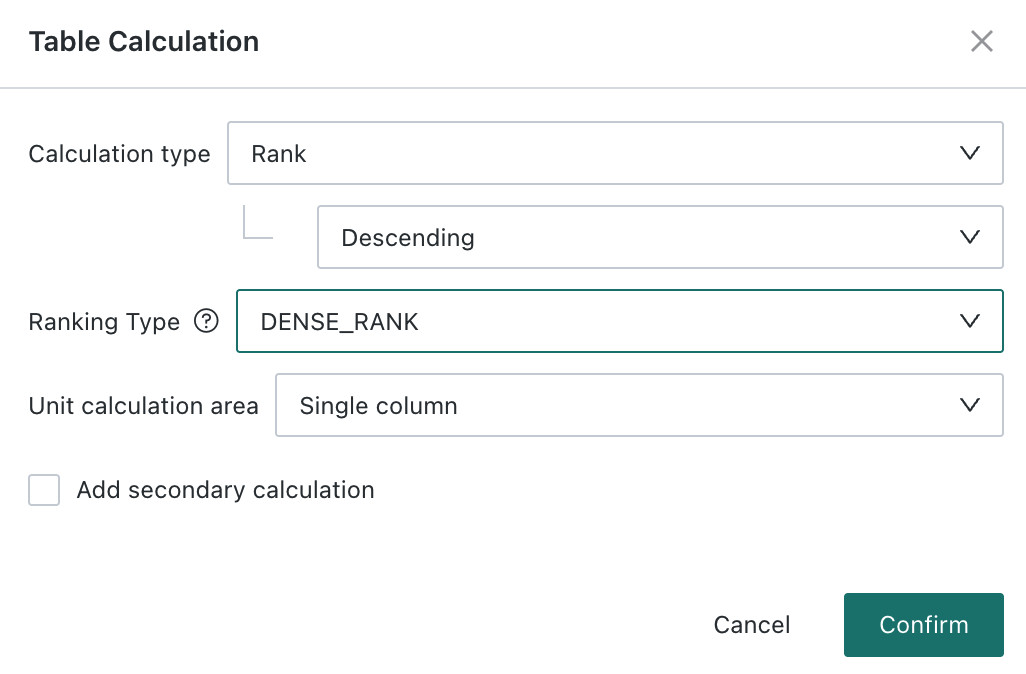
In the measures area, set Sales Amount to Advanced Calculation - Table Calculation, and choose Ranking - Descending.
-
To rank monthly sales amounts within each region from high to low, set the calculation unit area to Single Column.
-
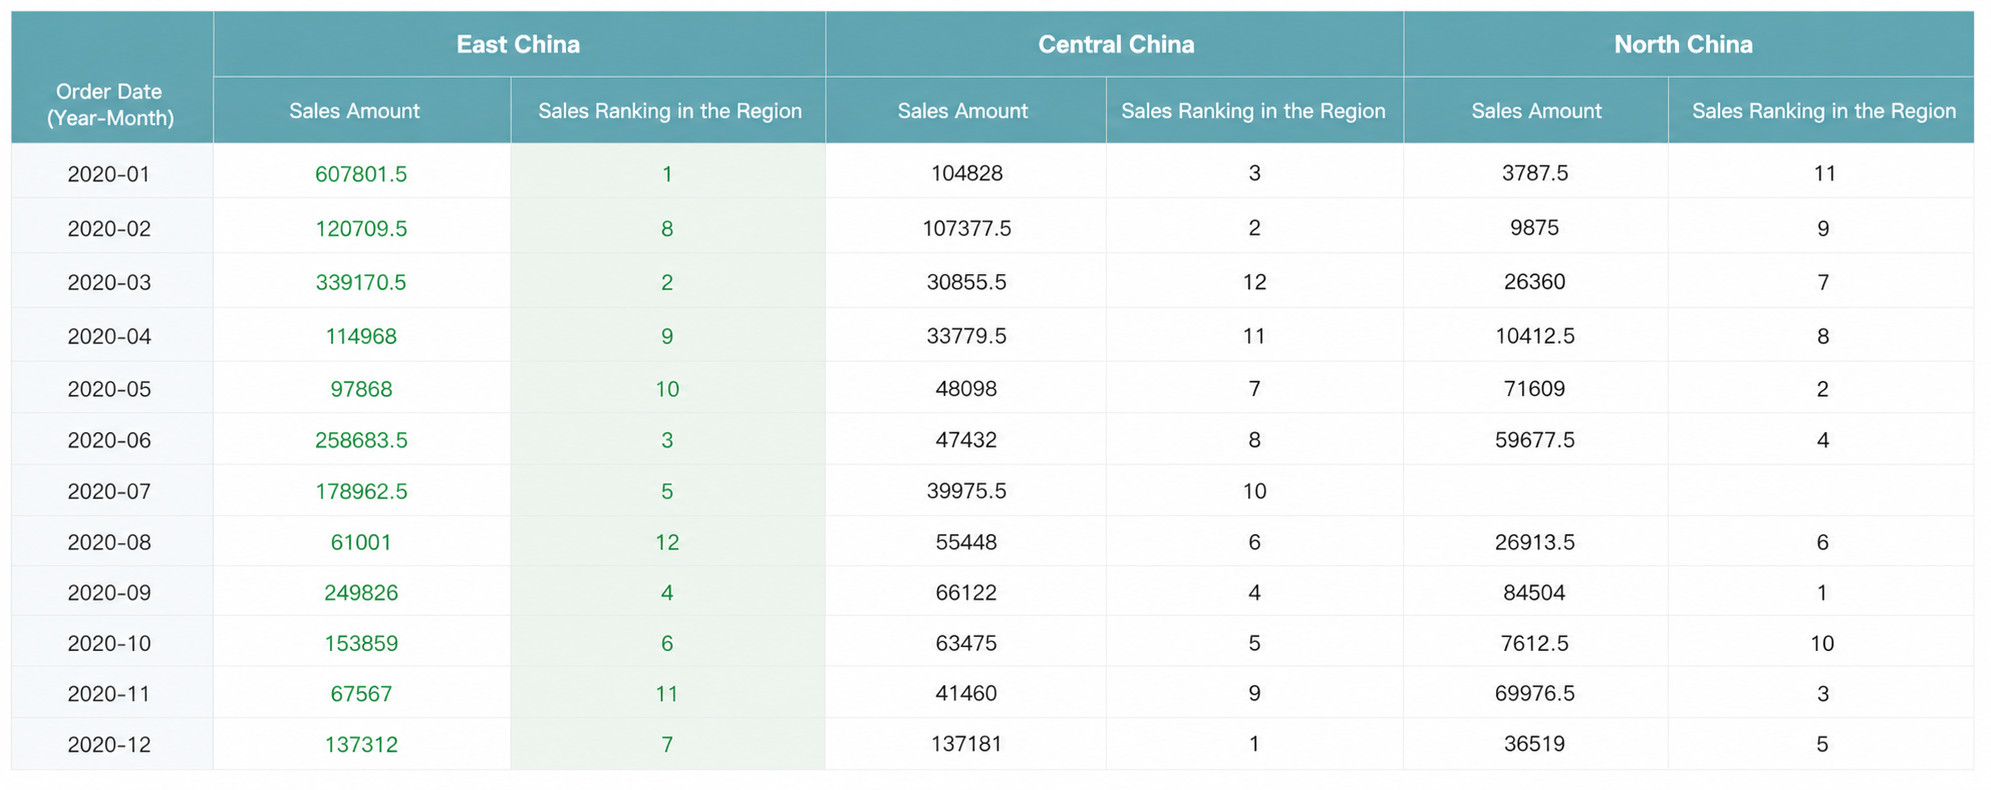
As shown below, taking East China as an example, the chart ranks monthly sales amounts from high to low within East China and displays the exact rank of each month.
Scenario 2: Calculate regional sales amount ranking within each month
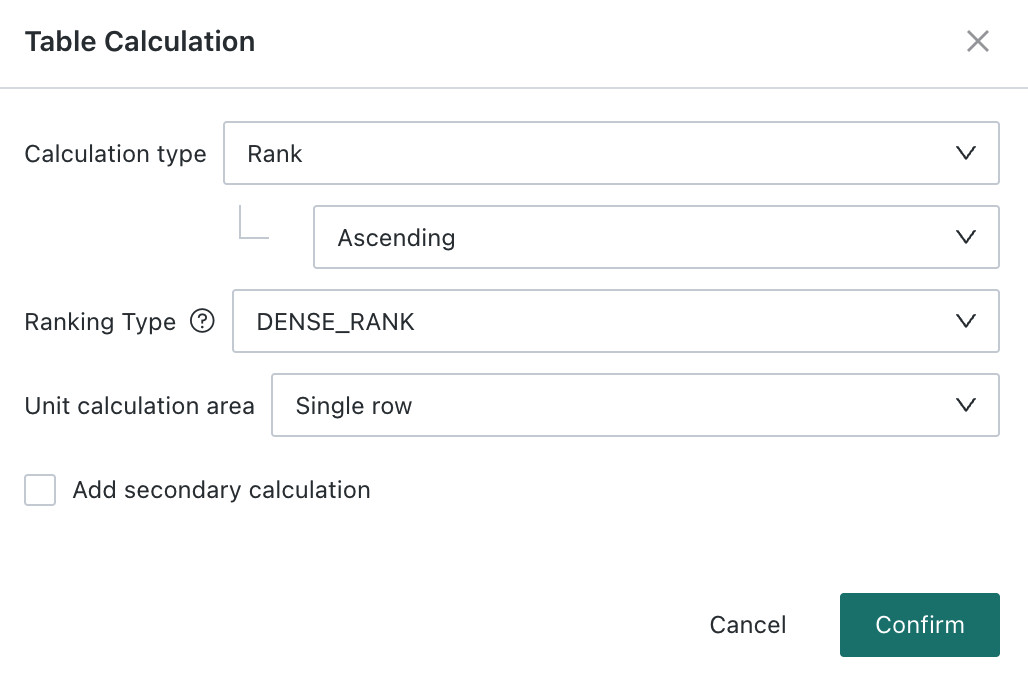
To rank the sales amount of each region within a month from high to low, set the calculation unit area to Single Row.
As shown below, taking January 2020 as an example, the chart ranks all regions by monthly sales amount from high to low and displays the exact rank of each region.
Calculation Unit Area and Addressing Direction
The calculation unit area is the partition that defines the calculation scope for table calculation. Each partition is treated as an independent "table", and every calculation is performed independently within its own partition. Different partitions do not affect each other. The calculation unit area includes Single Row, Single Column, Whole Table, and Area.
Addressing defines the calculation direction within each partition. Four directions are supported: Downward, Across, First Downward Then Across, and First Across Then Downward.
The calculation unit area and addressing direction are linked. The rules are as follows:
| Calculation Area / Addressing Direction | Downward | Across | First Downward Then Across | First Across Then Downward |
| Single Column | ✅ | ❎ | ❎ | ❎ |
| Single Row | ❎ | ✅ | ❎ | ❎ |
| Whole Table | ❎ | ❎ | ✅ | ✅ |
| Area | ✅ when only dimensions exist | ✅ when only comparison fields exist | ✅ when both dimensions and comparison fields exist | ✅ when both dimensions and comparison fields exist |
-
Single Column - Downward: calculation is performed vertically from top to bottom in each column, and restarts for each new column.
-
Single Row - Across: calculation is performed horizontally from left to right in each row, and restarts for each new row.
-
Whole Table - First Downward Then Across: calculation first moves vertically from top to bottom, then jumps to the top of the next column, and continues until all data has been processed.
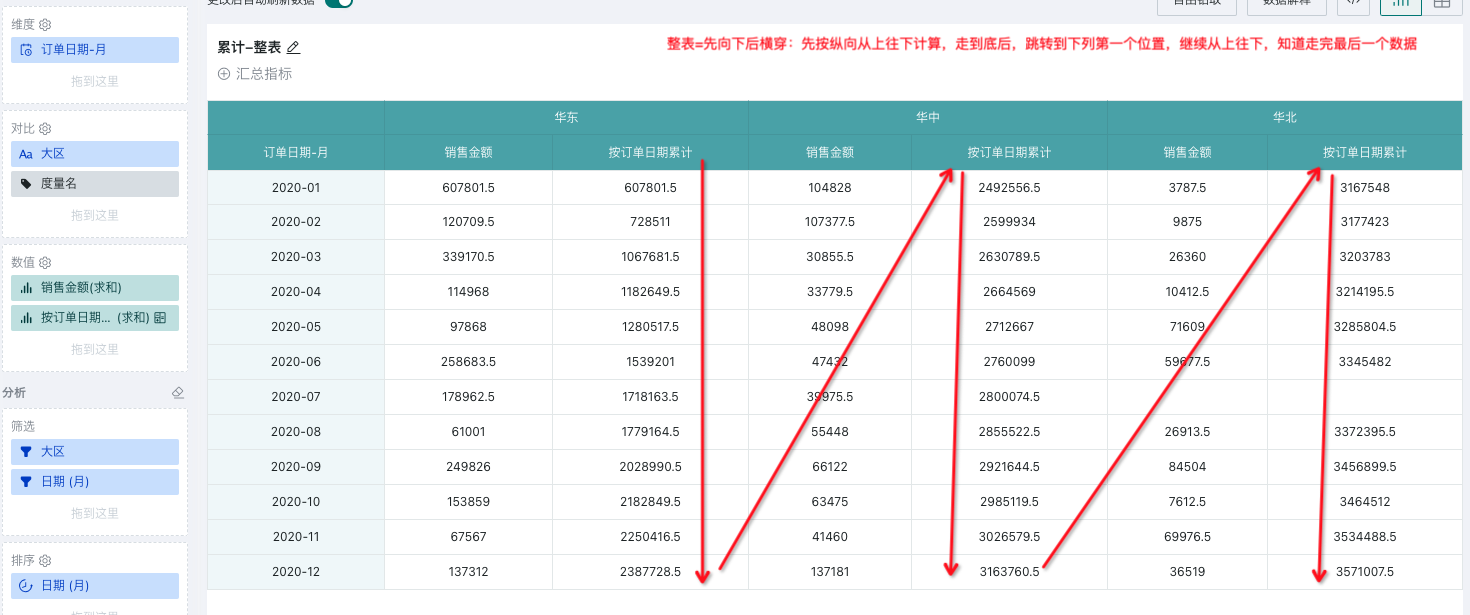
-
Whole Table - First Across Then Downward: calculation follows a Z-shaped path, moving horizontally from left to right, then jumping to the first position of the next row, and continuing until all data has been processed.
-
Area
Area-based calculation refers to subviews or sub-tables in the view. Unlike the whole table, an area does not extend to the full edge of the table. Instead, it is calculated independently within each group, and calculation restarts between different areas.
Partitioning and Addressing: there are four scenarios, as shown below:
Applicable Scenario | Addressing Direction | Behavior |
Number of fields in Dimensions ≥ 1 and number of fields in Comparison = 0 | Downward | Calculate from top to bottom within each area |
Number of fields in Comparison ≥ 1 and number of fields in Dimensions = 0 | Across | Calculate from left to right within each area |
Number of fields in Dimensions ≥ 1 and number of fields in Comparison ≥ 1 | First Downward Then Across | Within each area, calculate from top to bottom, then jump to the first position of the next column, and continue until all values in the area are processed. |
First Across Then Downward | Within each area, follow a Z-shaped path: calculate from left to right, then jump to the first position of the next row, and continue until all values in the area are processed. | |
Number of fields in Dimensions = 0 and number of fields in Comparison = 0 | Table calculation depends on dimension or comparison fields to define its basis, so this scenario is not supported. | |
Depth: includes row depth and column depth. The depth value N is a natural number and can be 0, 1, 2 ... N (N equals the number of fields in Dimensions or Comparison). The default is 0.
- Column Depth: determines which comparison dimension is used for partitioning. If column depth is
0, partitioning does not use the column dimension. If it is1, partitioning uses the first column dimension; if it is2, it uses the second column dimension; and so on. - Row Depth: determines which row dimension is used for partitioning. If row depth is
0, partitioning does not use the row dimension. If it is1, partitioning uses the first row dimension; if it is2, it uses the second row dimension; and so on.
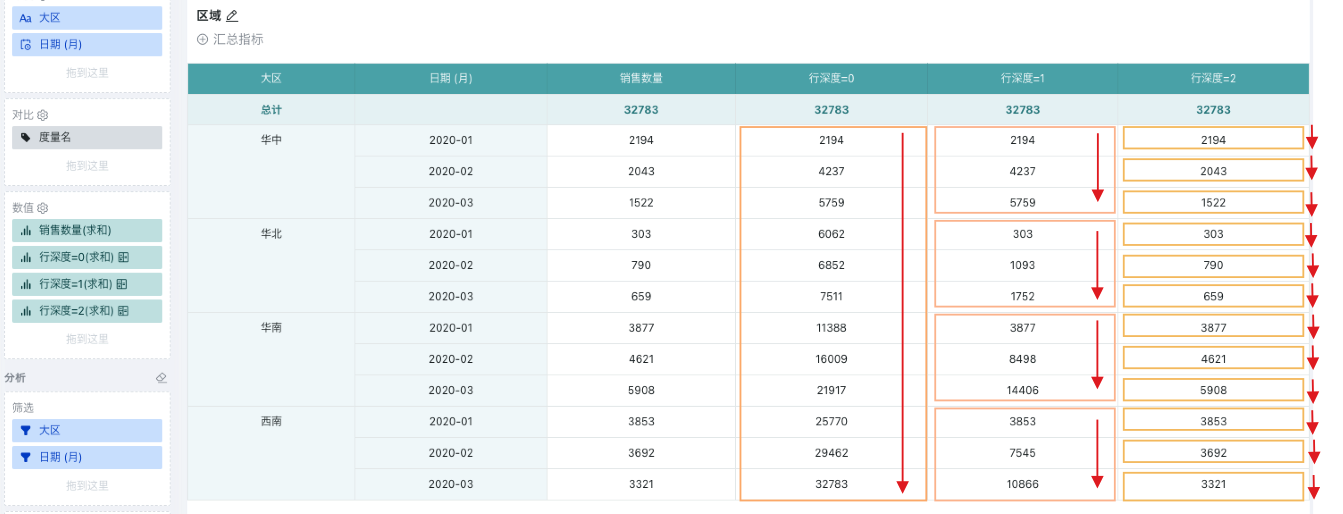
As shown below, when row depth = 0, the calculation is performed as a whole-table column-based downward calculation; when row depth = 1, it is recalculated by the first dimension, Region; when row depth = 2, it is recalculated by the second dimension, Date - Month. Because there are only two dimensions, the final result equals the original value itself in this case. For Percentage of Total, the result is always 1 in this scenario.
Secondary Calculation
Except for Ranking, all other calculation types support a second table calculation on top of the first calculation result. In other words, nested table calculations are supported.
For example, if you need to calculate the cumulative revenue multiple for each store each year, you can first calculate cumulative revenue by period for each store and year, and then divide it by the first-period value to obtain the cumulative revenue multiple.
Cumulative Revenue Multiple: indicates how cumulative revenue has grown relative to the revenue of the first period.
-
Create a standard table. Drag Store and Year into Dimensions, Period Number into Comparison, and Sales Amount into Measures.
-
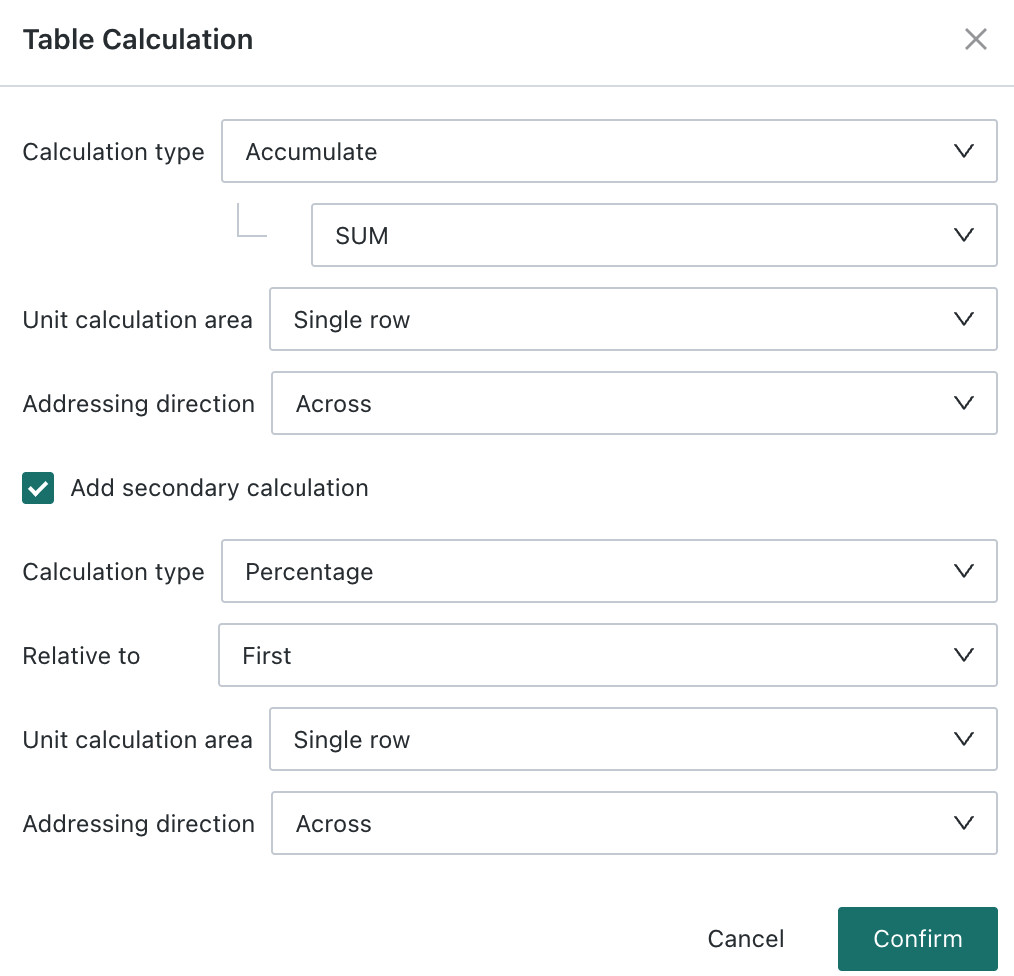
In the measures area, set Sales Amount to Advanced Calculation - Table Calculation, choose Cumulative - Sum, set the calculation unit area to Single Row, and set the addressing direction to Across. As shown below, this calculates the cumulative sales amount by period for each store and year.
-
Select the option to perform a secondary table calculation on the calculation result, choose Percentage as the calculation type, set the reference to First, set the calculation unit area to Single Row, and set the addressing direction to Across, as shown below:
-
You now get the cumulative revenue multiple for each store in each year.
Null Value Handling Logic
The current handling logic for null values in table calculation is as follows:
Calculation Type | Handling Logic and Description | Example |
Difference | When the comparison value is null, the calculation result is null. | Using “relative to the first” as an example, if the first value in a calculation unit area is null, all calculation results are null. |
Difference Percentage | ||
Percentage | ||
Percentage of Total | null / total = null | When the current value is null, Percentage of Total = null / total = null. |
Cumulative | When a value is null, that value is skipped and accumulation continues. | If the original values are 10, null, and 20, the cumulative values are 10, null, and 30. |
Moving Calculation | If the original values are 10, null, 20, and 30, and the window is “2 previous and 0 next - sum”, the results are 10, 10, 30, and 50. 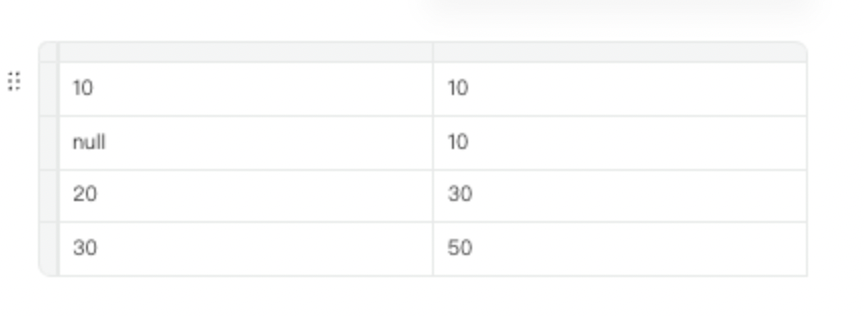 | |
Ranking | null is treated as the minimum value. | For example, if the original values are `null, 2, -1, 3` then ascending order is `null, -1, 2, 3`, and descending order is `3, 2, -1, null`. |
In comparison scenarios, null values may appear. In this case, null values are skipped during calculation. Take the following scenario as an example:
The original data contains North China - February and South China - January. Because the table is two-dimensional, it may appear that North China - January and South China - February have values, but they are actually null.
During calculation, null values are skipped. If Average is used as an example, then the cumulative average for the whole table is actually 20 / 2.
In scenarios where some dates are missing, if you want the calculation to follow the date sequence strictly, it is recommended to fill in missing dates in the database in advance.
| Jan | Feb | |
|---|---|---|
| North China | 10 | |
| South China | 10 |
When null values participate in average calculation, they are skipped and are not counted as part of the divisor.
Limitations
Detail Tables do not support table calculation.