Proportion
Overview
Feature Overview
Percentage-of-total calculation helps you quickly calculate the share of data so you can understand how much a value contributes to the whole.
In the measures area, click the field for which you want to calculate a percentage, then choose Advanced Calculation > Proportion from the drop-down menu to open the settings dialog.
Proportion is used to calculate the relationship between a part and the whole. It supports both global percentage and intra-group percentage calculations.
- Global percentage: can be calculated by row or by column.
- Intra-group percentage: can be calculated based on different dimension levels.
This feature was originally named Percentage and was officially renamed Proportion in version 6.6.0 and later.
Use Cases
By calculating percentages, users can quickly understand how much each value contributes to the whole.
For example, you can analyze the percentage contribution of sales amounts by product category across regions nationwide.
Global Percentage
Global percentage supports two calculation methods: By Row and By Column.
By Column
When calculating By Column, the denominator is the column total of the measure being analyzed.
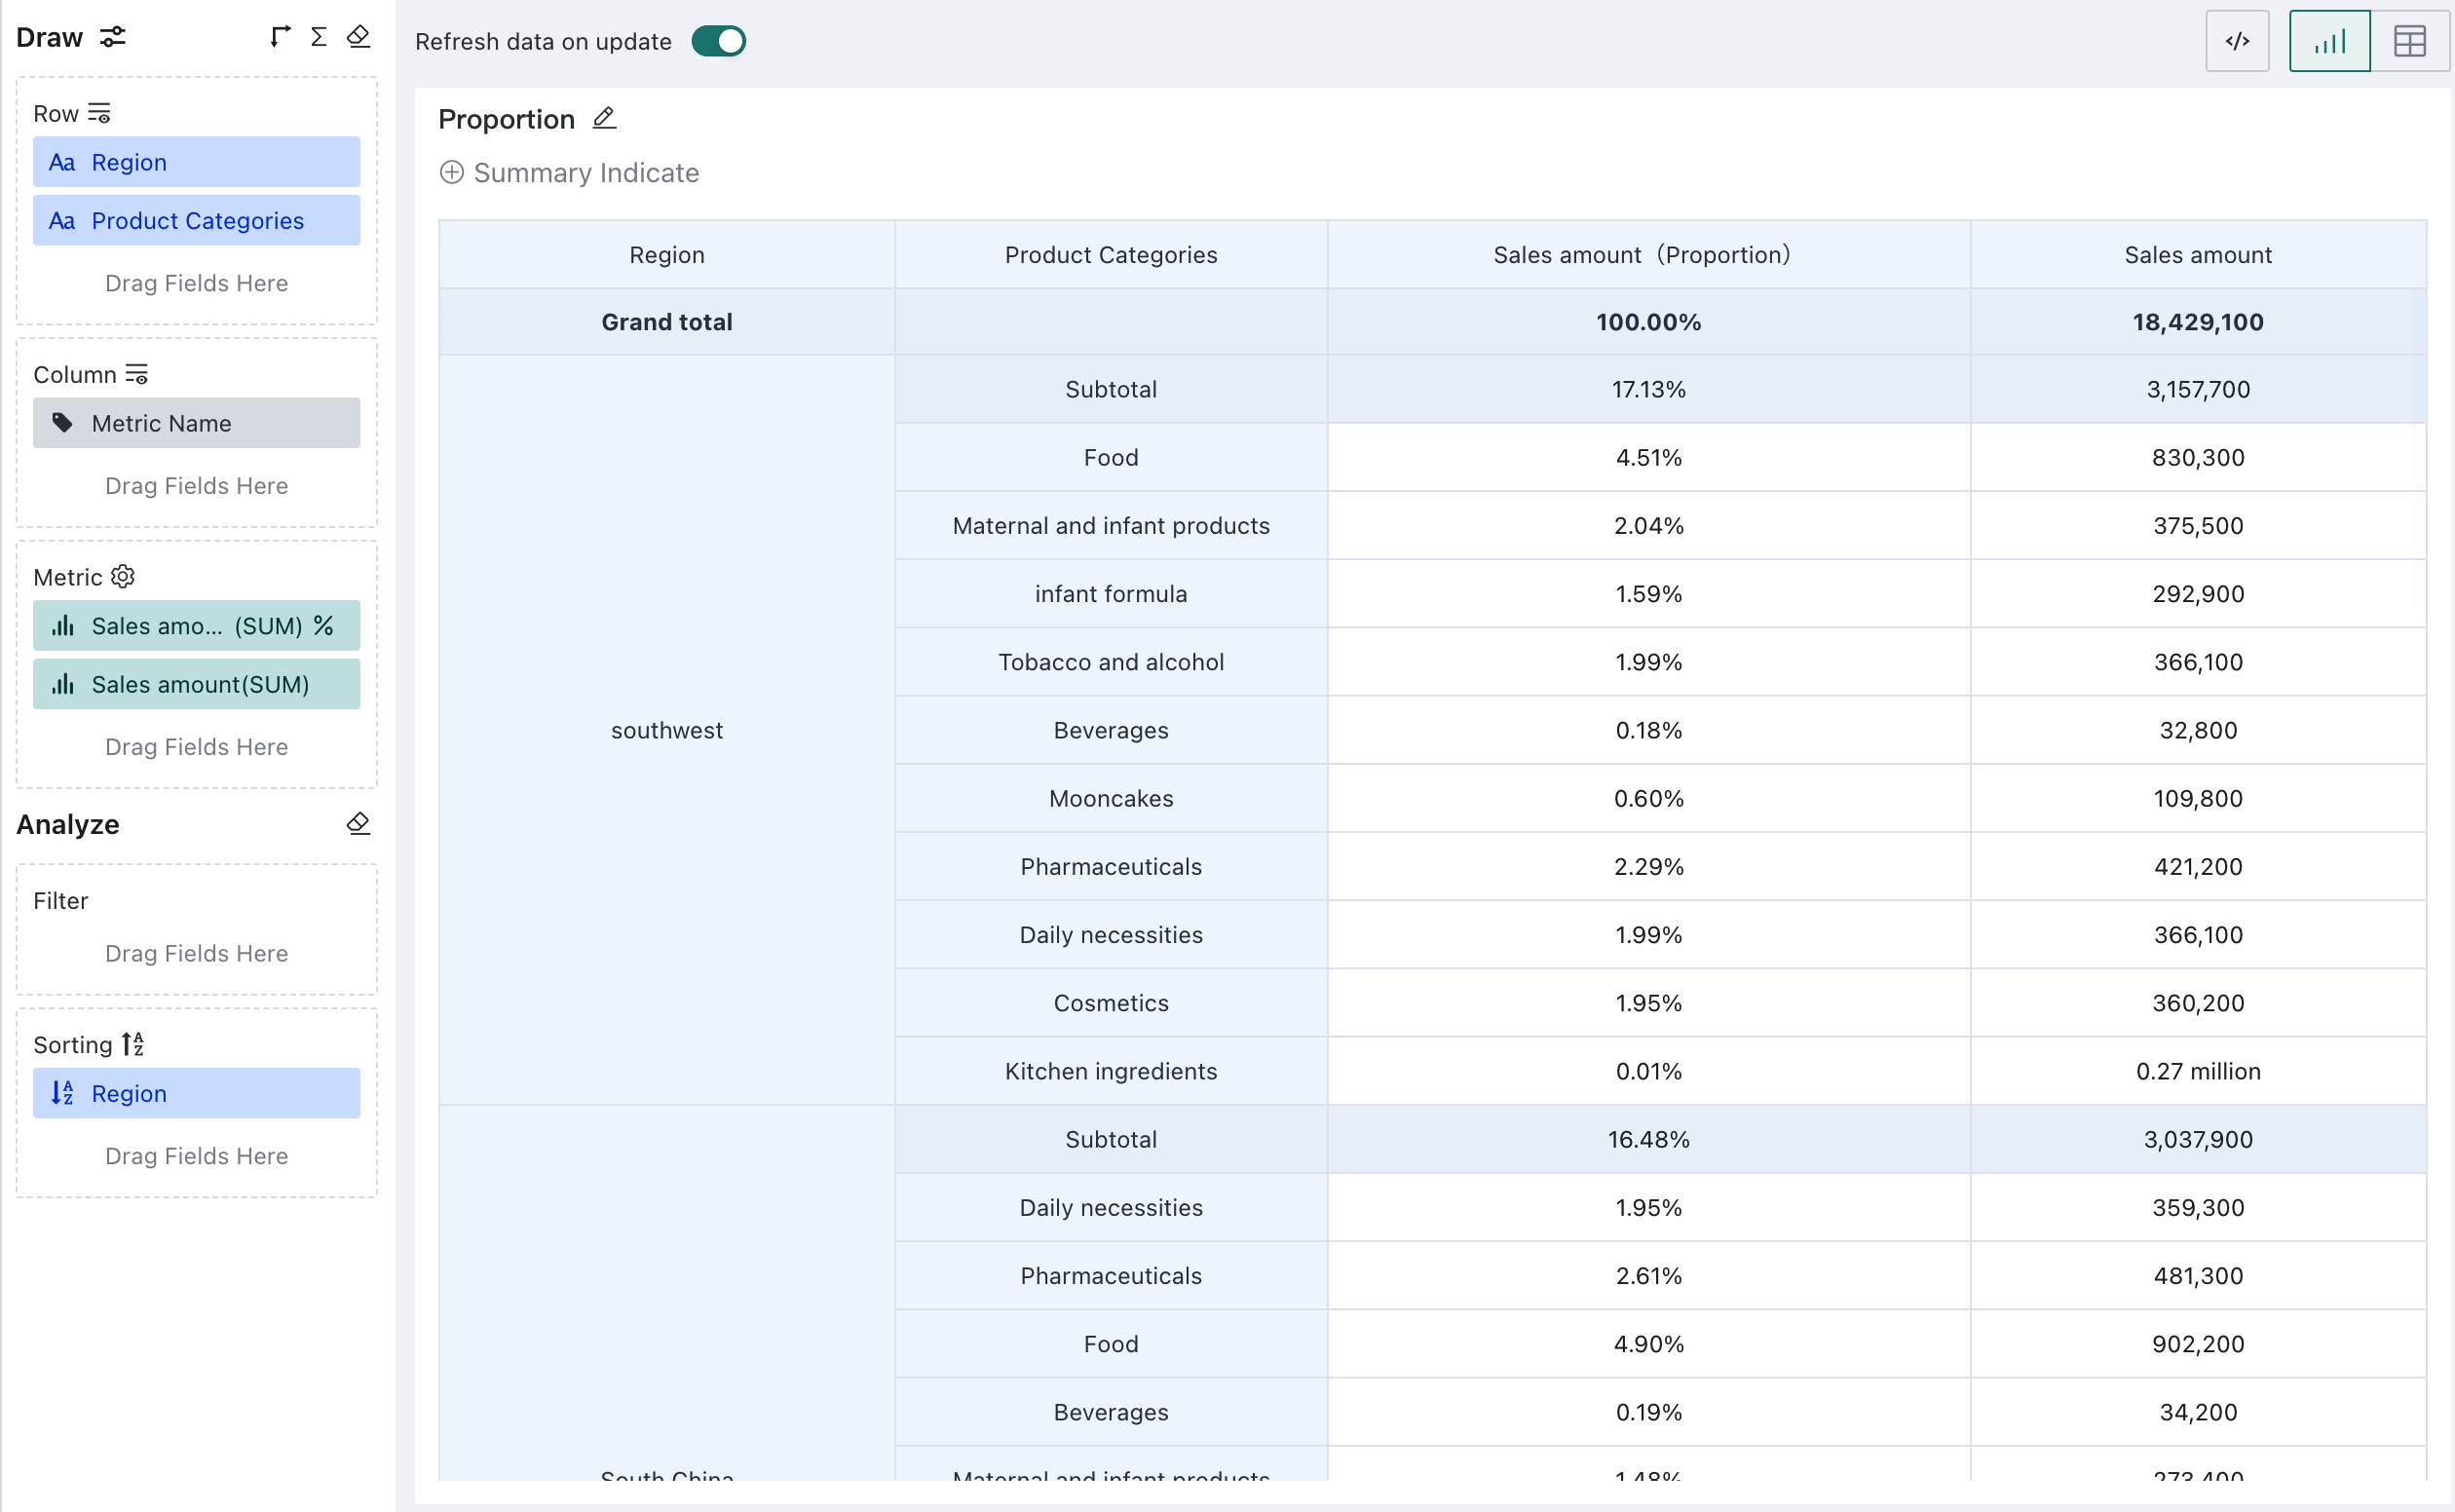
For example, when analyzing the percentage of sales amounts by product category across regions nationwide, subtotals and totals need to be displayed.
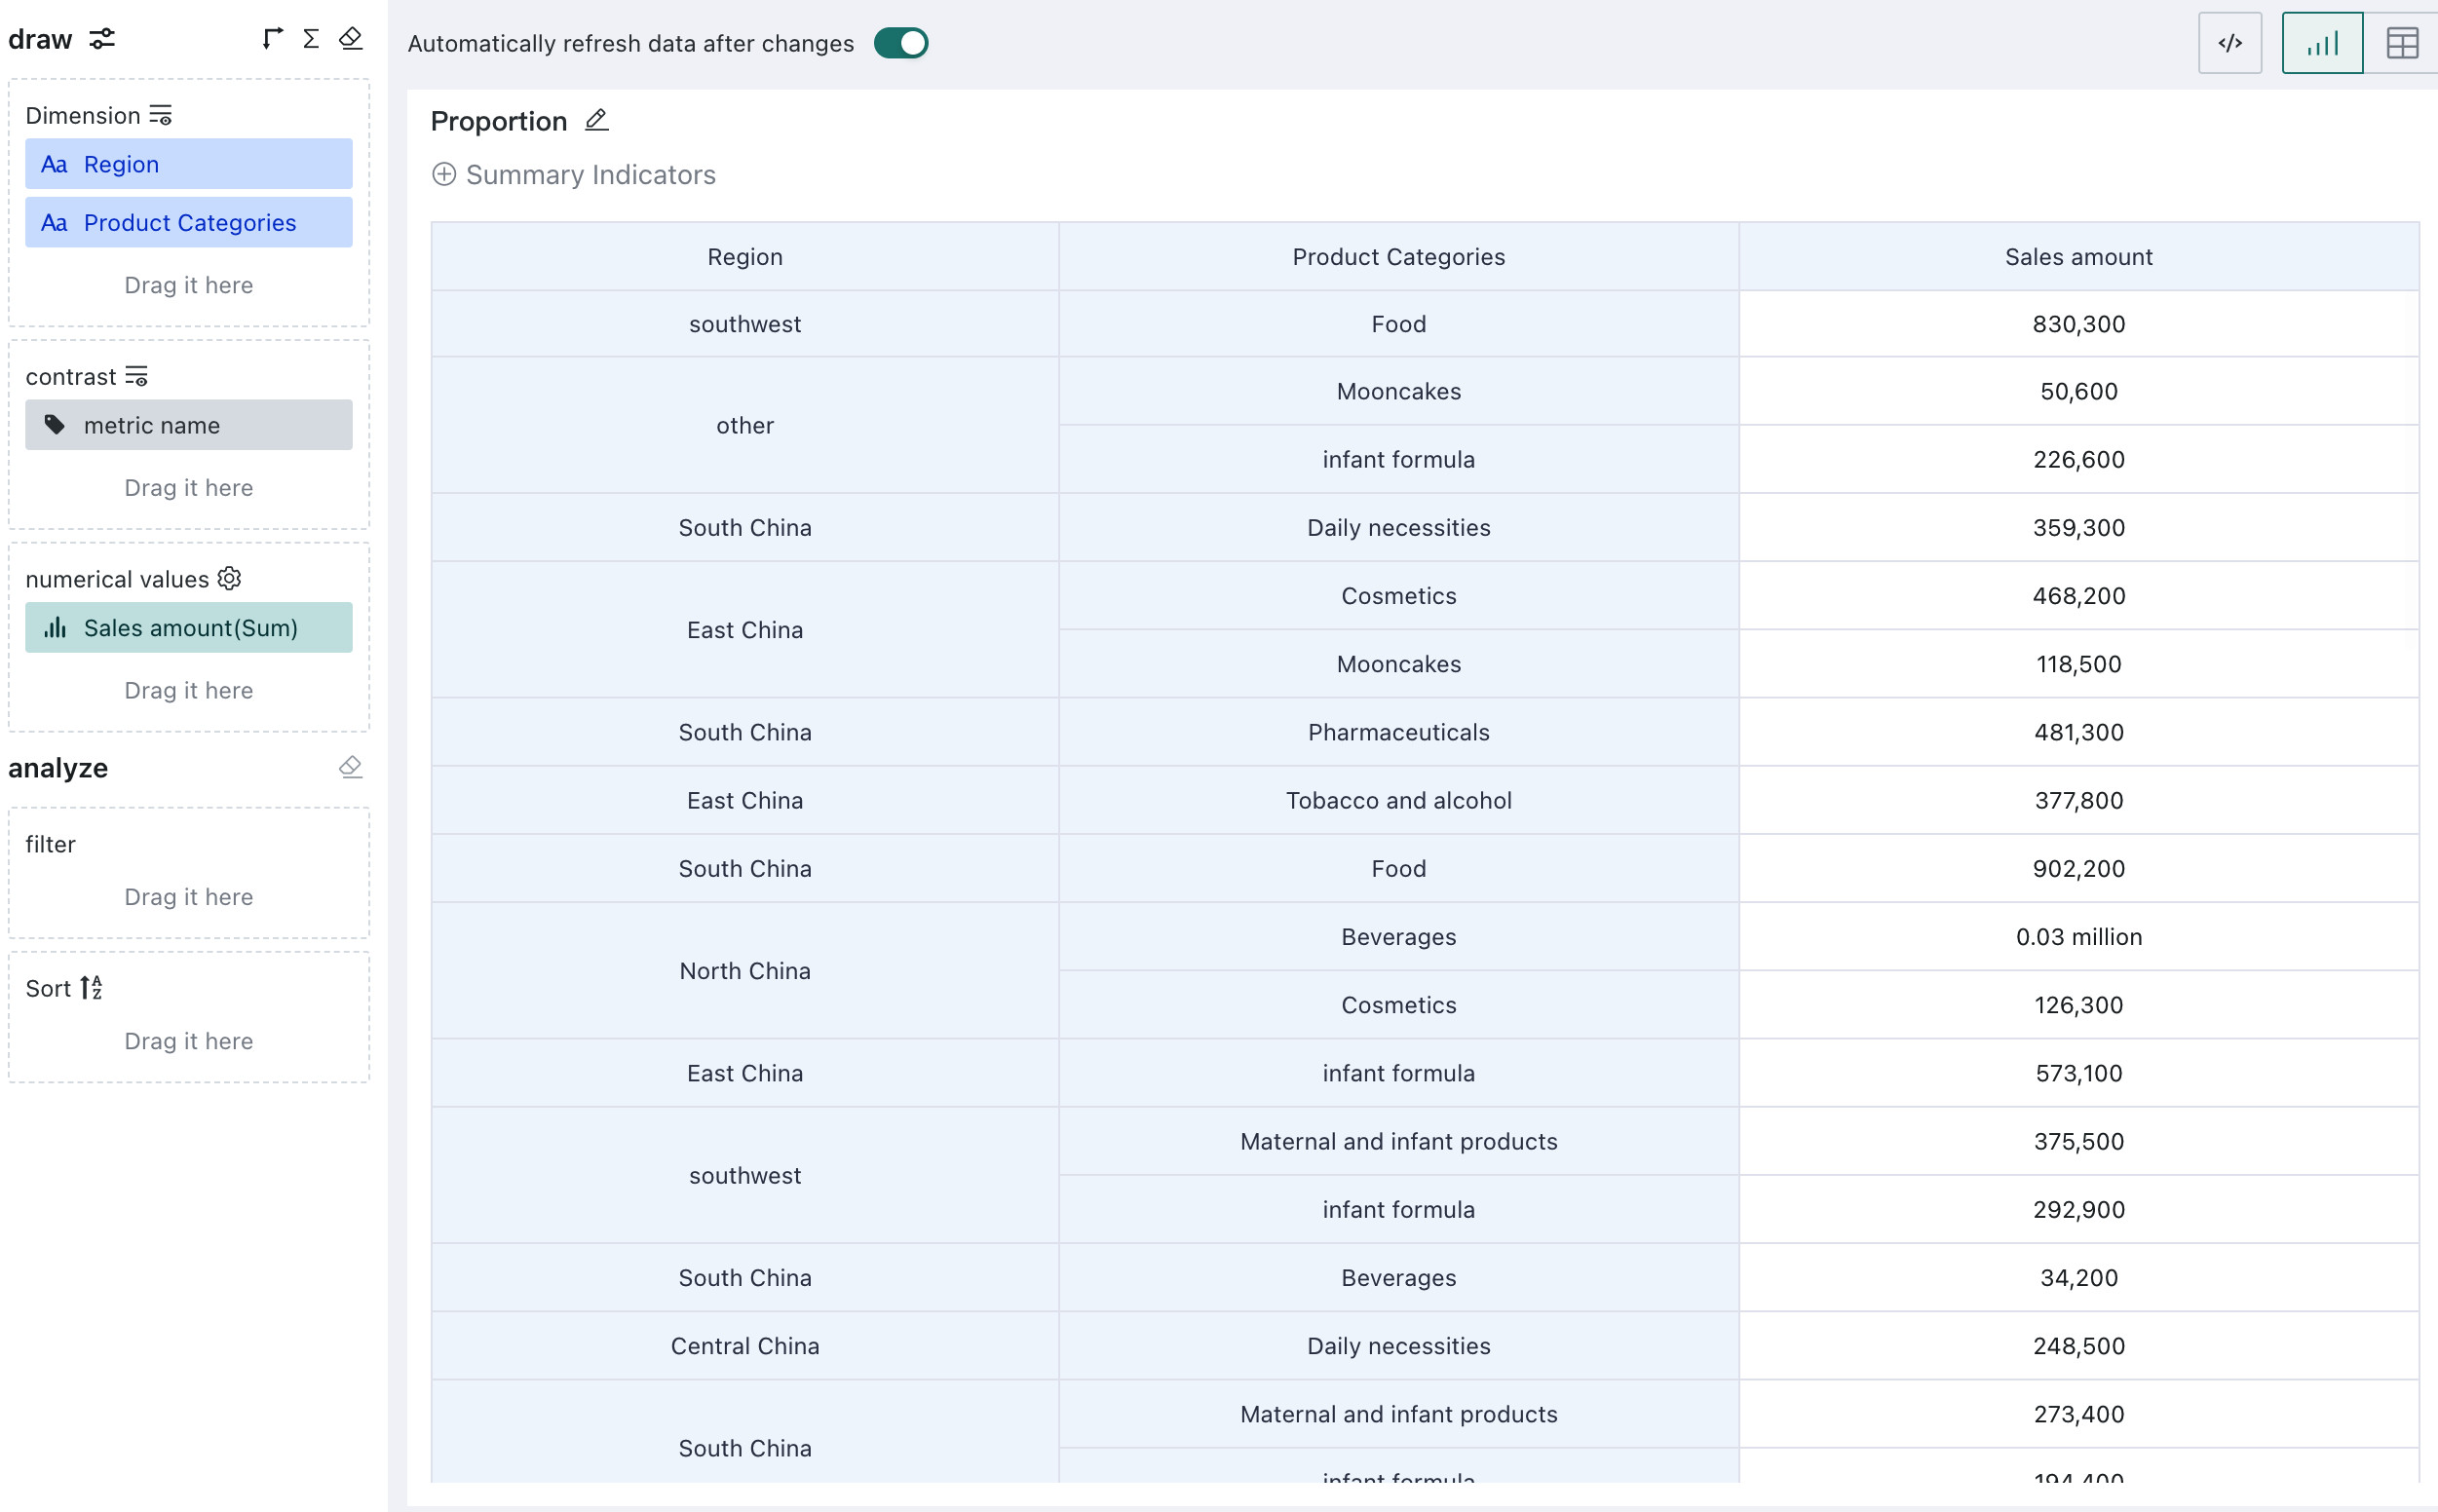
- Create a standard table. Drag Region and Product Category into Dimensions, and drag Sales Amount into Measures.
-
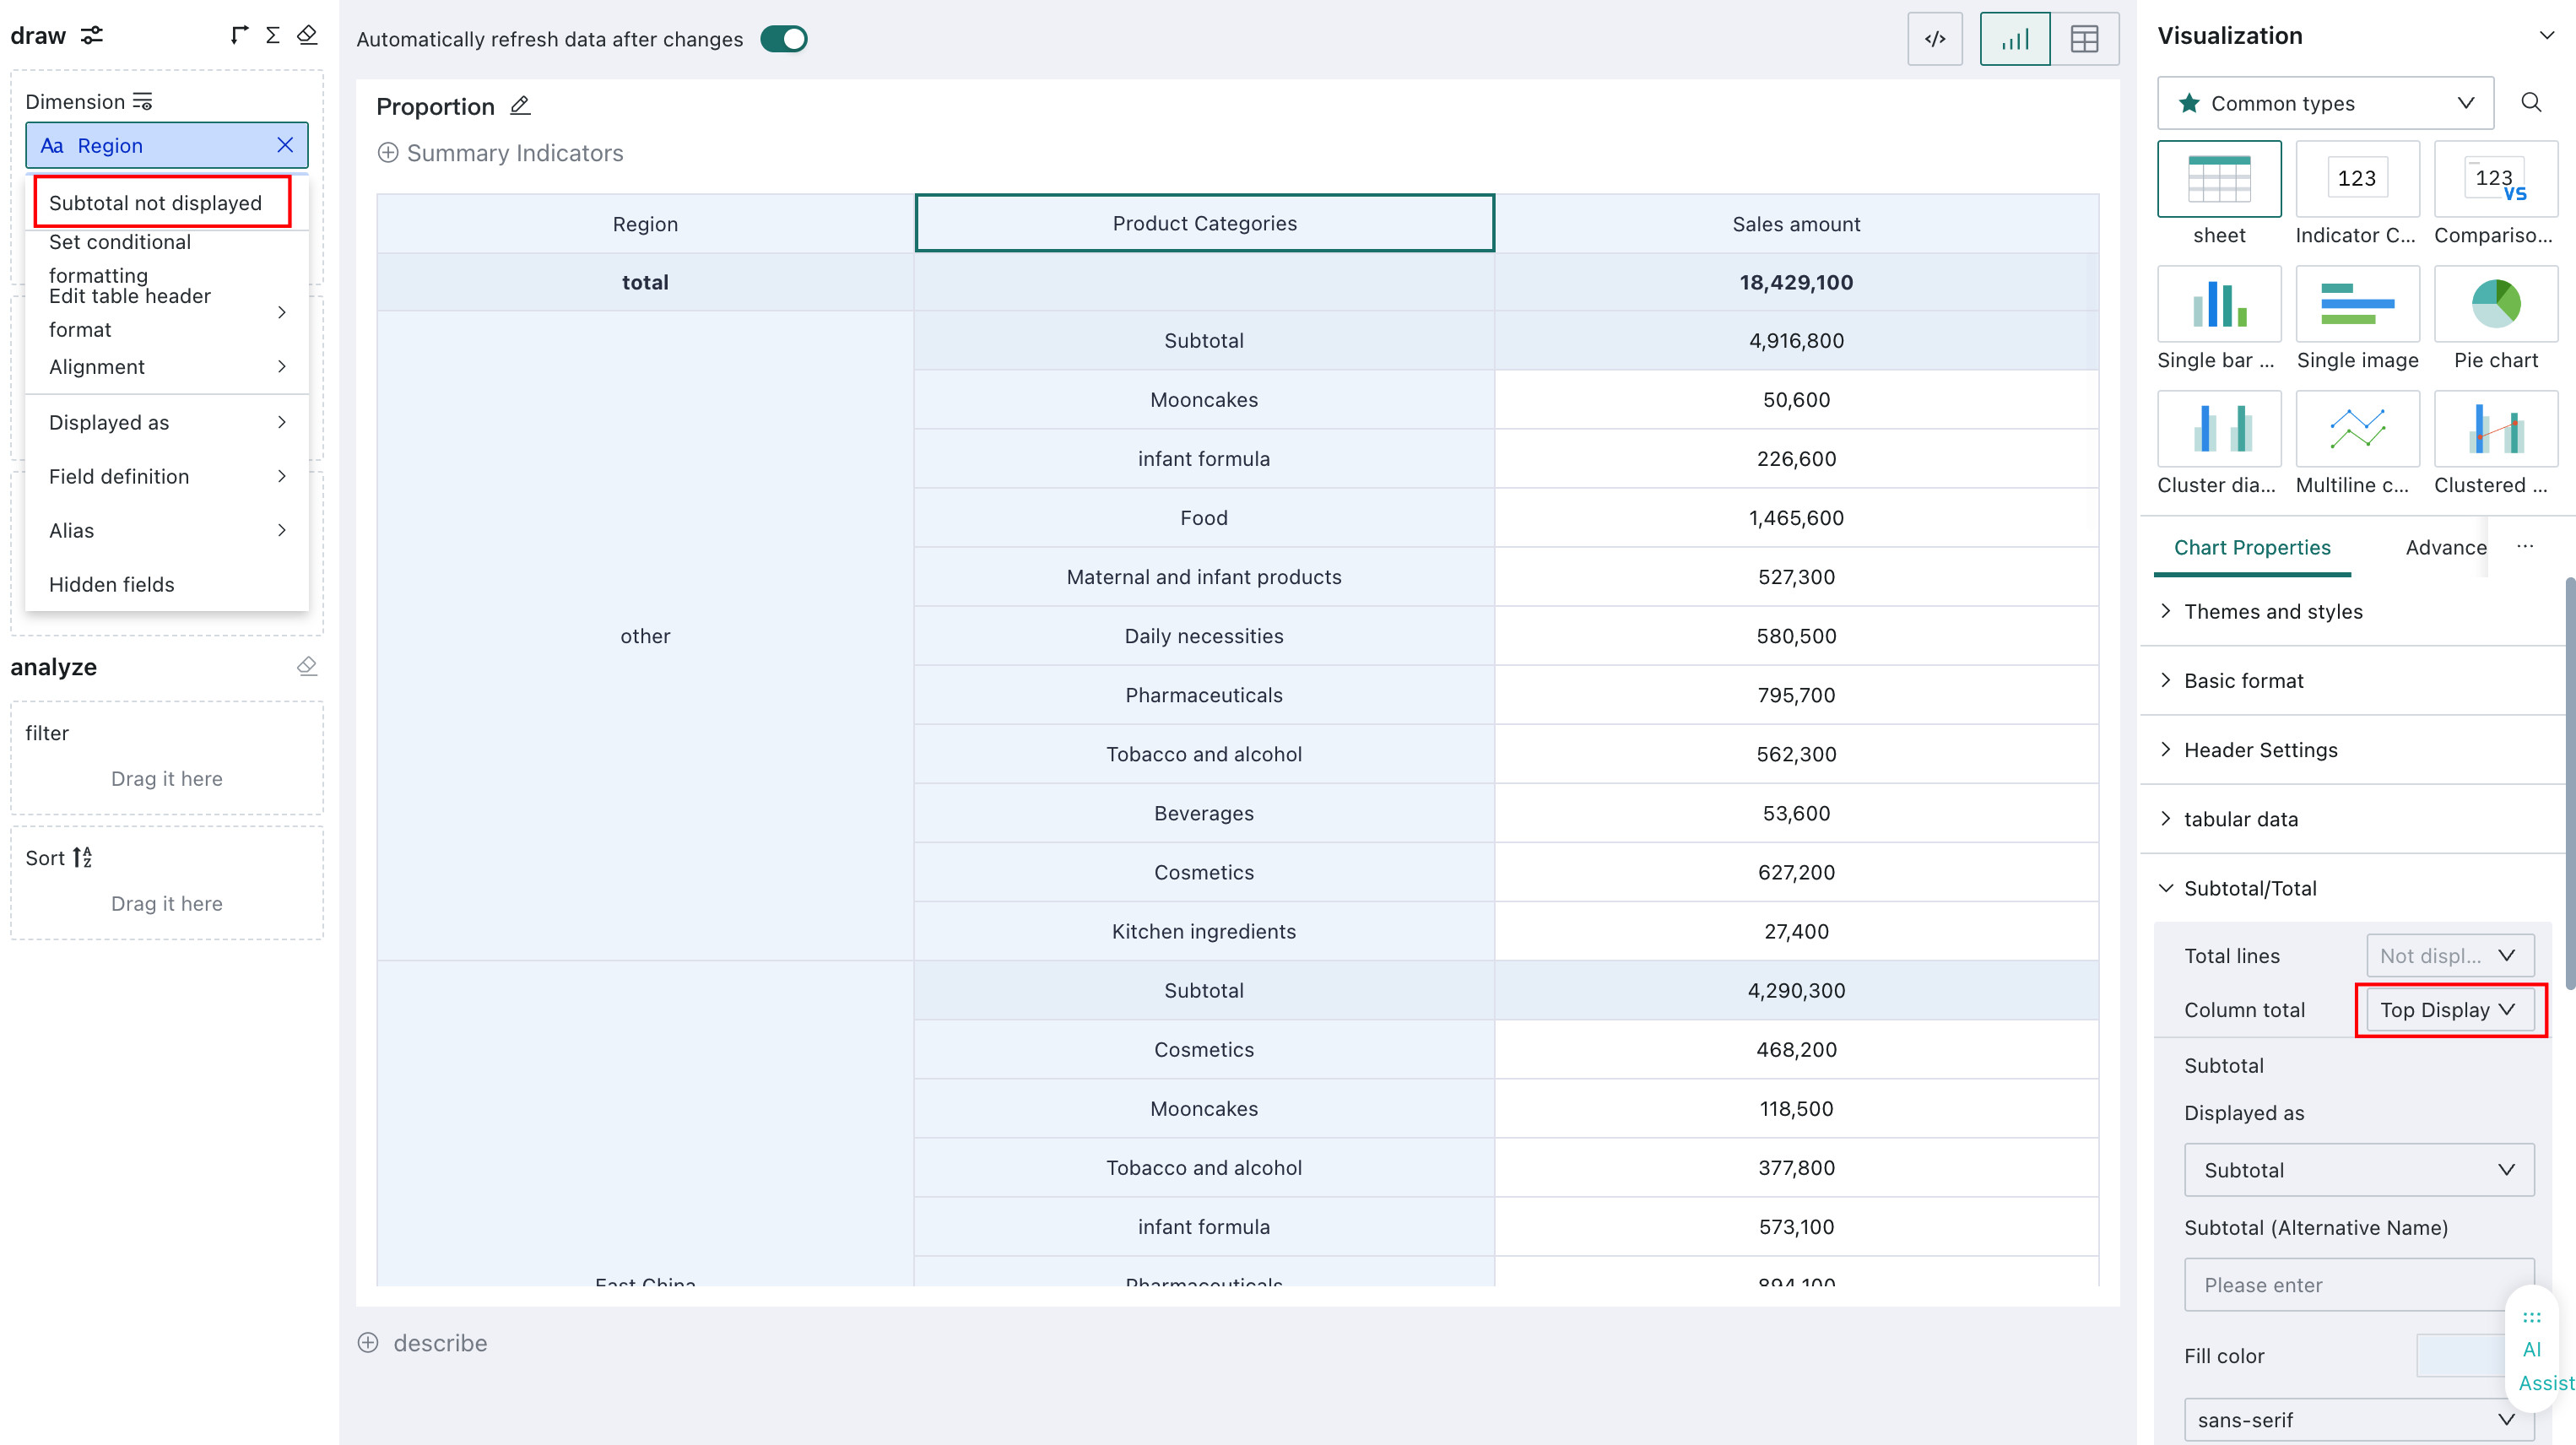
Configure Region to display subtotals. In Chart Properties > Subtotals and Totals, set the column total to display at the top. If you do not want to show subtotals but still want identical regions grouped together, drag Region into the sorting area.
NoteAfter subtotals are enabled, the data is grouped by default, so identical regions are automatically merged to ensure the subtotal results are meaningful.
-
In the measures area, set Sales Amount to Advanced Calculation > Proportion > By Column. For easier comparison, keep the original sales amount field in the table as well.
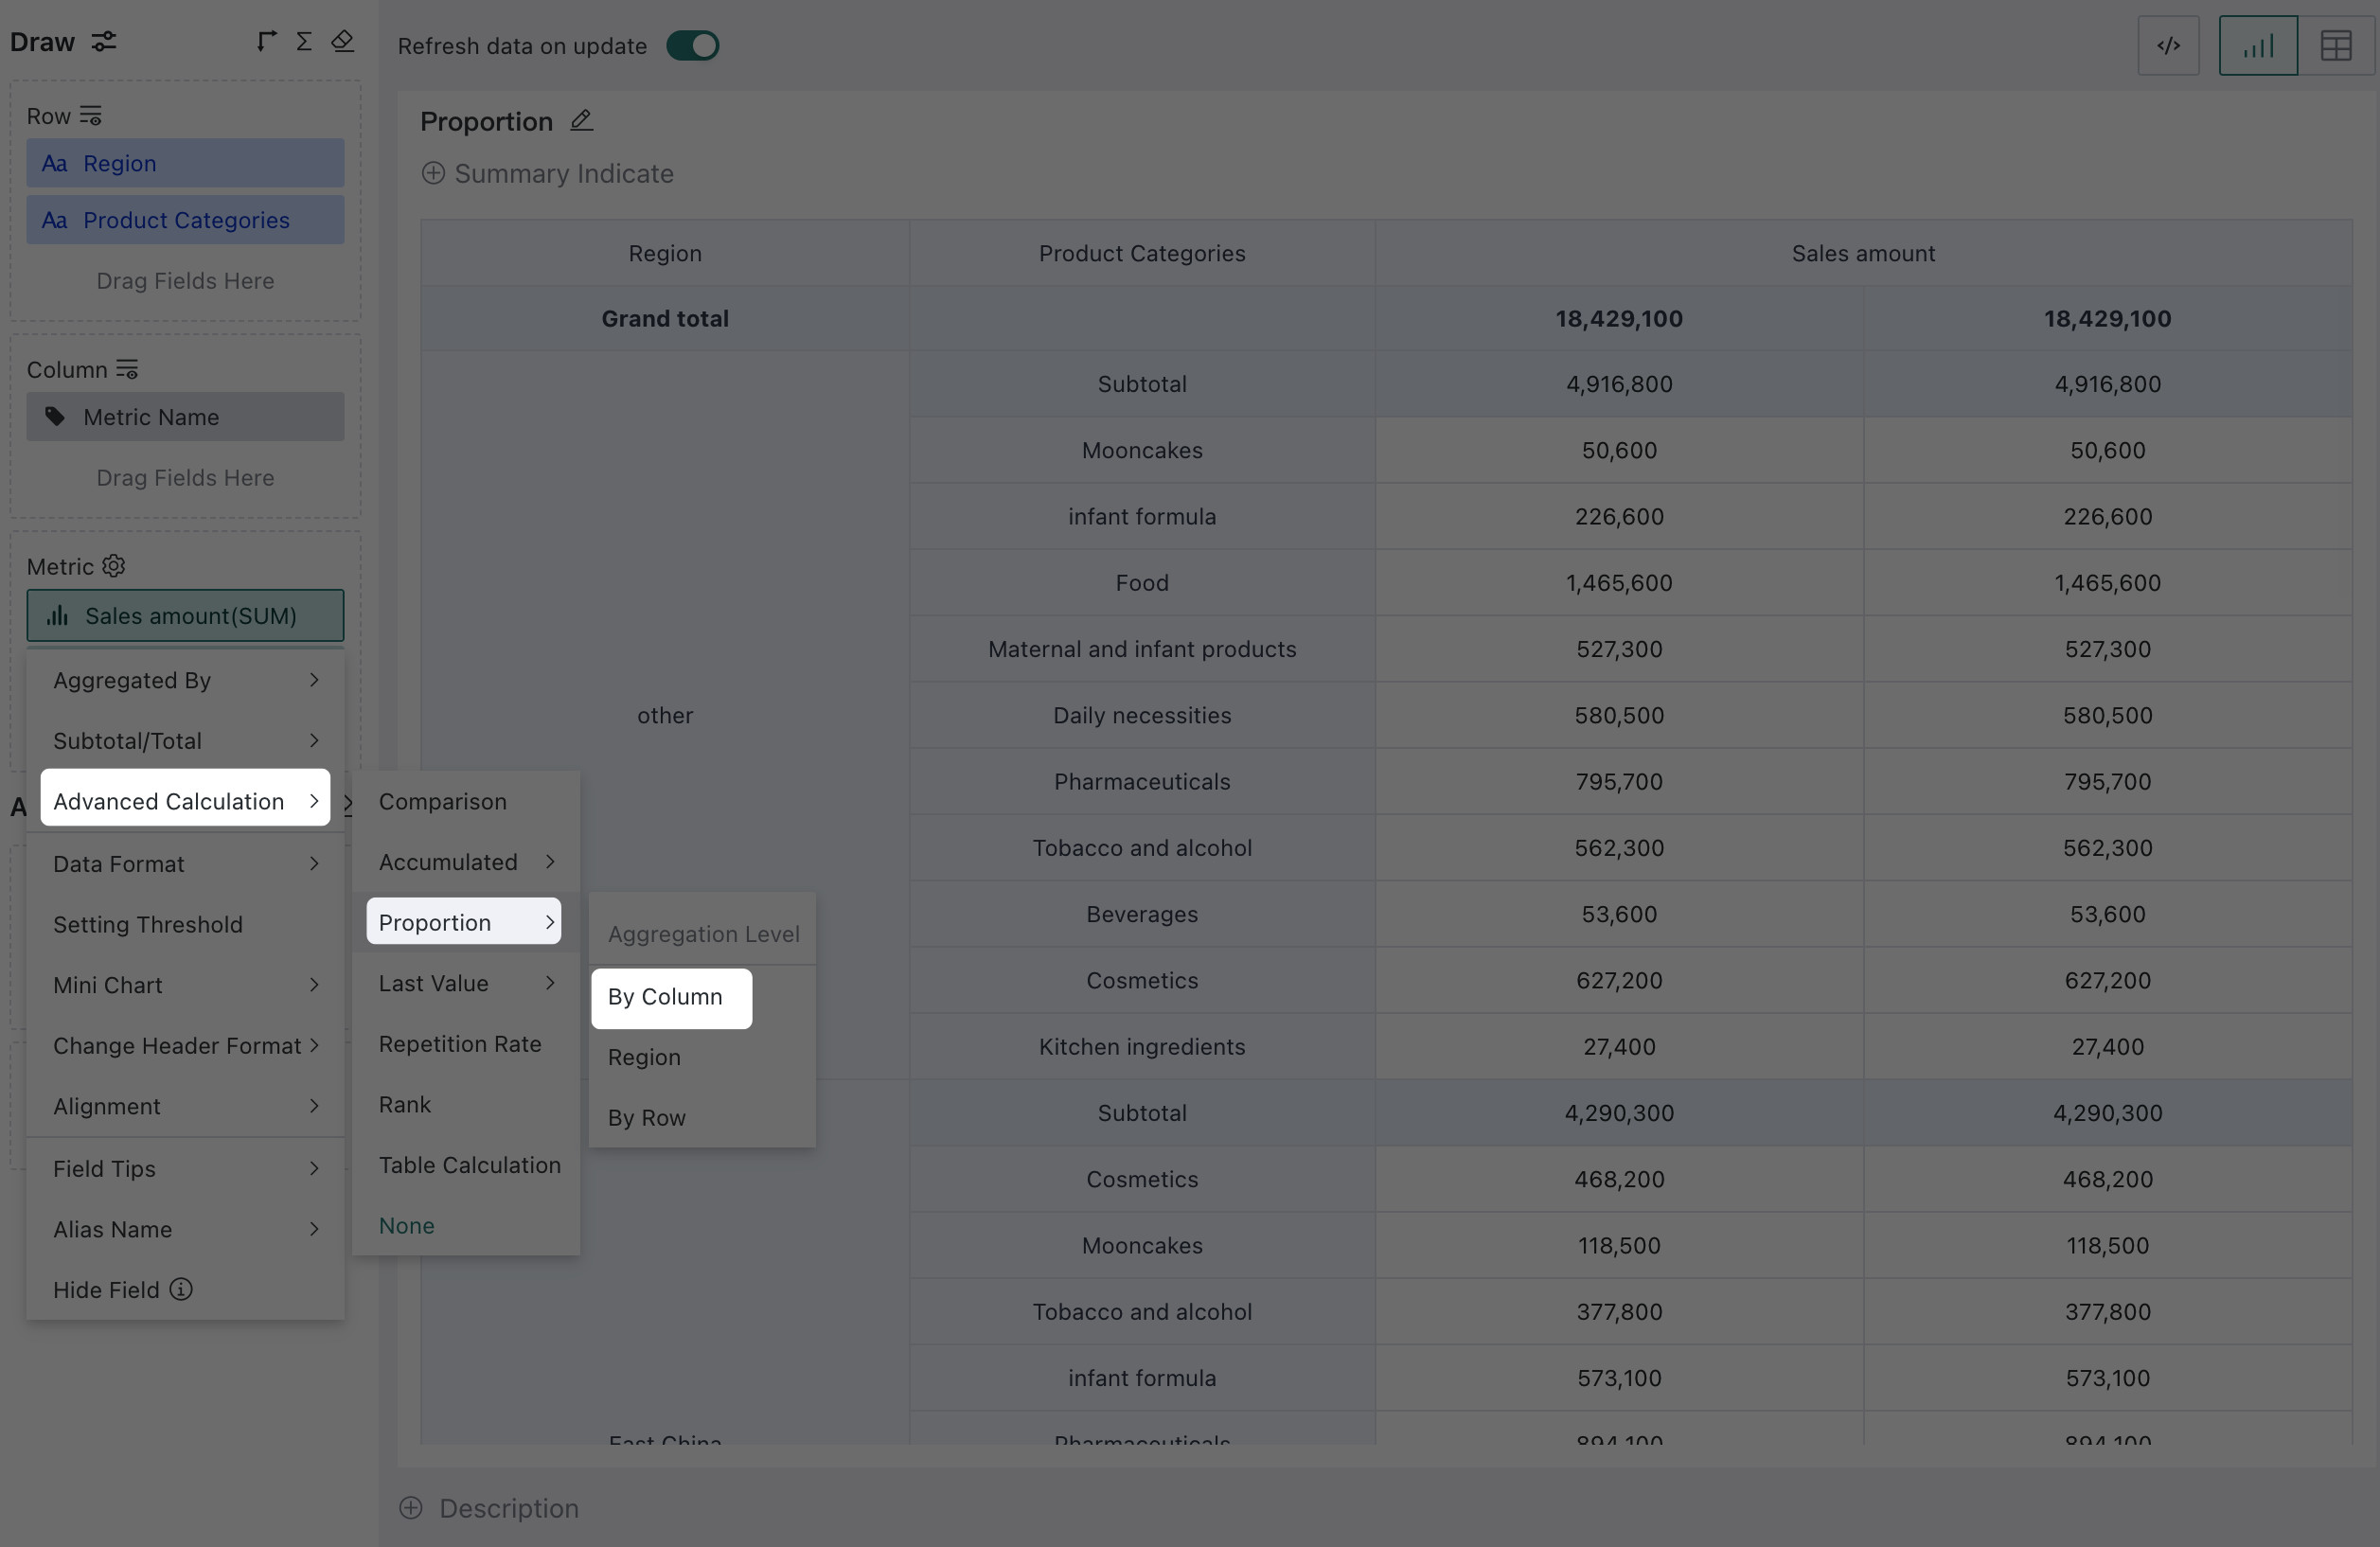
This calculates the share of sales amount for each region and product category against the national total sales amount. The vertical percentages add up to 100%.
By Row
When calculating By Row, the denominator is the row total of the measure being analyzed.
For example, when analyzing the percentage of sales amounts for different inventory statuses by product category across regions nationwide, subtotals and totals need to be displayed.
If no comparison dimension exists, the current value equals the row total, so the row percentage is 100%.
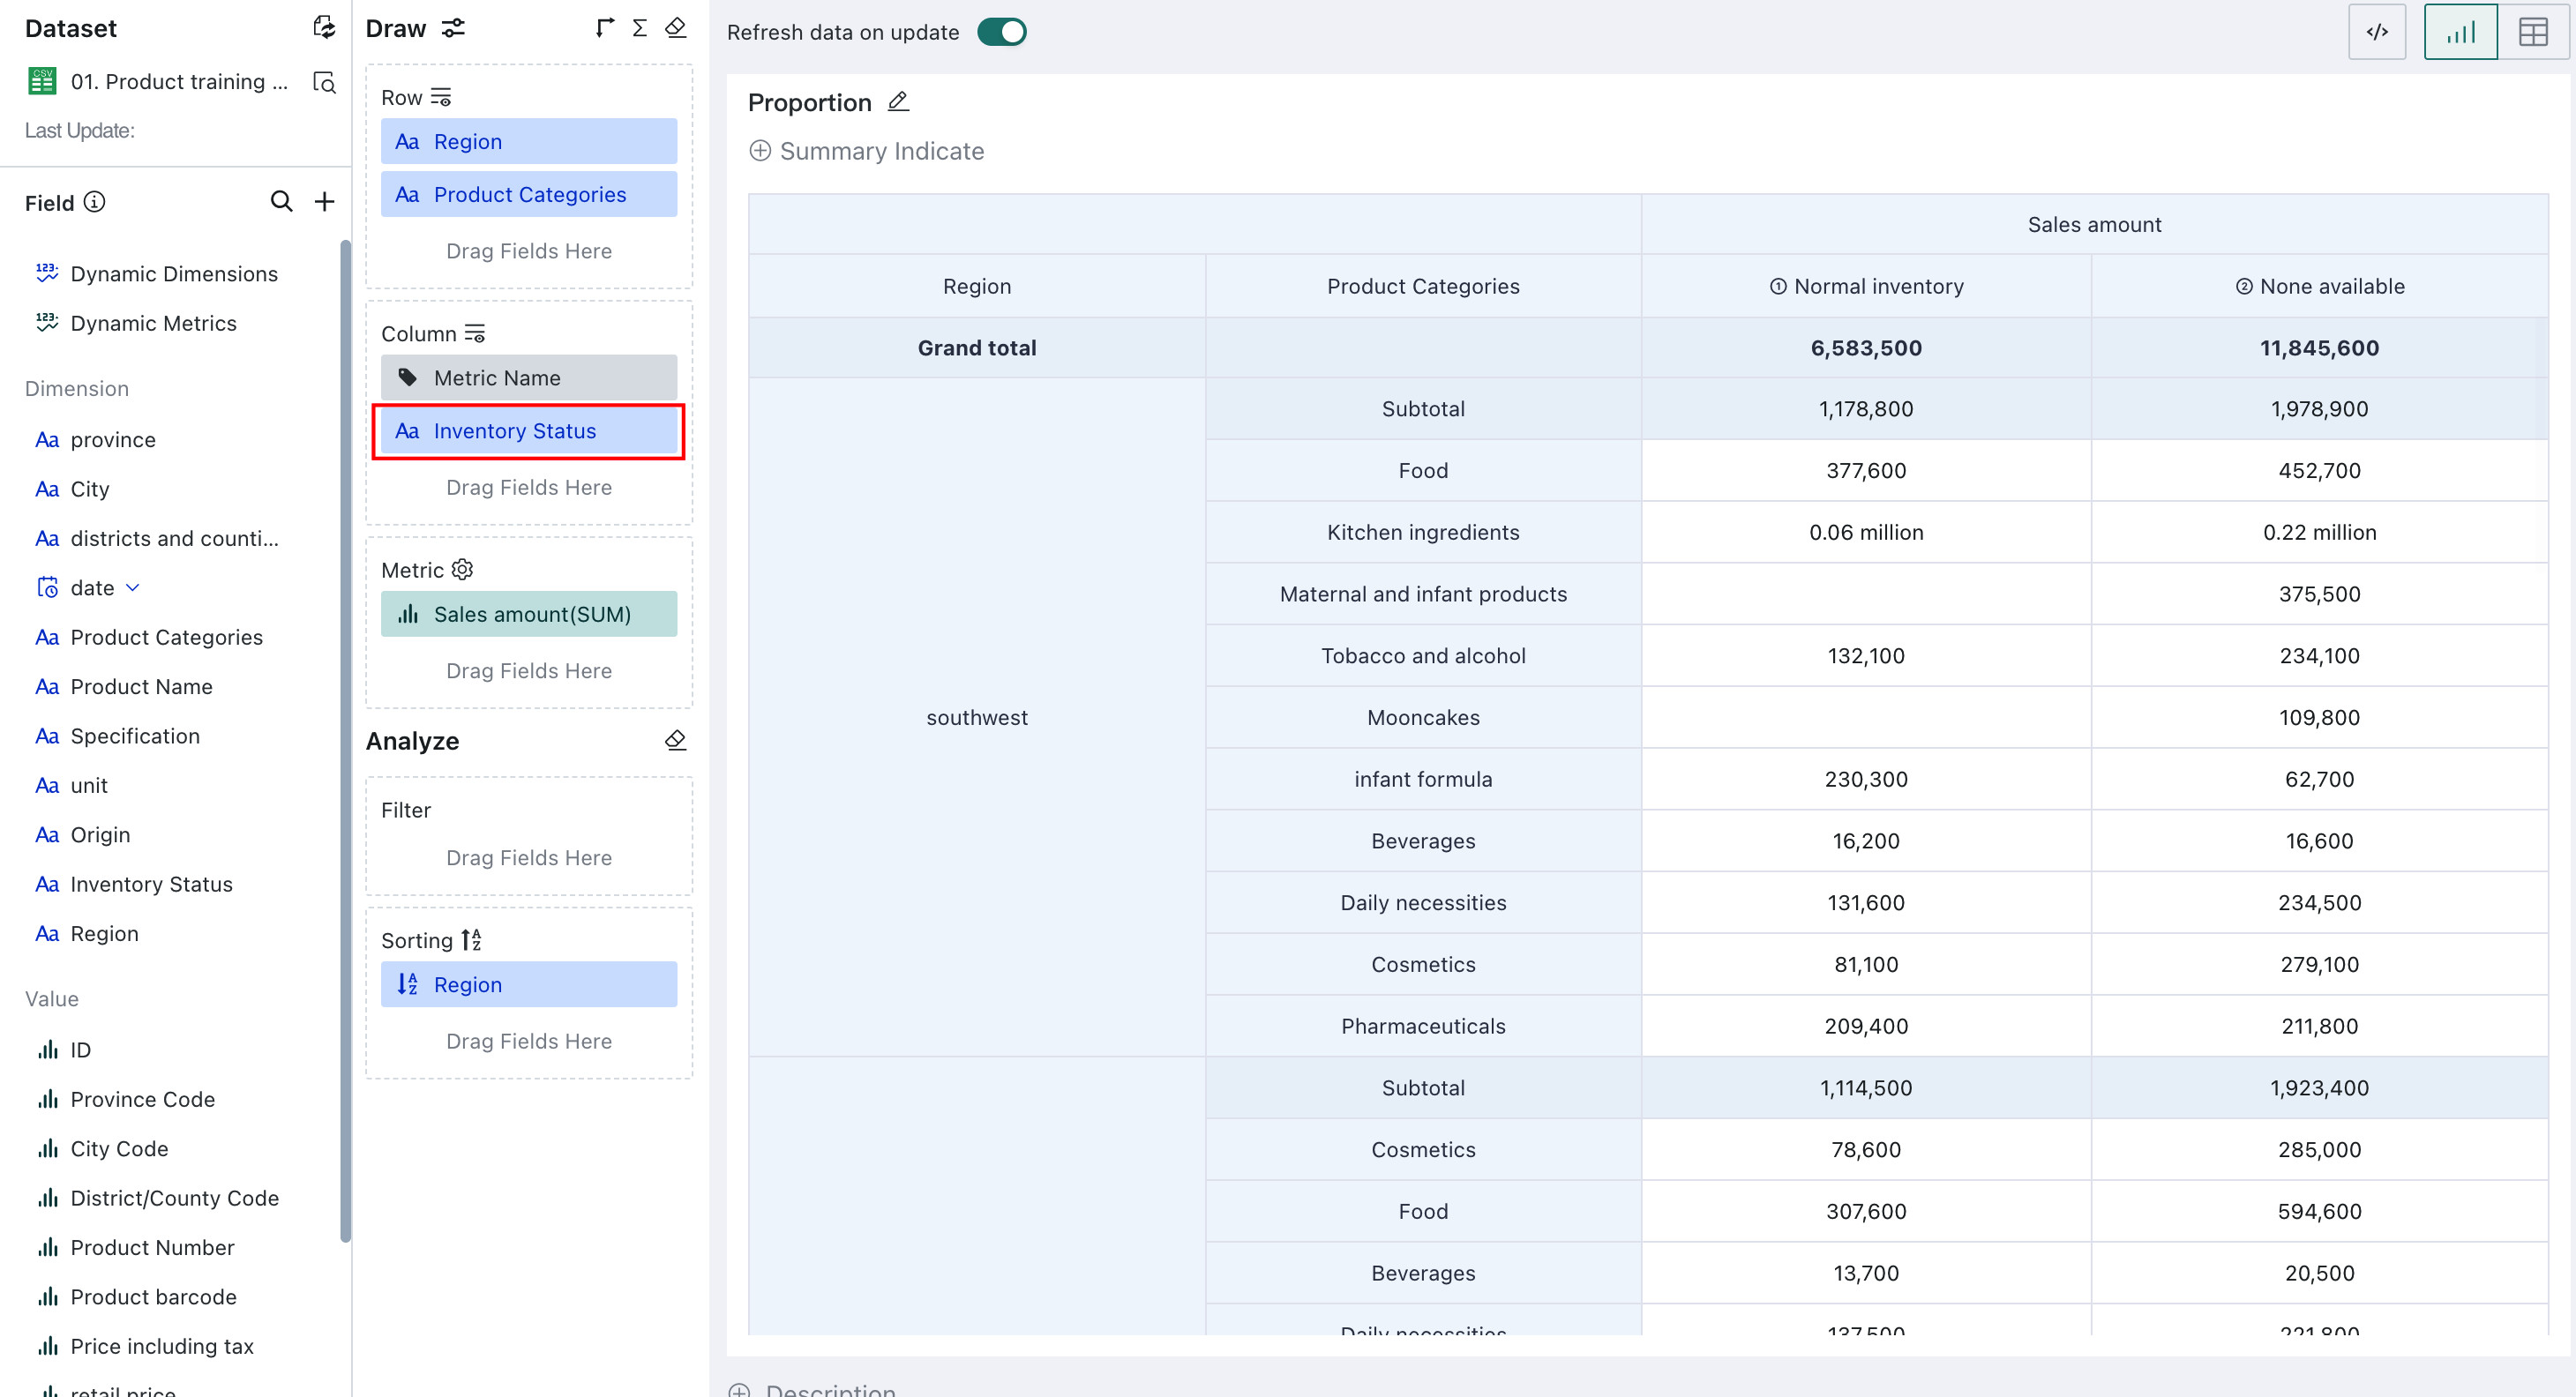
Here we introduce the comparison dimension Inventory Status to analyze the percentage of sales amounts under different inventory conditions and demonstrate the logic of row-based percentage calculation.
-
Based on steps 1 and 2 in By Column, drag Inventory Status into the comparison area.
-
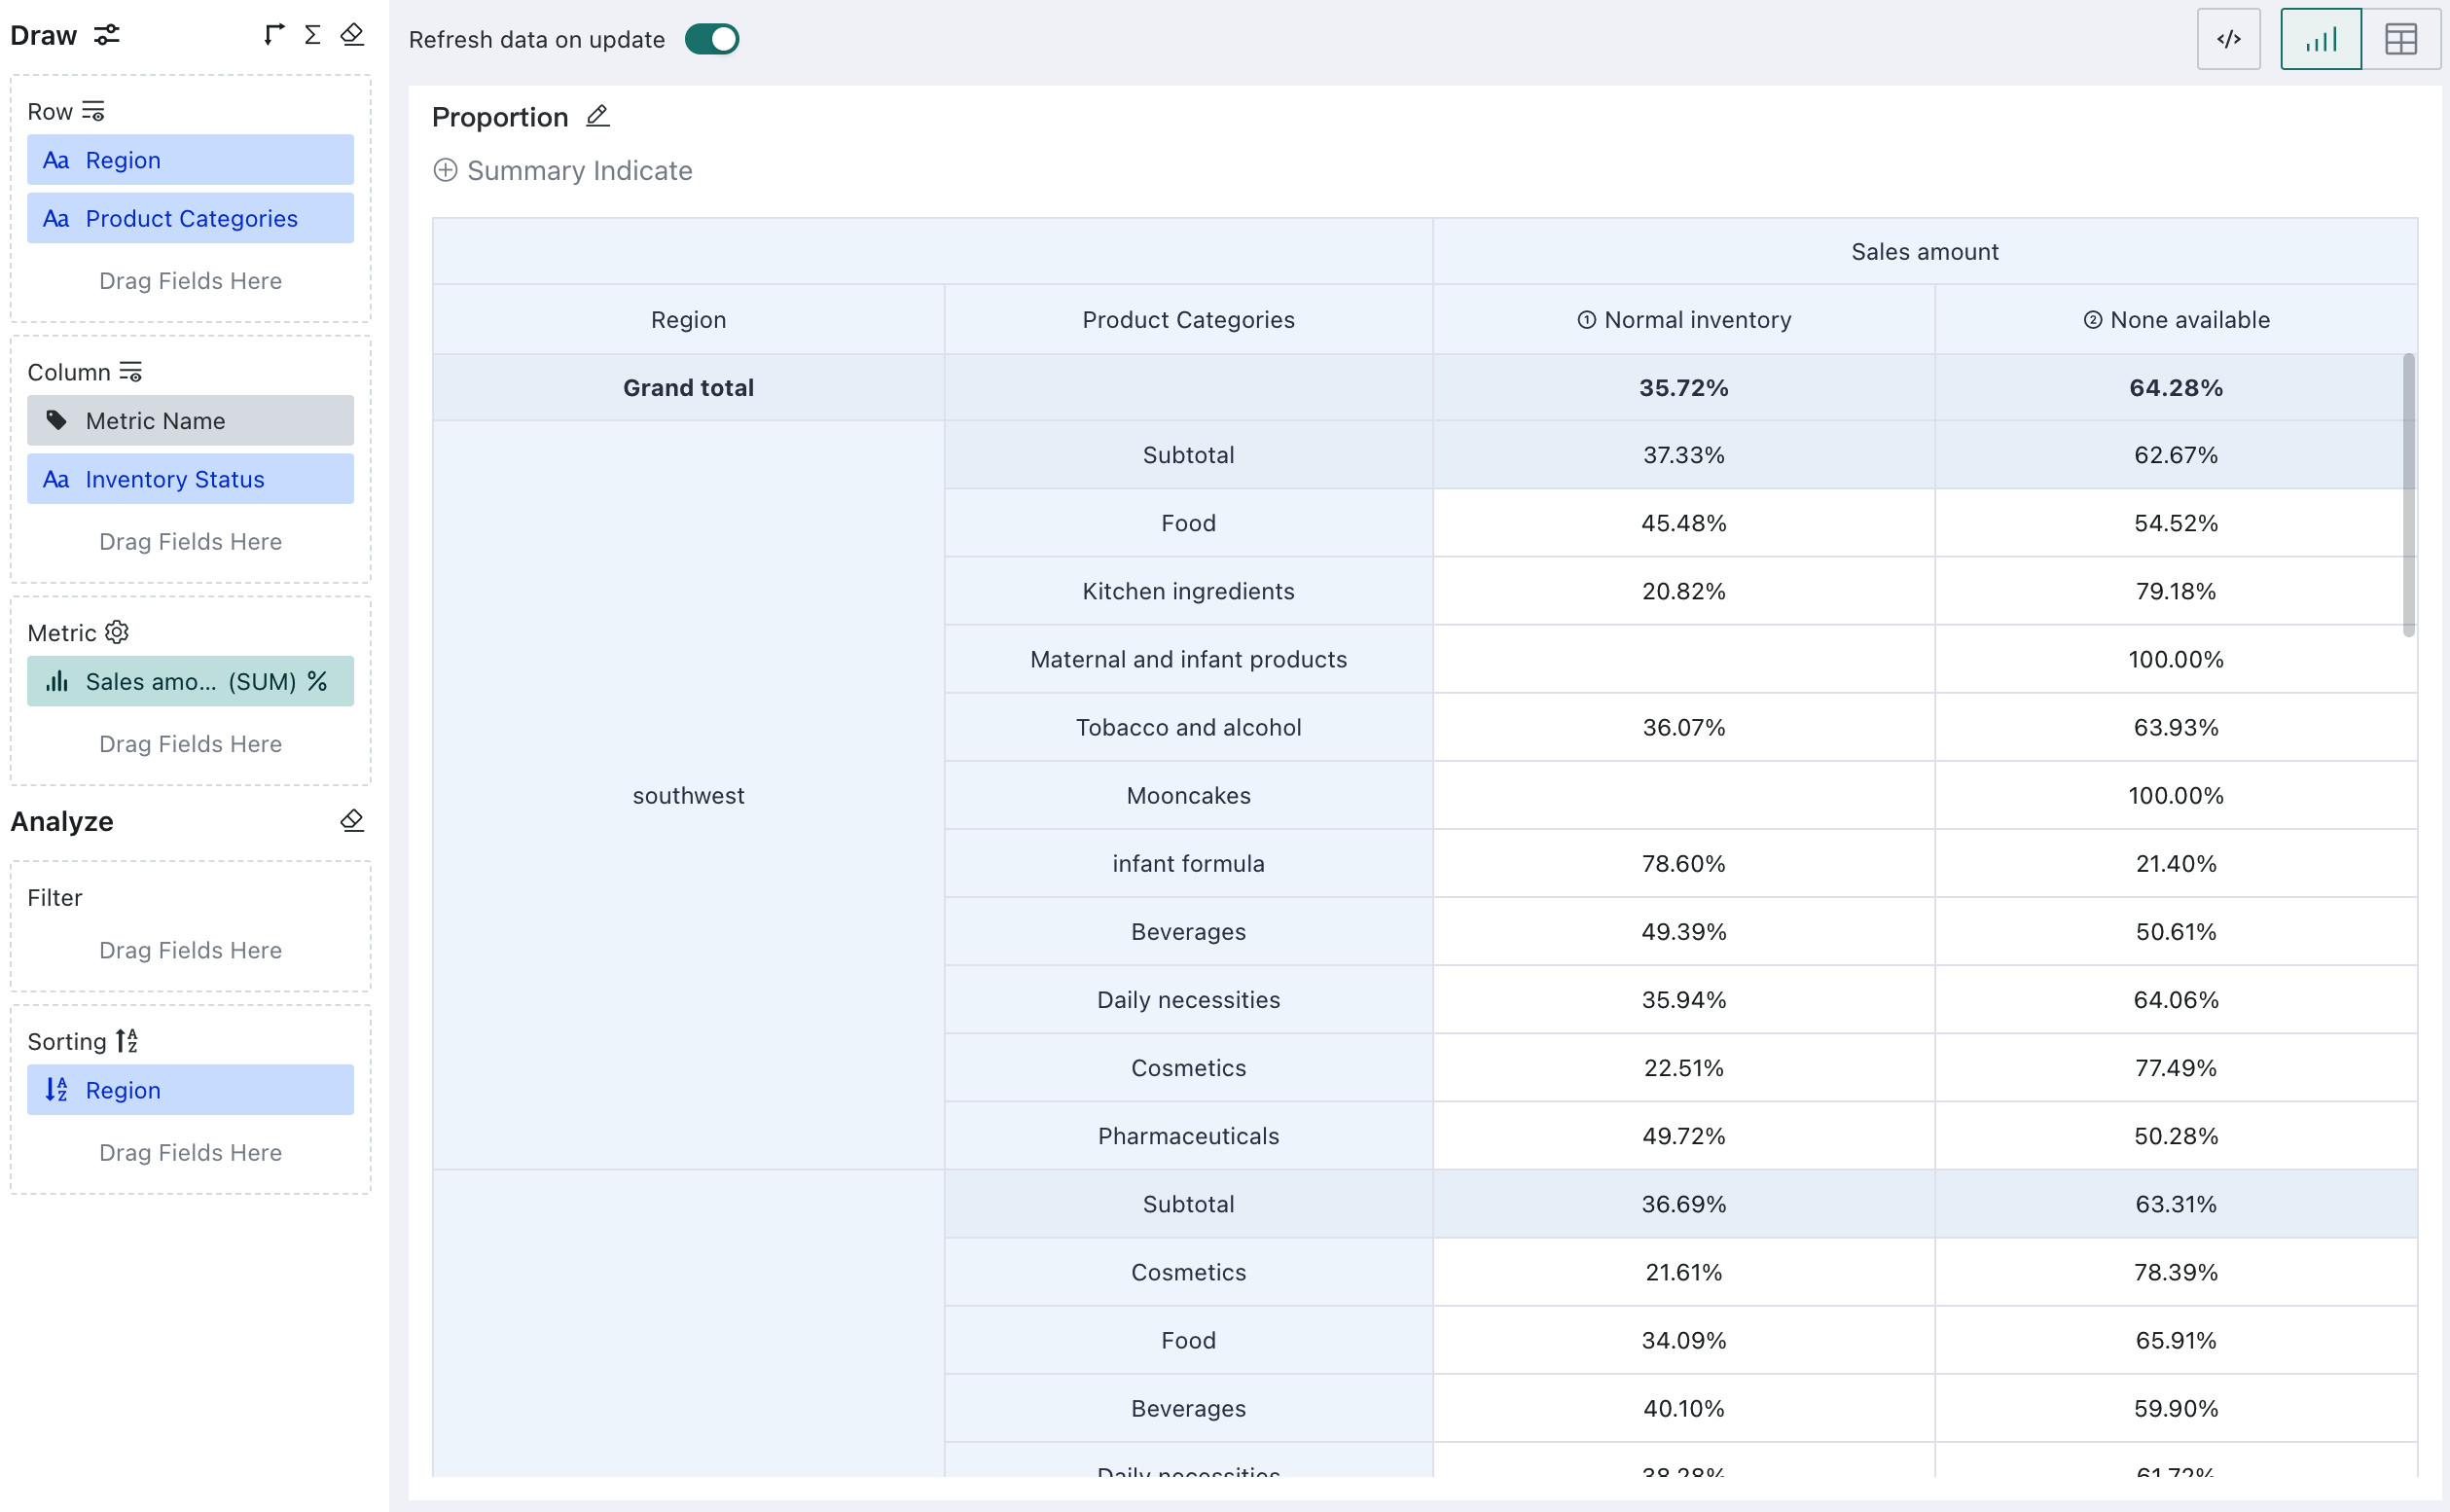
In the measures area, set Sales Amount to Advanced Calculation > Proportion > By Row.
This calculates the percentage of sales amounts for different inventory statuses within each region and product category. The horizontal percentages add up to 100%.
Intra-Group Percentage
Intra-group percentage is calculated by specifying a dimension as the calculation basis.
When there is more than one dimension in the dimension or comparison area, percentage-of-total can be calculated based on a specified dimension. Users can choose one of the first N-1 fields in the dimension area as the calculation basis, where N is the total number of dimension fields.
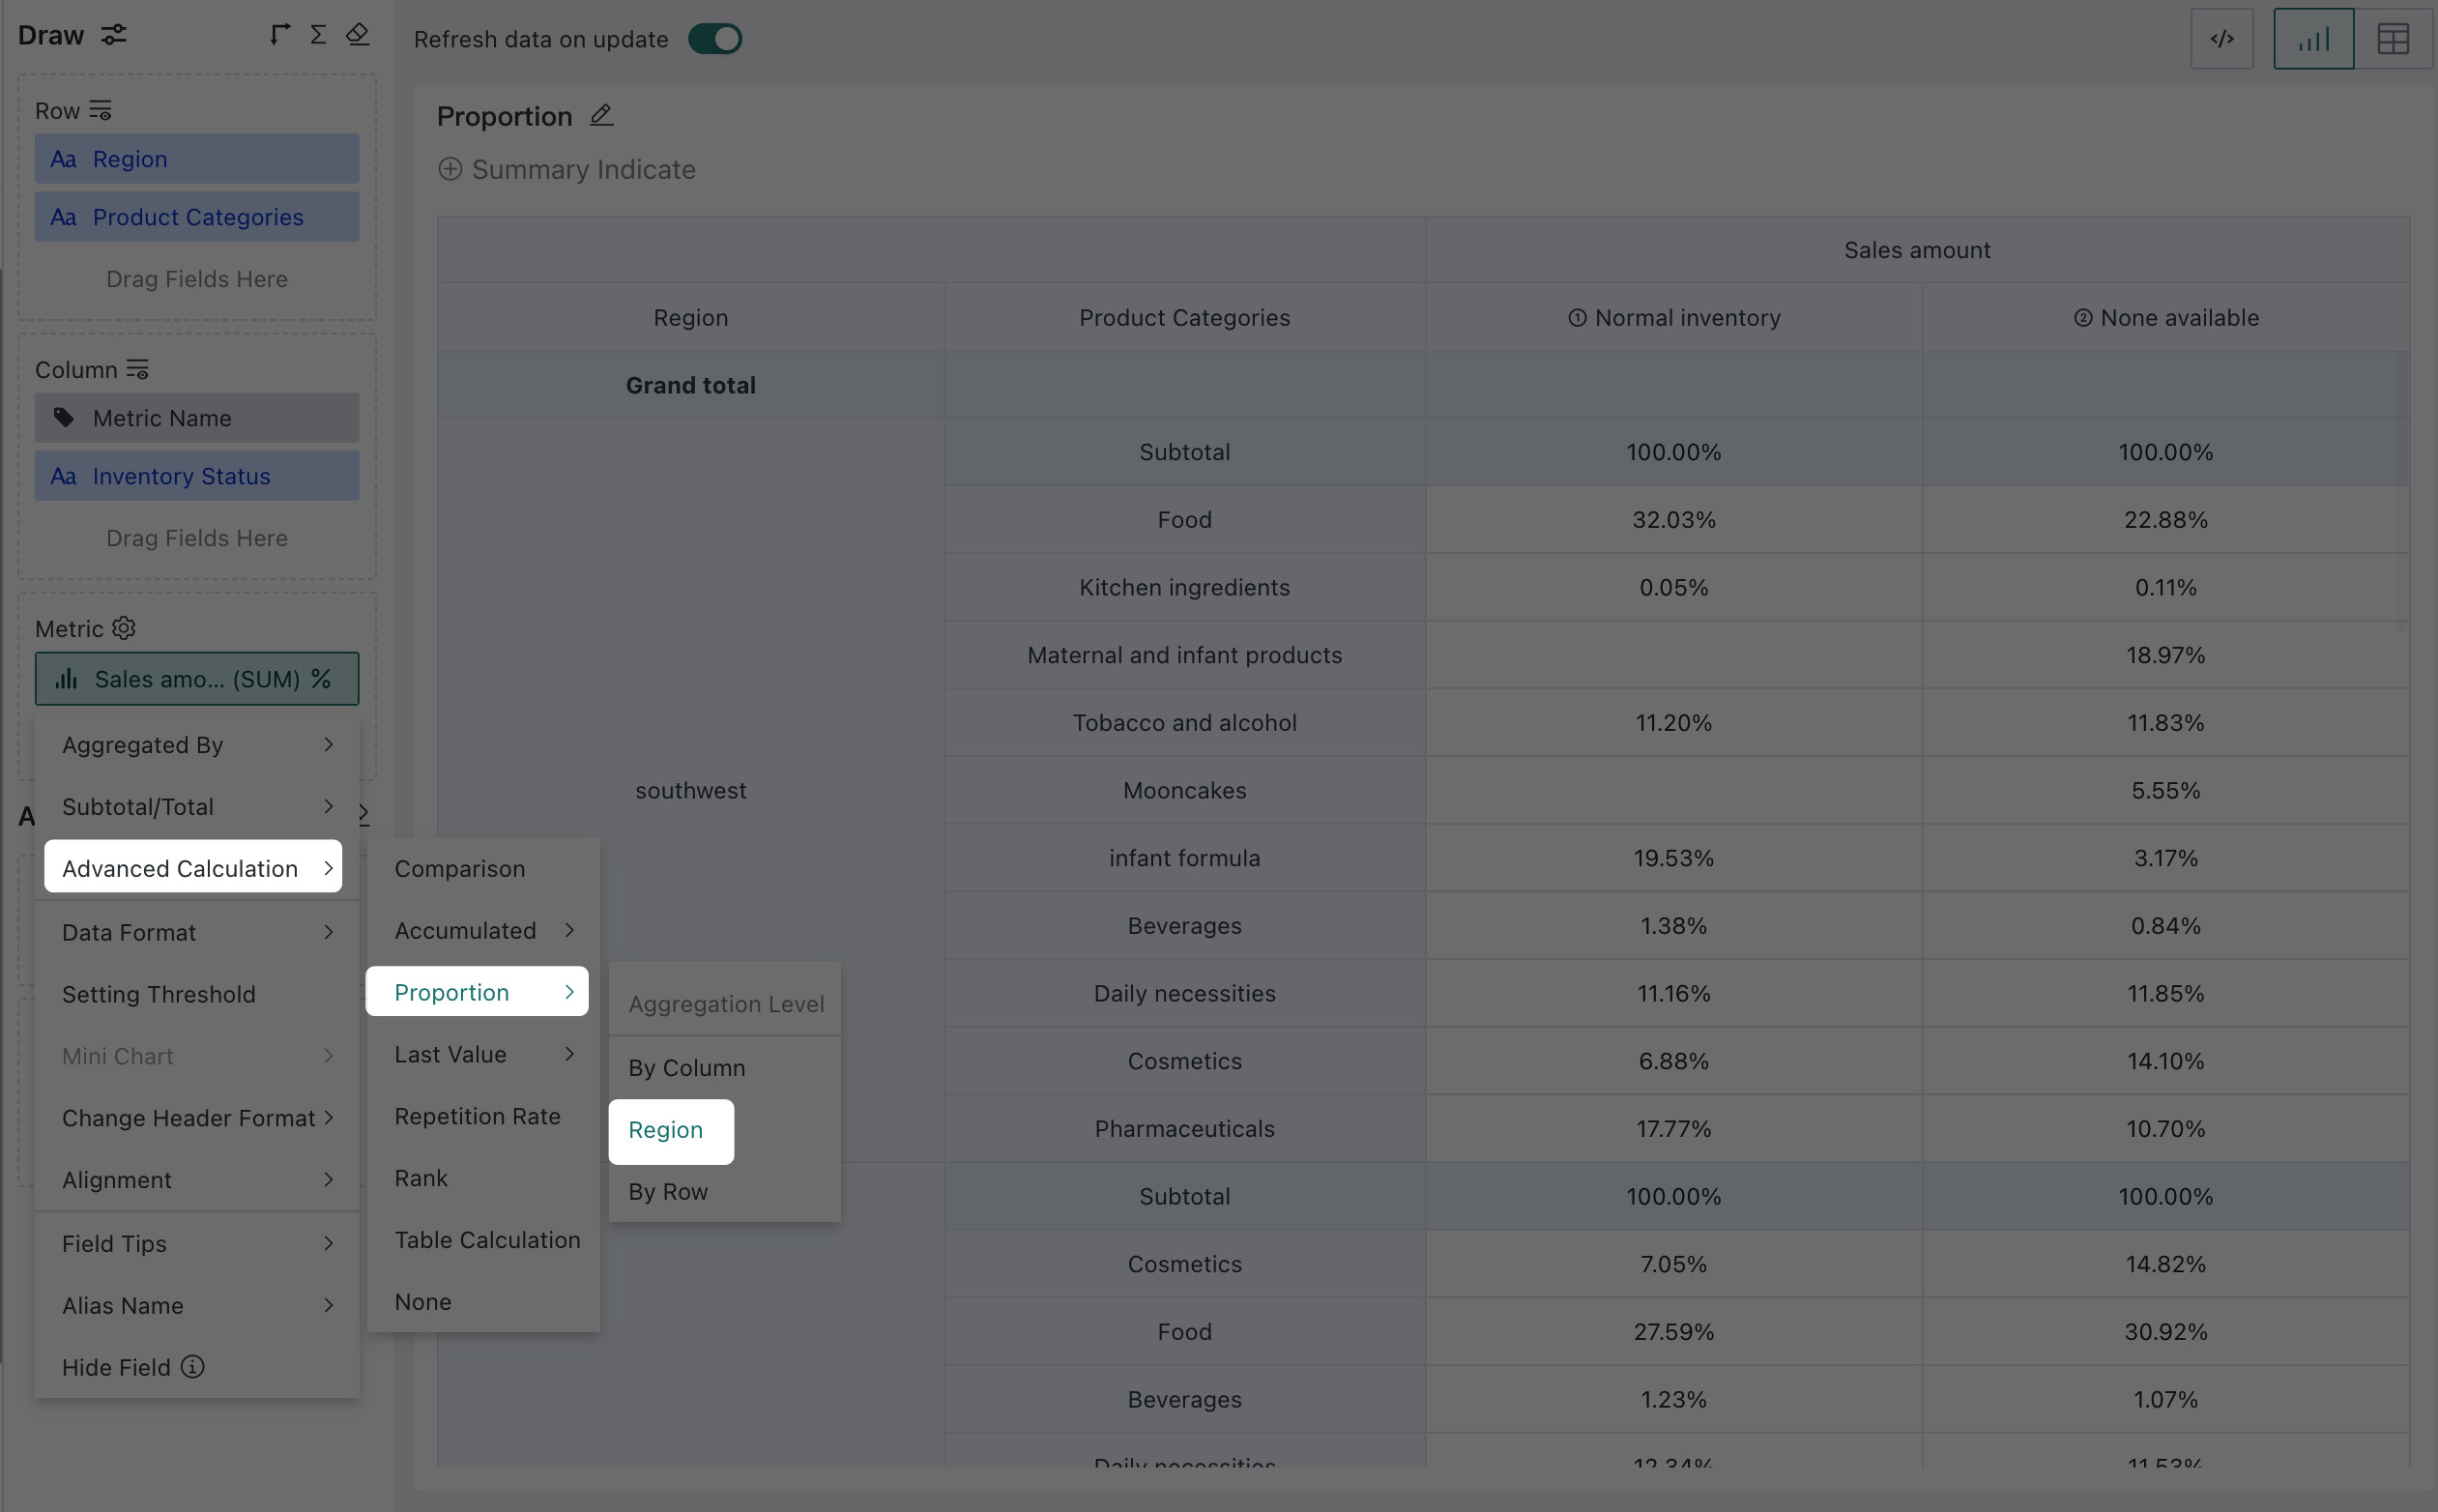
For example, when you need to calculate the proportion of each product category within each region, you can choose Region as the basis for the percentage calculation.
-
Repeat step 1 in By Column and drag the required dimensions and measures into the analysis area.
-
Repeat step 2 in By Column and enable subtotals and totals as needed.
-
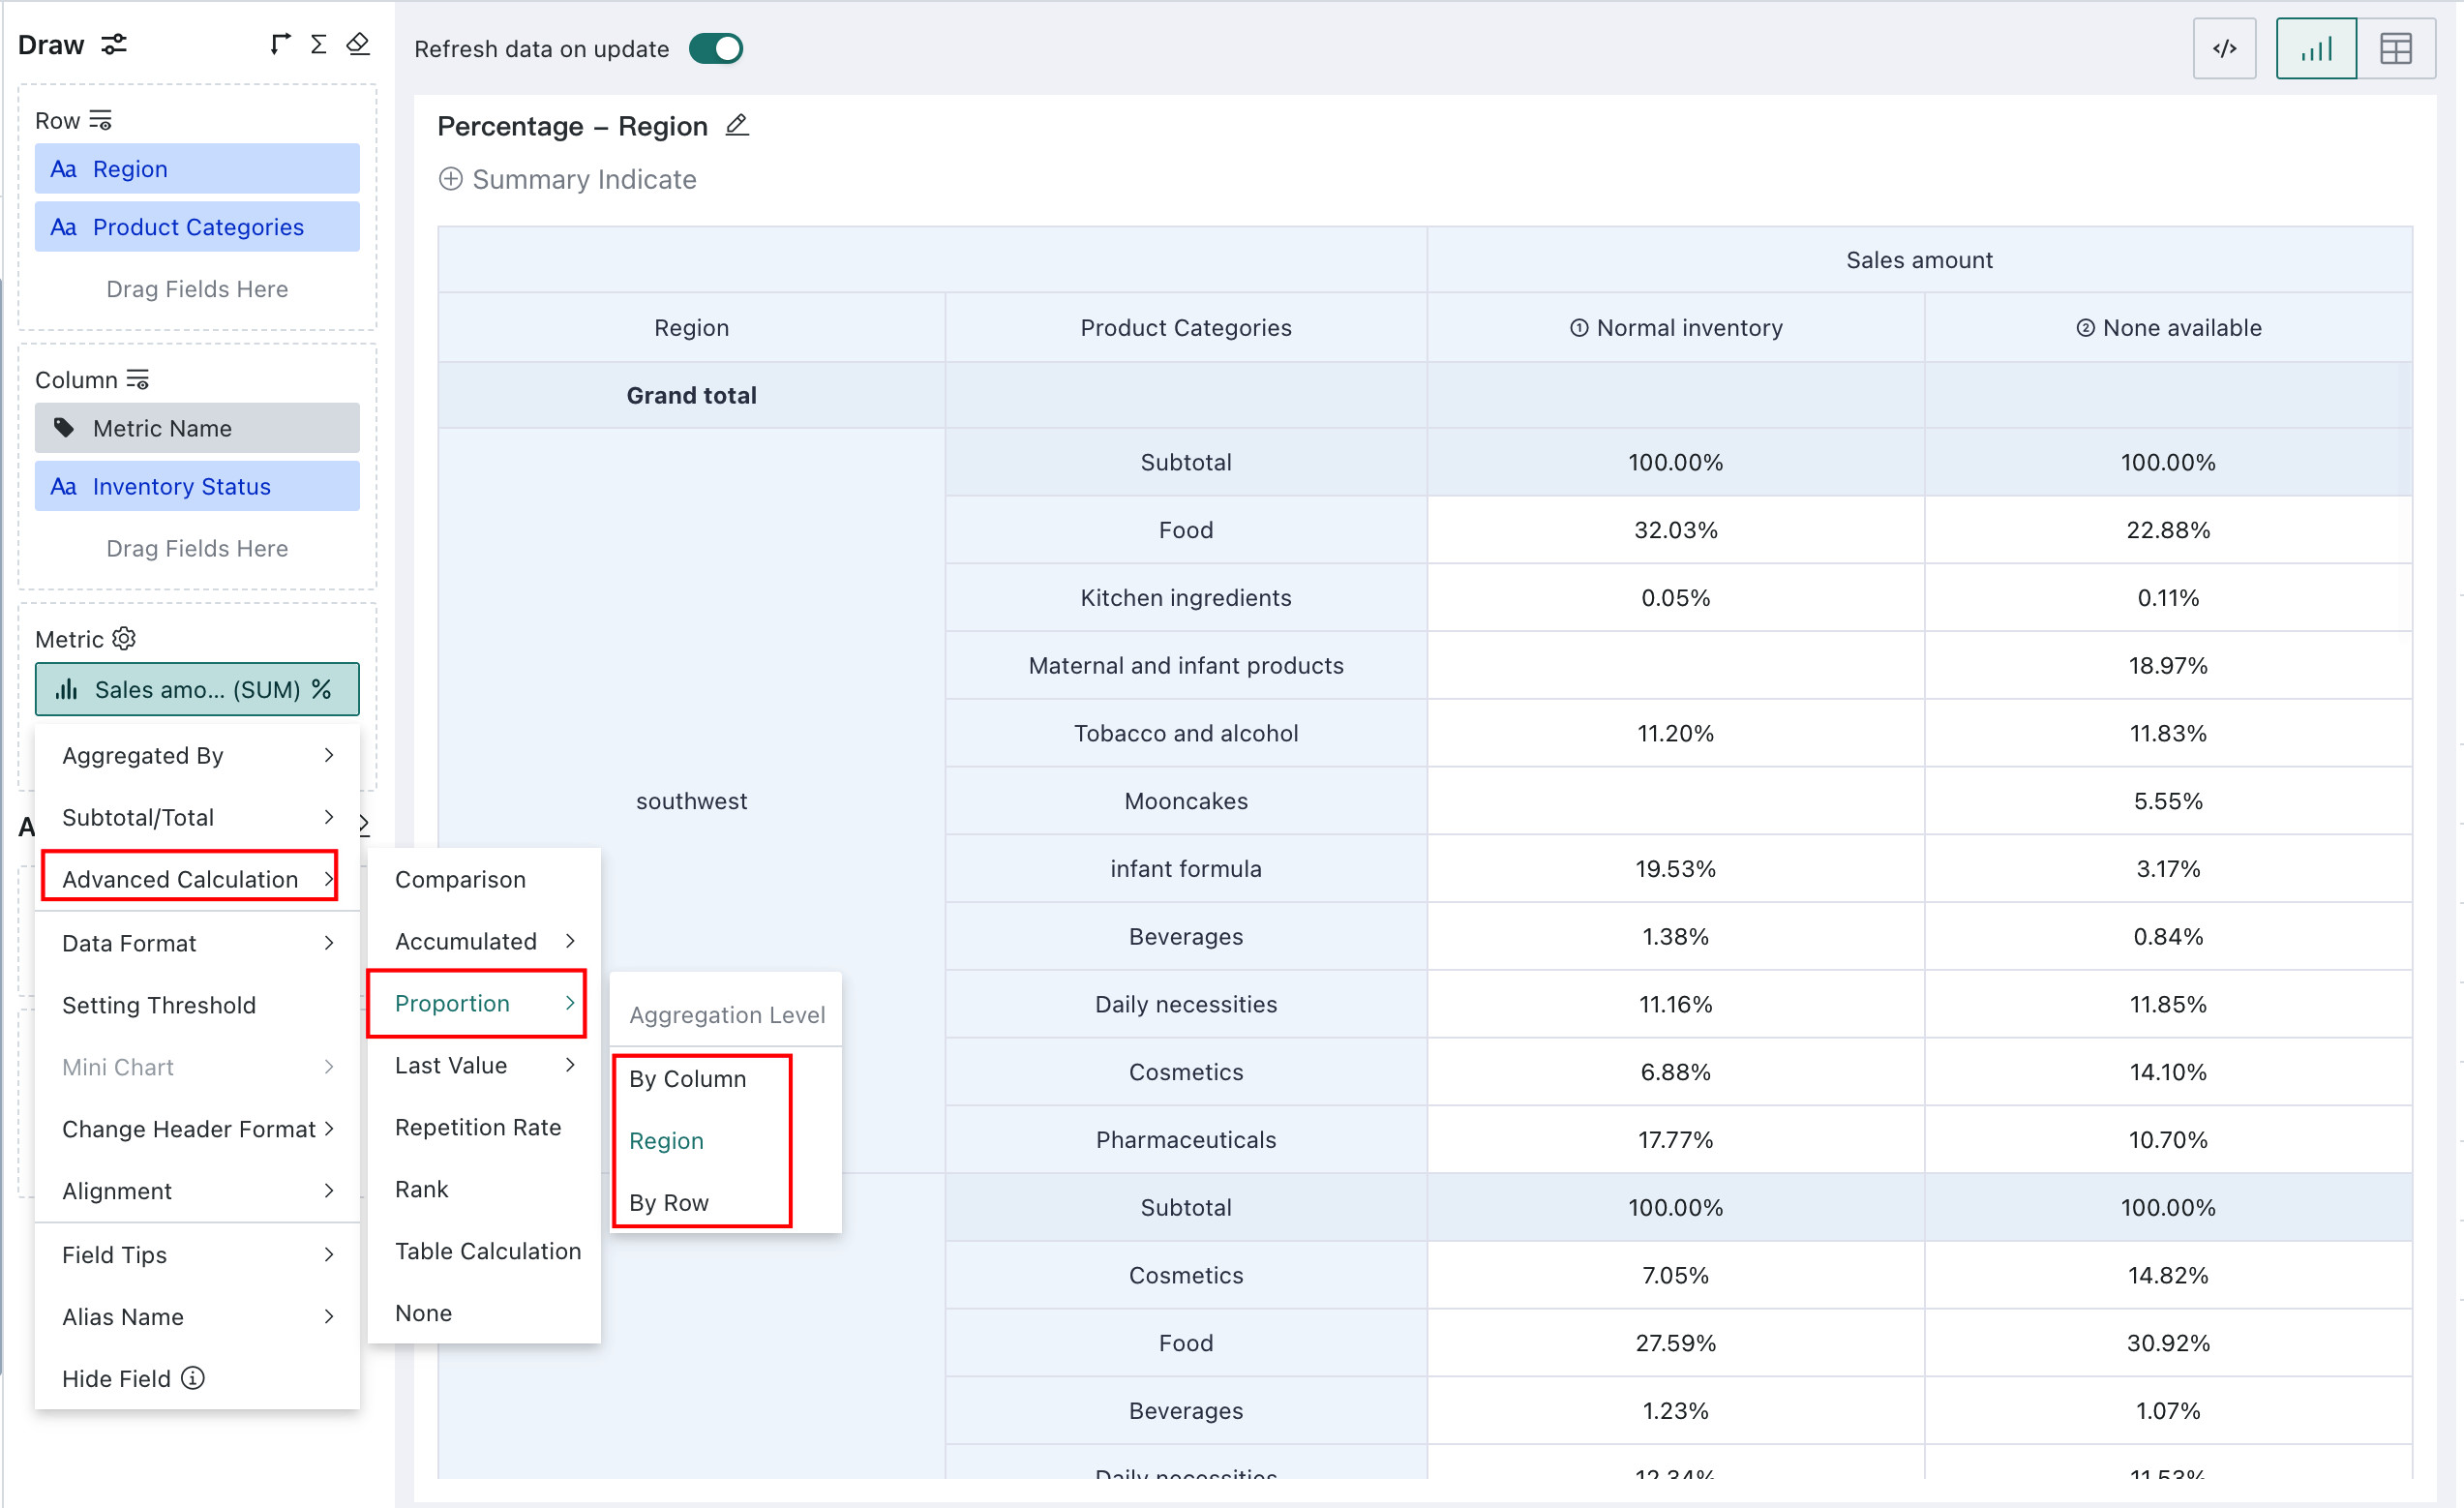
In the measures area, set Sales Amount to Advanced Calculation > Proportion > Region.
This gives the intra-group percentage, that is, sales amount by product category within a region / total sales amount of that region × 100%. The percentages of all product categories within each region add up to 100%.
Limitations
- Detail tables do not support this calculation.
- Charts without dimensions, such as metric cards, do not support this calculation.
- Intra-group percentage is supported only when there is more than one dimension in the dimension or comparison area.