Performance Tracking
Overview
Performance Tracking is a monitoring and tracking feature provided by Guandata that displays real-time performance data of the platform. It can help users track the performance of the current Dashboard in a timely manner. By recording key indicators such as board loading speed and card data calculation duration, it can help users self-inspect and locate performance issues.
For example, when the board loading speed is too slow, users can consider optimizing the board card design or data source to improve performance.
- The "Performance Tracking" feature is only available in V5.1.0 and above.
- Currently, Performance Tracking data is not recorded in the database and is only for users to analyze real-time performance issues. If there are future iterations, updates will be released in a timely manner.
Usage Guide
Enable Performance Tracking
The Performance Tracking entry is located in "More" in the upper right corner of the Dashboard. To use this feature, please contact Guandata staff in advance to enable it for you.
Performance Tracking Interpretation
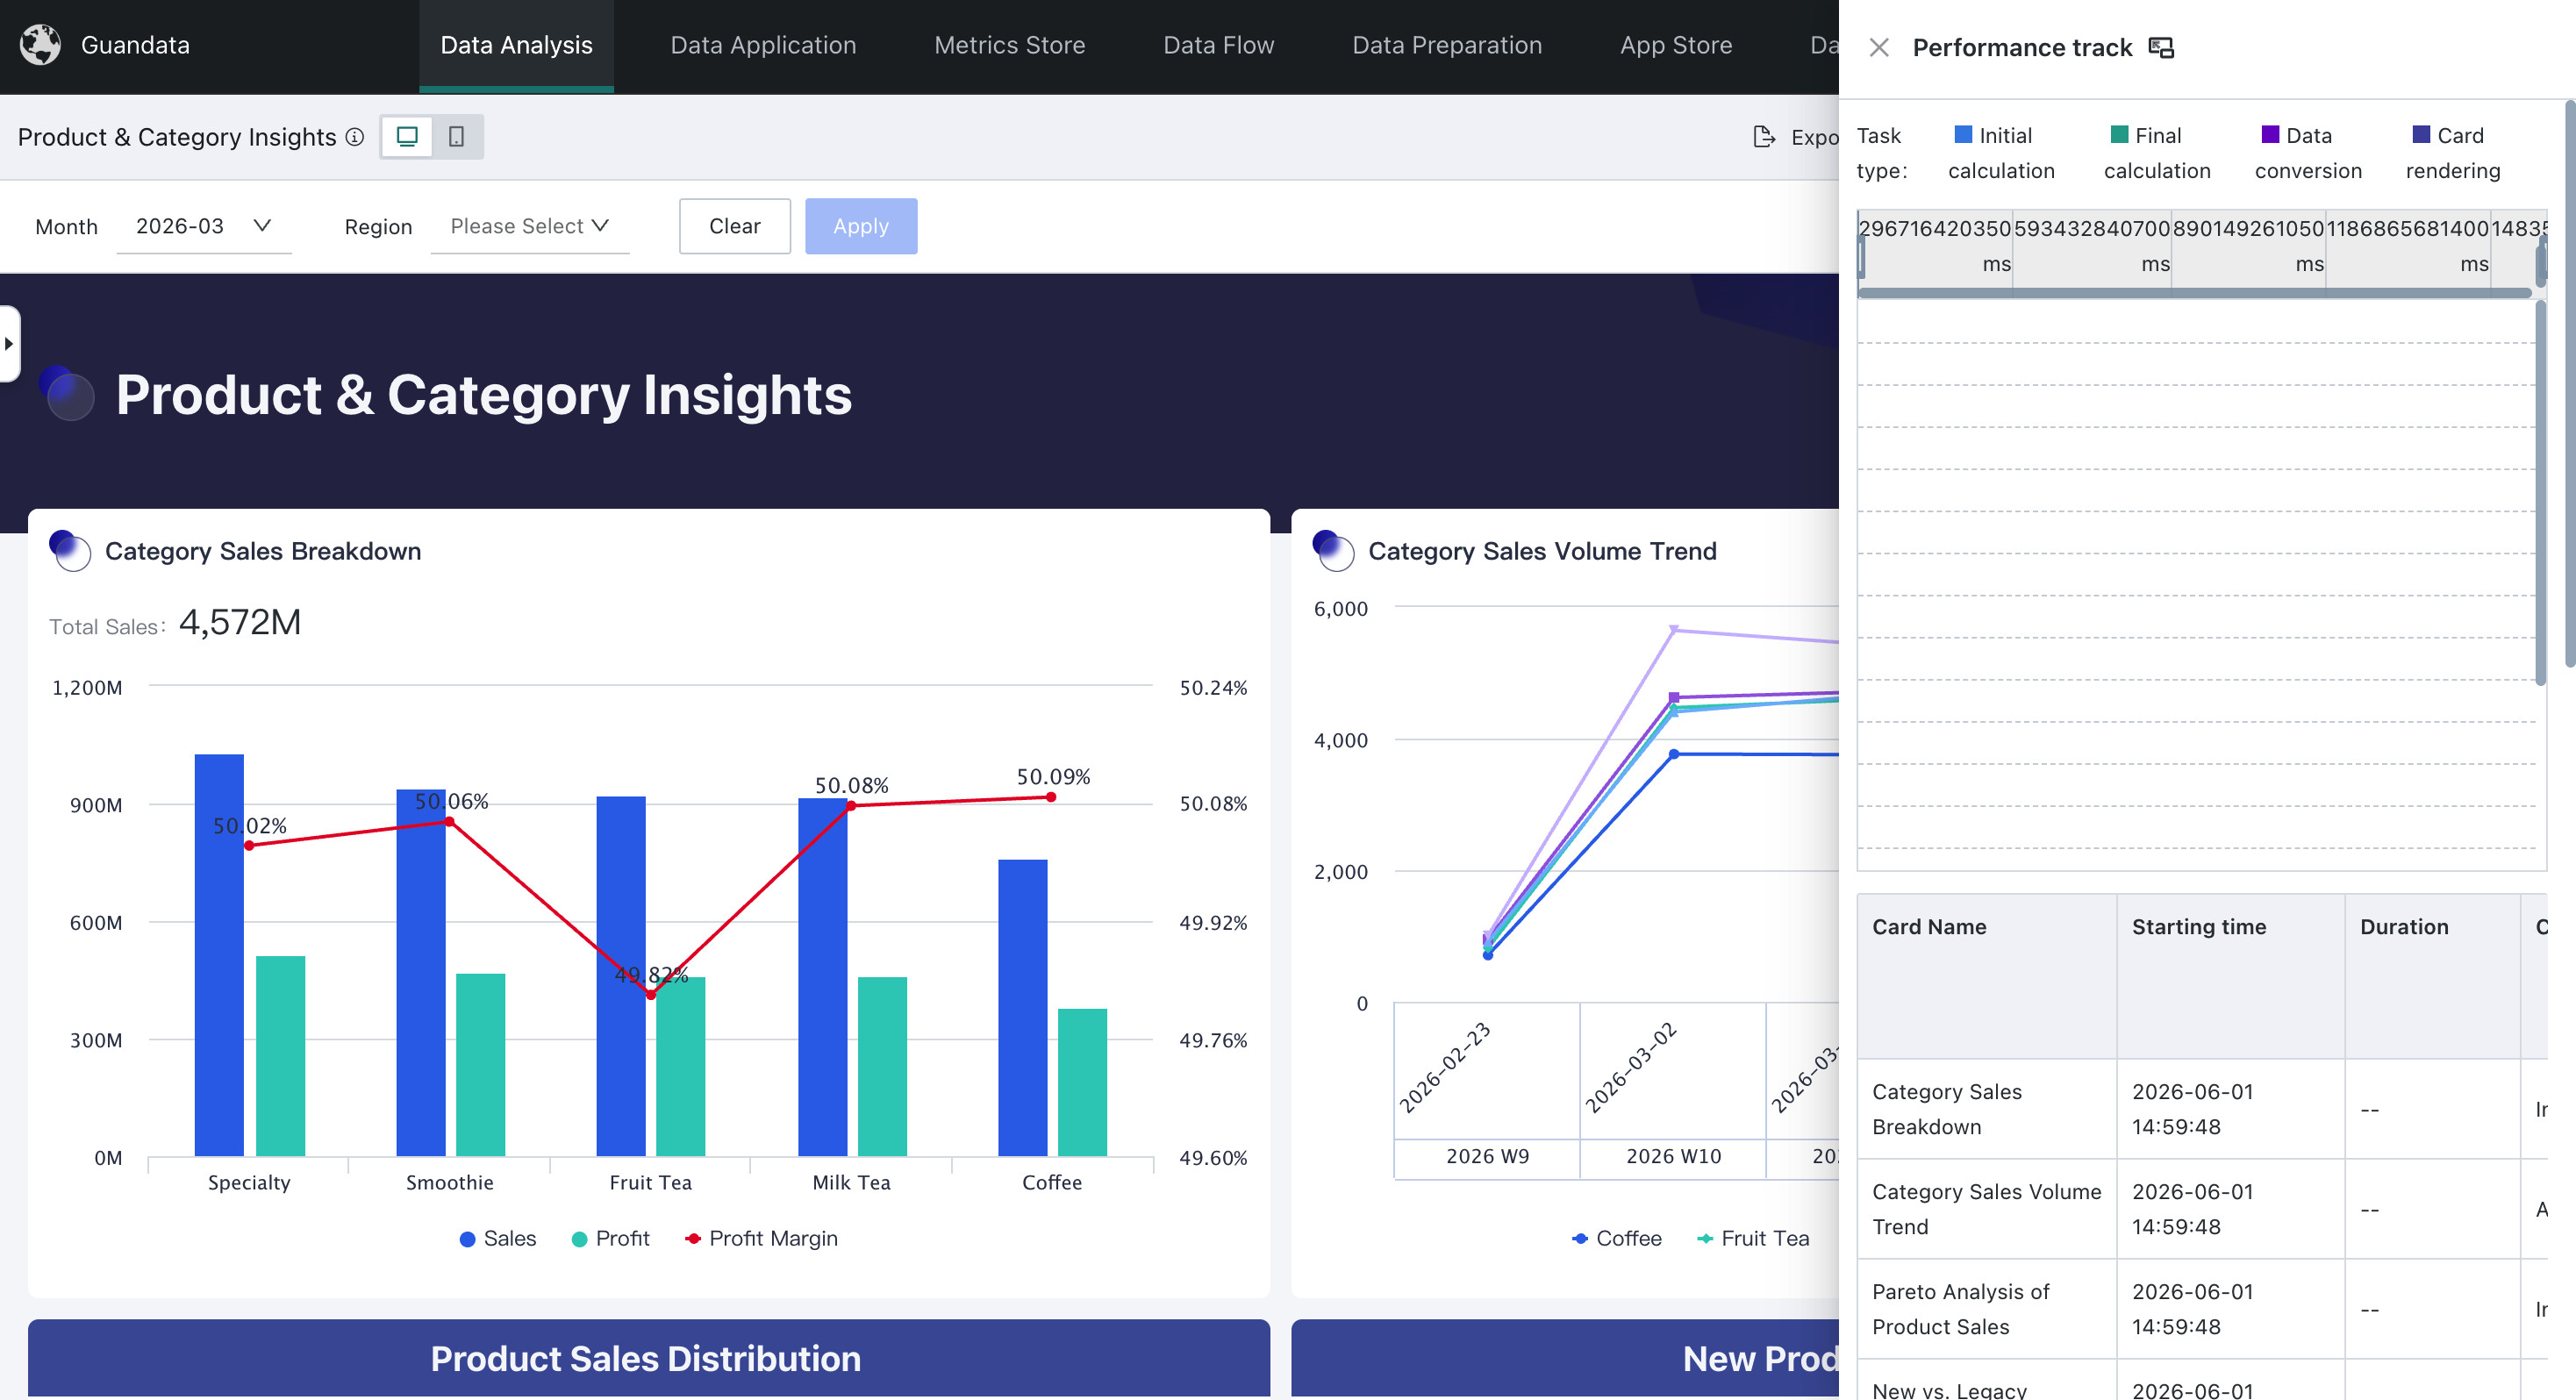
Click "Performance Tracking", and the right side will display the task duration of all cards during the current page loading process (here only cards currently loaded on the page are displayed, not including historical records). When the page scrolls down, it will continue to display the loading status of rendered cards. To facilitate viewing the report, click the widescreen button on the right side of "Performance Tracking" to set the display area to widescreen mode.
As shown in the figure above, the top is a Gantt chart display, and the bottom is a table display.
When the page refreshes, it will record the page switch status of the link performance. If not closed, after refreshing, the link performance of this loading will be appended below by default.
The performance data currently displayed mainly includes: Dashboard card traceId, key time data during Dashboard card loading process, etc.
The term explanations involved in the Performance Tracking list are as follows:
| Name | Explanation |
| First Calculation | The process of reading data from database/Spark according to the card's SQL statement |
| Second Calculation | The process of performing Advanced Calculations (such as Comparison, percentage, subtotals and totals) based on the results of the first calculation |
| Cache Hit | Not hit: Neither first calculation nor second calculation hit cache. First hit: Represents first calculation hit, including cards with only first calculation, and cards with second calculation but not hit, both displayed as first hit. Full hit: Represents both first calculation and second calculation hit cache. |
| serverWaiting | Time from receiving front-end request to starting data reading |
| pgWaiting | Time from starting data reading to waiting to write to PG database |
| driverRunning | Time to convert to physical engine |
| sparkRunning | Spark actual calculation time |
| cpuTime | CPU usage time |
| dbTime | Direct database query time |
| Data Conversion | Time to convert the results of first calculation/second calculation into the format required by the front end |
To further troubleshoot issues, users can take screenshots or report the traceId to operations personnel, who can then further view detailed operations logs to complete problem location and handling.