Last Value
Overview
Use Cases
Last Value usually refers to the specific value of an indicator at the end of a given point in time, such as month-end or year-end. It represents the cumulative result of all activities or changes up to that point.
For example, in financial statements, Last Values are often used to reflect a company’s financial position and operating results at the end of an accounting period. Comparing Last Values across periods helps analyze financial trends and business performance.
Feature Overview
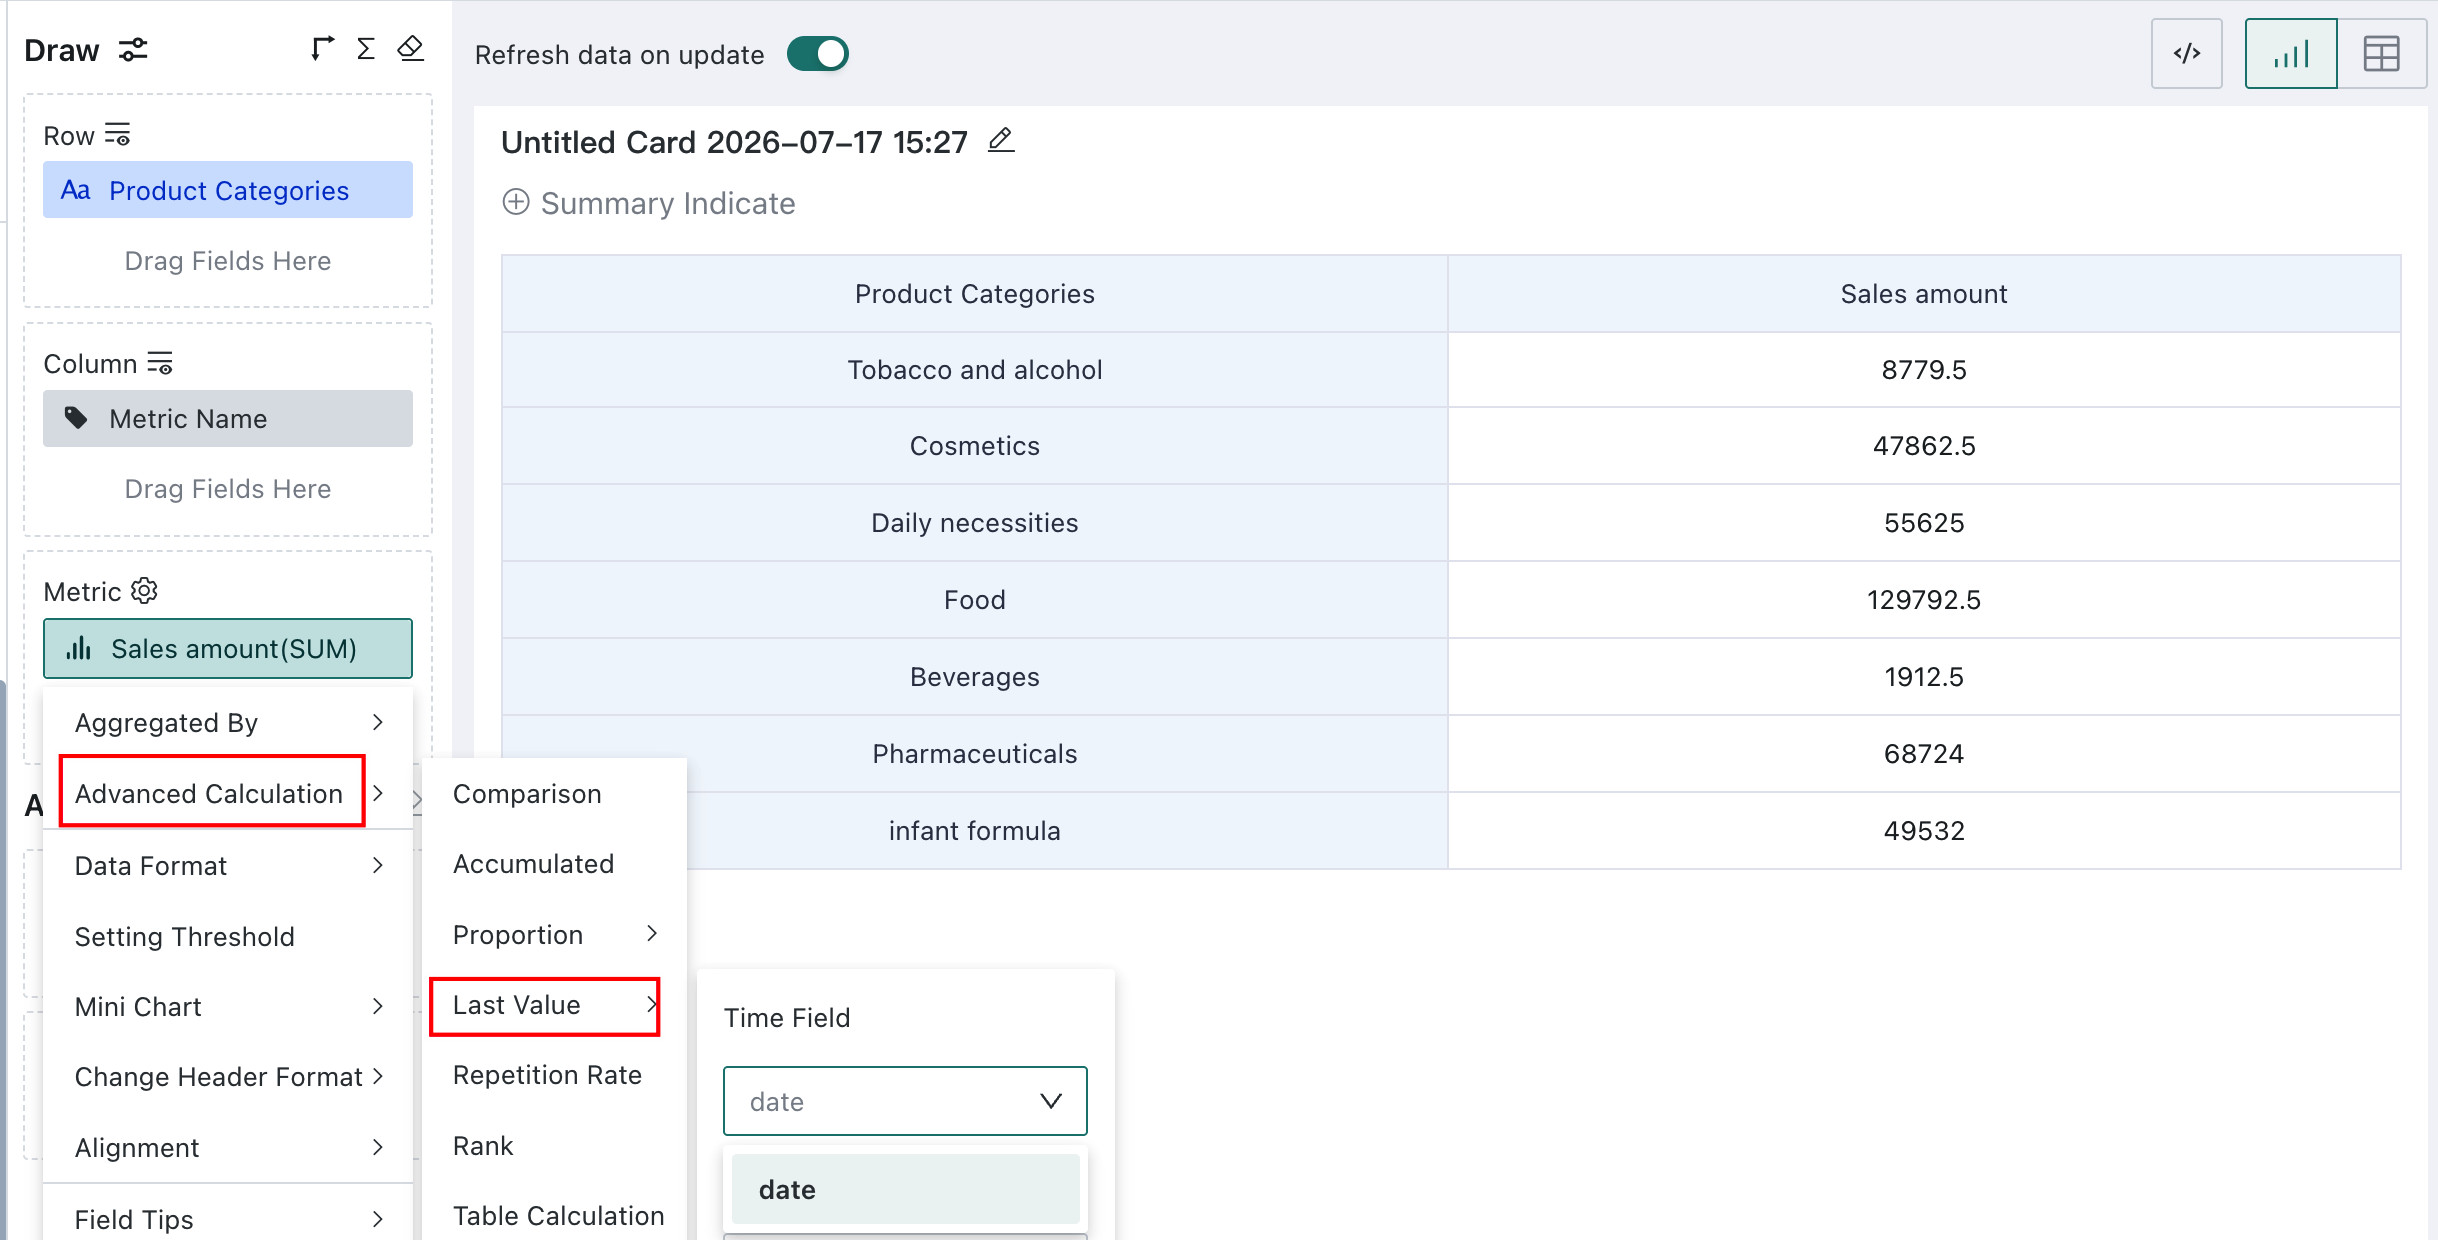
In the measures area, click the field for which you want to calculate an Last Value, then choose Advanced Calculation - Last Value from the drop-down menu to open the settings dialog.
Last Value is used to calculate the value at a specific point in time, such as the end of a year or quarter.
When the dataset contains a date-type field, the measure can use Advanced Calculation - Last Value to calculate year-end, quarter-end, and month-end values.
Quick Start
Calculate Last Value
With a Date-Type Field in Dimensions
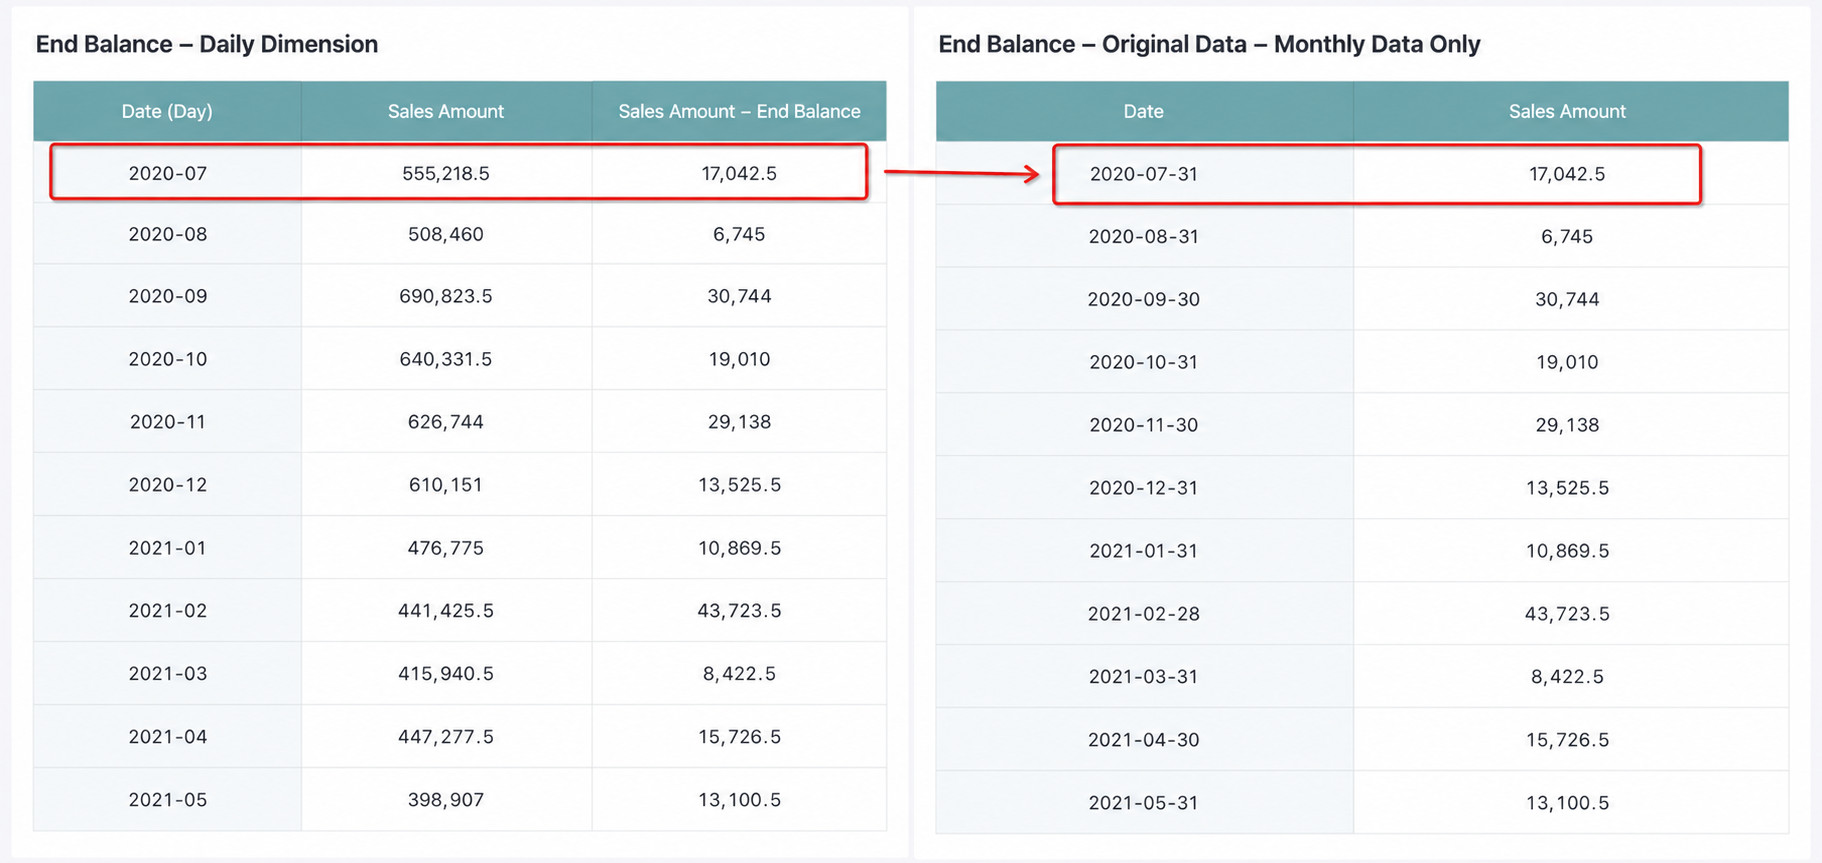
When the dimensions area contains a date-type field, the Last Value is calculated according to the date granularity used there.
For example, if the date hierarchy in dimensions is Year-Month, the calculation takes the result from the last day of each month. In the July 2020 example below, the Last Value for July 2020 is the value corresponding to July 31, 2020.
The logic for other granularities is as follows:
| Date Granularity | Last Value Logic |
| Year | Data from the last day of each year |
| Quarter | Data from the last day of each quarter |
| Month | Data from the last day of each month |
| Week | Data from the last day of each week |
| Day | Data from the current day |
| Hour/Minute/Second | Not supported; returns null |
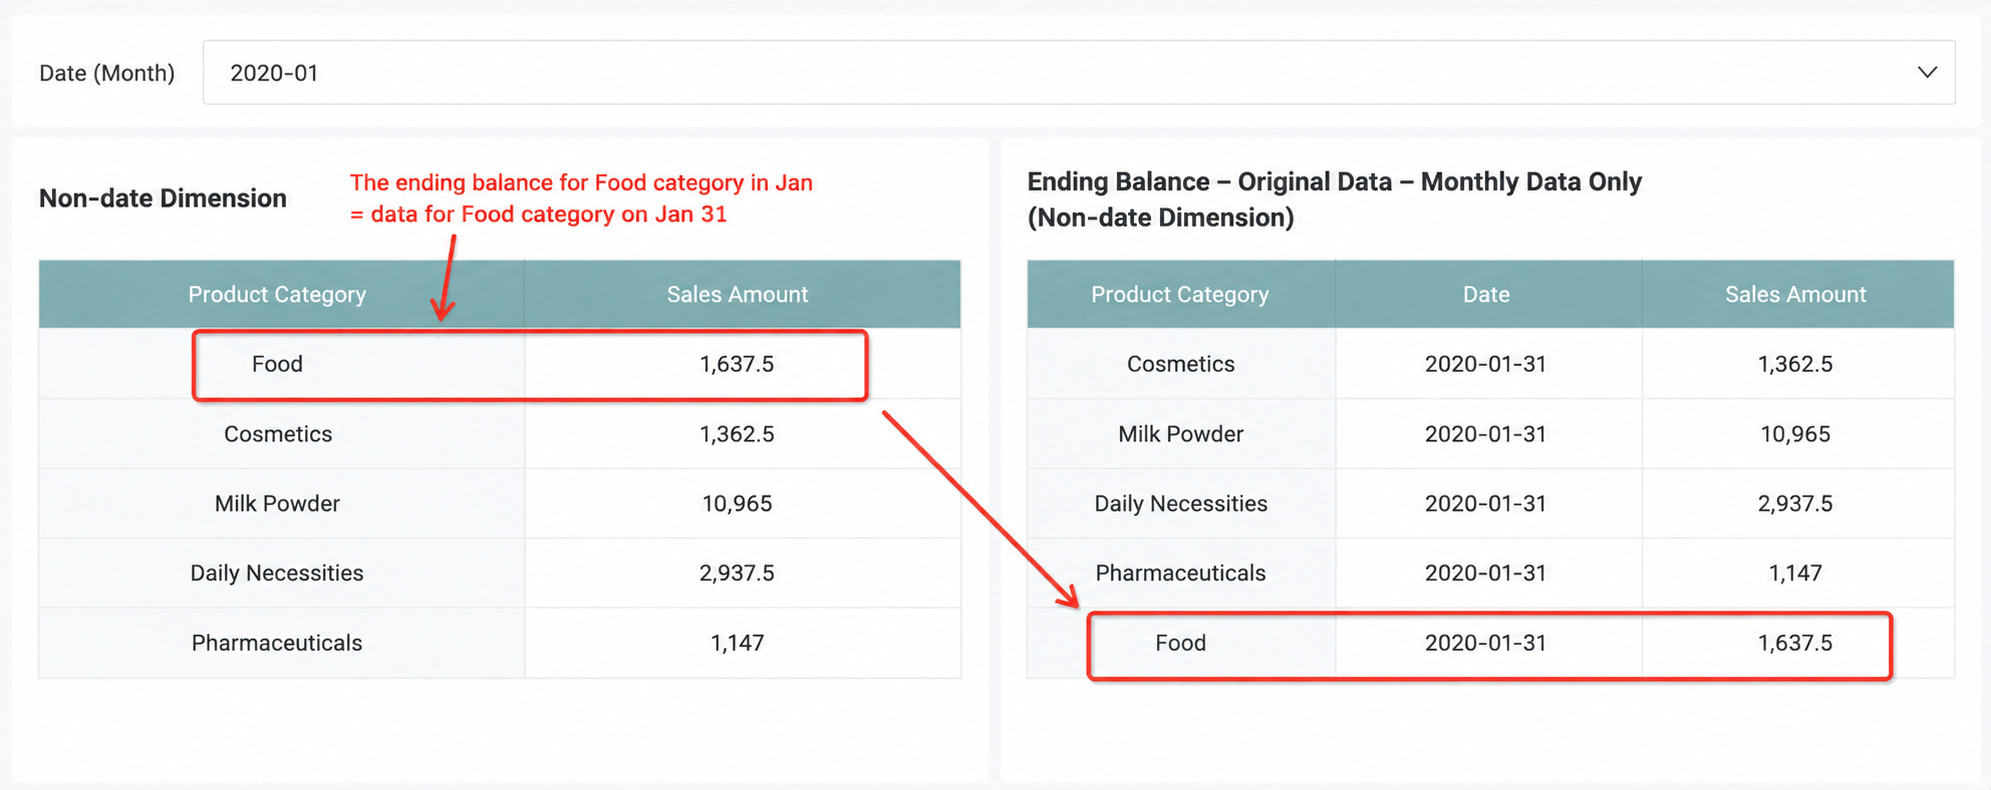
Without a Date-Type Field in Dimensions
When there is no date-type field in dimensions, the calculation is based on the granularity of the date field in the dataset itself. In this case, a time filter is required, such as a page filter or in-card filter, for results to appear.
For example, if the dataset date granularity is Year-Month and the filter selects a specific month, the calculation uses the value from the last day of that month as the result.
The logic for other granularities is the same as in the previous section where a date-type field exists in dimensions.
Calculate Previous Last Value
This can be achieved through YoY and PoP - Compare with Previous Last Value. For details, see YoY and PoP - Calculate Previous Last Value.
Scenarios with Multiple Date Fields or Granularities
- If dimensions contain multiple granularities for the same date field, they must be ordered from larger to smaller granularity, that is, Year => Quarter => Month => Week. Otherwise, the calculation fails.
- If dimensions contain multiple date fields, you can choose the appropriate date field as the calculation basis according to the scenario.
Limitations
- Detail tables do not support Last Value calculation.
- Last Value is supported only when the dataset contains a date field, including newly created calculated date fields.
- When multiple granularities of the same date field appear in dimensions, they must be ordered from larger to smaller granularity.
- Last Value and previous Last Value calculations are supported only for extracted datasets, not direct connections.
- To calculate the previous Last Value, the Analysis Engine 2.0 switch must be enabled. If the feature is unavailable in YoY and PoP, contact your administrator to enable it in Management Center - Advanced Settings.