Add Dashboard Interactions
Overview
Complex business scenarios often require multiple information sources before a conclusion can be reached. Interactive analysis between Cards helps meet that need by combining information from multiple Cards. Guandata BI supports a wide range of interactive features, including Linked Interaction, Drill Down, and Navigation.
In the previous steps, a category analysis Dashboard was already created. This article extends that case and shows how to analyze the monthly sales situation of each product category through two interaction methods: chart interaction and filter interaction.
Steps
- Create and configure a Date Filter on the Dashboard to view monthly sales data for all categories.
- Create Linked Interaction between
Category Sales ShareandCategory SKU Countso that the Dashboard can analyze the monthly performance of a single category.
Date Filter (Monthly Interaction)
Create a date filter so that Category Sales Share and Category SKU Count can be filtered by month.
- On the Dashboard page, click
Add Cardand chooseBasic Card > Filter.
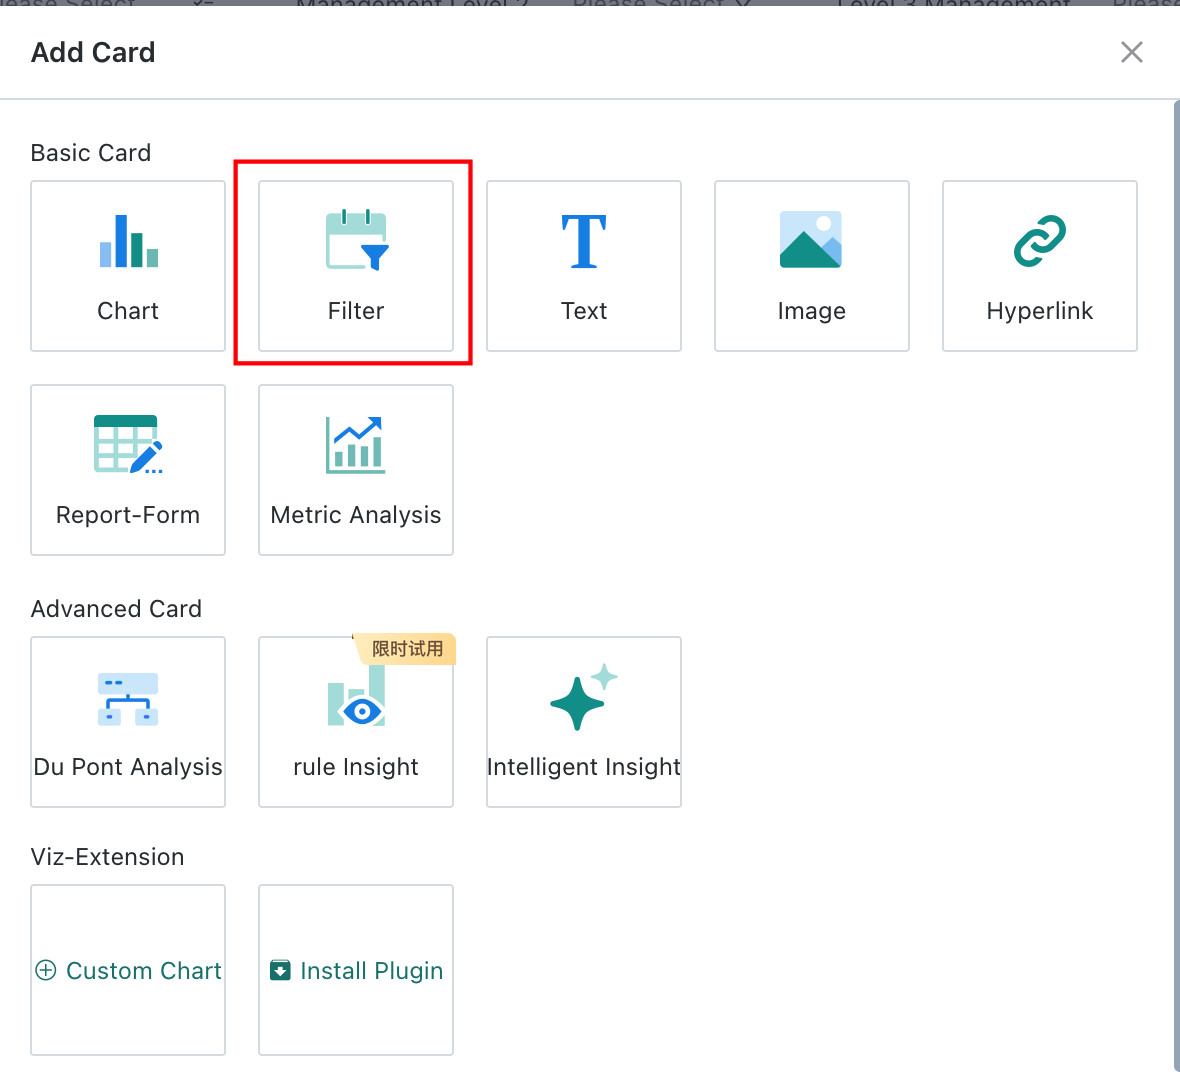
-
Select the filter type
Select.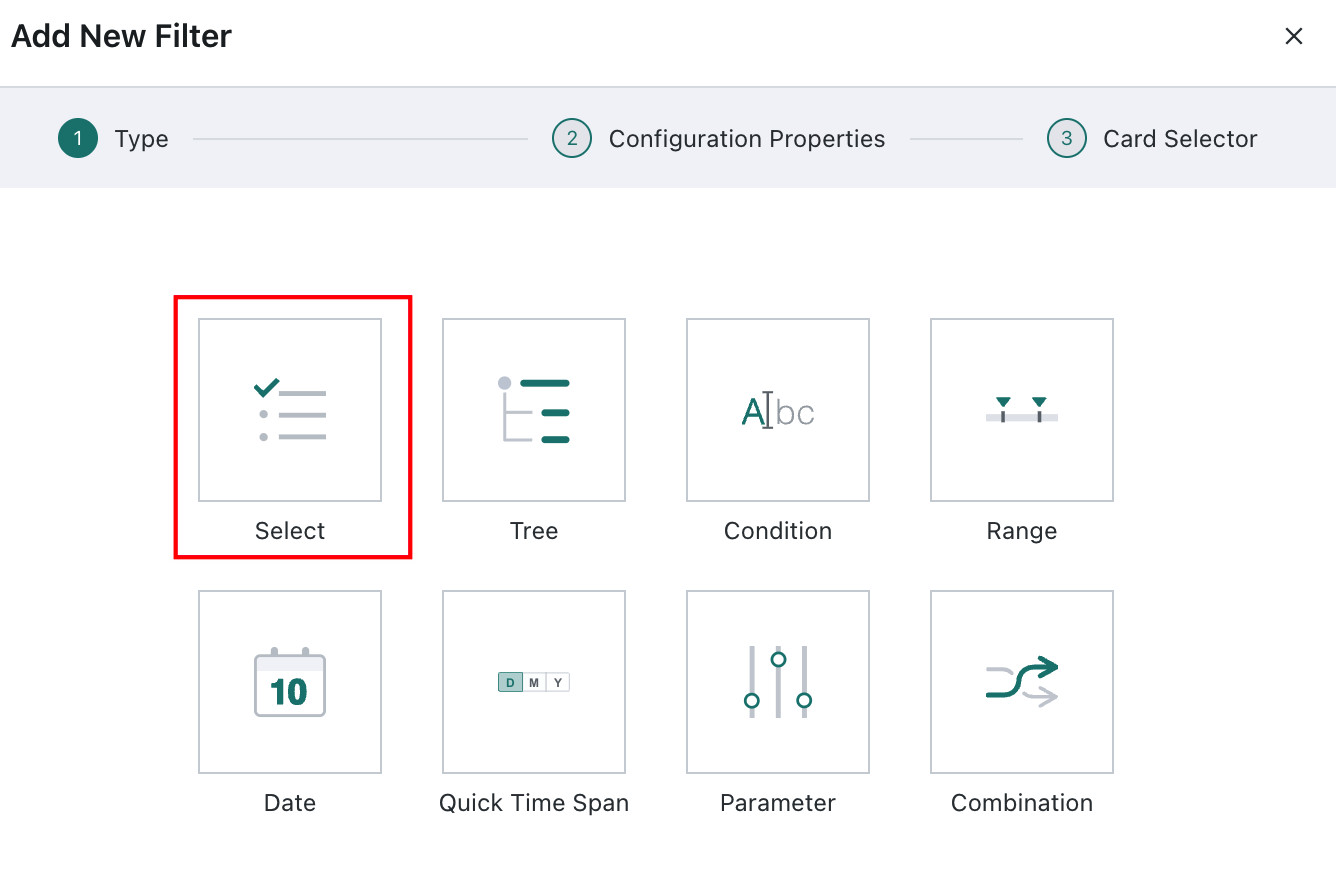
-
Configure the filter:
- Dataset:
DM - Filter name:
Date (Monthly) - Linked field:
Date > Month - Filter style: single-select dropdown with fixed values
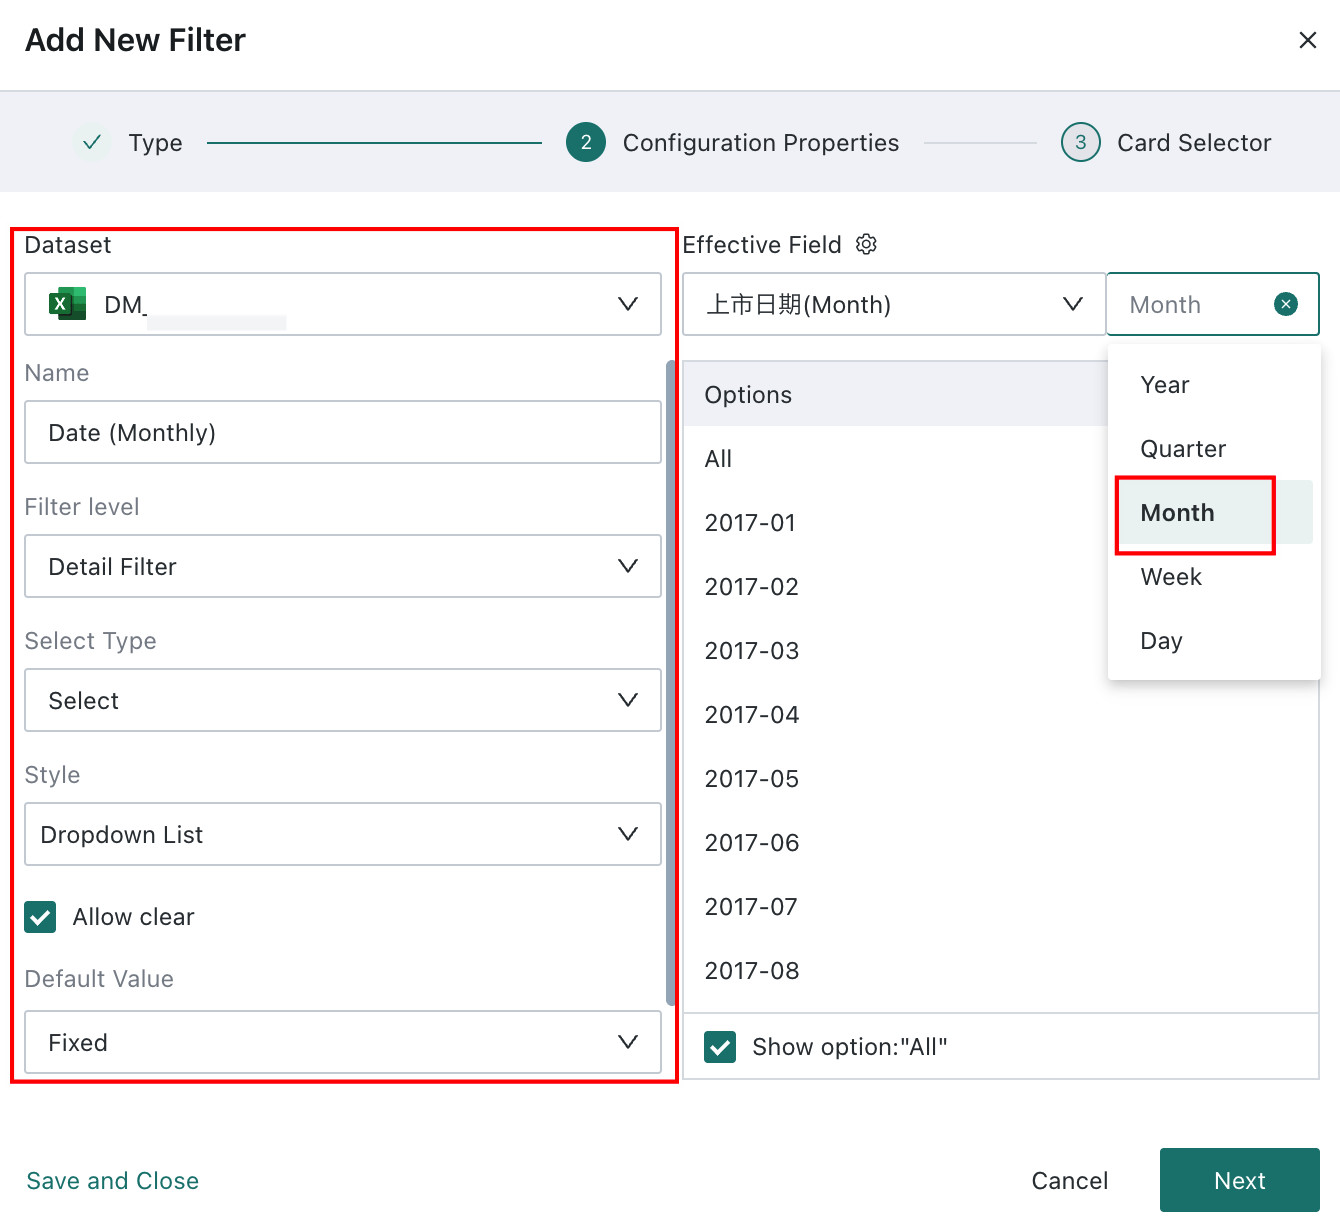
- Dataset:
-
In the interaction setup, select the target Cards that should respond to the filter and use
Dateas the linked field. -
After the filter Card is created, move it to the top of the page for easier access.
You can also enable Auto-Associate Cards and let the system automatically identify compatible target Cards.
Card Selector Example (Chart Interaction)
Use chart interaction to link one Card to another so the target Card responds to selections made on the source Card.
-
On the
Proportion of new and old membersCard, click the...menu and chooseCard Selector.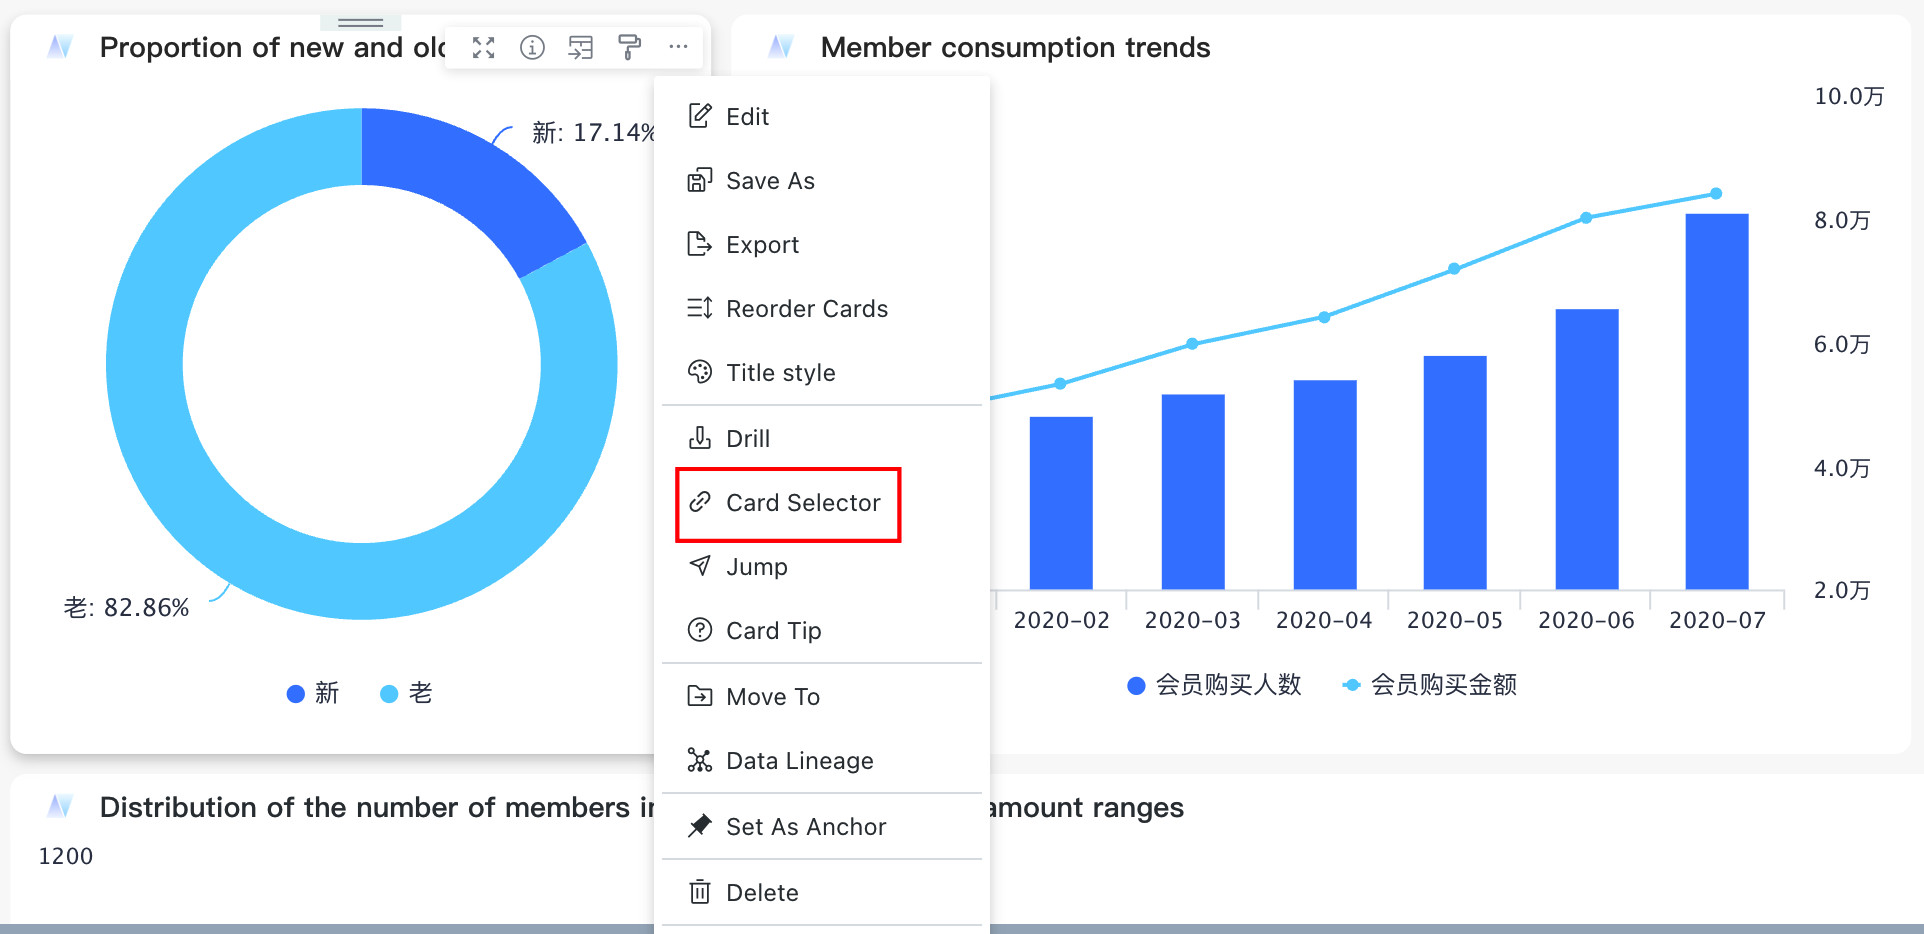
-
In the
New Card Selectordialog, chooseSKU Count by Categoryas the target Card andProduct Categoryas the linked field.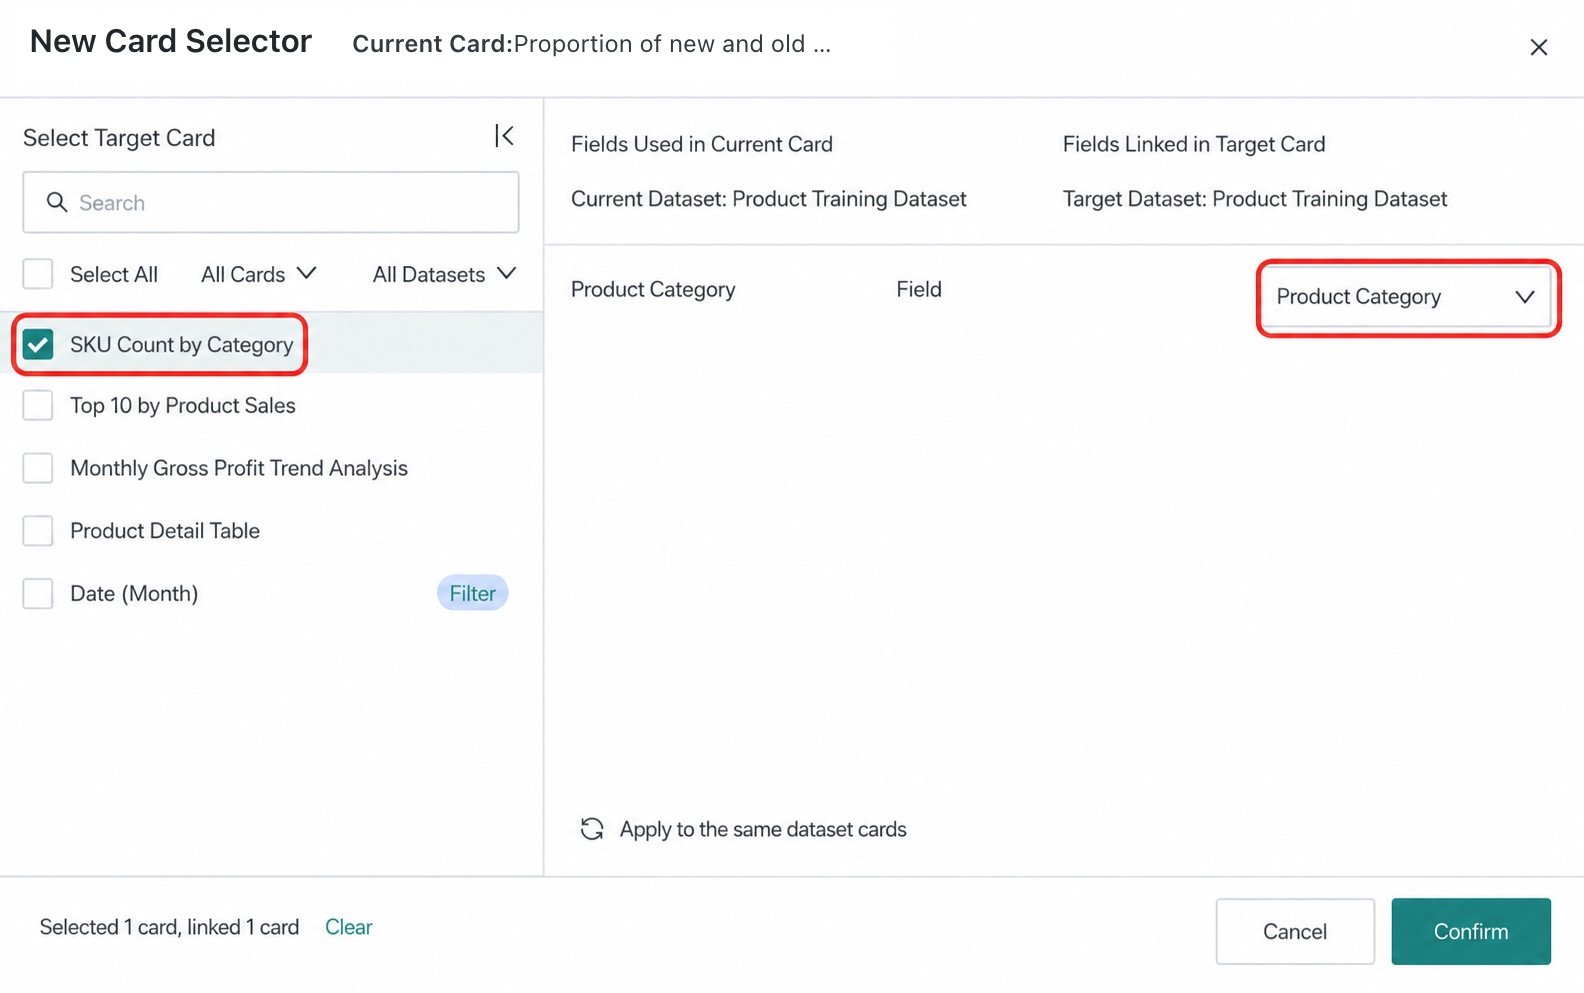
-
After configuration, selecting a value on the source chart automatically filters the target Card by the linked field.
More
You have now learned the core interaction methods used in this Dashboard case. Next, see Dashboard Layout and Beautification.