Chinese-style Report Pro FAQ
Why does sorting set in a view not take effect in the template?
Case 1: A single view has custom sorting, but the preview in the template does not take effect
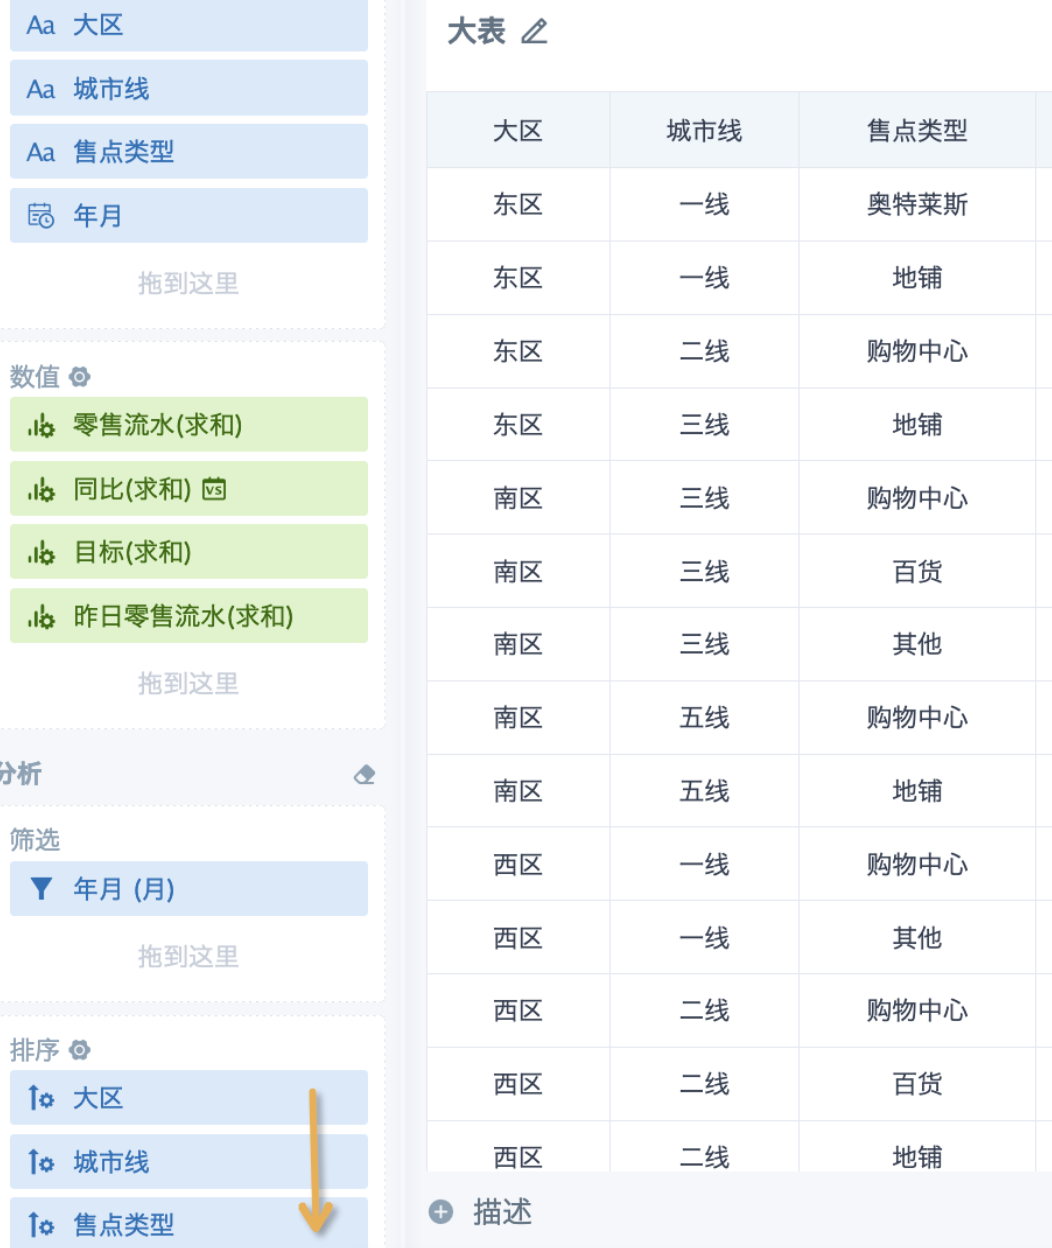
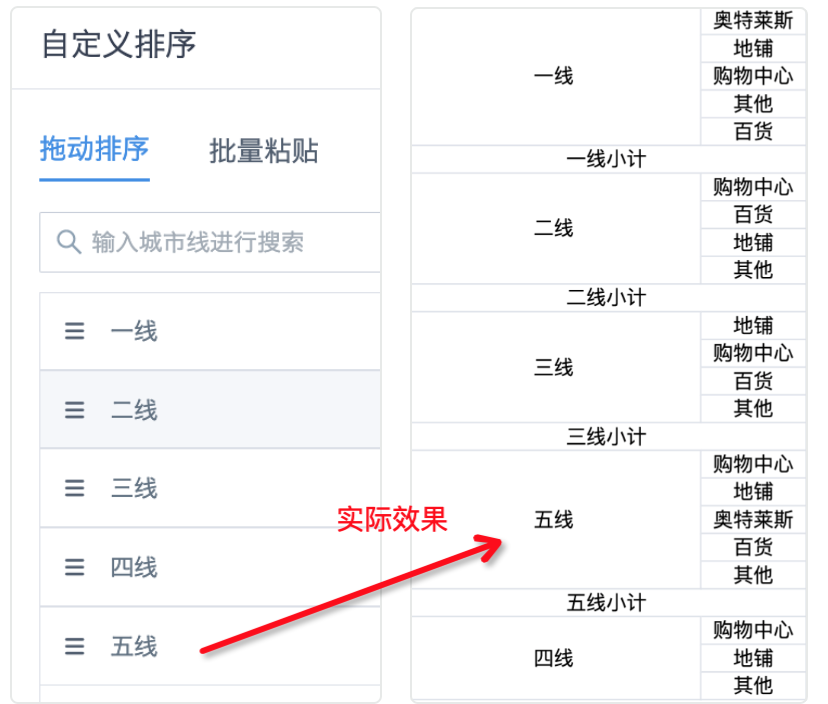
Cause: When sorting multiple dimensions in a view, sorting takes effect in the order in which fields are placed in the sorting area and is also affected by dimension grouping. The template uses the sorted data from the view. When multiple dimensions are used in a different order, the data is not sorted again. In the example above, the data is first sorted and grouped by region, and then sorted by city tier within each region. When only "City Tier" is viewed, "Fifth-tier" appears before "Fourth-tier".
Solution: In the view, move City Tier to the front in both the dimension area and the sorting area.
Case 2: Date sorting set in a view does not take effect after views are associated
Cause: The view that contains the date field is not the primary table, or left table, in the left join. After multiple views are left-joined, they become a virtual wide-table view. Sorting follows the left table, and sorting for fields in the right table does not take effect.
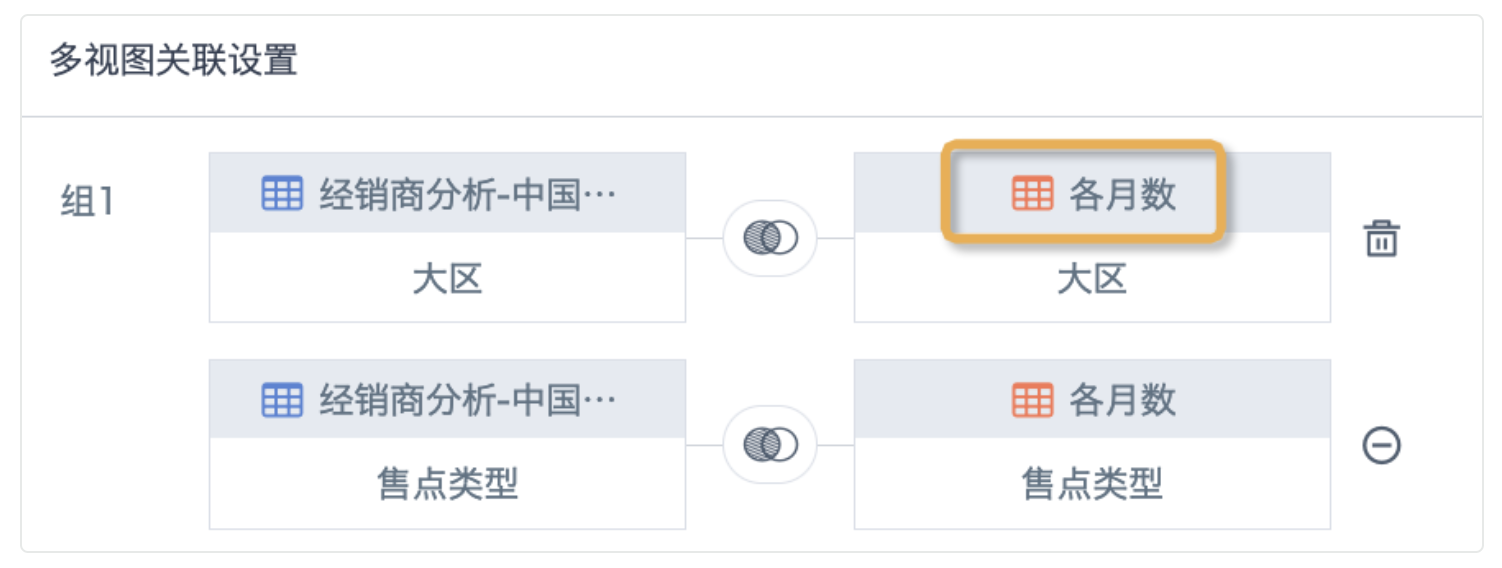
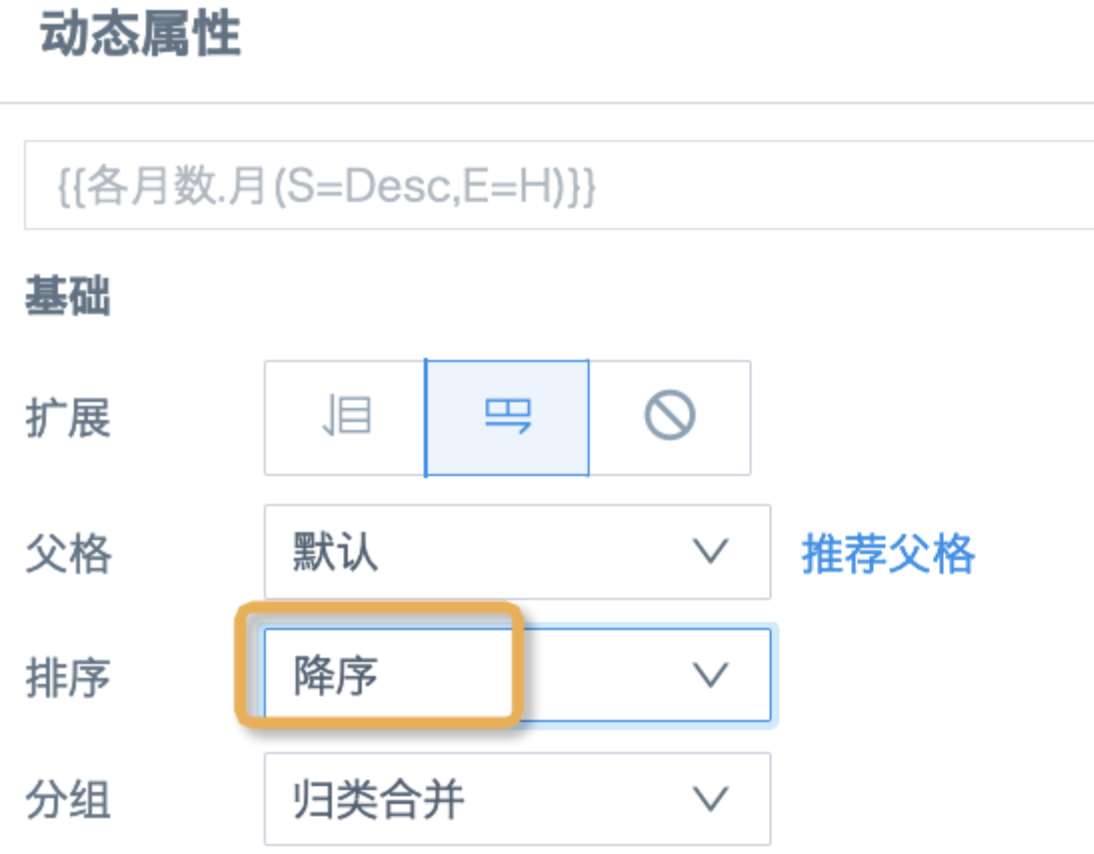
Solution: Set the sorting method for the date field in the dynamic properties of the template cell.
Case 3: Sorting on the primary key of the primary table does not take effect after multiple views are associated
Cause: During full joins or inner joins across multiple views, primary key values may differ across views. After association, the primary key values are likely to change, so the newly associated table does not retain sorting from any view.

Solution: If custom sorting is required, use a left join when possible and place the sorting field in the left-table view of the association. If ascending or descending sorting is required, choose an appropriate association method as needed, and then set the sorting method in the dynamic properties of the template cell. Starting from version 6.0, full join is removed. Only left join and inner join are supported.
Why are calculation results incorrect when using Excel functions or inter-cell calculations with dynamic expansion?
Cause: With dynamic expansion, cell positions referenced by Excel functions or inter-cell calculations shift accordingly, causing the calculation range to become misaligned.
Solution: Add $ symbols based on the scenario, using relative or absolute positions, to control offset behavior.
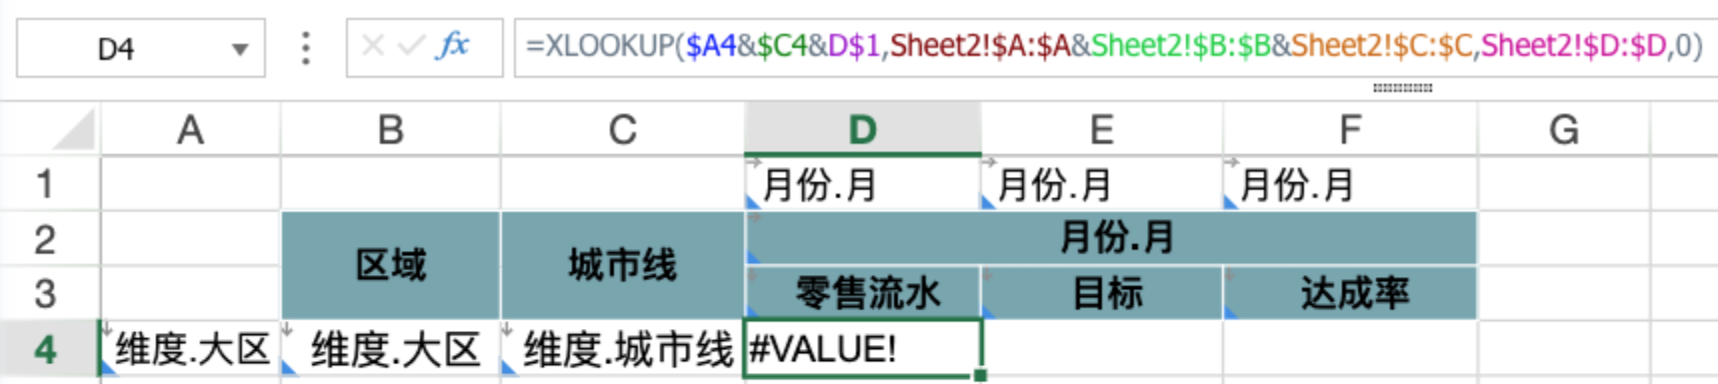
For example, the following figure uses XLOOKUP for multi-condition query. After expansion, the query conditions Region and Month merge cells, and the cell offset causes calculation errors. Insert rows or columns so these two fields do not merge cells. Then, Region is located in A4. During vertical expansion, the column stays unchanged while the row number changes, so write $A4 in the formula. Month is located in D1. During horizontal expansion, the column changes while the row stays unchanged, so write D$1. The query table range in Sheet2 also shifts and must use $ to fix the data range. For details, see correct use of Excel Lookup functions.
Why is displayed data incomplete when no page filter is applied, but normal after a filter condition is added?
Cause: A card supports displaying only the first 20,000 rows. If data in the view exceeds 20,000 rows, or data expands beyond 20,000 rows after multiple views are associated, the displayed data becomes incomplete.
Solution: Merge data with the same dimensions into one view before association when possible, or process the data in ETL in advance to ensure the aggregated data stays within 20,000 rows.
Preview error 14000
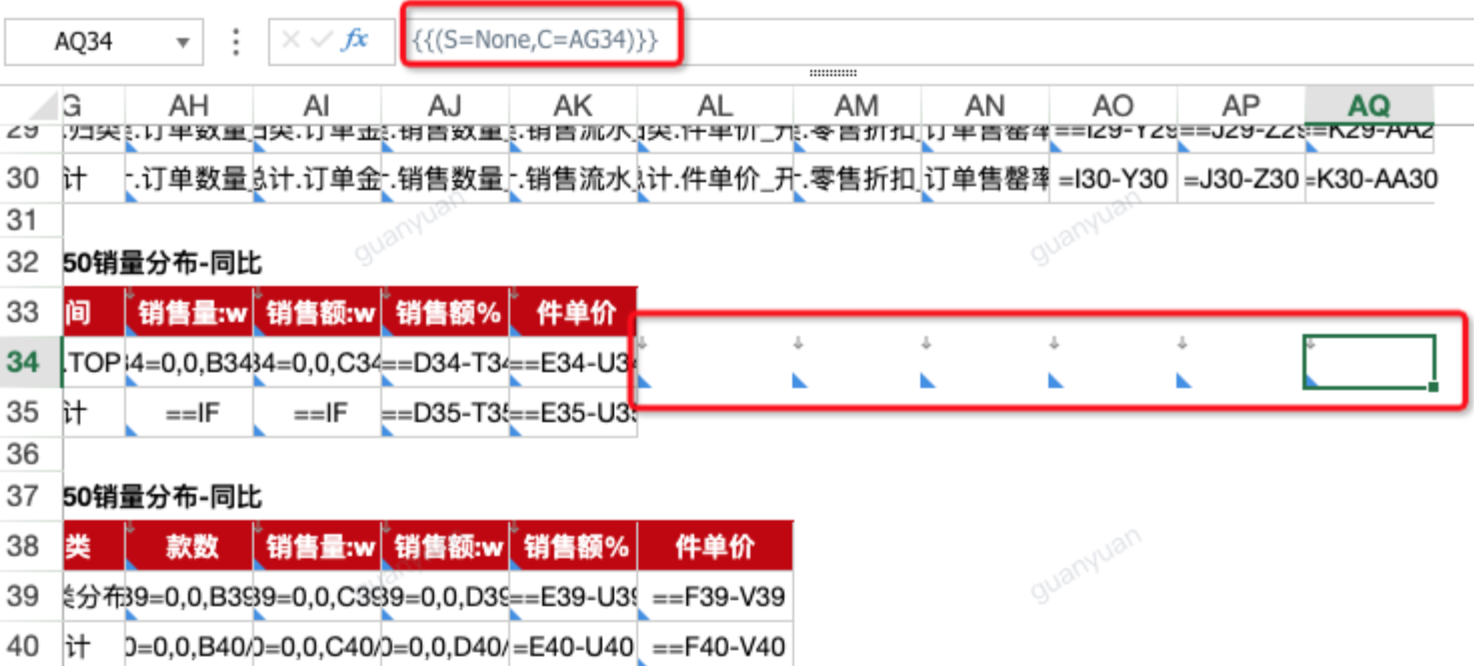
Cause 1: In version 5.9, after an empty cell is converted to a template cell, {{}} contains no property and cannot be recognized. Version 6.0 optimizes this by filling {{}} with the default property S=None.
Solution: After converting an empty cell to a template cell in version 5.9, manually select at least one property.
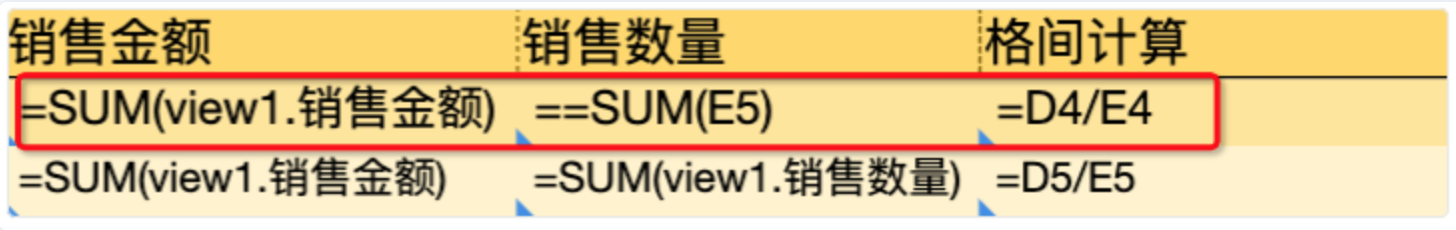
Cause 2: == followed by an Excel function or expression starts calculation only after all data is expanded. Compared with =, which calculates during expansion, == is delayed. In other words, = is calculated first, and then == is calculated. If a cell referenced by = uses == as its calculation method, it cannot be calculated and preview reports an error.
Example: In the first row of inter-cell calculation in the following figure, the numerator uses = and the denominator uses ==. Using =D4/E4 causes an error. In the second row, all three cells use only one =, and =D5/E5 calculates normally.
Solution: First enter the Excel function or expression in the cell, and then manually convert it to a template cell, which automatically becomes == after conversion. Alternatively, manually modify the cells so all cells use the same number of equal signs.
Cause 3: Template cells in the same row have abnormal expansion direction or parent-child relationship settings, so they cannot expand normally.
Solution: Carefully check dynamic properties and ensure they do not conflict with each other.
After dynamic expansion, why do blank cell styles not expand together?
Cause: When the entire template uses the C property to set parent cells, each cell expands according to its parent cell. However, blank cells have no parent cell set and therefore do not expand together.
Solution: Convert blank cells to template cells and then set parent cells, or use the R property in the header to define the child cell range.
After a percentage field is exported and opened in Excel, why does the format fail and become a decimal?
Cause: The percentage field is a newly created field in the view. Although a numeric type is selected, the field is actually a text field. It is set as a percentage in the template, but after export, Excel still recognizes it as text.
Solution: In the view, select a field type that matches the function or expression.
If multiple reports are placed vertically in one template, why do some rows and columns become misaligned after expansion?
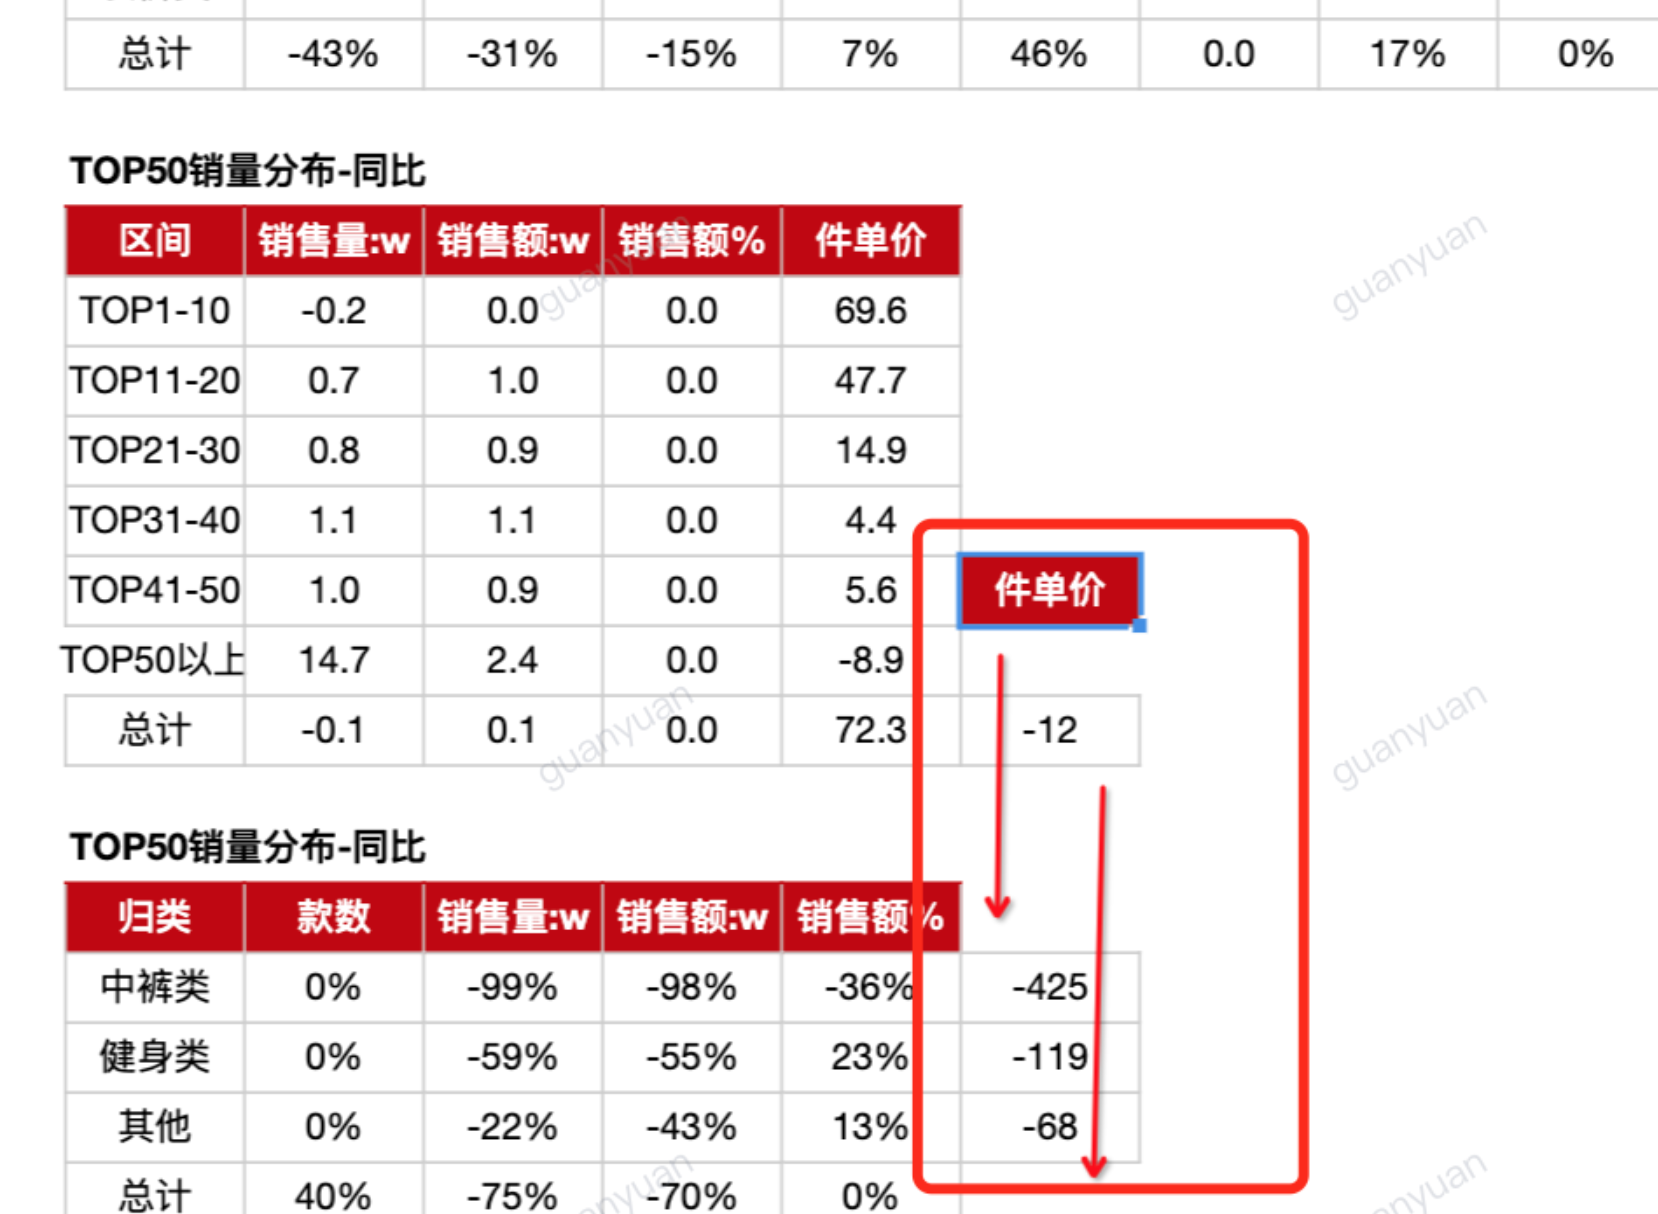
Cause: The default logic of complex report layout is that adding extra rows and columns actually inserts extra cells, not complete rows or columns. Therefore, when multiple reports are placed in one template and their upper and lower headers are uneven, rows and columns in different reports may become misaligned. In the screenshot, the upper table has one fewer column than the lower table. After expansion, the header and total sections in the last column that are not affected by parent cells move upward and become misaligned.
Solution: Convert the blank cells after the upper table with fewer columns into template cells, and set their parent cells so that the total number of expanded columns is consistent across the upper and lower reports. If the R property is used, modify the R range so that the blank cells in later columns of the same row, which do not need to be converted into template cells, are included in the R range.