Build a Sales Report with Multiple Data Sources
Overview
This article explains the Multi-View Join feature and how to configure it. A practical example is used to show how the feature works in real report-building scenarios.
The sample dataset used in this tutorial is: Product Training Demo Dataset 2023.xlsx
Use Case
When a report needs to display fields from multiple views, and those views come from different database tables that share data relationships through common fields, the Multi-View Join feature is required.
Feature Overview
Multi-View Join links multiple views through shared fields so they can be used together in report scenarios with multiple data sources. It supports two join types:
- Left Join: Uses the left table as the primary table, returns all rows from the left table, and matches rows from the right table where the join fields are equal.
- Inner Join: Returns only rows where the join fields match in both tables.
The default join type is Left Join.
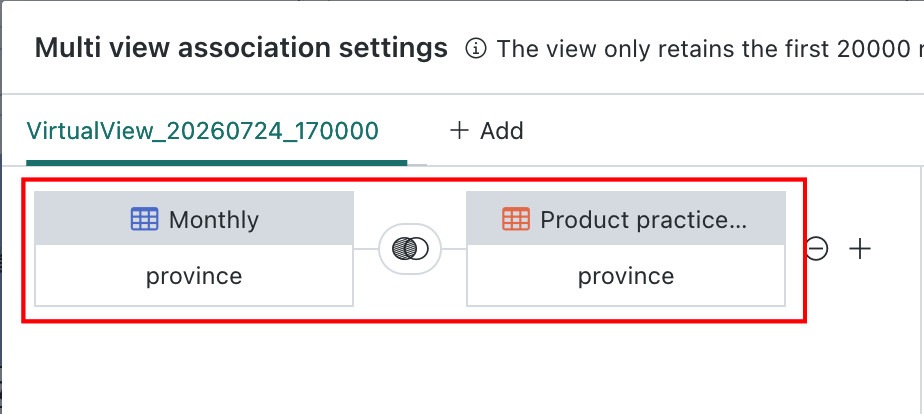
Join result:
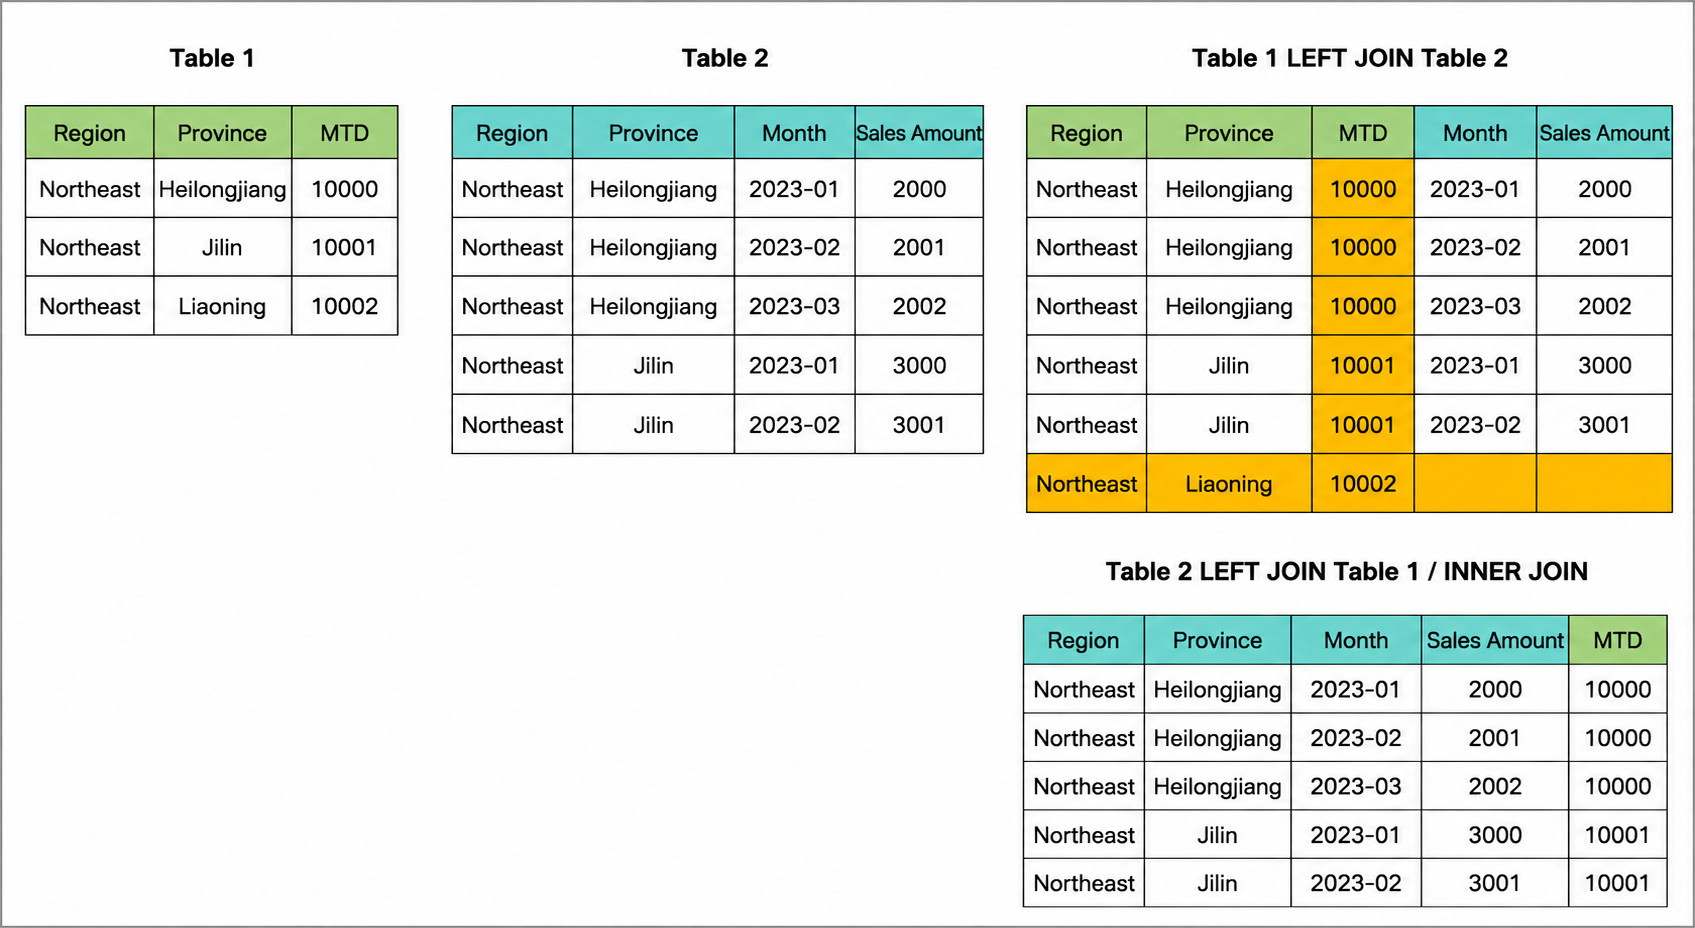
Join field: Province
The joined result is defined as a virtual view. A single virtual view supports joins across up to five tables.
- During the creation process, the same source view can be reused by different virtual views. This is supported in version 6.0 and later.
- After the join is created, the virtual view and the original source views are isolated from one another and can be used independently. This is also supported in version 6.0 and later.
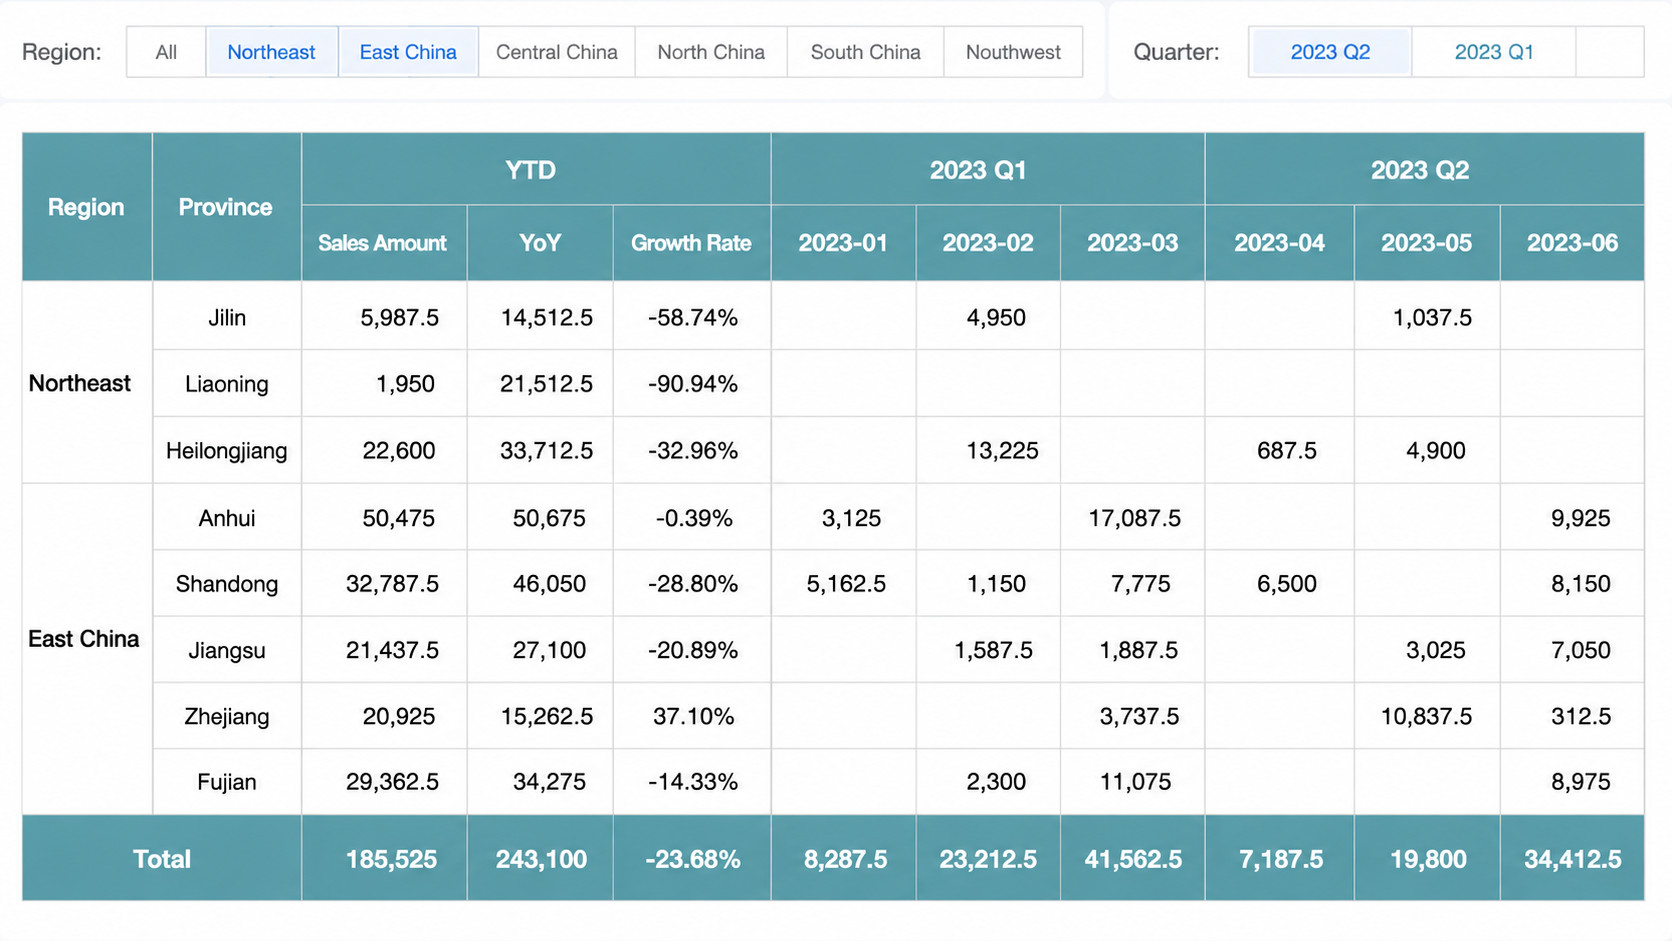
Example Result
The example uses two views:
- Cumulative: Calculates annual cumulative sales for
RegionandProvince - Monthly: Calculates monthly sales for each quarter by
RegionandProvince
The two views share Region and Province as common fields. In the left header area of the report, Region and Province are displayed, while the YTD metric is not affected by the quarter filter.
Implementation Idea
- The two views have different dimensions and significantly different row counts. Users often choose the more granular view with more rows as the primary join table. In practice, however, the report's left-side header uses the shared keys
RegionandProvince, so the better primary table is the view in which these two keys are more complete. - The Monthly view should respond to the quarter filter. Once the date range is narrowed, the set of
RegionandProvincevalues may change because some provinces may have no sales data in a given period. This makes the Monthly view a poor candidate for the primary join table. The Cumulative view contains full-year data and is not affected by the date filter, so it is the better primary table in this example. - With a left join between the two views, the left table has only two dimensions and fewer rows than the right table. After the join, the measure fields from the left table, namely the three
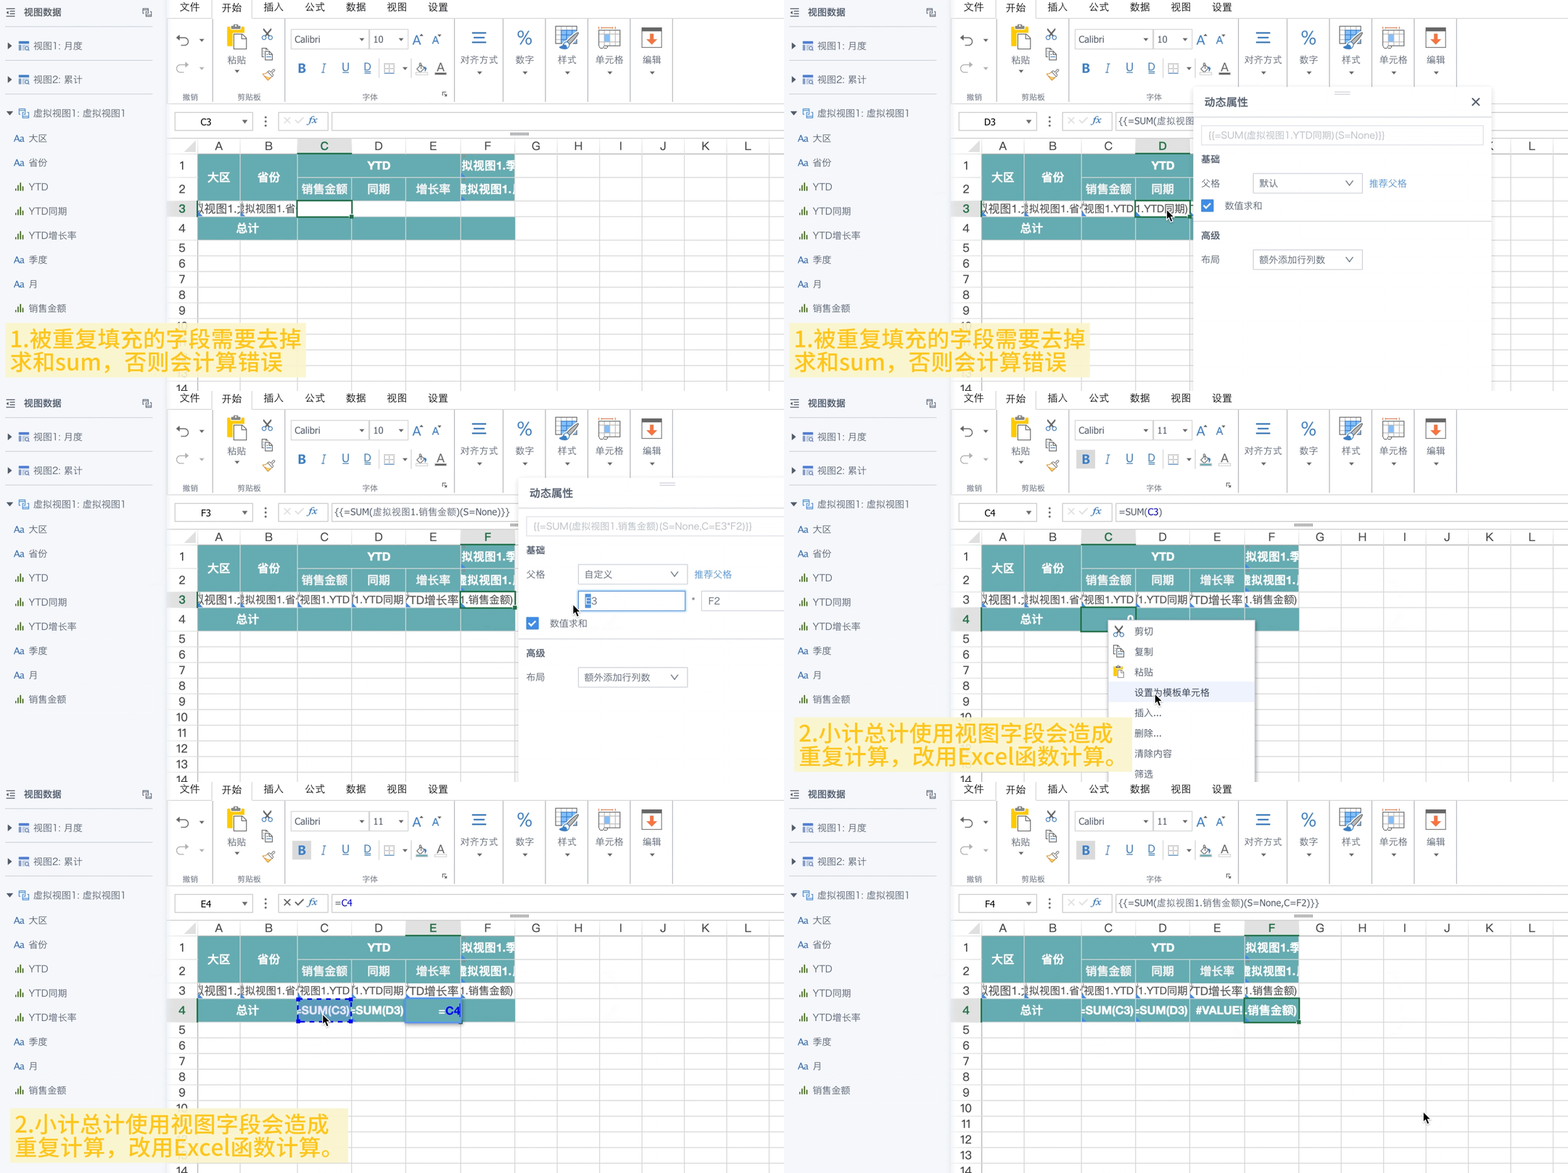
YTDfields, are repeatedly filled into the joined rows. If the default aggregation methodsumis used, the result becomes incorrect, so the aggregation must be removed.
The row count may change after a join is created. Estimate the row count both before and after the join to avoid exceeding the 20,000-row display limit and causing incomplete data.
Steps
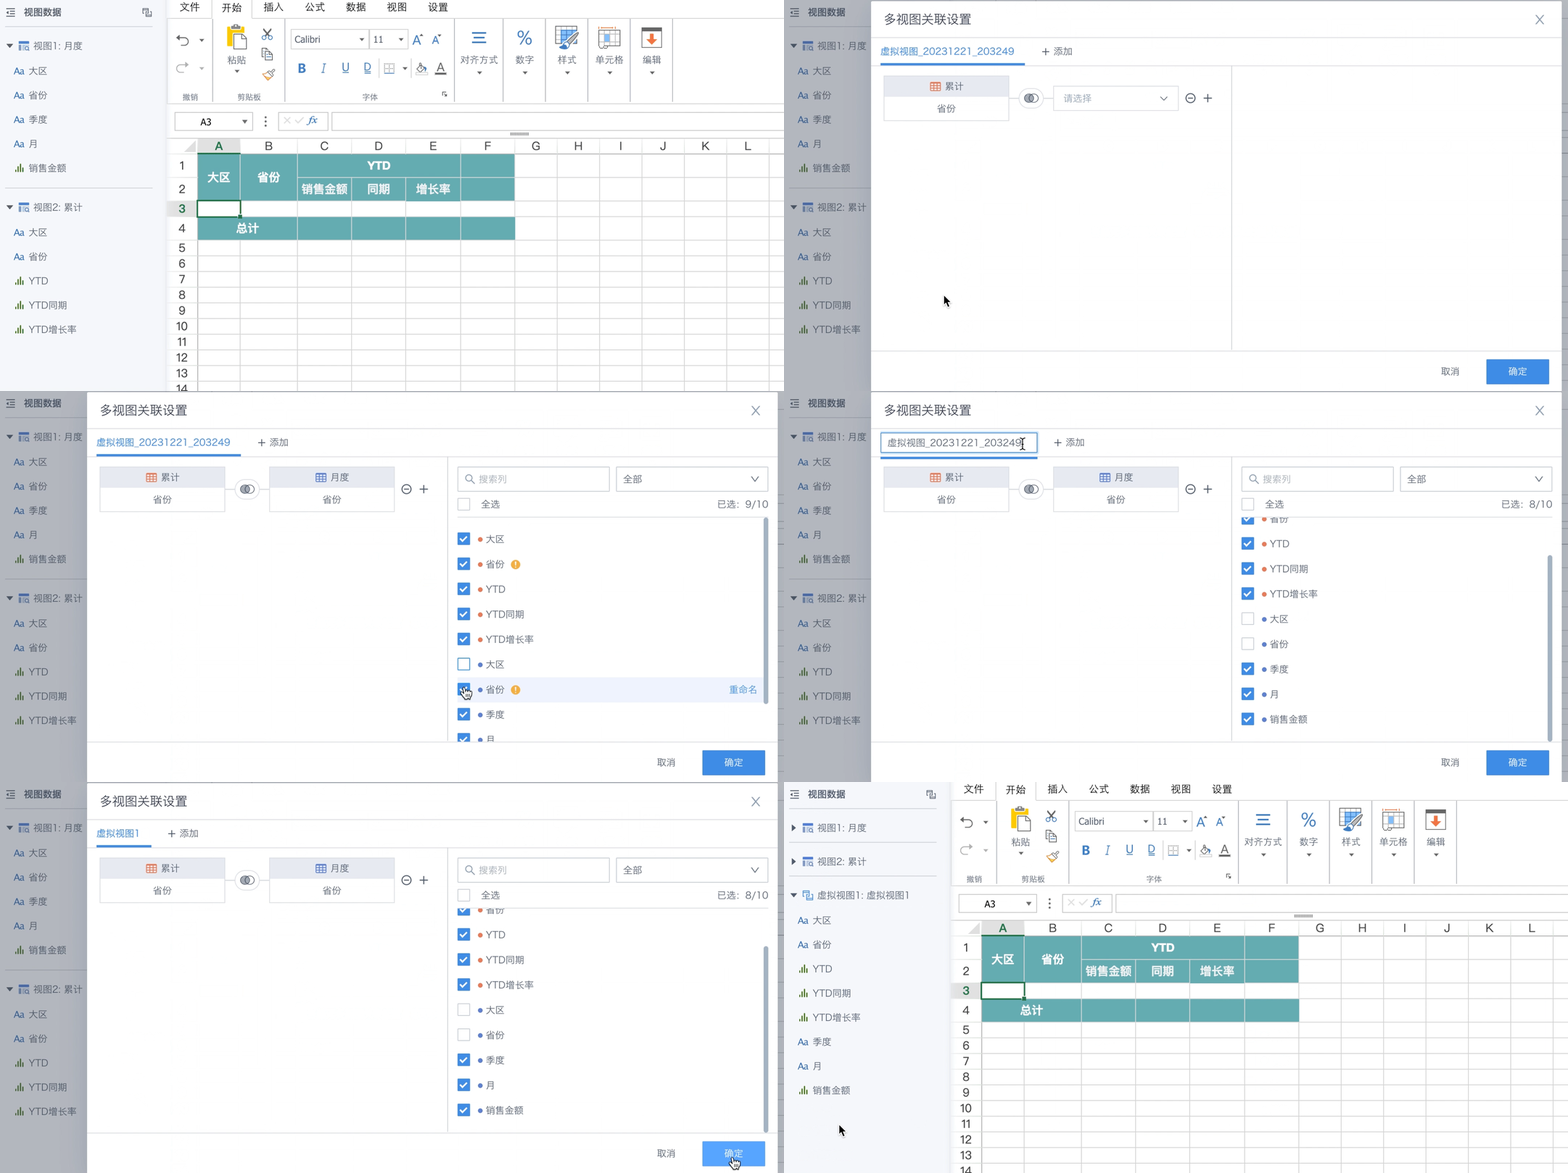
- Configure the multi-view join, select the required fields, and rename duplicate fields and the resulting virtual view as needed.
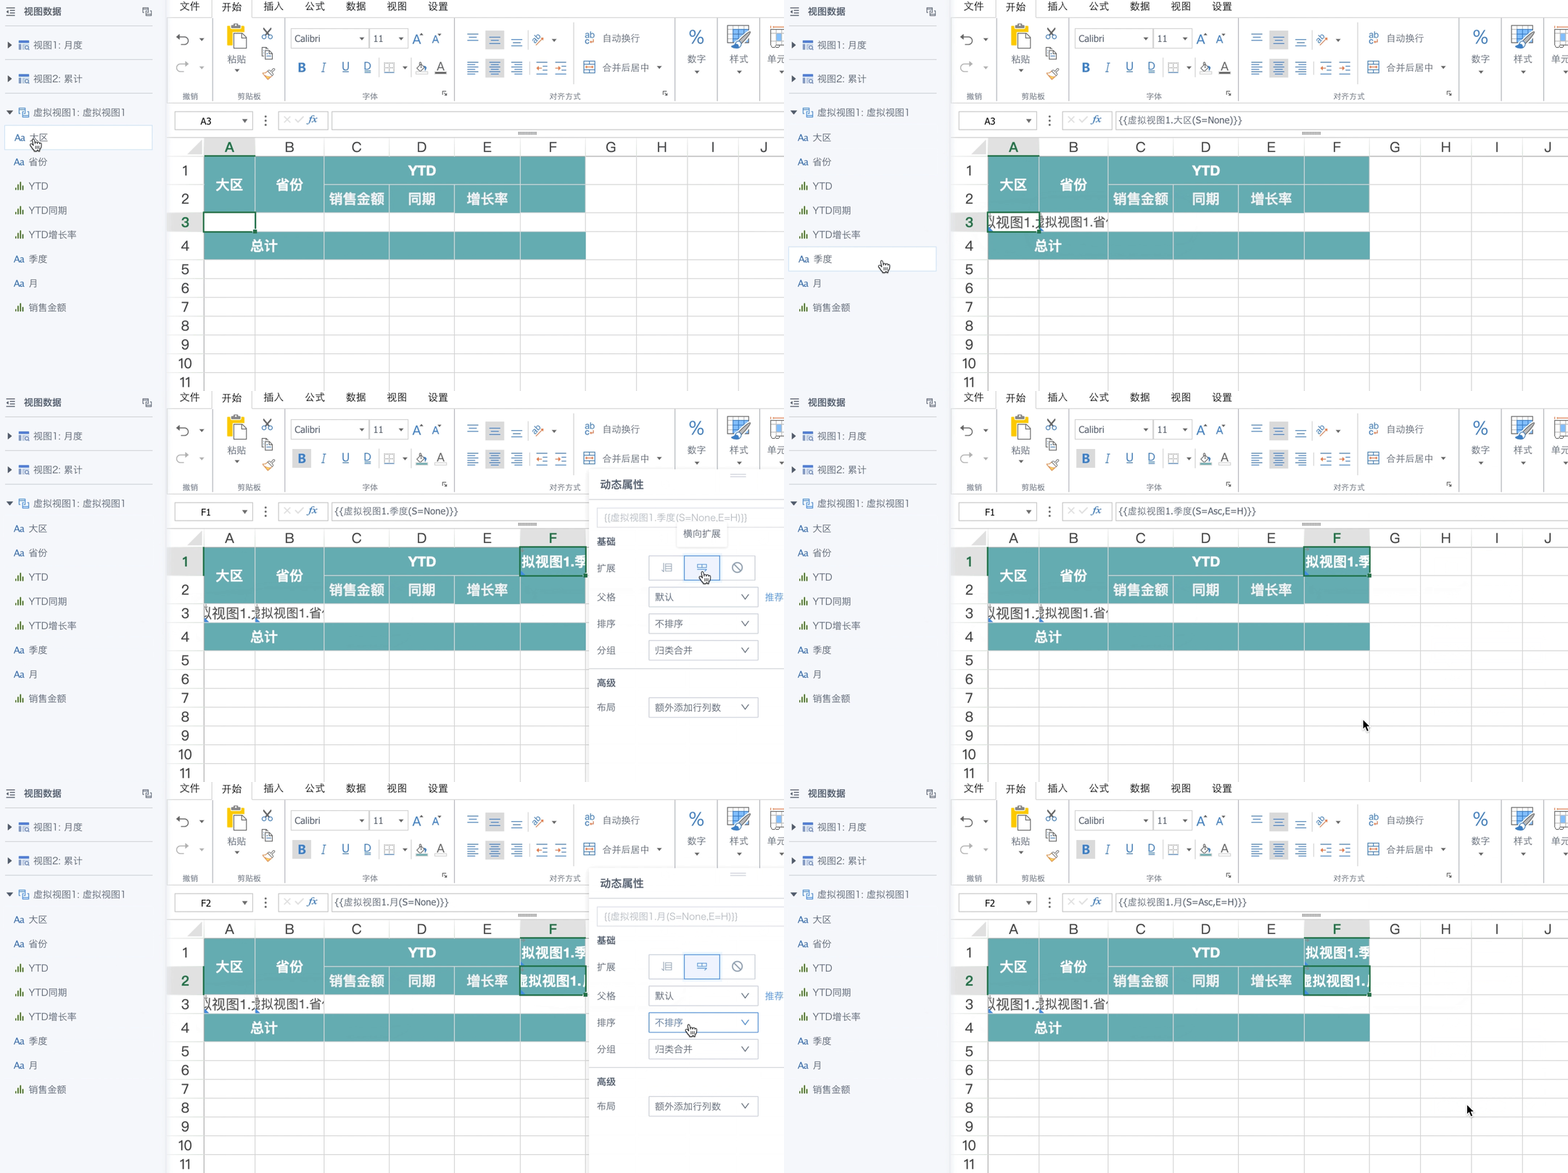
- Use the joined virtual view to build a dynamically expanding header.
- Fill in the measure fields and configure the parent cells.
- Use multiple views only when necessary. If possible, complete the joins earlier during the ETL stage in data preparation.
- In version 6.0 and later, duplicate field names in multi-view joins can be renamed before use. In versions earlier than 6.0, avoid duplicate non-key fields. If duplicates exist, data from the left table is returned.
- When joining views, make sure each view is already aggregated at the correct dimension and granularity. Try to choose a view with complete primary keys as the primary table, that is, the first view on the left, and select the correct join fields to avoid data expansion or missing data after the join.
Example of unreasonable data expansion:
- In the example above, the monthly sales view contains data for only one year. Suppose you want to join another view called Last Year's Monthly Summary to calculate year-over-year monthly sales.
- If the join is configured as shown below, the data expands unreasonably.
- After Cumulative is left-joined with Monthly, the primary key of the virtual view changes from one field,
Province, to two fields,ProvinceandMonth. The primary key of Last Year's Monthly Summary is alsoProvinceandMonth, but if onlyProvinceis used as the join field, a one-to-many relationship appears and the data expands incorrectly. - If one province has 12 rows of data in a year, this approach can produce up to
12 * 12 = 144rows for that province after the join.
Recommended join strategy:
Left join Monthly with Last Year's Monthly Summary.