Rule Insight
Overview
Guandata continues to build intelligent and automated data analysis capabilities. Version 6.3 released the Rule Insight feature 1.0. This feature supports the configuration of analysis decision trees, precipitating high-value, complex, and relatively static analysis ideas as core enterprise assets, automatically generating analysis reports, reducing repetitive and redundant work for data analysts and business analysts, and eliminating subjective analysis differences among data report producers.
This feature is a value-added module. Before activating the license, you can try it out and save 2 Rule Insight cards. If you need more, please contact the Guandata business or customer success manager responsible for your company.
Operation Instructions
Feature Entry
Dashboard > Add Card > Advanced Analysis > Rule Insight
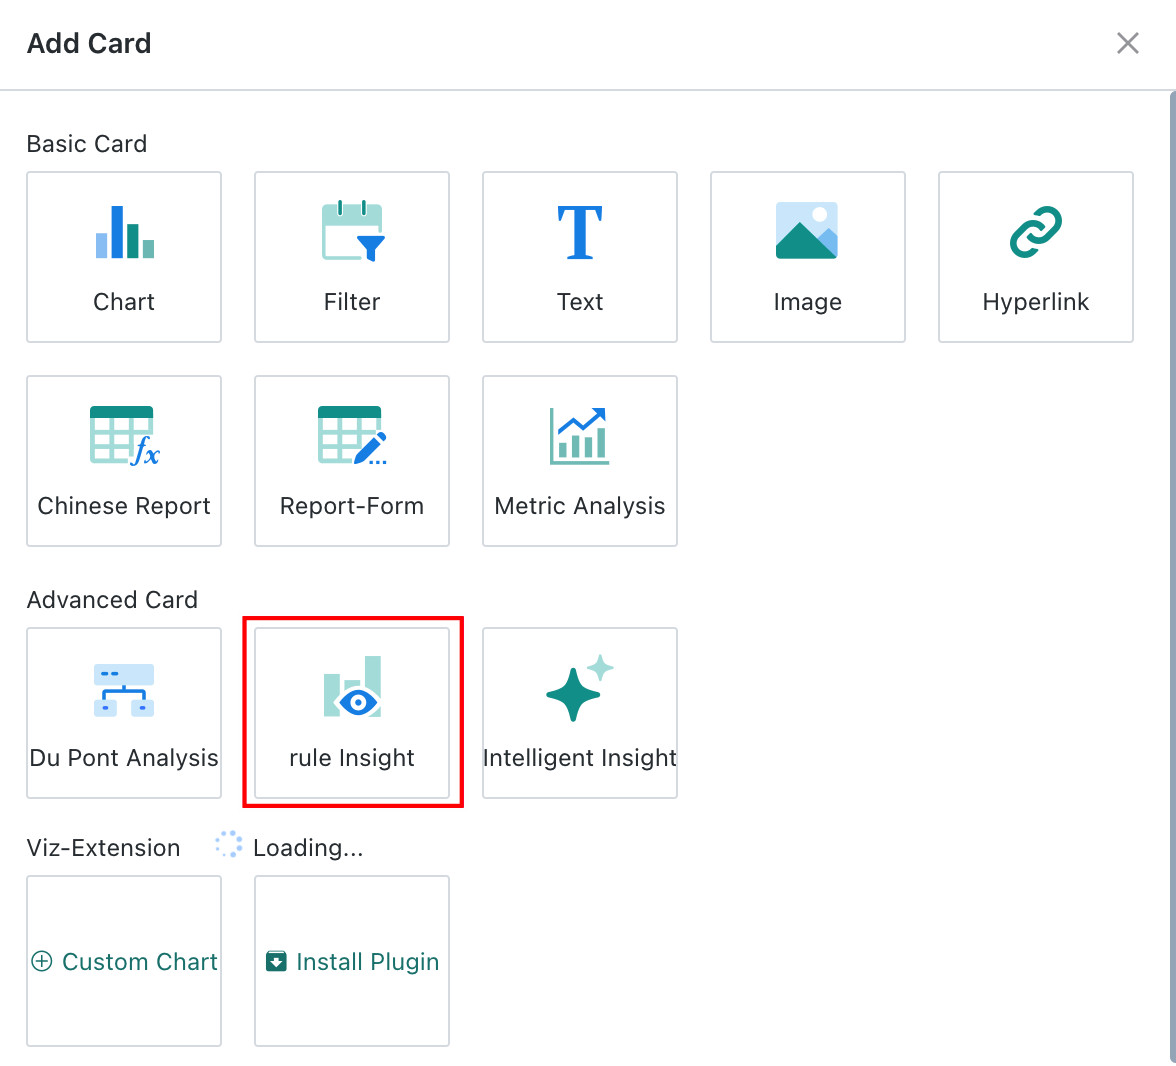
After clicking the 「Rule Insight」 button, you can create a new insight card, or understand the basic capabilities of Rule Insight based on the built-in templates.
Analysis Node Configuration
The hierarchical relationships of original analysis reports can be abstracted into multiple analysis nodes and configured on the canvas.
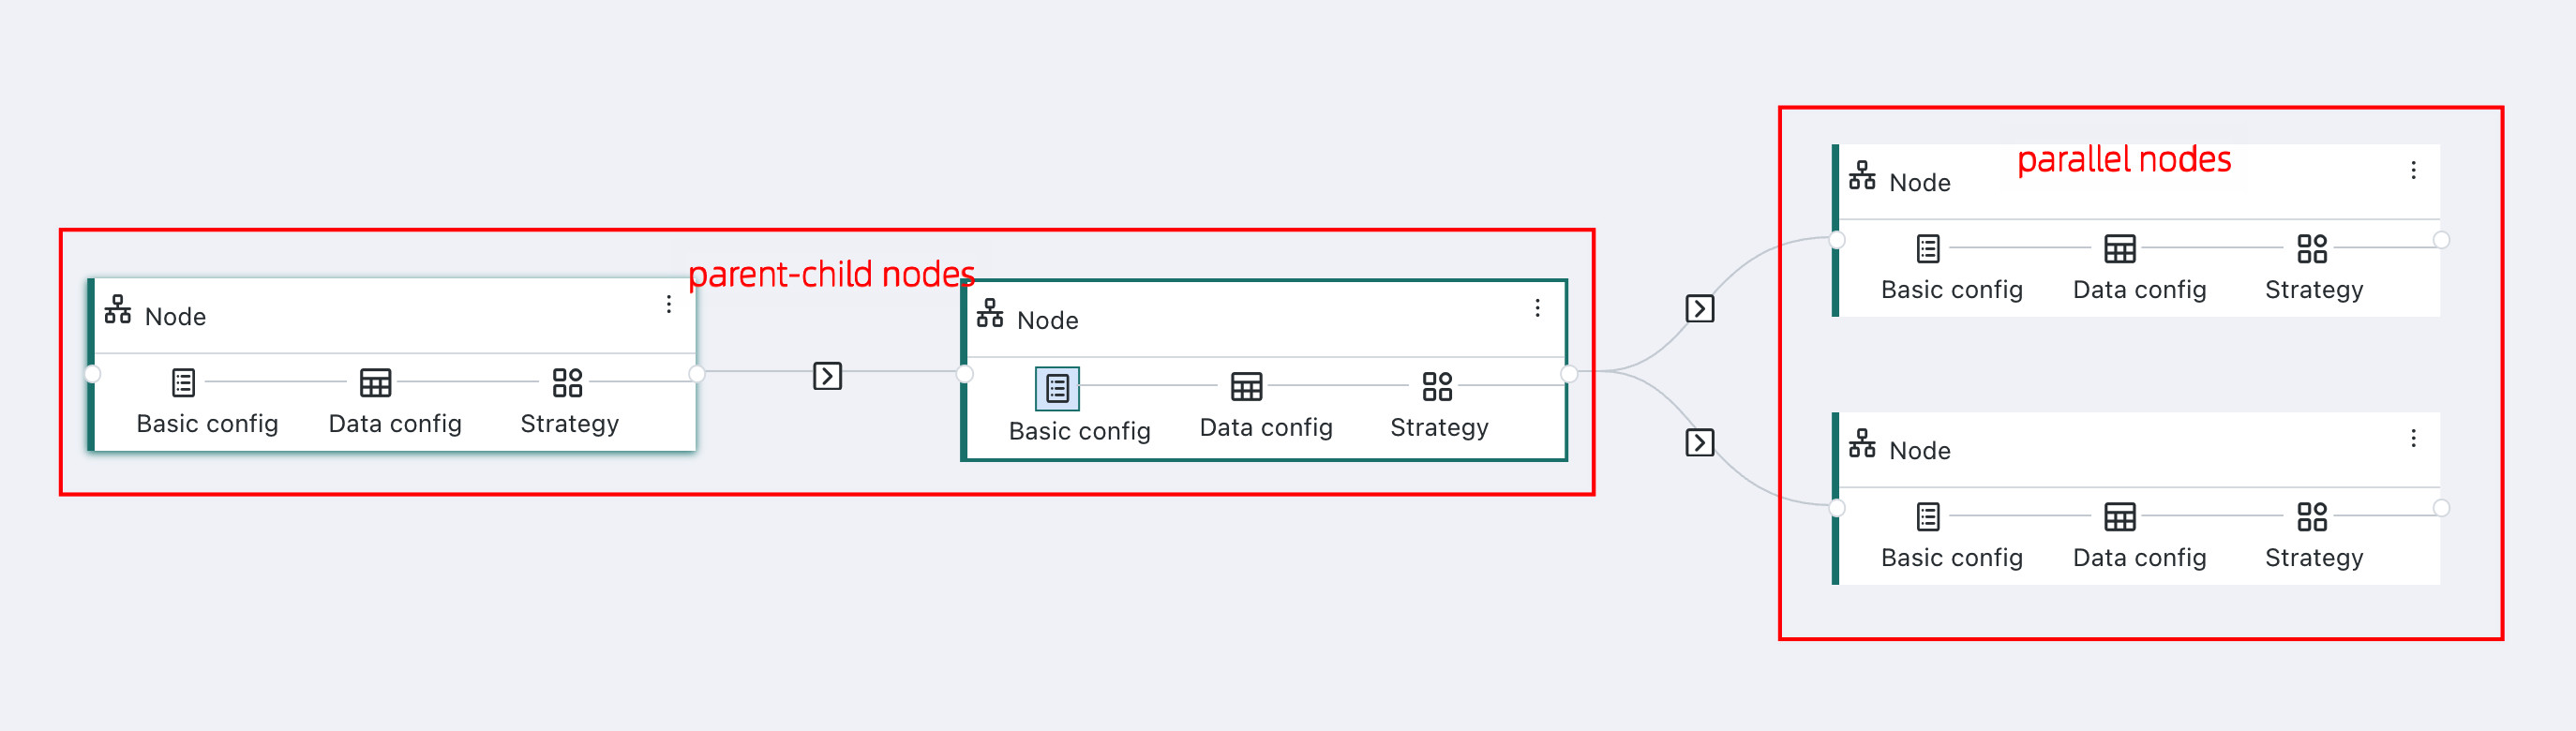
Node Types
Currently, two types are supported: parallel nodes and parent-child nodes. Parallel nodes will be marked with serial numbers before their summary content, and indentation is consistent; parent-child nodes have dimension and filter inheritance logic, and content has progressive (drill-down) logic.
Node Operations
-
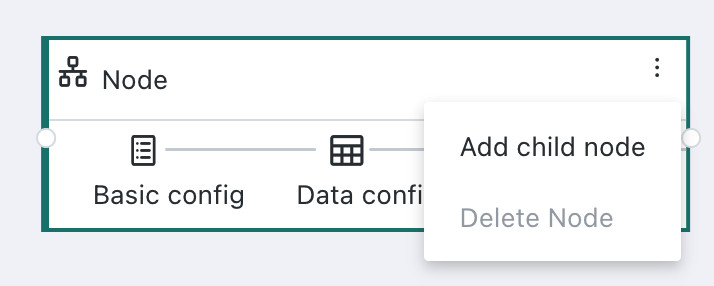
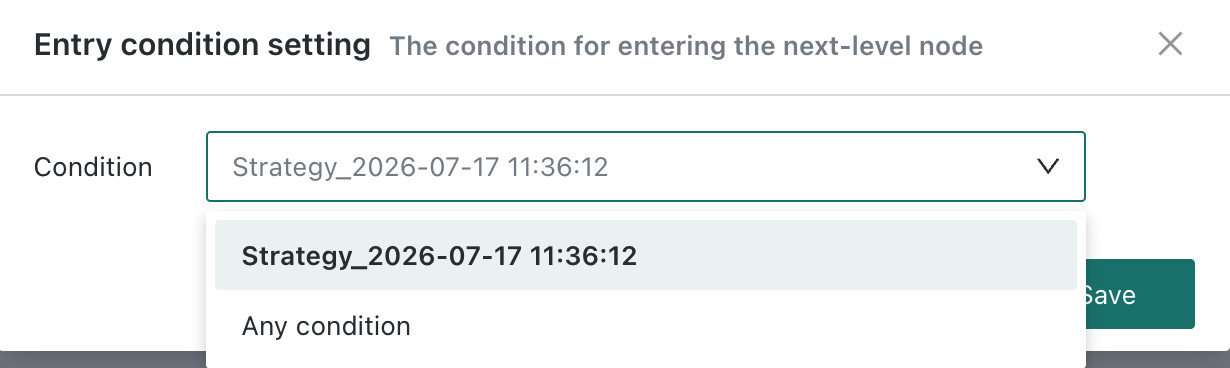
Create Child Node: After clicking create child node, you need to select the entry condition, that is, what conditions must be met to enter this node. The available conditions are consistent with one of the judgment conditions of the previous node's Rule Insight strategy. When selecting "Any Condition", it means that when any condition is met, the subsequent report generation logic is entered.
Child nodes default to using the same dataset as the previous node, which can be replaced later on the node editing page; child node strategies also default to copying the previous node's strategy, which can be deleted or adjusted as needed.
 `
`
-
Delete Node: Deleting this node will delete all subsequent nodes. Operate with caution.
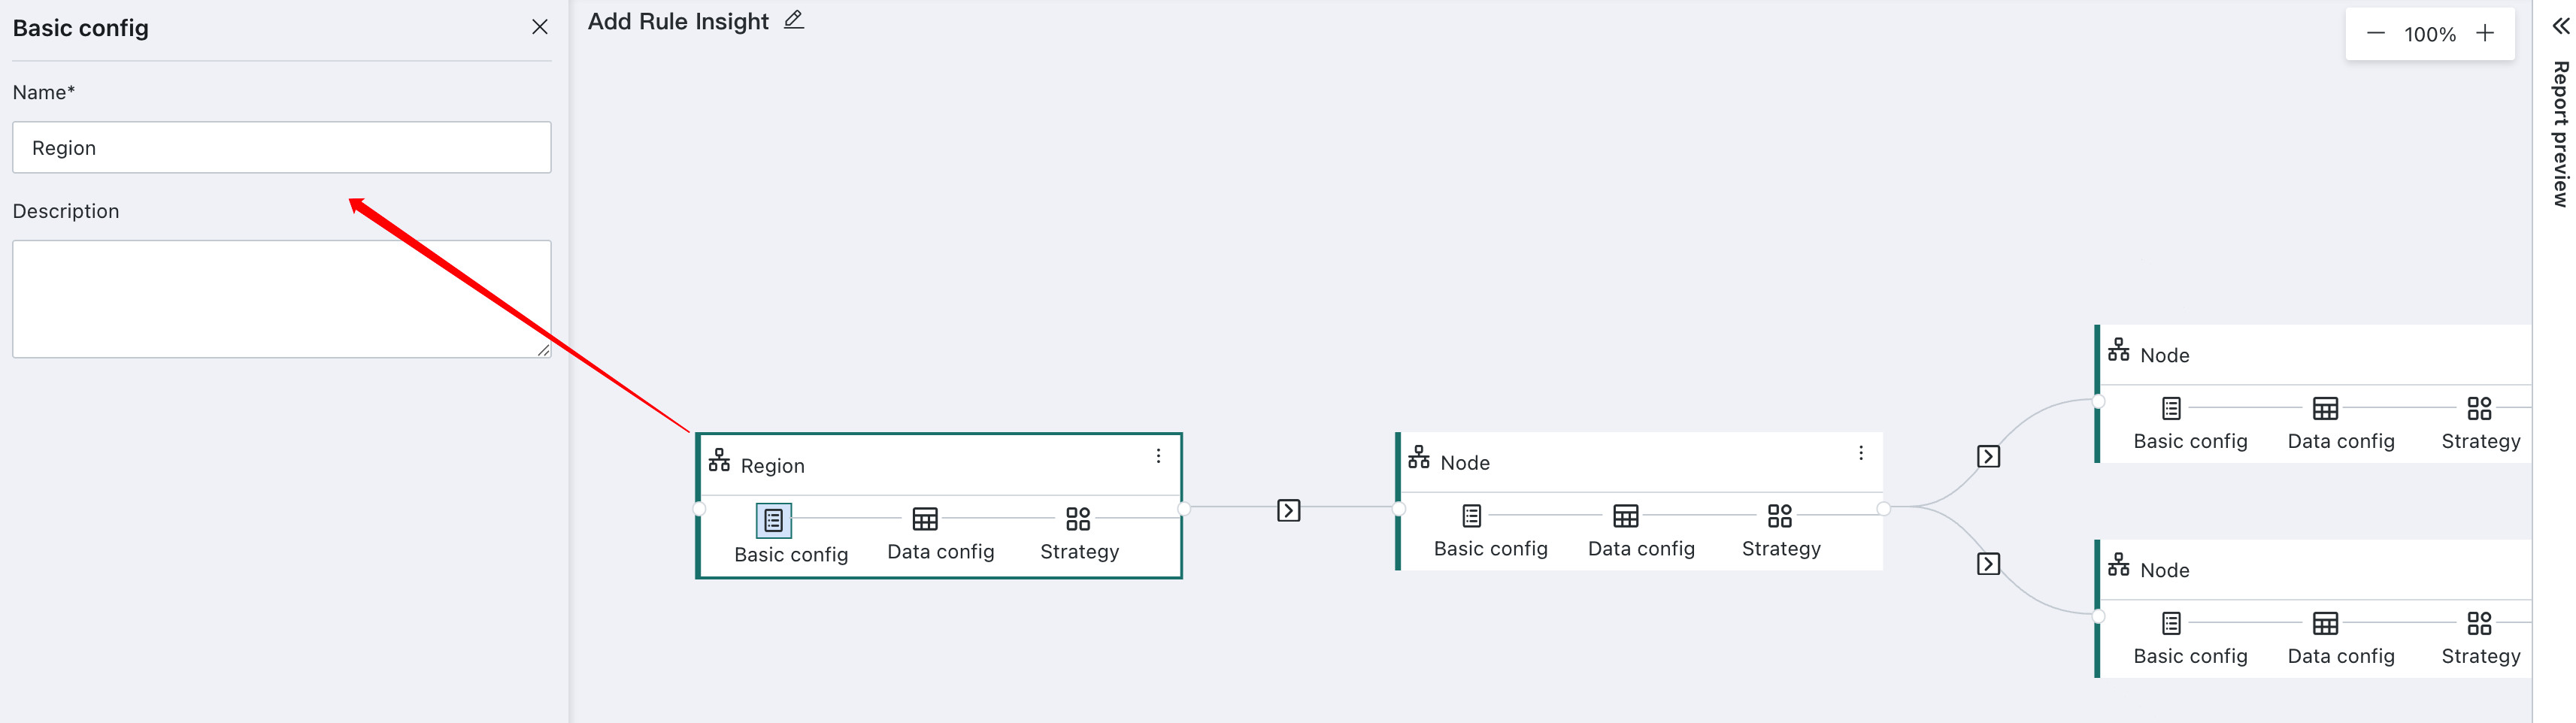
Node Configuration
Basic Configuration
Supports setting node name and node description. This information is not reflected in the report, but only serves as auxiliary information for configuration nodes displayed to creators.
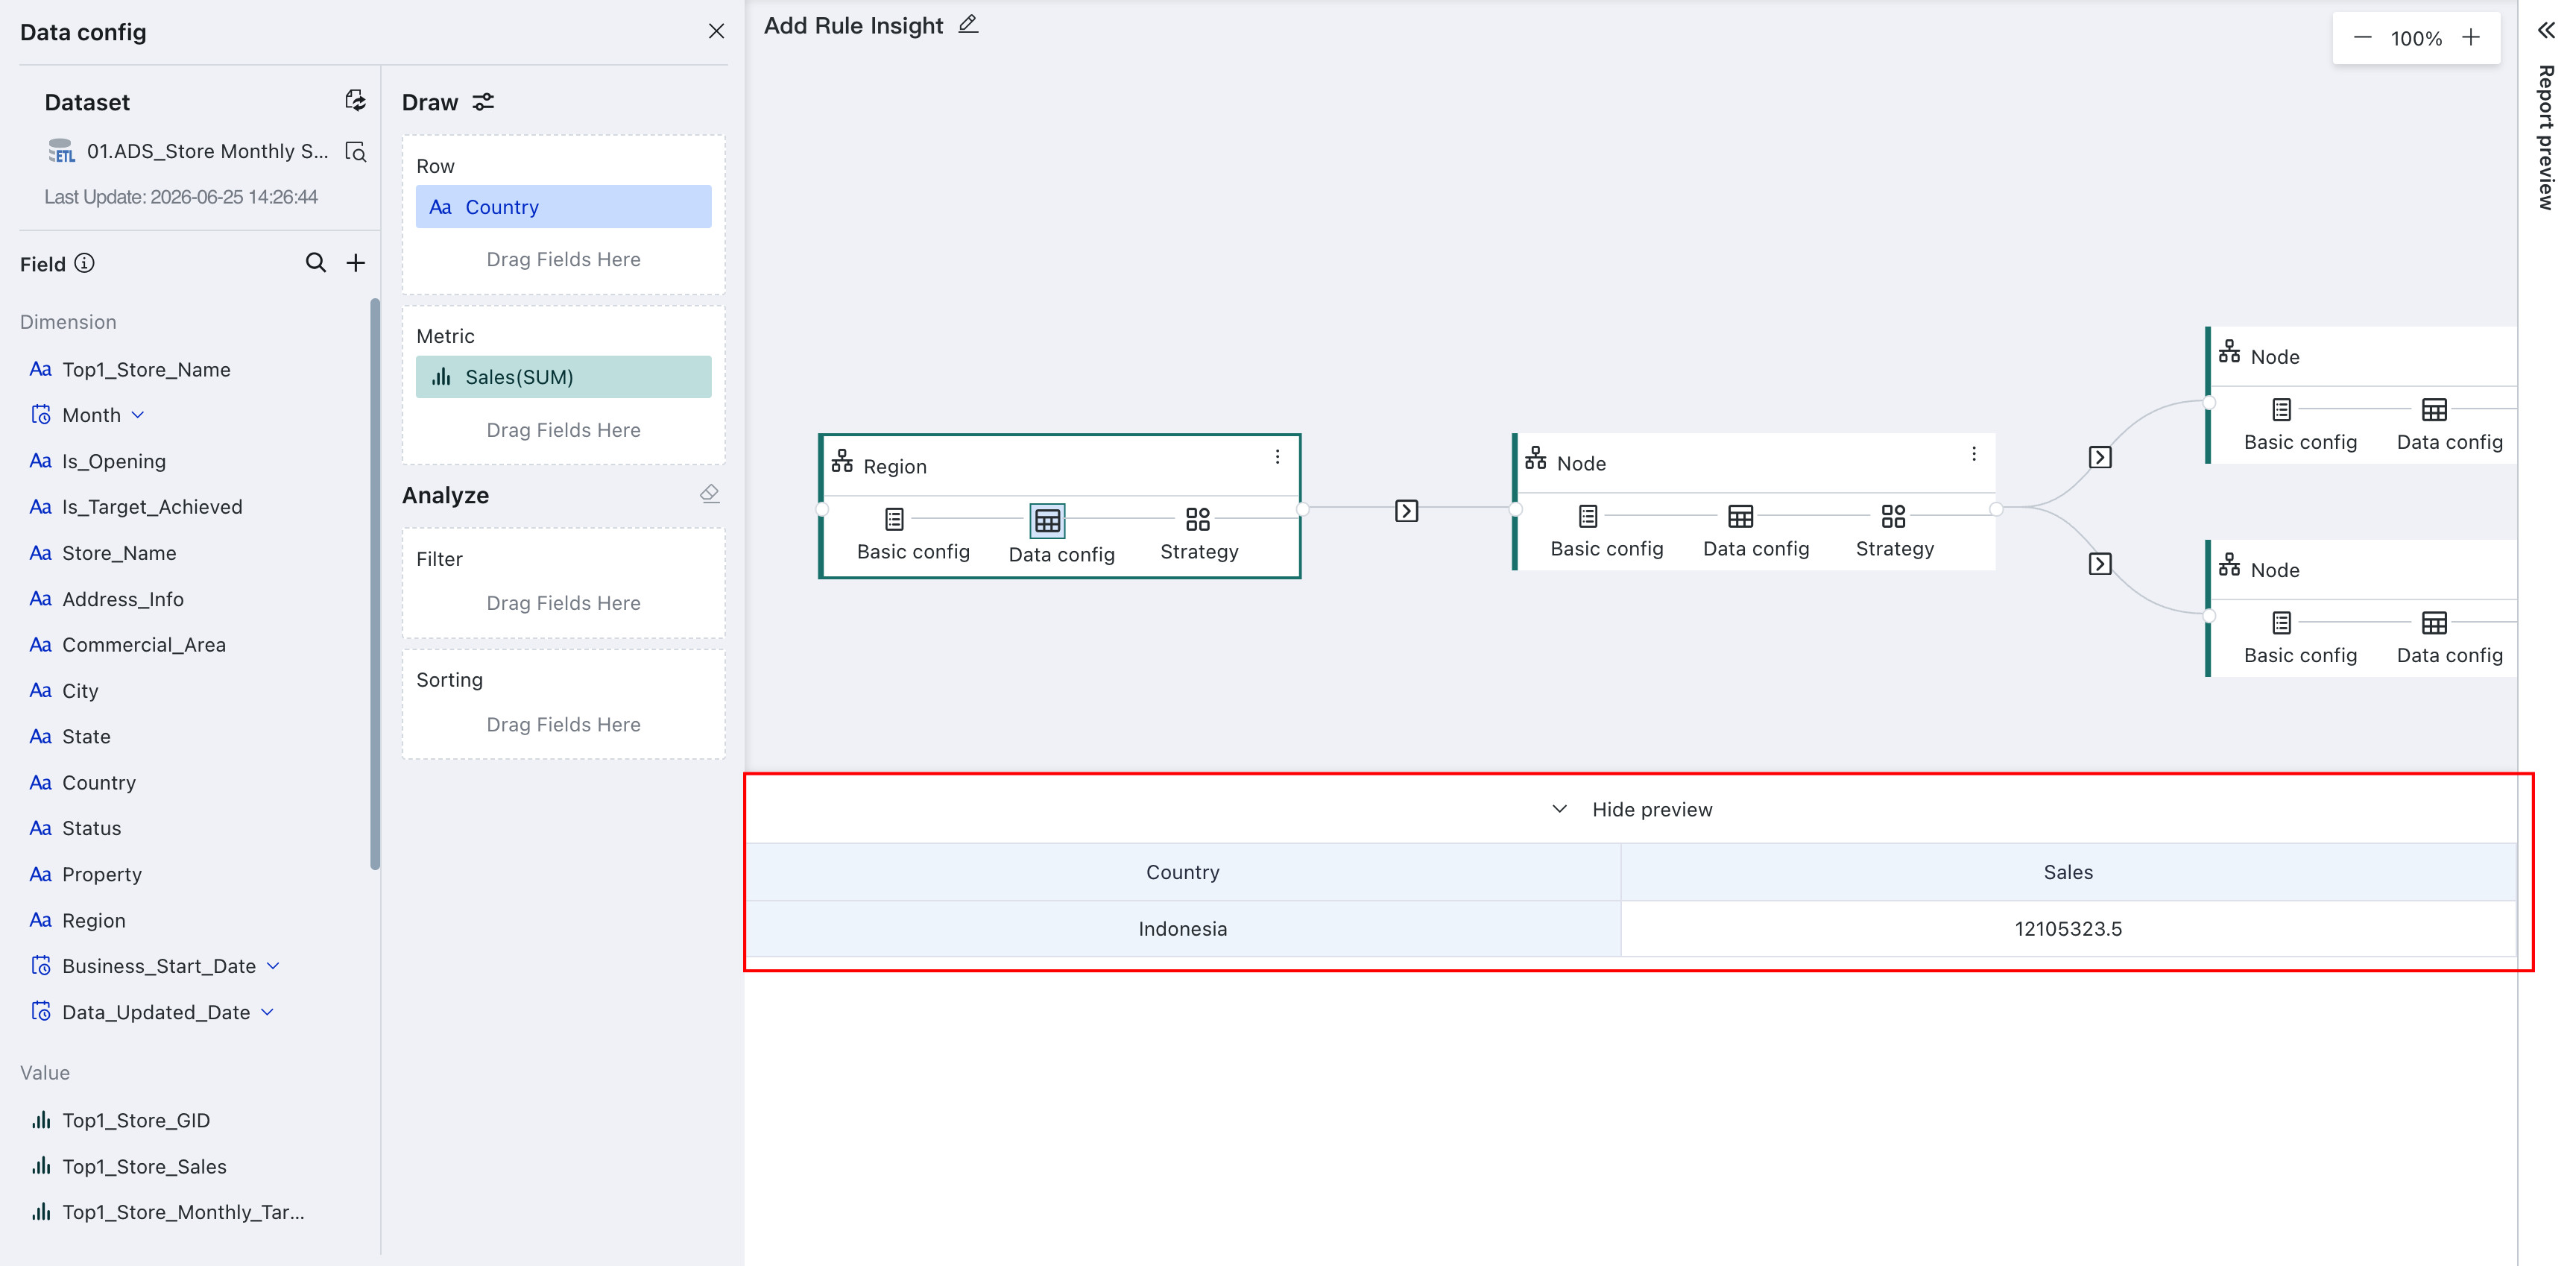
Data Configuration
This function is similar to the card editing page, supporting viewing the dataset currently used by the node, and setting dimensions, measures, filters, and sorting properties required for node analysis.
-
Dimension: Supports adding drill-down dimensions on the basis of parent node dimensions, and new fields can be set with aliases;
-
Measure: Defaults to parent node measure fields, supports adding and removing, fields can set aggregation methods, advanced calculations, data formats, aliases;
-
Filter: Supports setting filters, and will default to bringing entry conditions as filter items;
-
Sort: It is recommended to set appropriate sorting conditions to ensure report readability;
-
Conditional Format: Can configure conditional formats for dimensions and measures, and related display logic will be reflected in the report.

After completing this step of configuration, you can click "Data Preview" at the bottom of the page to view the basic data available for the report.
Insight Strategy Configuration
Judgment Condition: That is, what conditions are met for preset report content to appear in the report;
Summary Content: Title or summary statements; supports rich text, supports referencing dimension and measure parameters from data configuration. Multiple dimension values or measure values of the same dimension or measure will be displayed separated by commas, such as adding "Region", which will be displayed as "South China Region, Central China Region, North China Region". Summary content and detailed content can coexist, or only detailed content can be filled.
Detailed Content: Describes the specific situation of each dimension value; supports rich text, supports referencing dimension and measure parameters from data configuration. This part of the content will be displayed in separate lines in a loop (the number of loops depends on the number of rows specified by the strategy), such as adding "Region", which will display:
South China Region ...
Central China Region ...
North China Region ...
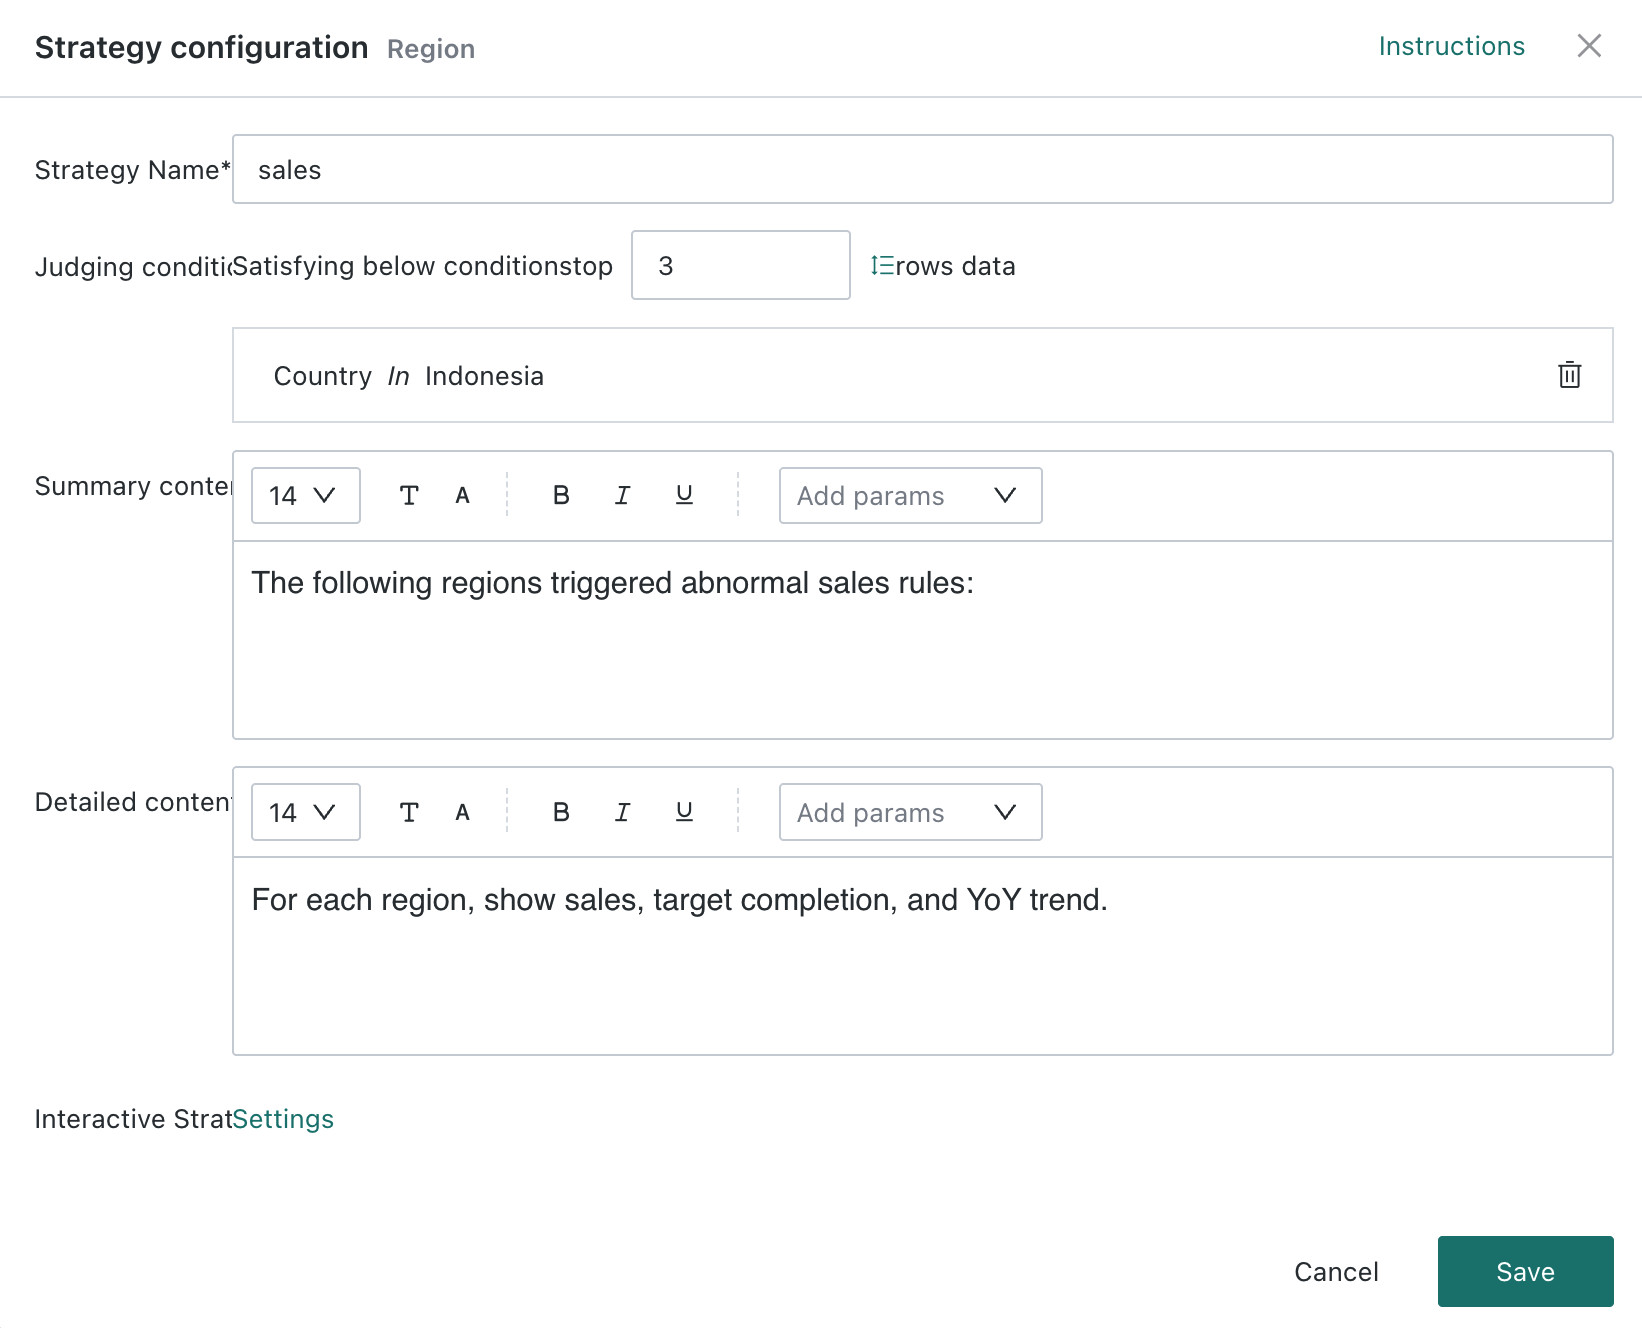
Interactive Insight: Supports jump configuration for data in detailed content. The configuration process is consistent with the jump function of dashboard cards. Based on this function, you can further insight into specific dimension values (such as South China Region) from another dimension, such as insight into trends by time range, or insight into the changing relationships between indicators through DuPont analysis.
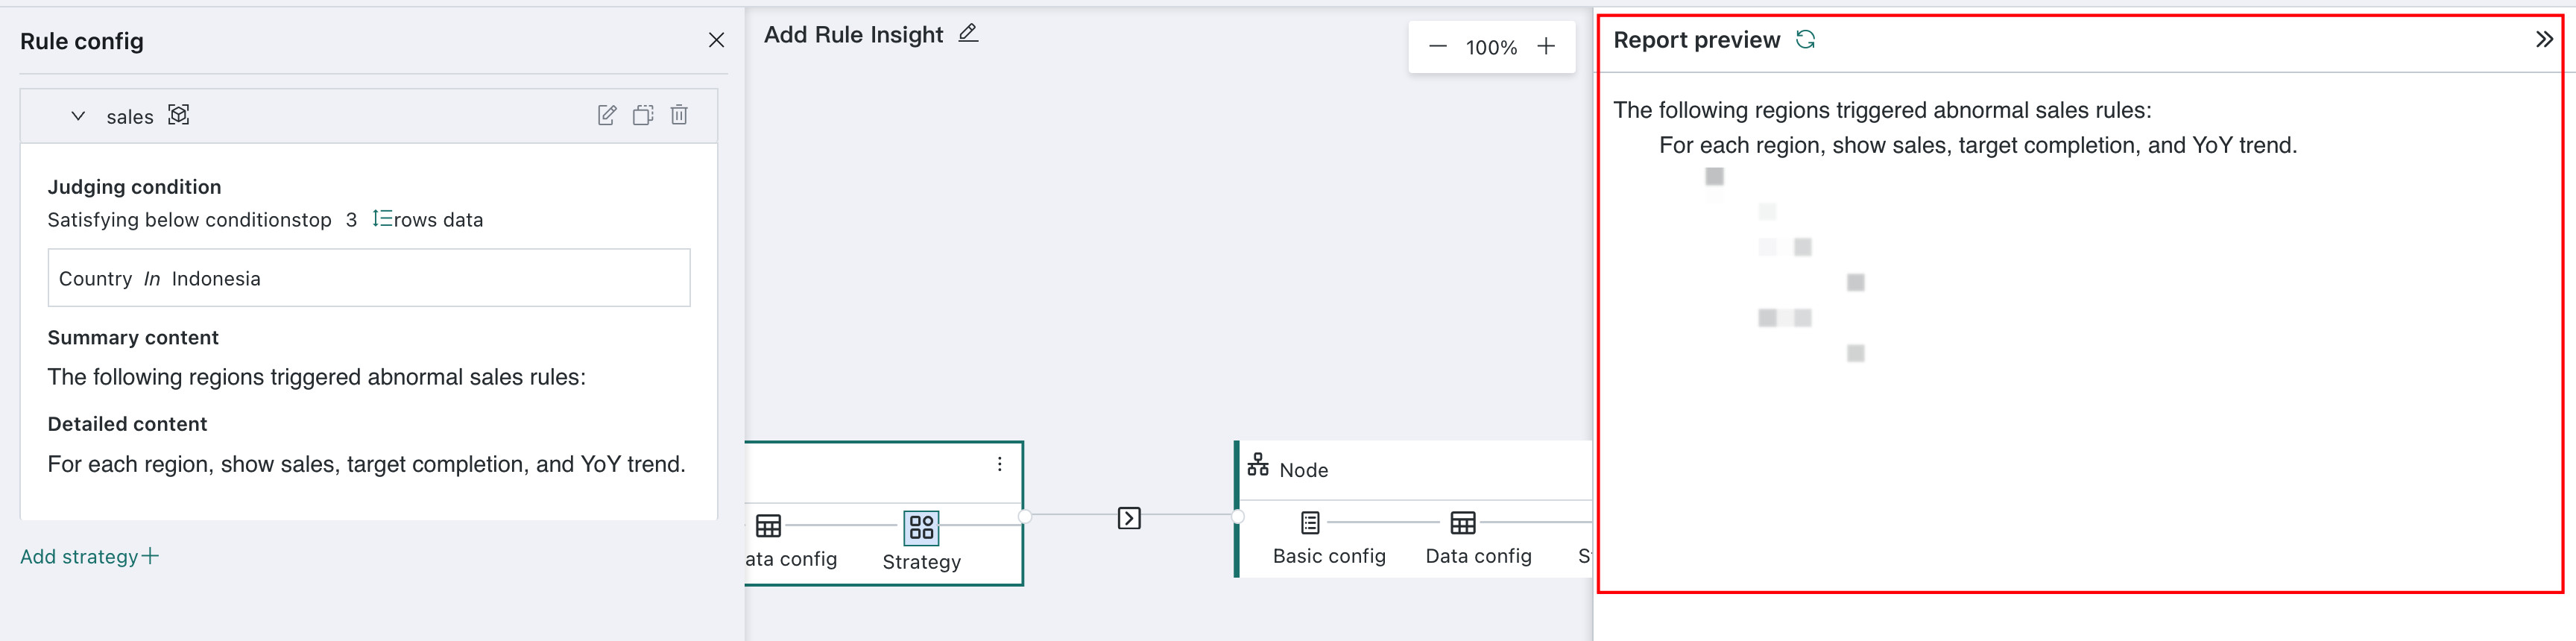
Report Preview
After completing the configuration of several nodes, if you need to view the report effect, you can click the report preview on the right to preview the current report.
If you find areas that need adjustment, you can hover over that line and click the "Settings" button displayed on hover to jump to the corresponding configuration node for adjustment.
FAQ
How to Set Linkage with Filters?
Consistent with other card operations, create a new filter on the page with Rule Insight cards, and select the associated Rule Insight card to use.
When creating cards that need to be linked by filters, you can first drag the corresponding fields into the filter box in data configuration. After being linked by the filter later, when there is a conflict between the filter and the filter box, the filter parameter will be prioritized.